Article

Influence of Blue-Green and Grey Infrastructure Combinations on Natural and Human-Derived Capital in Urban Drainage Planning

Institute for Infrastructure and Environment, School of Energy, GeoScience, Infrastructure and Society, Heriot-Watt University, Edinburgh EH14 4AS, UK
*
Author to whom correspondence should be addressed.
Sustainability 2021, 13(5), 2571; https://doi.org/10.3390/su13052571
Submission received: 30 January 2021 / Revised: 22 February 2021 / Accepted: 23 February 2021 / Published: 27 February 2021
(This article belongs to the Special Issue Management Approaches to Improve Sustainability in Urban Systems)

Abstract

:
The natural capital and ecosystem services concepts describe the multiple benefits people get from nature. Urbanisation has been identified as one of the key factors influencing the decline of natural capital globally. Urbanisation has also been associated with a recent increase in urban flooding incidents in most cities globally. While the understanding of blue-green infrastructure in urban drainage is well established, little is said about its influence on natural capital. This study utilises the Natural Capital Planning Tool, Benefits Evaluation of Sustainable Drainage Systems tool and expert stakeholder interviews to assess the influence of blue-green and grey infrastructure as adaptation pathways in urban drainage, on natural capital and ecosystem services, and to determine how these contribute to other forms of human-derived capital. Key findings show that blue-green options can enhance natural capital and ecosystem services such as amenity value while also contributing to social and human capital. Although the assessed blue-green options contribute to regulating ecosystem services such as floods regulation, their most significant contribution is in cultural ecosystem services, especially amenity value. It is concluded that incorporating blue-green infrastructure in urban drainage adaptive approaches can mitigate natural capital losses and contribute to other forms of capital crucial for human well-being.

1. Introduction

Estimates show that by 2050, people living in urban areas are likely to account for 66% of the world population [1], as urbanisation is expected to increase worldwide. Increased urban development promotes increased surface runoff, reduced infiltration and evapotranspiration due to the establishment and construction of large areas of impervious surfaces and pavements [2,3]. Increased urban flooding incidents are now one of the common environmental challenges in many cities across the globe [4,5,6], and this, exacerbated by climate change, is expected to increase in most places. Given the rapidly changing situation, there is a need to understand future uncertainties related to urban flooding and climate change while meeting the needs of the growing urban population [7]. This calls for approaches that contribute towards sustainable urban planning and development to cater for the urban development needs, while also addressing emerging environmental challenges such as urban flooding and combined sewer overflows (CSO).
Blue-green infrastructure (BGI), also known as nature-based solutions, has gained interest in the recent past in urban planning and development [8,9,10,11], as it has significant potential in the urban drainage domain to manage flood risk, CSOs and mitigate climate change impacts. BGI is defined as “an interconnected network of natural and designed landscape components that may include ephemeral, intermittent and perennial water bodies, and open, green spaces which provide multiple functions such as water storage, flood control and water purification and many others” [12]. Examples of BGI include green roofs, road swales, bioretention systems, rain gardens, ponds, street trees and urban wetlands, among others.
BGI improves infiltration and evapotranspiration rates while promoting water harvesting/retention to delay or prevent surface runoff [9,13]. At the same time, BGI delivers a multitude of other benefits (ecosystem services), such as water quality improvement, air quality improvement, carbon sequestration, recreational activities, urban cooling, noise pollution reduction, biodiversity increase and amenity value [12,14,15,16,17]. Such multiple benefits are an important contribution to human well-being among urban dwellers [18,19]. As such, BGI is often promoted for its multifunctionality potential compared to grey infrastructure [20,21]. The contribution of BGI and associated multiple benefits towards urban sustainability and resilience is widely acknowledged [22,23,24].
Urban development and its processes that involve the conversion of natural assets/ecosystems into urban landscapes are regarded as a threat to natural capital and ecosystem functions [2]. Both global and national trends show that natural capital has been on the decline due to human influenced land use changes such as urbanisation and natural resource depletion [22,25,26]. It is increasingly recognised that BGI can at least mitigate these impacts, as it is considered as a network of natural capital (assets) in urban areas delivering a range of ecosystem services [4,20,27]. Natural capital refers to the stock of natural features/assets (e.g., freshwater, habitats, land, soil, air, biodiversity and processes) which together provide the foundation for the flows of ecosystem services [26,28]. Both natural capital and other forms of capital (manufactured, human, social and financial) are required to produce flows of ecosystem services [25,29]. Although ecosystem services knowledge is already in use in urban planning, especially with regards to the multiple benefits achievable from BGI, there is still need for natural capital assessments at relevant scales and contexts to inform planning decisions [18].
Natural capital and ecosystem services are becoming integral to the planning for sustainable urban development [11,30]. It is increasingly being acknowledged that natural capital and ecosystem services need to be integrated in urban development (e.g., the UK National Planning Policy Framework (2019) points to the need for planning systems to contribute to and enhance the natural and local environment by “recognising the wider benefits of natural capital and ecosystem services”). Similarly, DEFRA (2020) has published practical guidance and a suite of other resources to enable a natural capital approach and support its inclusion as an analytical tool to considering/thinking about nature [31] and how local authorities, developers and communities can apply this philosophy in urban planning. The Sustainable Development Goals (SDG) further support the natural capital thinking, with SDG 11 (Sustainable cities), SDG 3 (Good Health and well-being), SDG 6 (Clean Water), SDG 13 (Climate action), SDG 14 (life below water) and SDG 15 (life on land) all relating to natural capital as an integral element to achieving these goals.
In attempts to adapt urban areas to climate change and address urban flooding challenges, adaptive approaches for the implementation of competing blue-green drainage infrastructure options are gaining interest [32]. Blue-green infrastructure options can be viewed as adaptation actions to increase urban resilience [33] to external pressures related to both human and environmental pressures such as climate change. The adaptation pathways approach focuses on exploring and sequencing a set of possible actions based on external developments, e.g., climate change over time [34]. In urban drainage such an adaptation approach involves considering different combinations of blue-green infrastructure options and tipping points that trigger the need for the next set of actions to be implemented as influenced by climate change or future development scenarios [32]. Blue-green infrastructure options tend to be flexible and adaptable, whilst grey infrastructure tends to be more rigid in design and not adaptable in an uncertain future [35]. This implies that blue-green infrastructure interventions can serve as possible adaptation options and contribute towards enhancing urban resilience to climate change [12,15,27]. Such blue-green infrastructure options comprise natural capital assets that provide ecosystem services as they are being implemented. This implies that the use of the blue-green infrastructure adaptation pathways approach interfaces with the work of practitioners developing and implementing long-term natural capital plans. Natural capital interacts together with the so-called human-derived capital, i.e., built, financial, human and social capital to contribute to human well-being [25].
Although the understanding of blue-green infrastructure is well established [36], little is said about its influence on natural capital and other forms of human-derived capital in urban areas [25]. This is important, as they are key to human well-being [37]. The aim of this study is, therefore, to assess the influence of different blue-green and grey infrastructure combinations as adaptation pathways for urban drainage infrastructure on natural capital and associated ecosystem services over time and how these contribute to other forms of capital, i.e., social, human, financial and manufactured.

2. Materials and Methods

2.1. Study Area

The study area is primarily a residential area in a South London Borough, where increased urban development has led to the existing surface water drainage network reaching its capacity and extreme storm events have caused local flooding incidents [38]. Figure 1 shows the sub catchment under study. The sub catchment covers an area of approximately 97 ha. The sub catchment shown in the figure below is divided into five drainage areas upstream and downstream of major junctions in the sewer system, as modelled by Kapetas and Fenner [32] as part of the “Achieving Urban Flood Resilience in an Uncertain Future” research project, of which this study is also a part. Flooding is observed at the downstream sections of the sub catchment, upstream of the outfall to a local river (drainage area 5).

Natural Capital Assets (Broad Habitats) in the Study Area

As shown in Figure 1 and Figure 2, the sub catchment under study is mainly a residential area occupied by buildings (20% of the total area) and manmade features such as roads (24%). A significant area is occupied by private gardens (48%) within the curtilages of residential properties. The main natural capital asset is amenity grassland (i.e., parks, sports fields and playgrounds), occupying 7% of the total area. Such green open spaces contribute towards recreational activities and air quality regulation.

2.2. Blue-Green Infrastructure Options Assessed in this Study

Three blue-green and grey infrastructure combinations were assessed in this study. These were the blue-green infrastructure adaptation pathways to high (representative concentration pathway (RCP) 8.5) and central (RCP 4.5) emissions climate change scenarios developed by Kapetas and Fenner [32]. In brief, the adaptation framework for urban drainage infrastructure proposed in the parallel study by Kapetas and Fenner [32] seeks to address how blue-green and grey infrastructure can be integrated in rapid changing urban environments to help practitioners and policy makers compare which options to implement, as well as when, where and why and how these options can be combined as different adaptation pathways over time to address current flooding incidents and future climate, up to 2070. The local authority in the study area is considering the integration of blue-green infrastructure options with existing grey infrastructure to reduce the flood risk while also delivering a “natural capital uplift”. The local authority is also considering the development of SuDS on Streets (as a policy of Transport for London [39]). It is also interested in improving air quality, as parts of wider local surroundings comprise Air Quality Management Areas (AQMA) [40].
The work presented in this paper focusses on the natural capital assessment of key adaptation pathways developed by [32]. This study selected three blue-green and grey infrastructure adaptation pathways for a natural capital assessment. Selected blue-green infrastructure options were a deliberate mix of different blue-green and grey infrastructure combinations, outlined below:
  • Adaptation Pathway 1 (AP1)—Bioretention cells gradually implemented overtime (between year 2020 and 2050) (green infrastructure option).
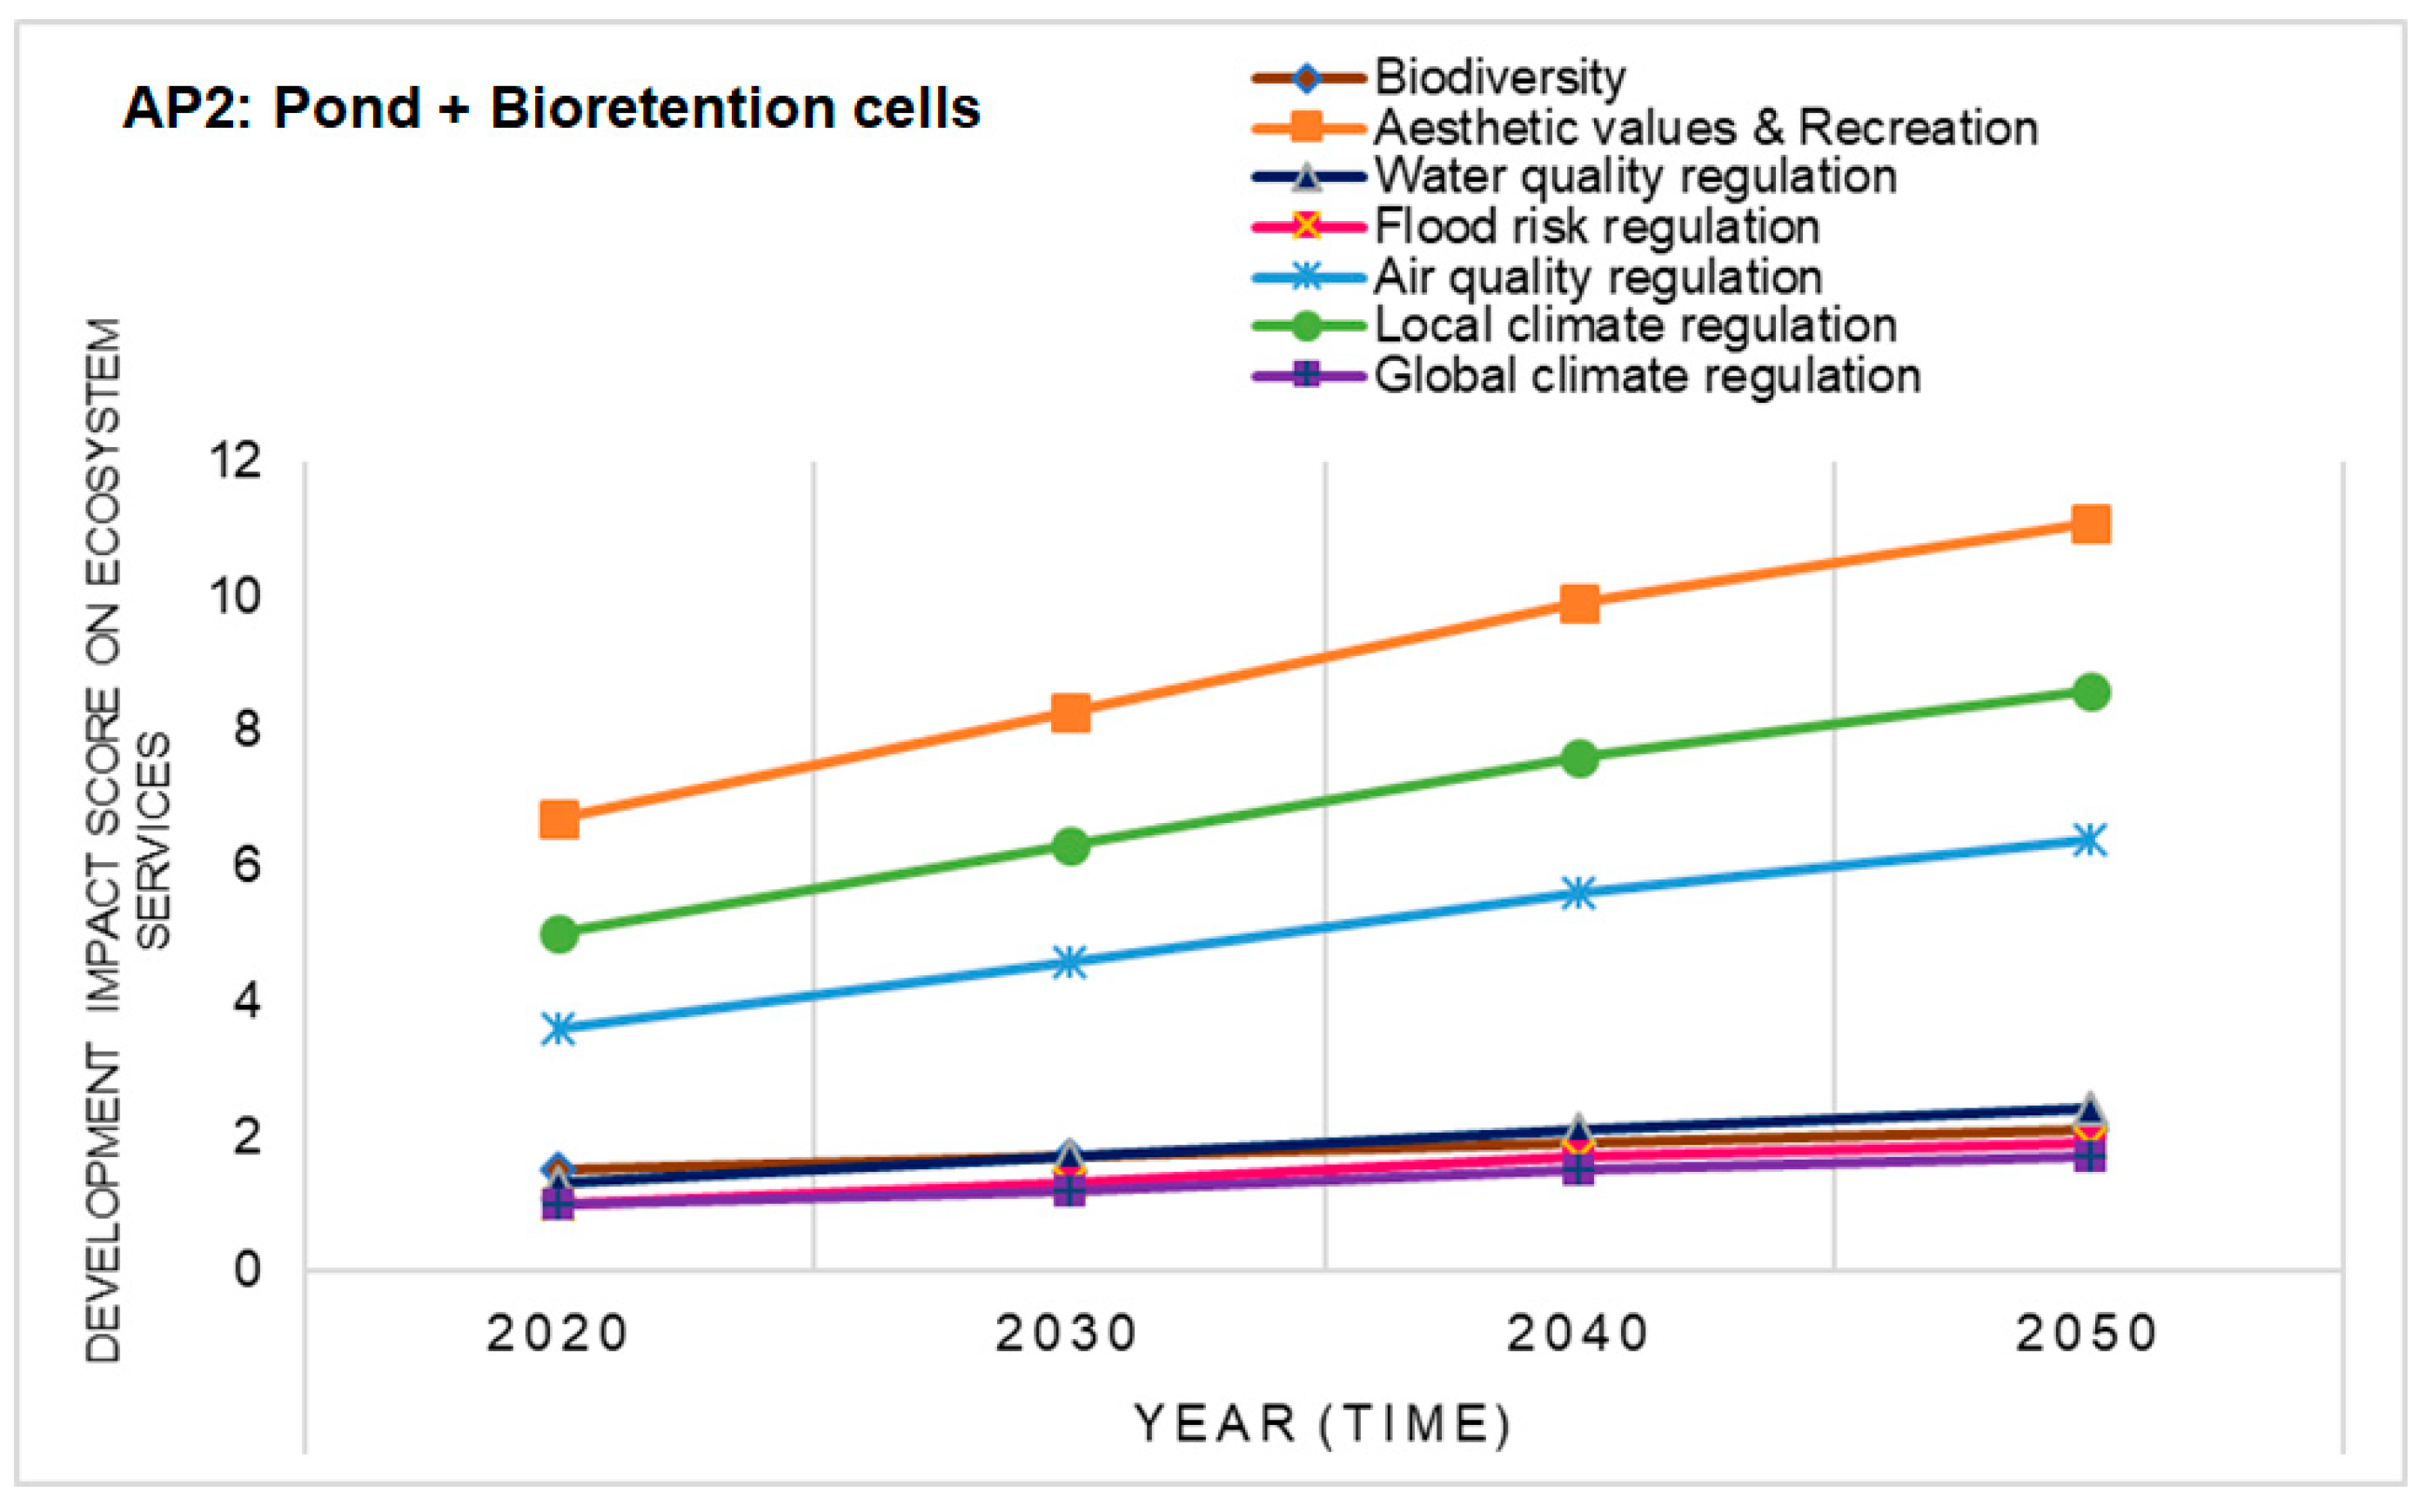
  • Adaptation Pathway 2 (AP2)—A retention pond implemented immediately (year 2020) in part of the sub catchment, while bioretention cells are implemented gradually in the rest of the sub catchment up to year 2050 (blue-green infrastructure option).
  • Adaptation Pathway 3 (AP3)—Pipe system upgrade/expansion implemented immediately (2020) with supplementary bioretention cells implemented gradually in the rest of the sub catchment up to year 2050 (green and grey infrastructure option).
Figure 3 shows the spatial spread of the blue-green and grey infrastructure options in the study area. Since bioretention cells are proposed to be gradually implemented over time, the different line colours for the bioretention cells indicate the time period over which these can be implemented in each drainage area. The hypothetically proposed location of the retention pond is on drainage area 1, while a pipe upsize will cut across drainage area 4 through to drainage area 5. As explained by [32], the delineation of the drainage areas is based on the major junctions in the sewer system and the criticality of the junctions under current and future flood risk in the sub catchment.

2.3. Methods and Tools Used

2.3.1. Natural Capital Planning Tool

The Natural Capital Planning Tool (NCPT) is one of the tools used to assess ecosystem services [41]. This tool allows for an indicative assessment of the impact of a proposed development plan on natural capital and ecosystem services. The NCPT is spreadsheet-based and calculates the impact score for 10 selected ecosystem services, indicating the direction (positive or negative) and magnitude (impact score) for each assessed ecosystem service and an overall development impact score for all ecosystem services over 25 years post-development. Indicators are used to assess each ecosystem service using pre-defined scores, after which the values are aggregated using weights defined by experts or stakeholders to generate an ecosystem service impact score. The calculated impact scores are based on a range of indicator data such as population density, soil drainage class, size of green space sites and spatial land use information for the pre- and post-development state of an area. Land use options are based on the Joint Nature Conservation Committee (phase 1) habitat survey and classification framework. Figure 4 shows the list of ecosystem services assessed using the NCPT and an example of a NCPT scoring outcome.
As illustrated in Figure 4 (not part of the analysis), the NCPT calculates the likely impact score of the proposed development on each of the 10 ecosystem services and also the overall development impact score (in the example this is −7.83). This implies that the proposed development has a likely negative impact on ecosystem services. The tool also calculates theoretical minimum (e.g., −14.84 in the above example) and maximum (e.g., +29.34 in the above example) scores, which show the potential of the site to lose or gain natural capital and associated multiple benefits, based on a pre-development land use composition. Given the complexities and associated uncertainties in ecosystem service assessments, the NCPT outcomes are only indicative of the possible direction of change and magnitude of the impact of a proposed development on natural capital and ecosystem services [41]. The calculated impact scores can be weighed and adjusted during the assessment to suit local conditions. One of the key reasons why the assessment is performed is to improve the design of the proposed development: based on the tool impact score outcome, the proposed development design can be improved or revised to enhance multiple benefit provisions in sustainable urban development. The NCPT can be applied at different stages of the planning or development process to help improve the design along this process.

2.3.2. Benefits Evaluation of Sustainable Drainage Systems (B£ST) and Cost Estimations

The CIRIA Benefits Evaluation of Sustainable Drainage Systems (SuDS) (B£ST) tool was used to evaluate relevant multiple benefits arising from the selected blue-green infrastructure interventions and the contribution of these interventions to different forms of human-derived capitals. The tool uses a common approach to value multiple benefits (ecosystem services) but structures the outputs in two frameworks: an ecosystem services or capitals account [42]. The capital-based approach is a recent addition (2019) to the tool which reflects the growing use of the natural and other (social, financial, manufactured and human/intellectual) capitals in practice and the need to yield outputs in a “common language” which is increasingly being used.
Costs (i.e., Capital, Operational and Maintenance costs) for the selected blue-green and grey infrastructure options were estimated using: (1) the SCOTS and SUDS for Roads Whole Life cost tool (2015) and (2) unit costs from the literature, i.e., Liu et al. [43] and Swan and Stovin [44]. The SCOTS and SUDS for Roads Whole Life cost tool calculates the capital and maintenance costs for a range of SUDS features including bioretention systems and retention ponds. The capital costs of bioretention cells were estimated at £35/m2 and £55/m3 for a retention pond, and operational and maintenance costs at £1086/yr and £1727/yr for bioretention cells and retention pond, respectively. The representative capital and operational and maintenance costs for pipe upgrades were estimated at £510.73/m, adapted from Kapetas and Fenner [32] and Starkl et al. [45]. The present value costs of each adaptation pathway were compared with the net present value from the selected adaptation pathways, using the standard discount rate of 3.5% set by the treasury [42].

2.3.3. Expert Stakeholders Survey/Interviews

Prioritised ecosystem services in the study areas were elicited from expert stakeholders via a detailed online survey and follow-up telephone interviews. The main aim of the survey was to engage expert stakeholders in identifying prioritised ecosystem services in the study area as well as to assess their understanding on different blue-green infrastructure interventions. Four experts from the flood risk and planning, SUDS education and water resources protection offices within the local authority and NGOs in the study area contributed to this process

3. Results

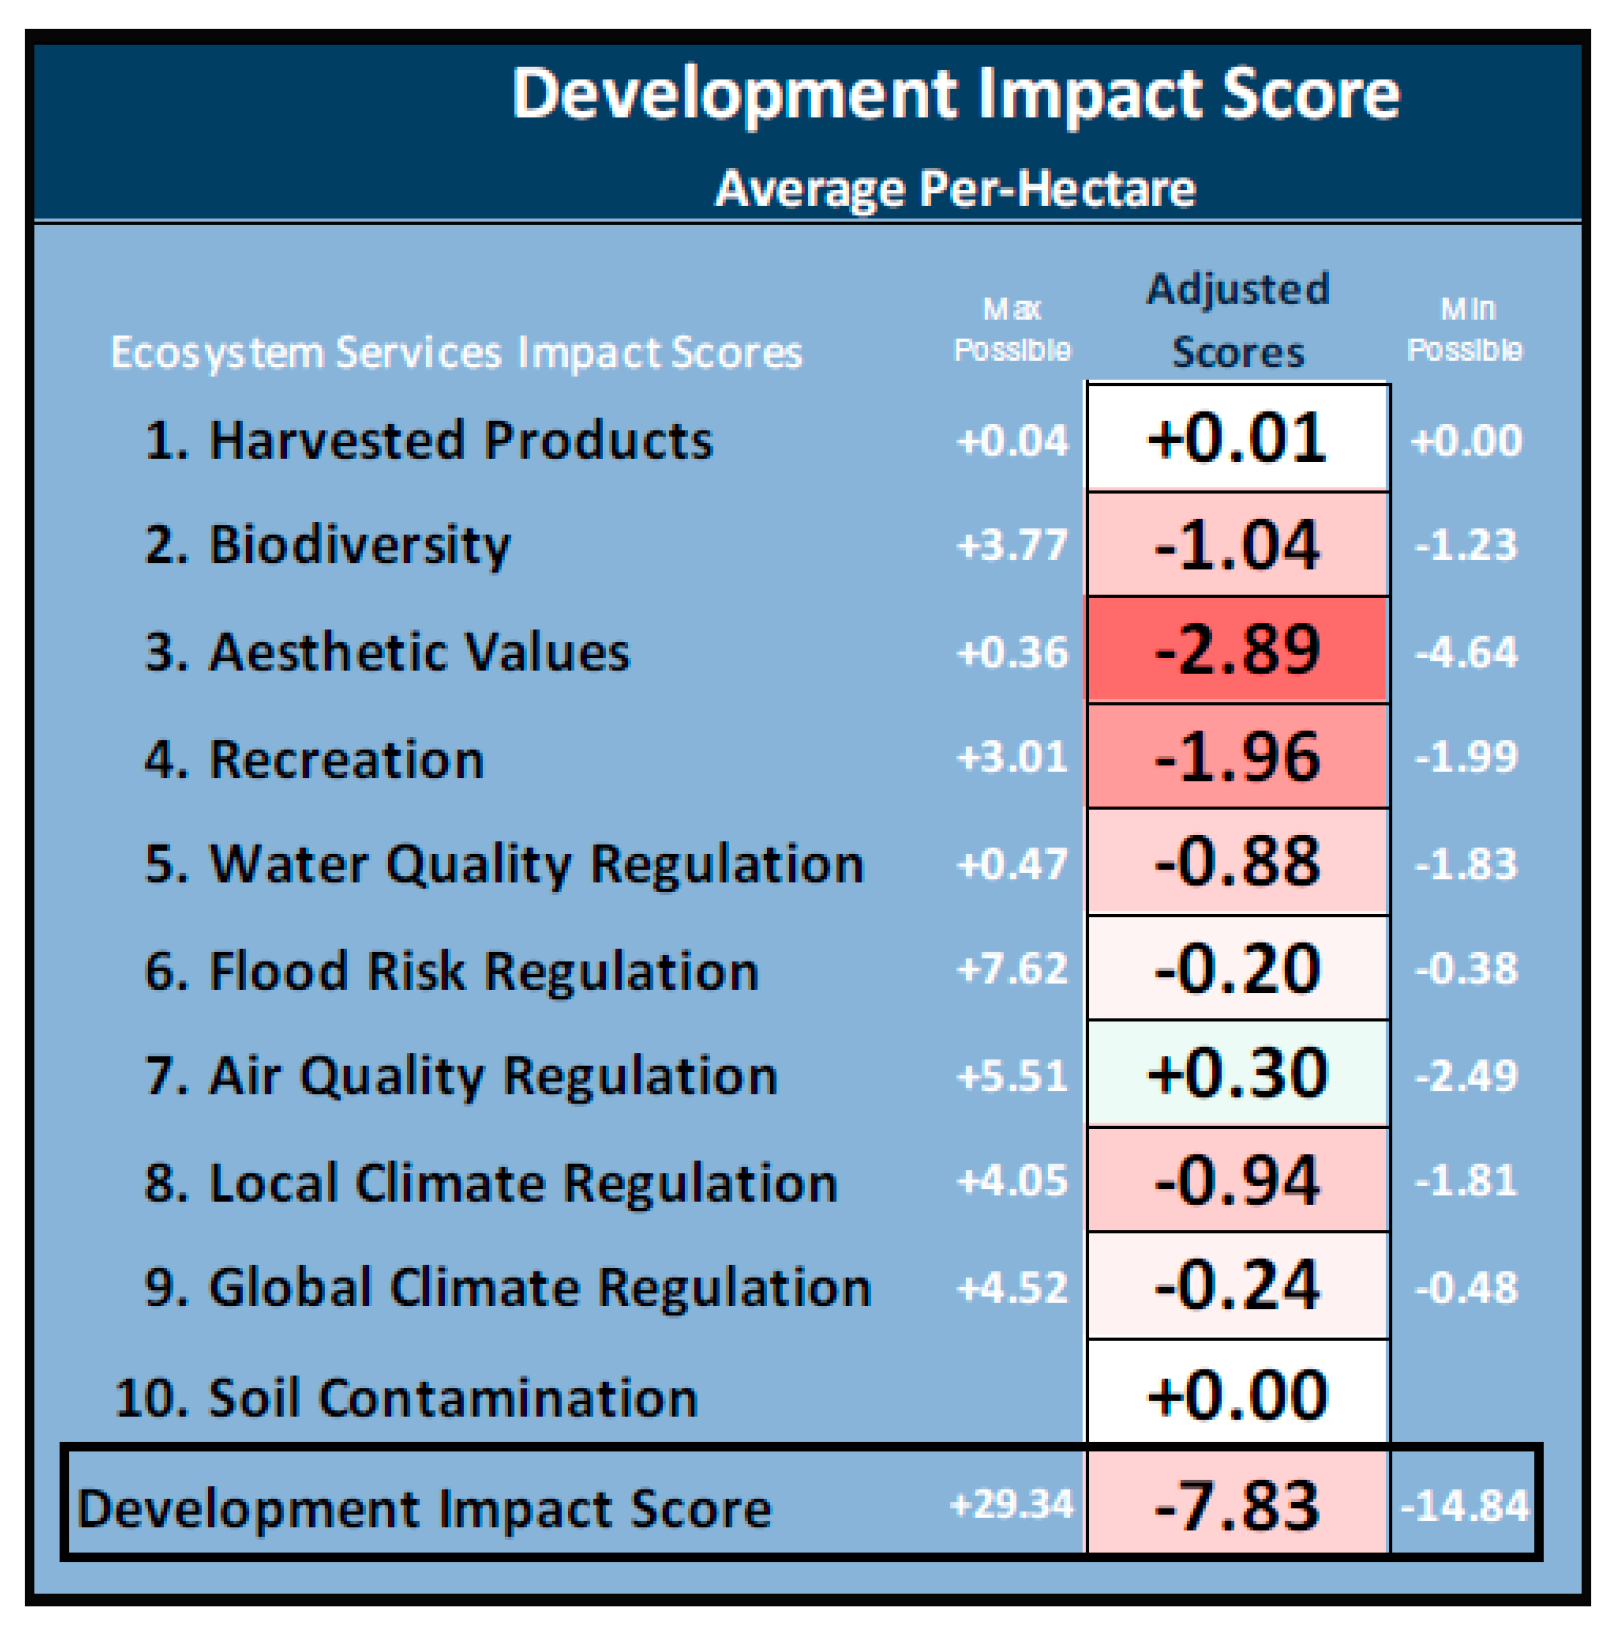
3.1. Impact of Selected Blue-Green and Grey Infrastructure Combinations on Ecosystem Service Delivery Overtime

Based on NCPT calculations, Figure 5 shows the overall development impact of the selected blue-green and grey infrastructure combinations on ecosystem service delivery. The results show that the combination of a pond and bioretention cells (AP2) has the highest development impact score on ecosystem services over time, as the impact score increases from 20 to 35 by the year 2050. This is followed by AP1, which consists of bioretention cells only, increasing the development impact score from just below 20 to 33 by the year 2050. AP3, which is a hybrid combination of “grey” pipes and bioretention cells, has the least development impact on ecosystem services, with a score of 10 in 2020 which increases to 18 by the year 2050. Overall, this shows that all combinations have a positive development impact on ecosystem services, although each of the options have varying impact scores. Refer to Supplementary Material 2 for detailed ecosystem service scores for each of the adaptation pathways, including estimated minimum and maximum theoretical scores for each of the adaptation pathways and associated ecosystem services.
Figure 6 illustrates the impact of AP2 on specific ecosystem services. The results indicate that aesthetic values, local climate regulation and air quality regulation ecosystem services are the most significant benefits from all the three intervention options (Supplementary Material 2). Biodiversity, water quality regulation, flood risk regulation and global climate regulation ecosystem services have the lowest development scores from all the intervention options. This implies that these ecosystem services (ES) are not significantly enhanced by these intervention options.
As illustrated in Figure 6, the development impact score for aesthetic values almost doubles overtime with the introduction of AP2. Such a potential increase in ecosystem services from the selected blue-green combinations is based on the understanding that these intervention options enhance various natural capital assets, such as trees, shrubs, water, soil and habitats, which together provide ecosystem services. Depending on the chosen design, bioretention cells can increase natural capital assets such as green spaces, trees and shrubs, while a pond can increase freshwater/wetland natural assets in an area.

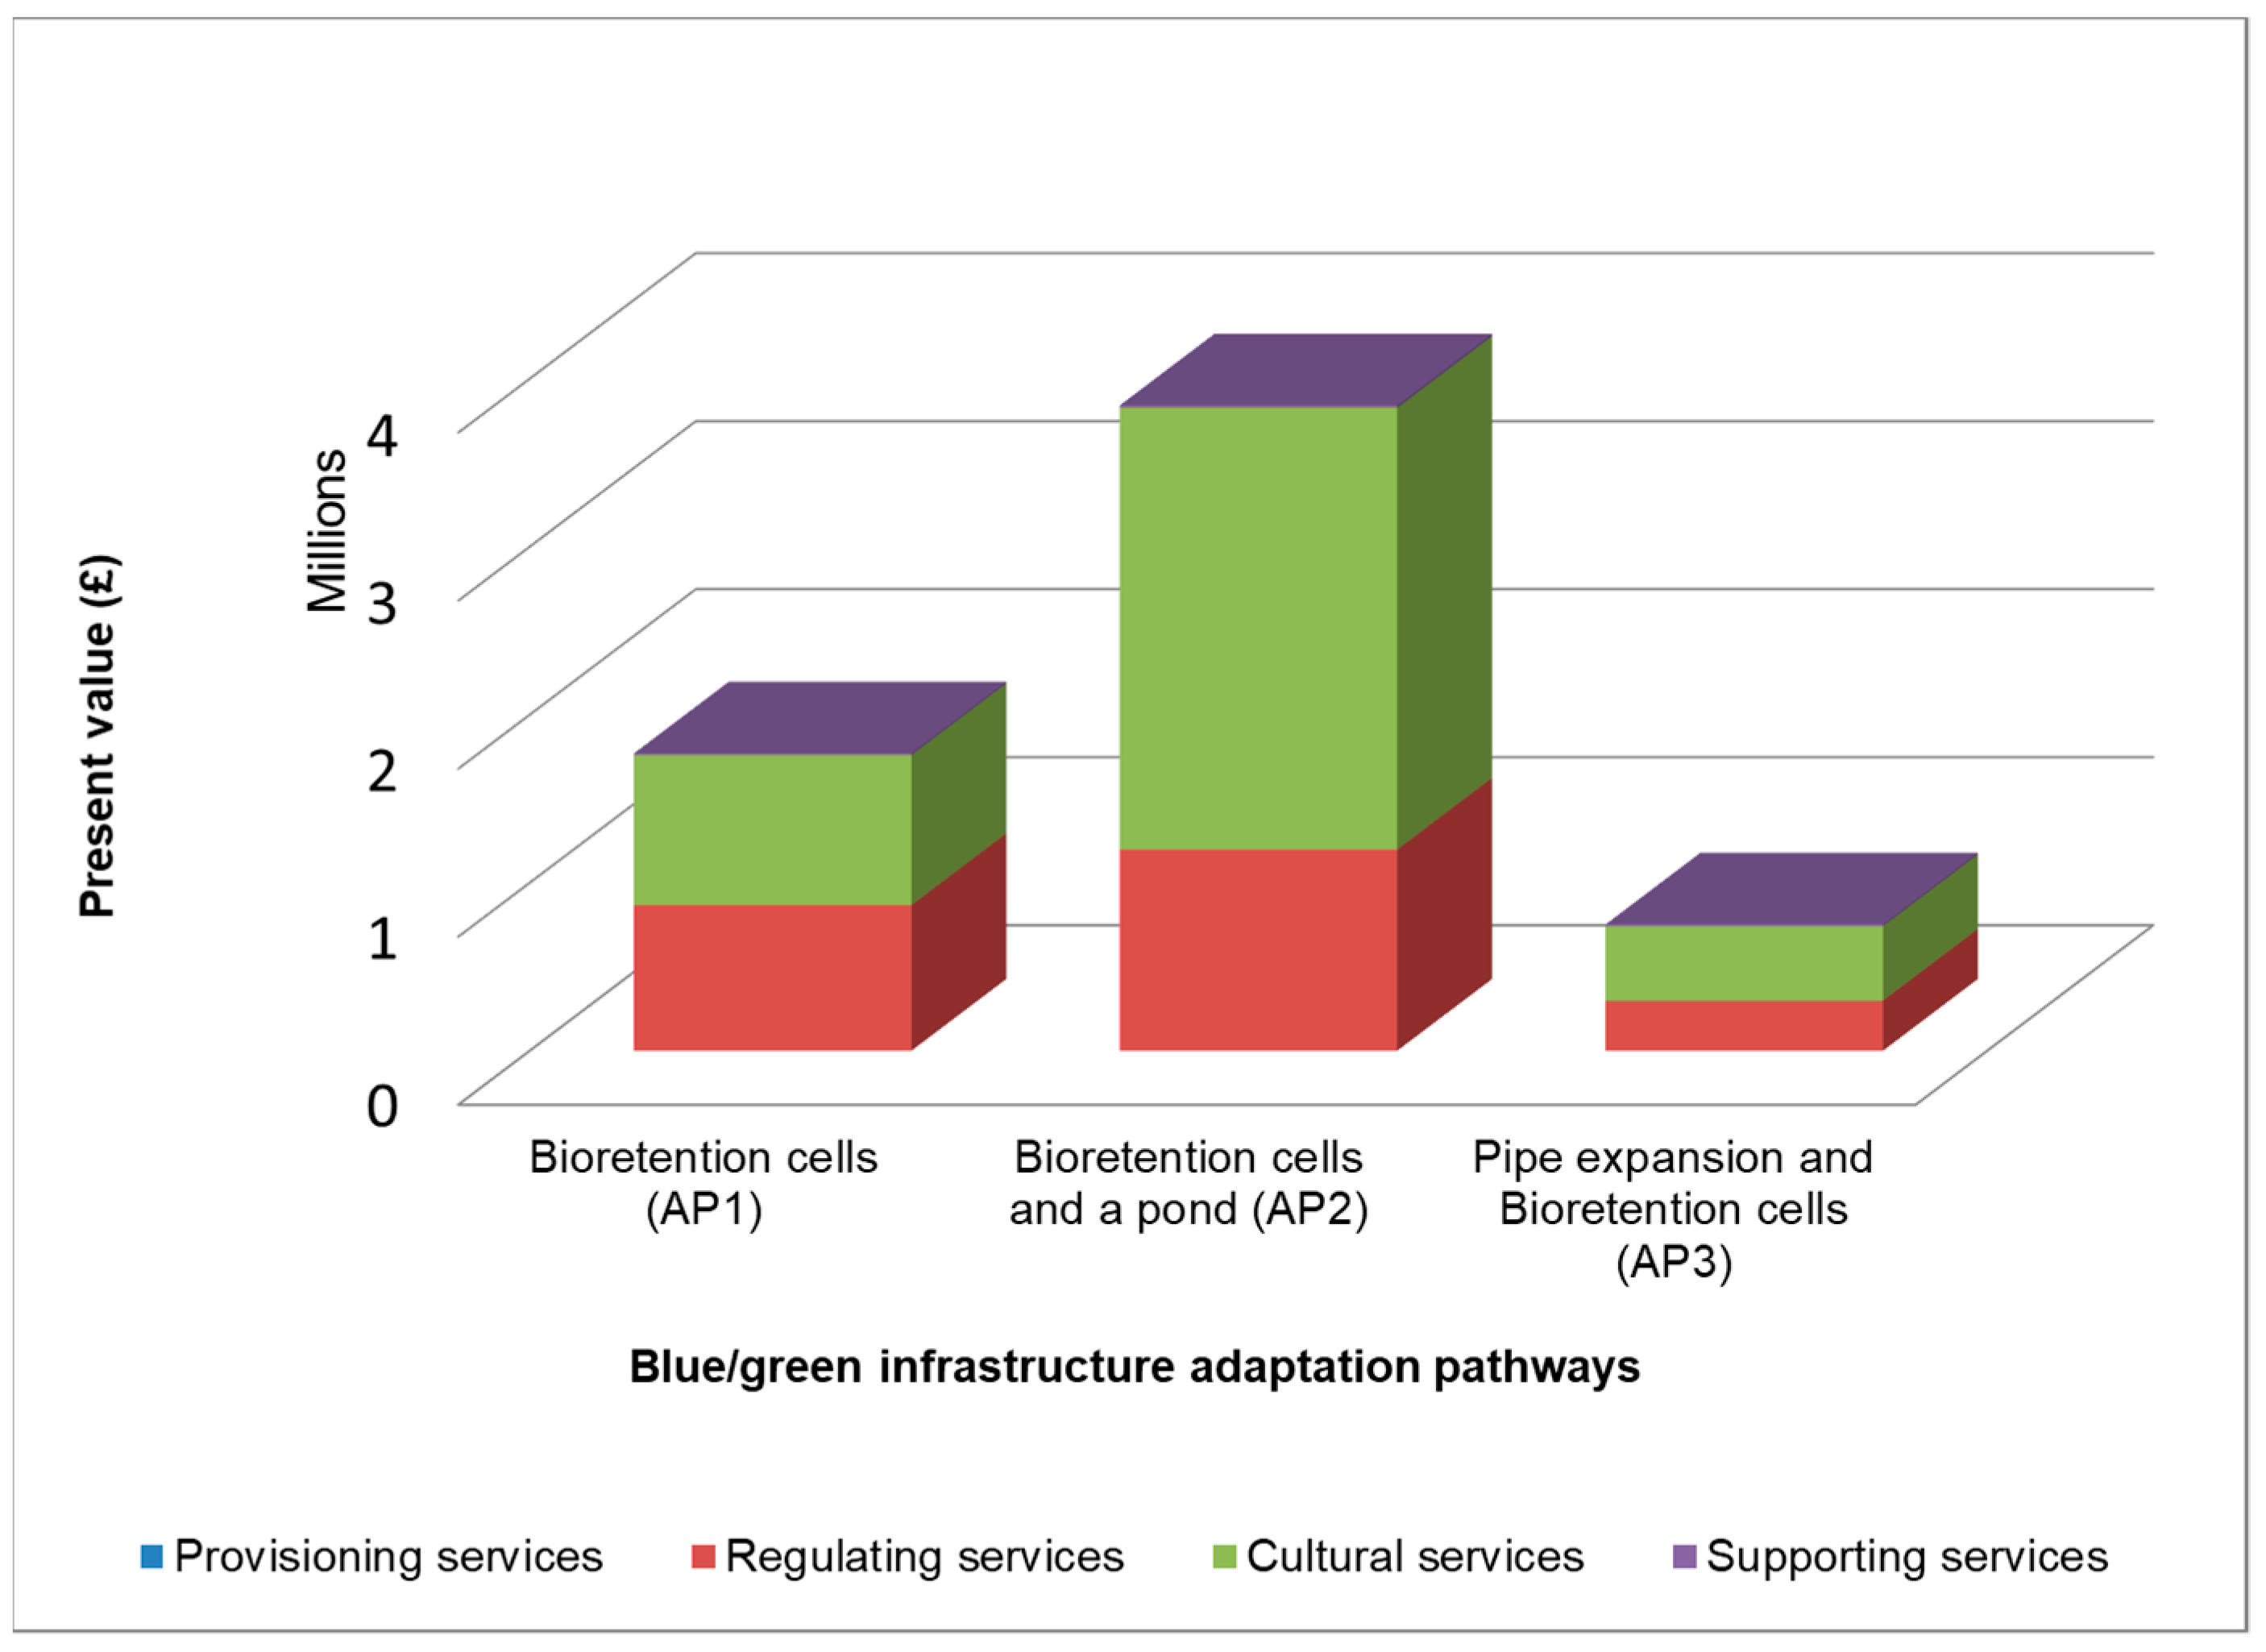
3.2. Present Costs and Benefits Comparison of the Selected Blue-Green and Grey Infrastructure Combinations

The comparison of the present value costs and present value benefits of the selected blue-green and grey infrastructure combinations shows that AP3 (Pipe expansion and bioretention cells) has the highest present value costs (~£1.3 million) and the lowest multiple benefits present value (Figure 7). Such high costs are associated with the capital required for pipe upgrades. Bioretention cells and ponds have relatively low capital costs, but high operational and maintenance costs for activities such as inspection and monitoring, weed control, pruning and trimming of trees/shrubs and sediments removal. Of the three options, AP1 (bioretention cells) has the lowest present value costs.
The highest present value benefits (~£3.5 million) are from AP2, which consists of a blue-green combination. As also presented in the section above, this option has a high ecosystem service delivery potential compared to the other two options. The least present value benefits are from AP3 (hybrid combination), given the higher present value costs associated with this option.
As shown in Figure 8, AP2 has the potential to deliver the highest present value benefits, with a significant contribution to the cultural ecosystem services. The types of ecosystem services in this category include amenity/aesthetic value, recreation, education and health (Figure 9). AP2 also significantly contributes to regulating ecosystem services such as flood risk regulation and air quality improvement. AP1 contributes to similar ecosystem service types and categories but has lower present value benefits compared to AP2, as this is a bioretention cells only option. All the three options have a slight contribution to supporting ecosystem services such as biodiversity. This varies with the type of plants/trees used to establish these systems. The present value contribution of these options to carbon reduction and sequestration is low, given the time taken for the vegetation and plants to grow on pond edges and in bioretention cells. Due to their nature, none of these options significantly contributes to provisioning ecosystem services.
As further illustrated in Figure 9, the most dominant ecosystem service from these options is amenity value. Based on the expert stakeholder interviews, flood risk reduction was rated as an essential priority ecosystem service, while aesthetic value and air quality regulation were rated as very important in the study area (Table 1). This implies that, although these assessed options deliver on the flood risk reduction ecosystem service, their highest contribution is in other ecosystem services, such as amenity value.
As illustrated in Figure 9, AP2 has the potential to deliver more ecosystem services, with amenity value being the most dominant present value benefit across the three options. All the three options have a very small net present value contribution to biodiversity and ecology ecosystem services, given the time required for the systems to be established.

3.3. Capitals Account: Contribution of Blue-Green Infrastructure Options to Human-Derived Capitals

Based on the B£ST capitals account for the blue-green options assessed in this study, findings show that these contribute to other forms of capital. The options assessed in this study notably contribute to social and human capital in addition to their contribution to natural capital (Figure 10). The contribution of these options towards other capitals is based on the distribution of ecosystem service types across different forms of capital, i.e., social, financial, manufactured and human/intellectual. For example, the assessment framework embedded in B£ST splits air quality regulation between natural and social capital as it contributes to both forms of capital, while biodiversity and ecology mainly contribute to natural capital, and hence 100% are allocated to natural capital.

3.4. Expert Stakeholder Interviews’ Summary

Table 1, below, gives an overview of the key messages from the expert stakeholder online survey. The expert stakeholders were then requested to comment on the survey results shown in Table 1 during subsequent telephone interviews. The interviews provided explanations to their selected ecosystem service and blue-green options ranking and prioritisation as reflected in the discussion section. Refer to Supplementary 1 for detailed outcomes from interview discussions with the expert stakeholders.
As highlighted in Table 1, the responses from expert stakeholders confirmed the flood risk challenge in the study area, and hence the prioritisation of flood risk regulation. The table also shows that cultural ecosystem services such as aesthetic value were regarded as very important to local residents in the study area. As stated by one of the expert stakeholders, “This reflects an awareness of what people are worried about such as flooding. Water quality is not prioritized as people don’t understand where water comes from and the direct importance of water quality directly to them” (Interview #3).
In relation to the blue-green options desired in the study area, bioretention cells were ranked as the first choice intervention option, while permeable pavements were ranked as the least favoured. As explained by one of the experts, “Bioretention cells offer more value in terms of multiple ecosystem services provision while Permeable Pavements are primarily focused on one benefit/addressing one challenge. The magnitude of benefits and higher water storage potential of Bioretention cells makes them a first choice compared to Permeable Pavements which don’t even have an aesthetic or recreational value. Raingardens are popular as people can understand and have confidence in what such interventions can deliver” (Interview #4).

4. Discussion

The main focus of this study is to assess the contribution of different blue-green and grey combinations on natural capital and human-derived capital. The blue-green infrastructure options assessed in this study showed a potential contribution towards a range of ecosystem services such as amenity/aesthetic value, air quality improvement, recreation and educational opportunities. Of these, flood risk reduction was indicated by expert stakeholders to be of essential priority to the local residents in the study area, whilst aesthetic value, recreation and air quality regulation were rated as very important. Water quality regulation was rated as of little importance to local residents, and this was attributed to the local residents’ appreciation and prioritisation of ecosystem services that they can visualise, such as aesthetic value from blue-green infrastructure. Conversely, water quality regulation was regarded as not so visible, with limited understanding among local residents of the direct importance of the water quality ecosystem service to them as opposed to, e.g., flooding incidents, which they have witnessed in the recent past.
As also demonstrated elsewhere (e.g., [14,46]), flood risk reduction and amenity value/aesthetic are two of the main benefits from blue-green infrastructure. In line with the Millennium Ecosystem Assessment’s [47] ecosystem service categorisation, amenity/aesthetic value refers to the beauty of a place derived from seeing, hearing, touching, feeling or smelling the landscape/nature. Increased access to green spaces and their aesthetic value contributes to both mental and physical human well-being [27,31,37]. In so doing, this contributes to added social capital associated with increased social networks and social relationships. As shown in this study, the assessed blue-green options contributed more to social capital owing to the potential increase in green spaces and opportunities for outdoor recreation activities. The contribution to human capital refers to the productive capacity of human beings, and this includes the capabilities held by individuals, such as knowledge, education, skills and physical and mental health. Business opportunities derived from outdoor recreation activities can contribute to financial capital. This implies that blue-green infrastructure contributes not only to natural capital but also to other forms of capital (social, human and financial). Taken together, all these forms of capital constitute wealth—the ability to produce goods and services into the future and from which human well-being is gained [26].
The feasibility of the different intervention options assessed in this study is dependent on physical constraints and their costs and benefits. The responses from the expert stakeholders’ interviews showed that bioretention cells were ranked as the first-choice blue-green intervention option in the study area, followed by raingardens. However, in terms of feasibility, raingardens and permeable pavements were reported to be readily implementable in the study area compared to bioretention systems. Reasons for this included the ease of introducing raingardens in a retrofit setting like the study area, whilst bioretention cells were argued to be easily implementable in new developments. As such, raingardens were reported to be the most popular blue-green intervention in the study area, given their low cost and small scale of implementation—which made it possible to introduce them in different settings, such as private gardens schools in the study area, bringing them closer to beneficiaries.
The findings from this study, as also reported elsewhere (e.g., [3,35,48]), show that blue-green options appear to be economically viable, as they are cheaper and cost-effective, with multiple benefits across space and time compared to grey infrastructure. The economic value of BGI schemes is argued to be key for decision makers, e.g., planners and local authorities, as such information is required to convince the relevant stakeholders and most planning decisions are based on economic value [7]. Bringing to the fore the economic value and multifunctionality of blue-green infrastructure could help provide a backing for these interventions in urban planning and decision making. Due to the limited understanding of the economic importance of blue-green options and their associated multiple benefits, their adoption is still overshadowed by the traditional practice of grey infrastructure in most urban areas throughout the world [2]. As argued elsewhere, e.g., [48], blue-green and grey infrastructure combinations can be complimentary in urban drainage adaptation strategies, as they offer a wide range of multiple benefits, including their combined potential in flood risk reduction, which in most cases is the main driver for such intervention strategies.
Despite the economic viability of blue-green infrastructure compared to grey infrastructure options, there are still issues regarding who should incur the costs and fund BGI schemes [14]. Clearly, benefits such as amenity value from BGI are not only enjoyed by local residents but also benefit the wider society. This raises questions as to whether developers should fund schemes or communities should also be asked to co-fund BGI initiatives [36]. This also applies to the maintenance of such infrastructure. Whilst private developers may be able to gain a financial return from investing in BGI via increased property prices, social landlords may have to take a broader view and consider how the derived benefits help them meet their wider goals.
While extensive research has been undertaken on both the hydrological and engineering performance of BGI, little has been said on maintenance and governance systems for these [2,46]. The capability of blue-green infrastructure and hence natural capital to deliver multiple benefits is dependent on their condition, quality and extent [49,50]. If in good status, blue-green infrastructure can significantly contribute towards climate resilience and human well-being [27]. This points to the need for maintenance—e.g., inspection and monitoring, sediment removal, etc.—of blue-green infrastructure to ensure its effectiveness overtime. Such issues, related to the costs and governance of BGI, have been identified as some of the factors that have led to a slow uptake and social acceptance of BGI in most urban areas globally [6,15,33,46].
The methods and tools used in this study have uncertainties and assumptions that need to be considered in interpreting the presented results. In B£ST, the uncertainty related to the actual quantity of the benefit and the monetisation rate should be taken into account. In this tool, the user enters confidence scores (i.e., 25% (least confident) to 100% (very confident)) for both the physical data and the allocated financial unit benefits, which are used to determine the results [51]. In this study, a 75% confidence score was applied for both uncertainty sources, except in some cases, as indicated in the tool where the monetisation rate was set at 100%. The use of confidence intervals in B£ST also implies that the actual benefits value could be higher than estimated. The valuation approach used in B£ST is based on different market and nonmarket approaches. This contributes to the ongoing debate and disagreements over the monetary evaluation of ecosystem services [52,53], as such approaches are argued to underestimate the value of ecosystem services, especially the intangible ones, and hence the potential underestimation of economic benefits of BGI.
Similarly, NCPT has its own limitations, related to the habitat/land use classification system, that has limited applicability in urban contexts, as it does not include all the habitat types associated with different blue-green infrastructure options. The choice of boundaries for the natural capital assessment is also critical to the final result, as benefits such as flooding and ecological connectivity propagate further away from the development zone. As a developing area, natural capital assessment methodologies are still evolving [54], and challenges related to data (e.g., uncertainty in valuation estimates and reliable measures of assets extent and condition) still need to be explored further.
Given the complexities related to non-linear dynamics in ecosystem processes and interactions [55] and the limited scientific understanding of these, current ecosystem services assessment approaches are based on simplifying assumptions [56], which tools such as B£ST and NCPT are based on. For example, such simplifying approaches assume a linear relationship between habitat types/changes and ecosystem service delivery. Furthermore, in NCPT, proxy-based scores are used to indicate the potential magnitude of impact and the possible direction of change of selected ecosystem services. Such simplifying approaches are widely applied in ecosystem service assessments due to the lack of independent ecosystem services data, which could be used to assign exact figures to ecosystem services [57]. On this basis, such assumptions and generalisations must be considered when interpreting the findings and conclusions of this study.

5. Conclusions

The aim of this study is to assess the influence of different blue-green and grey infrastructure combinations as adaptation pathways for urban drainage infrastructure on natural capital and associated ecosystem services over time and consider how these contribute to other forms of capital (i.e., social, human, financial and manufactured). The results presented show that blue-green infrastructure combinations have the potential to enhance natural capital and associated ecosystem services. Such options proved to be cost-effective, with higher present value benefits compared to a hybrid combination of green and grey infrastructure option. Findings also showed that blue-green infrastructure options do not contribute only to natural capital but also to other forms of capital, such as social capital. It is concluded that incorporating blue-green infrastructure options in urban drainage adaptive approaches can mitigate natural capital losses and contribute to other forms of capital crucial for human well-being. The inclusion of natural capital assessments in wider environmental assessments could ensure that natural capital is considered alongside built, financial, social and human capital in sustainable urban development.
Although extensive research has been undertaken to demonstrate the potential of blue-green infrastructure in urban development, there is still a need to bridge this research with the urban planning practice, including local stakeholder engagement to ensure the acceptance and uptake of such interventions. Making a clear business case on the costs and benefits of such schemes and agreements on who incurs such costs will help move this agenda forward in tandem with tackling flood risk and associated environmental challenges in urban areas.

Supplementary Materials

The following are available online at https://www.mdpi.com/2071-1050/13/5/2571/s1, S1: Survey questionnaire and interview notes, S2: Results graphs for selected blue-green and grey infrastructure combinations, Figure S1: NCPT scores for AP1- Gradual implementation of Bioretention cells, Figure S2: NCPT scores for AP2— Pond + Gradual implementation of Bioretention cells, Figure S3: NCPT scores for AP3— Pipe system + Gradual implementation of Bioretention cells, Figure S4: Development impact of bioretention cells on ecosystem services, Figure S5: Development impact of a pipe system upgrade and bioretention cells green-grey combination on ecosystem services.

Author Contributions

Conceptualisation, S.N. and S.A.; methodology, S.N.; formal analysis, S.N.; investigation, S.N.; writing—original draft preparation, S.N.; writing—review and editing, S.A.; visualisation, S.N.; supervision, S.A.; project administration, S.A.; funding acquisition, S.A. All authors have read and agreed to the published version of the manuscript.

Funding

This research was funded by the UK Engineering and Physical Sciences Research Council (EPSRC), grant no. EP/P004180/1, and The APC was funded by Heriot-Watt University.

Institutional Review Board Statement

The study was conducted according to the guidelines of the Declaration of Helsinki, and approved by the Ethics Committee of Heriot Watt University (12/12/2019).

Informed Consent Statement

Informed consent was obtained from all subjects involved in the study.

Data Availability Statement

The data presented in this study are openly available in Heriot Watt University Research Portal (PURE) at https://researchportal.hw.ac.uk/en/datasets/blue-green-options-and-natural-capital-surveyinterviews-raw-data, DOI: 10.17861/6b984974-6d87-4e8f-861a-e295cab6884a.

Acknowledgments

This work is part of the Achieving Urban Flood Resilience in an Uncertain Future research project, and we acknowledge funding support from the UK Engineering and Physical Sciences Research Council (EPSRC), grant no. EP/P004180/1. We are also grateful to our project partners at the University of Cambridge for developing the adaptation pathways used in this study.

Conflicts of Interest

The authors declare no conflict of interest.

References

  1. Department of Economic and Social Affairs, Population Division. World Urbanization Prospects: The 2014 Revision; (ST/ESA/SER.A/366); Department of Economic and Social Affairs, Population Division: New York, NY, USA, 2015. [Google Scholar]
  2. Dhakal, K.P.; Chevalier, L.R. Managing urban stormwater for urban sustainability: Barriers and policy solutions for green infrastructure application. J. Environ. Manag. 2017, 203, 171–181. [Google Scholar] [CrossRef] [PubMed]
  3. Locatelli, L.; Guerrero, M.; Russo, B.; Martínez-Gomariz, E.; Sunyer, D.; Martínez, M. Socio-Economic Assessment of Green Infrastructure for Climate Change Adaptation in the Context of Urban Drainage Planning. Sustainability 2020, 12, 3792. [Google Scholar] [CrossRef]
  4. Alves, A.; Gómez, J.P.; Vojinovic, Z.; Sánchez, A.; Weesakul, S. Combining Co-Benefits and Stakeholders Perceptions into Green Infrastructure Selection for Flood Risk Reduction. Environment 2018, 5, 29. [Google Scholar] [CrossRef] [Green Version]
  5. Fenner, R.; O’Donnell, E.; Ahilan, S.; Dawson, D.; Kapetas, L.; Krivtsov, V.; Ncube, S.; Vercruysse, K. Achieving Urban Flood Resilience in an Uncertain Future. Water 2019, 11, 1082. [Google Scholar] [CrossRef] [Green Version]
  6. Mguni, P.; Herslund, L.; Jensen, M.B. Sustainable urban drainage systems: Examining the potential for green infrastructure-based stormwater management for Sub-Saharan cities. Nat. Hazards 2016, 82, 241–257. [Google Scholar] [CrossRef]
  7. Zhou, Q.; Mikkelsen, P.; Halsnæs, K.; Arnbjerg-Nielsen, K. Framework for economic pluvial flood risk assessment considering climate change effects and adaptation benefits. J. Hydrol. 2012, 539–549. [Google Scholar] [CrossRef]
  8. Depietri, Y.; McPhearson, T. Integrating the Grey, Green, and Blue in Cities: Nature-Based Solutions for Climate Change Adaptation and Risk Reduction. In Nature-Based Solutions to Climate Change Adaptation in Urban Areas: Linkages between Science, Policy and Practice; Kabisch, N., Korn, H., Stadler, J., Bonn, A., Eds.; Springer International Publishing: Cham, Switzerland, 2017; pp. 91–109. [Google Scholar] [CrossRef]
  9. Dolowitz, D.P.; Bell, S.; Keeley, M. Retrofitting urban drainage infrastructure: Green or grey? Urban Water J. 2018, 15, 83–91. [Google Scholar] [CrossRef]
  10. Emilsson, T.; Ode Sang, Å. Impacts of Climate Change on Urban Areas and Nature-Based Solutions for Adaptation. In Nature-Based Solutions to Climate Change Adaptation in Urban Areas: Linkages between Science, Policy and Practice; Kabisch, N., Korn, H., Stadler, J., Bonn, A., Eds.; Springer International Publishing: Cham, Switzerland, 2017; pp. 15–27. [Google Scholar] [CrossRef]
  11. Dushkova, D.; Haase, D. Not Simply Green: Nature-Based Solutions as a Concept and Practical Approach for Sustainability Studies and Planning Agendas in Cities. Land 2020, 9, 19. [Google Scholar] [CrossRef] [Green Version]
  12. Ghofrani, Z.; Sposito, V.; Faggian, R. A Comprehensive Review of Blue-Green Infrastructure Concepts. Int. J. Environ. Sustain. 2017, 6. [Google Scholar] [CrossRef]
  13. Winston, R.J.; Dorsey, J.D.; Hunt, W.F. Quantifying volume reduction and peak flow mitigation for three bioretention cells in clay soils in northeast Ohio. Sci. Total. Environ. 2016, 553, 83–95. [Google Scholar] [CrossRef]
  14. Ashley, R.M.; Gersonius, B.; Digman, C.; Horton, B.; Bacchin, T.; Smith, B.; Shaffer, P.; Baylis, A. Demonstrating and Monetizing the Multiple Benefits from Using SuDS. J. Sustain. Water Built Environ. 2018, 4, 05017008. [Google Scholar] [CrossRef]
  15. Kabisch, N.; Frantzeskaki, N.; Pauleit, S.; Naumann, S.; Davis, M.; Artmann, M.; Haase, D.; Knapp, S.; Korn, H.; Stadler, J.; et al. Nature-based solutions to climate change mitigation and adaptation in urban areas: Perspectives on indicators, knowledge gaps, barriers, and opportunities for action. Ecol. Soc. 2016, 21. [Google Scholar] [CrossRef] [Green Version]
  16. Morgan, M.; Fenner, R. Spatial evaluation of the multiple benefits of sustainable drainage systems. Proc. Inst. Civ. Eng. Water Manag. 2019, 172, 39–52. [Google Scholar] [CrossRef] [Green Version]
  17. Pugh, T.A.M.; MacKenzie, A.R.; Whyatt, J.D.; Hewitt, C.N. Effectiveness of Green Infrastructure for Improvement of Air Quality in Urban Street Canyons. Environ. Sci. Technol. 2012, 46, 7692–7699. [Google Scholar] [CrossRef] [Green Version]
  18. Cortinovis, C.; Geneletti, D. Ecosystem services in urban plans: What is there, and what is still needed for better decisions. Land Use Policy 2018, 70, 298–312. [Google Scholar] [CrossRef]
  19. Silvennoinen, S.; Taka, M.; Yli-Pelkonen, V.; Koivusalo, H.; Ollikainen, M.; Setälä, H. Monetary value of urban green space as an ecosystem service provider: A case study of urban runoff management in Finland. Ecosyst. Serv. 2017, 28, 17–27. [Google Scholar] [CrossRef] [Green Version]
  20. Hansen, R.; Pauleit, S. From Multifunctionality to Multiple Ecosystem Services? A Conceptual Framework for Multifunctionality in Green Infrastructure Planning for Urban Areas. Ambio 2014, 43, 516–529. [Google Scholar] [CrossRef] [Green Version]
  21. O’Donnell, E.C.; Thorne, C.R.; Yeakley, J.A.; Chan, F.K.S. Sustainable Flood Risk and Stormwater Management in Blue-Green Cities; an Interdisciplinary Case Study in Portland, Oregon. JAWRA J. Am. Water Resour. Assoc. 2020, 56, 757–775. [Google Scholar] [CrossRef]
  22. Holt, A.R.; Mears, M.; Maltby, L.; Warren, P. Understanding spatial patterns in the production of multiple urban ecosystem services. Ecosyst. Serv. 2015, 16, 33–46. [Google Scholar] [CrossRef] [Green Version]
  23. Lennon, M.; Scott, M.J. Delivering ecosystems services via spatial planning: Reviewing the possibilities and implications of a green infrastructure approach. Town Plan. Rev. 2014, 85, 563–587. [Google Scholar] [CrossRef] [Green Version]
  24. Meerow, S.; Newell, J.P. Spatial planning for multifunctional green infrastructure: Growing resilience in Detroit. Landsc. Urban Plan. 2017, 159, 62–75. [Google Scholar] [CrossRef]
  25. Jones, L.; Norton, L.R.; Austin, Z.; Browne, A.L.; Donovan, D.; A Emmett, B.; Grabowski, Z.; Howard, D.C.; Jones, J.P.G.; Kenter, J.; et al. Stocks and flows of natural and human-derived capital in ecosystem services. Land Use Policy 2016, 52, 151–162. [Google Scholar] [CrossRef]
  26. Natural Capital Committee. The State of Natural Capital: Protecting and Improving Natural Capital for Prosperity and Well Being. Available online: https://www.gov.uk/government/publications/natural-capital-committees-third-state-of-natural-capital-report (accessed on 13 February 2020).
  27. DEFRA. Enabling a Natural Capital Approach: A guidance. Available online: https://www.gov.uk/government/publications/enabling-a-natural-capital-approach-enca-guidance (accessed on 5 July 2020).
  28. Guerry, A.D.; Polasky, S.; Lubchenco, J.; Chaplin-Kramer, R.; Daily, G.C.; Griffin, R.; Ruckelshaus, M.H.; Bateman, I.J.; Duraiappah, A.; Elmqvist, T.; et al. Natural capital and ecosystem services informing decisions: From promise to practice. Proc. Natl. Acad. Sci. USA 2015, 112, 7348–7355. [Google Scholar] [CrossRef] [Green Version]
  29. Costanza, R.; De Groot, R.; Braat, L.; Kubiszewski, I.; Fioramonti, L.; Sutton, P.; Farber, S.; Grasso, M. Twenty years of ecosystem services: How far have we come and how far do we still need to go? Ecosyst. Serv. 2017, 28, 1–16. [Google Scholar] [CrossRef]
  30. Ahern, J.; Cilliers, S.S.; Niemelä, J. The concept of ecosystem services in adaptive urban planning and design: A framework for supporting innovation. Landsc. Urban Plan. 2014, 125, 254–259. [Google Scholar] [CrossRef] [Green Version]
  31. Bright, G.; Connors, E.; Grice, J. Measuring natural capital: Towards accounts for the UK and a basis for improved decision-making. Oxf. Rev. Econ. Policy 2019, 35, 88–108. [Google Scholar] [CrossRef]
  32. Kapetas, L.; Fenner, R. Integrating blue-green and grey infrastructure through an adaptation pathways approach to surface water flooding. Philos. Trans. R. Soc. A Math. Phys. Eng. Sci. 2020, 378, 20190204. [Google Scholar] [CrossRef] [PubMed] [Green Version]
  33. Van Oijstaeijen, W.; Van Passel, S.; Cools, J. Urban green infrastructure: A review on valuation toolkits from an urban planning perspective. J. Environ. Manag. 2020, 267, 110603. [Google Scholar] [CrossRef]
  34. Haasnoot, M.; Kwakkel, J.H.; Walker, W.E.; ter Maat, J. Dynamic adaptive policy pathways: A method for crafting robust decisions for a deeply uncertain world. Glob. Environ. Chang. 2013, 23, 485–498. [Google Scholar] [CrossRef] [Green Version]
  35. O’Donnell, E.C.; Woodhouse, R.; Thorne, C.R. Evaluating the multiple benefits of a sustainable drainage scheme in Newcastle, UK. Proc. Inst. Civil Eng. Water Manag. 2018, 171, 191–202. [Google Scholar] [CrossRef] [Green Version]
  36. O’Donnell, E.; Thorne, C.; Ahilan, S.; Arthur, S.; Birkinshaw, S.; Butler, D.; Dawson, D.; Everett, G.; Fenner, R.; Glenis, V.; et al. The blue-green path to urban flood resilience. Blue-Green Syst. 2019, 2, 28–45. [Google Scholar] [CrossRef] [Green Version]
  37. Bratman, G.N.; Anderson, C.B.; Berman, M.G.; Cochran, B.; De Vries, S.; Flanders, J.; Folke, C.; Frumkin, H.; Gross, J.J.; Hartig, T.; et al. Nature and mental health: An ecosystem service perspective. Sci. Adv. 2019, 5, eaax0903. [Google Scholar] [CrossRef] [Green Version]
  38. Sutton Council. London Borough of Sutton Local Flood Risk Management Strategy; Sutton Council: Sutton, UK, 2020. [Google Scholar]
  39. Transport for London. SUDS in London: A Design Guide; Transport for London: London, UK, 2016. [Google Scholar]
  40. Sutton Council. London Borough of Sutton Air quality Action Plan 2019–2023; Sutton Council: Sutton, UK, 2020. [Google Scholar]
  41. Holzinger, O.; Sadler, J.; Scott, A. Natural Capital Planning Tool. Available online: http://ncptool.com/ (accessed on 20 August 2018).
  42. Horton, B.; Digman, C.J.; Ashley, R.M.; McMullan, J. Benefits of SuDS Tool–Guidance to Assess the Benefits of Blue and Green Infrastructure Using B£ST; CIRIA: London, UK, 2019. [Google Scholar]
  43. Liu, H.; Wang, Y.; Zhang, C.; Chen, A.S.; Fu, G. Assessing real options in urban surface water flood risk management under climate change. Nat. Hazards 2018, 94, 1–18. [Google Scholar] [CrossRef] [Green Version]
  44. Stovin, V.R.; Swan, A.D. Retrofit SuDS—Cost estimates and decision-support tools. Water Manag. 2007, 160, 207–214. [Google Scholar] [CrossRef] [Green Version]
  45. Starkl, M.; Ertl, T.; Haberl, R. Experiences with benchmarking of sewerage systems with a special focus on investment costs. Urban Water J. 2007, 4, 93–105. [Google Scholar] [CrossRef]
  46. Hamann, F.; Blecken, G.-T.; Ashley, R.M.; Viklander, M. Valuing the Multiple Benefits of Blue-Green Infrastructure for a Swedish Case Study: Contrasting the Economic Assessment Tools B£ST and TEEB. J. Sustain. Water Built Environ. 2020, 6, 05020003. [Google Scholar] [CrossRef]
  47. Millennium Ecosystem Assessment. Ecosystems and Human Well-Being: A Framework for Assessment; Millennium Ecosystem Assessment: Washington, DC, USA, 2003. [Google Scholar]
  48. Alves, A.; Gersonius, B.; Kapelan, Z.; Vojinovic, Z.; Sanchez, A. Assessing the Co-Benefits of green-blue-grey infrastructure for sustainable urban flood risk management. J. Environ. Manag. 2019, 239, 244–254. [Google Scholar] [CrossRef]
  49. Bastien, N.R.P.; Arthur, S.; McLoughlin, M.J. Valuing amenity: Public perceptions of sustainable drainage systems ponds. Water Environ. J. 2011, 26, 19–29. [Google Scholar] [CrossRef]
  50. Jarvie, J.; Arthur, S.; Beevers, L. Valuing Multiple Benefits, and the Public Perception of SUDS Ponds. Water 2017, 9, 128. [Google Scholar] [CrossRef] [Green Version]
  51. Ashley, R.; Gersonius, B.; Digman, C.; Horton, B.; Smith, B.; Shaffer, P. Including uncertainty in valuing blue and green infrastructure for stormwater management. Ecosyst. Serv. 2018, 33, 237–246. [Google Scholar] [CrossRef]
  52. Chan, K.M.; Satterfield, T.; Goldstein, J. Rethinking ecosystem services to better address and navigate cultural values. Ecol. Econ. 2012, 74, 8–18. [Google Scholar] [CrossRef] [Green Version]
  53. Hauck, J.; Görg, C.; Varjopuro, R.; Ratamäki, O.; Jax, K. Benefits and limitations of the ecosystem services concept in environmental policy and decision making: Some stakeholder perspectives. Environ. Sci. Policy 2013, 25, 13–21. [Google Scholar] [CrossRef]
  54. Hein, L.; Bagstad, K.; Edens, B.; Obst, C.; De Jong, R.; Lesschen, J.P. Defining Ecosystem Assets for Natural Capital Accounting. PLoS ONE 2016, 11, e0164460. [Google Scholar] [CrossRef] [PubMed] [Green Version]
  55. Koch, E.W.; Barbier, E.B.; Silliman, B.R.; Reed, D.J.; Perillo, G.M.; Hacker, S.D.; Granek, E.F.; Primavera, J.H.; Muthiga, N.; Polasky, S.; et al. Non-linearity in ecosystem services: Temporal and spatial variability in coastal protection. Front. Ecol. Environ. 2009, 7, 29–37. [Google Scholar] [CrossRef]
  56. Ncube, S.; Spray, C.; Geddes, A. Assessment of changes in ecosystem service delivery–A historical perspective on catchment landscapes. Int. J. Biodivers. Sci. Ecosyst. Serv. Manag. 2018, 14, 145–163. [Google Scholar] [CrossRef] [Green Version]
  57. Vermaat, J.E.; Ellers, J.; Helmus, M.R. The role of biodiversity in the provision of ecosystem services. In Ecosystem Services: From Concept to Practice; Bouma, J.A., van Beukering, P.J.H., Eds.; Cambridge University Press: Cambridge, UK, 2015; pp. 22–39. [Google Scholar]
Figure 1. Study area in the South London Borough (Contains Ordnance Survey data (2020)).
Sustainability 13 02571 g001
Figure 2. Land use map for the study area (Contains Ordnance Survey data (2020)).
Sustainability 13 02571 g002
Figure 3. Proposed implementation location of the selected blue-green and grey infrastructure options in the study area (Contains Ordnance Survey data (2020)).
Sustainability 13 02571 g003
Figure 4. Ecosystem services assessed using the Natural Capital Planning Tool (NCPT) and an example of calculated impact scores (Source: http://ncptool.com, accessed on 20 August 2018).
Sustainability 13 02571 g004
Figure 5. Development impact of selected blue-green and grey infrastructure combinations on ecosystem service delivery overtime.
Sustainability 13 02571 g005
Figure 6. Development impact of a pond and bioretention cells’ blue-green combination on ecosystem services.
Sustainability 13 02571 g006
Figure 7. Present value costs and benefits of the selected blue-green and grey infrastructure combinations.
Sustainability 13 02571 g007
Figure 8. Present value benefits comparison of selected blue-green and grey infrastructure combinations by ecosystem service categories.
Sustainability 13 02571 g008
Figure 9. Present value benefits comparison of selected blue-green and grey infrastructure combinations by types of ecosystem services.
Sustainability 13 02571 g009
Figure 10. Contribution of selected blue-green infrastructure to other forms of capital.
Sustainability 13 02571 g010
Table 1. Expert stakeholder survey summary results overview.
Survey Summary Results
Flood risk regulation is an essential priority ecosystem service in the study area
Aesthetic values and recreation are very important ecosystem services, while water quality regulation is of little importance to local residents.
Among the different blue-green options there is good knowledge on raingardens and rainwater harvesting in the study area
Raingardens and permeable pavements’ blue-green options are definitely possible to implement in the study area
In terms of ranking-Bioretention cells were ranked as the first choice intervention and raingardens as the second choice to be implemented, while Permeable Pavements were ranked last.
Publisher’s Note: MDPI stays neutral with regard to jurisdictional claims in published maps and institutional affiliations.

