Article

Funding Campus Sustainability through a Green Fee—Estimating Students’ Willingness to Pay

O’Malley School of Business, Manhattan College, 4513 Manhattan College Pkwy, DLS 422, Riverdale, NY 10471, USA
*
Author to whom correspondence should be addressed.
Sustainability 2021, 13(5), 2528; https://doi.org/10.3390/su13052528
Submission received: 31 December 2020 / Revised: 15 February 2021 / Accepted: 19 February 2021 / Published: 26 February 2021
(This article belongs to the Special Issue Promoting Sustainability in Higher Education)

Abstract

:
Many higher education institutions promote sustainability by instilling environmental awareness within college students, the innovators of the future. As higher education institutions face budgetary constraints to achieve greener campuses, green fees have emerged as an alternative method for universities to encourage student participation and overall campus sustainability. A green fee is a mandatory student fee that funds sustainability projects on campus and is typically managed by a group of students and faculty. We are the first to assess students’ support for a mandatory green using a single dichotomous choice, contingent valuation question and estimating the willingness to pay to fund campus sustainability using a discrete choice model. Using results from a survey at a private college in New York City, we found more support for $5 and $10 green fee values. Using both parametric and non-parametric estimation methods, we found that mean and median willingness-to-pay values were between $13 and $15 and between $10 and $18, respectively. We suggest implementing a green fee between $10 and $13 following the lower values of the non-parametric median willingness to pay (WTP) range estimates that do not rely on distributional assumptions. We hope that other academic institutions follow our research steps to assess the support for a green fee and to suggest a green fee value for their institutions.

1. Introduction

Many higher education institutions promote sustainability by instilling environmental awareness within college students, the innovators of the future. Since the 1970s, movements that use both grassroots efforts and top–down institutional programs have led to establishing campus sustainability initiatives [1]. Signed and established in 2007, the American College & University Presidents Climate Commitment (ACUPCC) presents its signatories recognition that colleges and universities must take action to address climate change [1]. Moreover, they recognize higher education’s unique role as learning laboratories that promote innovation and educate future leaders. At least 685 universities are ACUPCC signatories that are committed to decrease greenhouse emissions [2]. These higher education institutions incorporate sustainability into their campuses and face climate change related issues by recognizing that formal education is a crucial step in preparing students to contribute to a more sustainable future.
Some university campuses have seen the financial benefits of increasing sustainability and energy-conservation efforts, and they have aligned their missions to the importance of preserving our planet. Environmental rankings have been developed to compare different institutions, including the College Sustainability Report Card [3], the Green Colleges Ranking [4], and the Sustainability Tracking, Assessment, and Rating System (STARS) [5]. These rankings signal the demand for environmental information among prospective students and donors.
Additional schools have considered joining the ACUPCC, but budgetary and financial concerns have prevented them from doing so [2]. However, at some of these institutions, students seek alternative ways to promote sustainability, including the establishment of a green fee. A green fee is a student fee that funds sustainability projects on campus and is typically managed by a group of students and faculty [6]. The fee may be collected per year, per semester, or per credit hour. This fee offers students a strong and active voice in shaping the sustainability agenda of universities, increases the reputation of the institution, and allows administrators and students to work more cohesively [6].
In this manuscript, we present the results of a survey that elicited students’ support for a mandatory green fee to fund sustainability projects at a private regional college in New York City: Manhattan College. We answer two research questions: (1) “Do students support a mandatory green fee to fund sustainability projects on campus?” and (2) “What is the average willingness to pay to fund sustainability on campus?” We assessed students’ support for the green fee and their willingness to pay using contingent valuation techniques. We contribute to the green fee literature in two ways. We are the first to estimate students’ willingness to pay using a single dichotomous choice referendum question, which improves incentive compatibility. Secondly, we are the first to use both parametric and non-parametric discrete choice model estimation methods to estimate both mean and median willingness to pay (WTP) within a green fee context, offering more reliable estimates. We found support for the green fee and estimated the mean and median WTP to be between $13 and $15 and between $10 and $18, respectively. We recommend a green fee between $10 and $13 that is aligned with the lower estimates of the nonparametric median WTP ranges.

2. Literature Review

Universities educate the next generation of leaders, bring awareness to important issues among young minds, and are sources of research, ideas, and innovation [6]. In this section, we review articles about students’ environmental awareness and about green fees. The literature on environmental awareness among university students include research on environmental knowledge and attitudes across and within universities. For example, a survey of 737 students from five universities in Macau showed similar energy-savings attitudes and awareness across the universities [7]. The authors of [8] surveyed 485 students from provincial higher education institutions in China and found that both teacher-driven and student-driven pedagogies increase environmental awareness. In Europe, the authors of [9] studied sustainability dimensions using a voluntary course survey completed by 674 students from different majors at two universities in Finland. Using a structural equation model, they found that awareness of nature contributes to the enjoyment of nature, which has a positive relation to environmental knowledge.
Within universities, the authors of [10] examined students’ knowledge on plastic waste problems using a survey of 98 students from a Taiwanese university. They found that students majoring in environmental sciences have a higher knowledge relative to social science majors. In Europe, researchers found that faculties of science and engineering have the greatest changes in environmental attitudes and the highest level of sustainability knowledge based on a survey of 504 students from a Spanish university [11]. In the U.S., the authors of [12] studied students’ awareness and attitudes at the University of Vermont and found a strong understanding of sustainability and that students consider sustainability to be important.
In addition to these studies that sampled students across various majors or programs of study, the authors of [13] explored environmental awareness among 152 students from the College of Architecture and Planning at a university in Saudi Arabia. They found that while students expressed awareness and concern about campus environmental sustainability, they did not show interest and willingness to participate in campus sustainability initiatives [13]. Even though these articles were not about green fees, they offered information about environmental awareness and campus sustainability across multiple universities.
Next, we summarize articles about green fees and students’ WTP. Several different campus sustainability initiatives have focused on obtaining funding to pursue specific sustainability projects. For example, some universities have a green revolving fund, which is an internal fund that finances energy efficient, renewable energy, and other sustainability projects that generate cost-savings, which replenish the fund [14]. As of 2012, there were 79 green revolving funds at higher education institutions in North America that provide financing for sustainability projects within each institution [14]. Green revolving funds are financed through different mechanisms, one of which relies on student green fees [14]. Beyond supporting green revolving funds, green fees are also used to fund general sustainability initiatives on campus.
Studies on green fees have been limited to university and extension reports, with two peer-reviewed articles covering this subject. In this section, we provide relevant information about green fees established at colleges and universities in the United States, as well as guidelines on how to establish such fee. Then, we summarize the results from the limited peer-reviewed sources on green fees.
Green fees result in benefits that go beyond additional available funds. Student-led projects funded by the green fee offer students a unique opportunity to foster environmental change based on their self-defined wants and needs, which empowers students [6]. Universities are unique places to cultivate transformations because they have enthusiastic students, discuss social issues, inspire young decision-makers, and are sources of innovation [15]. In addition to providing the funding itself, the green fee engages students in formulating, contributing, collecting, distributing, and regulating the funds [6]. As of November of 2010, 80 higher education institutions had an active green fee program [1].
Ozeki (2010) summarized typical steps in establishing a green fee. First, the fee generally stems from a student-led proposal following other institutions’ examples. A student body survey is employed to assess initial support. With evidence of support, a petition to the student government leads to a ballot/referendum among the entire student body. If the ballot passes, the proposal is shared with senior administrators, a board of trustees, or a legislative body to achieve a final approval [1]. In order to propose a green fee, Indvik et al. (2013) suggested the following steps: (1) to poll the student body to perform a willingness-to-pay analysis, (2) to choose the optimal fee amount, and (3) to estimate the revenue from the fee [14]. In this manuscript, we complete the first step and provide suggestions for the second step. Given the great potential of green fees, this study sought to measure student support for a green fee that would fund sustainability projects at the studied university. We provide a case study for other higher education institutions seeking to establish a green fee and showcase the research steps needed to measure student support and propose a specific monetary value for it.
To the best of our knowledge, there are only two peer-reviewed articles that ask students’ WTP for general sustainability initiatives on their campuses connected to student fees [2,16]. In addition to these articles, we summarize three articles about students’ WTP for environmental goods or services. For example, the authors of [17] examined the factors that affect students’ consumption of eco-friendly products at a university in Hungary. Using data from 1185 students, they concluded that environmental knowledge has a positive relation with WTP. The other two studies were based on specific eco-friendly goods. The authors of [18] examined students’ WTP to install water bottle refill stations to decrease single-use plastic waste using a double-bound dichotomous choice method that presented two bid values to each respondent. Using data from 346 students from a Japanese university and a logit model, they estimated the mean WTP as 2211 JPY (1 JPY = 0.01 USD), which would be enough to cover the installation and maintenance costs of the water refill station [18]. They elicited students’ WTP through a single, non-recurring, payment mechanism, which is different from green fees that are charged per semester or per credit. The third peer-reviewed article studied students’ WTP for green buildings connected to tuition [19]. Using a survey of 162 undergraduate students from a university in the U.S., they examined students’ WTP for green building features, focusing on one of the Leadership in Energy and Environmental Design (LEED) categories. The asked students “How likely are you to accept a refund of 1 per cent of your tuition if your university focused less on [LEED category] issues on your campus?” They measured WTP using this willingness to accept (WTA) question. However, the literature has documented divergence between WTA and WTP measures [20]. Their survey analysis found that about half of the respondents were willing to pay for most LEED categories [19].
Narrowing the scope to research on student fees, Rosentrater and Burke (2017) administered an online survey that asked students “How much more tuition are you willing to pay to have more energy come from renewable sources?” with 10%, 25%, 50%, and Other as choices [16]. These choices were challenging to analyze because the scale is not numerically exhaustive. They also asked: “Would you support paying an extra fee with tuition costs to support services such as recycling, composting, and other green initiatives as determined by an advisory committee?” This appeared to be given as an open-ended question out of 78 questions. By not providing a choice, the question was harder to analyze. Moreover, it did not include any reference to a specific monetary value, which made the question less realistic and more difficult for students to answer. While the question was asked in the survey, no analysis was offered in the published manuscript.
Meyer and Yang (2016) studied the effect of social norm information treatments on students’ willingness to contribute to a green fee at a midwestern liberal arts university. Through a survey that asked students to select a dollar amount from a payment card, they estimated the effect of three information treatments relative to a control group that received no information. The first treatment provided information on green fee dollar ranges at peer universities and college. The second treatment presented information on the number of institutions with green fees and on student support for green fees (i.e., the percentage that voted “yes” to pass the green fee). Lastly, the third combined the first two treatments. Using an Ordinary Least Squares (OLS) and a maximum likelihood interval estimation, they found that the monetary information on green fees at other institutions had a negative impact on the average contribution to the green fee. In contrast, they observed a positive effect for the second treatment, showing that learning about high participation rates at peer institutions increases the mean contribution. Lastly, they found no effect for the combination treatment [2].
These WTP studies have focused on single universities and collected demographic characteristics. While the authors of [19] examined whether gender affects WTP, the authors of [18] also controlled for knowledge, environmental education, and part-time employment. Relative to the other studies, the authors of [2] included more demographic characteristics as factors that influence the WTP relative to these other studies. The gender differences results from these studies varied. The authors of [19] found a significant but weak correlation between female students and their WTP for one LEED category. In contrast, the authors of [2] found that males were willing to contribute higher amounts than females. Lastly, the authors of [18] did not discuss gender differences. We built our survey instrument following [2], which collected and included more demographic and college-related characteristics in their analysis relative to other studies.
Our study was mostly influenced by [2] but differed in specific ways that allowed us to contribute to the literature. Whereas their survey used a payment card and varied the information revealed to participants, our survey used a stated preference technique in which the green fee dollar amounts varied across participants and participants were presented with a single dichotomous choice referendum question, thus improving incentive compatibility. A major contribution to the literature is that we assessed the support to establish a green fee using discrete choice model techniques that have not been employed in any green fee research. Specifically, this research methodology allowed us to estimate students’ average and median willingness to pay to fund sustainability projects on their campus using both parametric and non-parametric models, thus offering more reliable estimates.

3. Materials and Methods
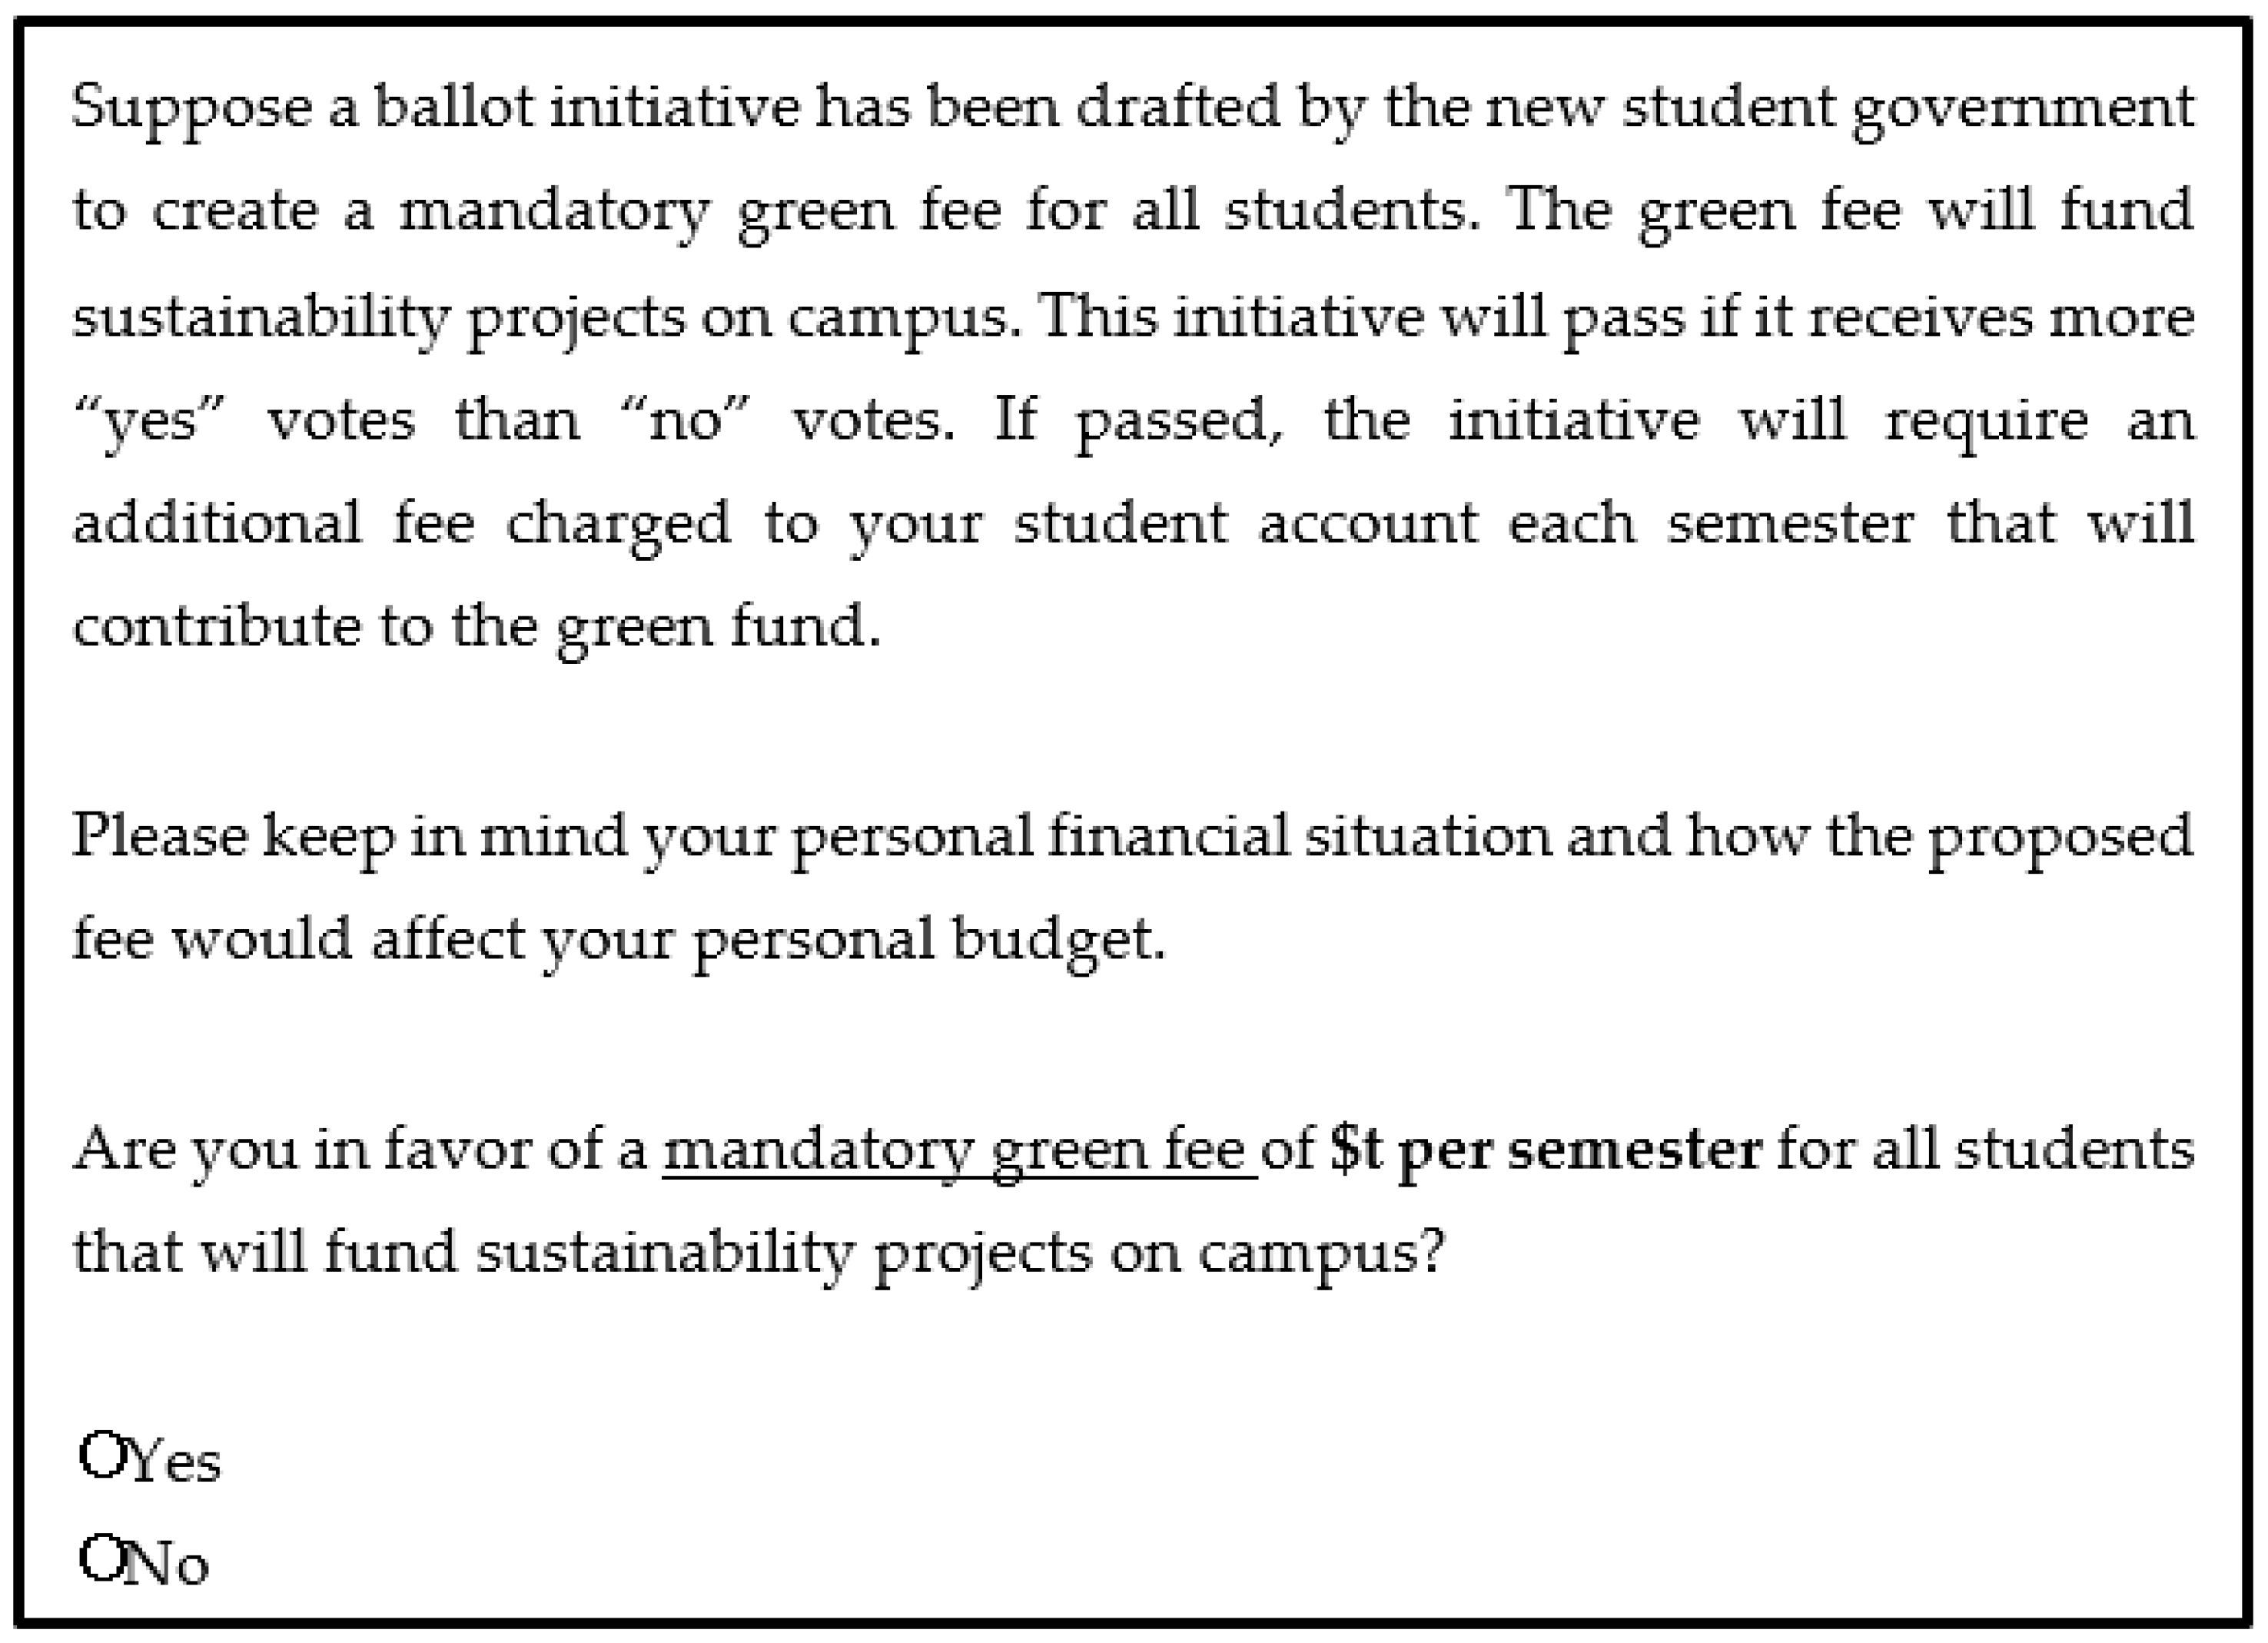
3.1. Materials

To answer our two research questions, we designed and distributed an online survey to all undergraduate students at Manhattan College, a private regional college in New York City. Following best practices from research on personal behaviors and given the ease and speed of online instruments targeting connected, tech-savvy populations, we employed an online survey [21,22,23]. The survey was developed from existing studies and following best practices of survey design [24]. After the survey was built, we obtained feedback through a pilot study. The questions used in this manuscript were built following and improving the questionnaire used in [2]. In particular, we improved the green fee question used in their study. Instead of using a payment card that presented students with different payment amounts, we randomly presented a different green fee amount to each student, thus improving the incentive compatibility of the question [25,26]. Incentive compatibility was achieved through the use of a single binary-choice question, consisting of a status quo (i.e., no change) versus a change, for each respondent [25]. The survey was part of an overarching project to study green attitudes and behaviors among college students and is available as supplementary material. The survey was used to study other research questions that are not part of this manuscript. For example, the survey included questions about climate change and trust in news sources that were studied in a different published article [27]. Therefore, only some of the questions were used in this study.
We surveyed a population of 3495 undergraduate students and received 803 total responses, for a response rate of around 23%. An initial email containing a link to the online survey was distributed to the entire undergraduate population in April 2018. Over the next month, five reminder emails were sent to those respondents who did not yet completed the survey. We incentivized students to complete the survey by offering an opportunity to participate in a raffle for one of ten $25.00 Amazon gift cards. The Qualtrics survey was only accessible via a link sent directly to the students’ emails, which ensured that each respondent only completed the survey once.
We collected demographic and college-related information, as approved by the Institutional Review Board. We provide summary statistics in Table 1.
Manhattan College is composed of six schools: School of Engineering, School of Liberal Arts, School of Science, School of Business, School of Education, and School of Graduate and Professional Studies. Our summary statistics focused on traditional undergraduate students by removing students from the School of Graduate and Professional Studies and respondents outside of the age range of 18–25. The sample was reduced to 699 complete responses after cleaning the data. Importantly, we note that female students were overrepresented within our sample, but this has been observed in surveys with similar populations [2,28,29]. Environmental course, environmental group, and non-meat diet were chosen to control for environmental preference and knowledge (refer to survey). We defined non-meat diet as students who were either vegetarian, vegan, or pescatarian at the time of the survey.
Table 1 also compares sample averages with university averages, when available. We recognize that our sample could have been more representative of our college. Nonetheless, we can still obtain insights from the analysis keeping in mind that we have an over-representation of certain variables, such as female students.
Moreover, we acknowledge that we probably had an overrepresentation of environmentally minded students since about 50% of our sample had been involved in any environmental groups, environmental volunteer activities, or environmental donation projects. Furthermore, 45% had taken an environmental-related course. In terms of political affiliations, our sample was diverse, with 40% Democrats, 18% Republican, 15% Independent, and 26% without affiliation.
Lastly, we compared our sample statistics to statistics of college students in the U.S., when available. About 55% of undergraduate American college students are Caucasian, and about 20% are Hispanic or Latino [30]. The percentage of Hispanic students was similar in our sample. For gender, about 45% of college students are male [30], which was between our sample and population. According to the Center for First-Generation Student Success, 24% of students had parents with no secondary education in the 2015–2016 academic year [31], which was below proportion of first-generation students in our sample. The average age of undergraduate students is 21.8 years old [30].

3.2. Methods

We first describe the methods used to answer our two research questions: (1) “Do students support a mandatory green fee to fund sustainability projects on campus?” and (2) What is the average willingness to pay to fund sustainability on campus?” We followed a stated preference technique by asking a single-choice contingent valuation question, where students indicated their support for the implementation of a hypothetical mandatory green fee instituted per semester to fund sustainability projects on campus. Stated preference methods are used to estimate values for environmental services and other outcomes in which revealed preference data are not available [25]. While revealed preferences allow researchers to use market data, stated preference methods are used to estimate values that cannot be observed in current markets or conditions. Since the college does not have a green fee, we had to use a stated preference technique.
Within stated preference techniques, different format questions can be utilized, including a single-bounded, dichotomous choice, contingent valuation question, in which the respondents face a referendum-type question where they approve or reject a proposal. We built our contingent valuation question following [2] and included their same introduction statement prior to the question. However, we asked a different question and provided different choices. Instead of asking “What is the maximum dollar amount per semester for which a student would vote “yes” on this referendum for a mandatory green fee?” and using a payment card ranging from $0 to $100 in $5 increments, we asked a referendum-type question with a specific fee as illustrated by our question in Figure 1.
Respondents were randomly displayed one out of five fee amounts ($t): $5, $10, $15, $20, or $25. These monetary values were in line with green fee values from colleges and universities. The authors of [1] found that as of 2010, most green fee programs had fees between $5 and $25 per year. The question resembled a student body ballot referendum, which was recommended by the authors of [1] as a crucial step in establishing a green fee. Following [25], we designed a contingent valuation question that provided a clear opt-out choice (or status quo) and that appeared consequential. In particular, we created a realistic scenario with a clear reject option. We also asked students to consider their budget constraints and explained the purpose of the green fee. We advance the green fee literature because we employed a single-bounded, dichotomous choice, referendum question that improved incentive compatibility relative to the payment card [25,26] used in [2]. The question did not include specifics about the sustainability projects because green fee funds are typically allocated through a competitive application process after the fee is established, as described within the literature review section. A major objective of this research was to gather and analyze data to design and create a green fee. Surveying the student body to examine students’ willingness to pay was the first step to attain this purpose, as recommended by [14].
Following [32], we further examined the support for the introduction of a mandatory green fee to fund sustainability projects on campus by employing a discrete choice model to analyze the contingent valuation question. We advance the literature because previous work did not use discrete choice models, which are most appropriate for contingent valuation questions. In particular, the authors of [2] used OLS and maximum likelihood interval regressions to analyze the results for their green fee question.
Following the utility difference approach of [33], the authors of [32] offered both parametric and non-parametric estimations for analyzing single-bounded discrete choice data. Let the true indirect utility function of an individual be U ( q ,   y ) , where q is the level of sustainability on campus and y is the individual’s income. We valued a change in utility from q 0 to q 1 . Using the Hicksian compensating variation, C , the value of the change in sustainability on campus satisfied U ( q 1 ,   y C ) = U ( q 0 , y ) , and C could be interpreted as the maximum WTP [32].
We assume that each student knows his/her true indirect utility function. Since the contingent valuation question asked: “Are you in favor of a mandatory green fee of $t per semester for all students that will fund sustainability projects on campus?” a student answered “yes” as long as U ( q 1 , y t ) U ( q 0 ,   y ) . Following random utility theory, an individual’s utility has a random component, as a researcher cannot observe the true indirect utility function: U ( q , y ) = V ( q , y ) + ε [32]. Therefore, an individual chooses “yes” given $t fee if V ( q 1 ,   y t ) + ε 1 V ( q 0 ,   y ) + ε 0 . The indirect utility function can take a linear form. A student chose “yes” faced with a $t fee as long as V 1 V 0 = α + β t + ε 0 . Under the parametric estimation, we controlled for the way individual characteristics that influence students’ WTP through α , which is defined as a function of individual characteristics: α = γ + k = 1 K 1 γ k X k , where X k ,   k = 1 , , K 1 , are the individual’s characteristics and γ k represents the parameters to be estimated [32].
For each parametric model, we included the green fee value (or its natural log) and individual characteristics summarized in Table 1. From these parametric estimations, we conducted statistical tests associated with the significance of the coefficients in the models. Specifically, each hypothesis test examined whether an estimated coefficient was statistically different from zero. Importantly, our first hypothesis was to test whether the green fee value (or its natural log) had a negative and statistically significant coefficient. Following economic theory, the higher the fee, the less likely students should be willing support it. Following previous research [2], our other hypothesis was whether the gender coefficient was significantly different from zero.
We estimated the parameters of the linear form to estimate the mean and median WTP following some distributional assumptions for the error term. While parametric estimation assumes a distribution, nonparametric estimation techniques offered empirical methods to estimate mean and median WTP without such assumption [34]. Thus, we used both parametric and non-parametric approaches to offer the most reliable WTP range by using incentive-compatible contingent valuation techniques.

4. Results

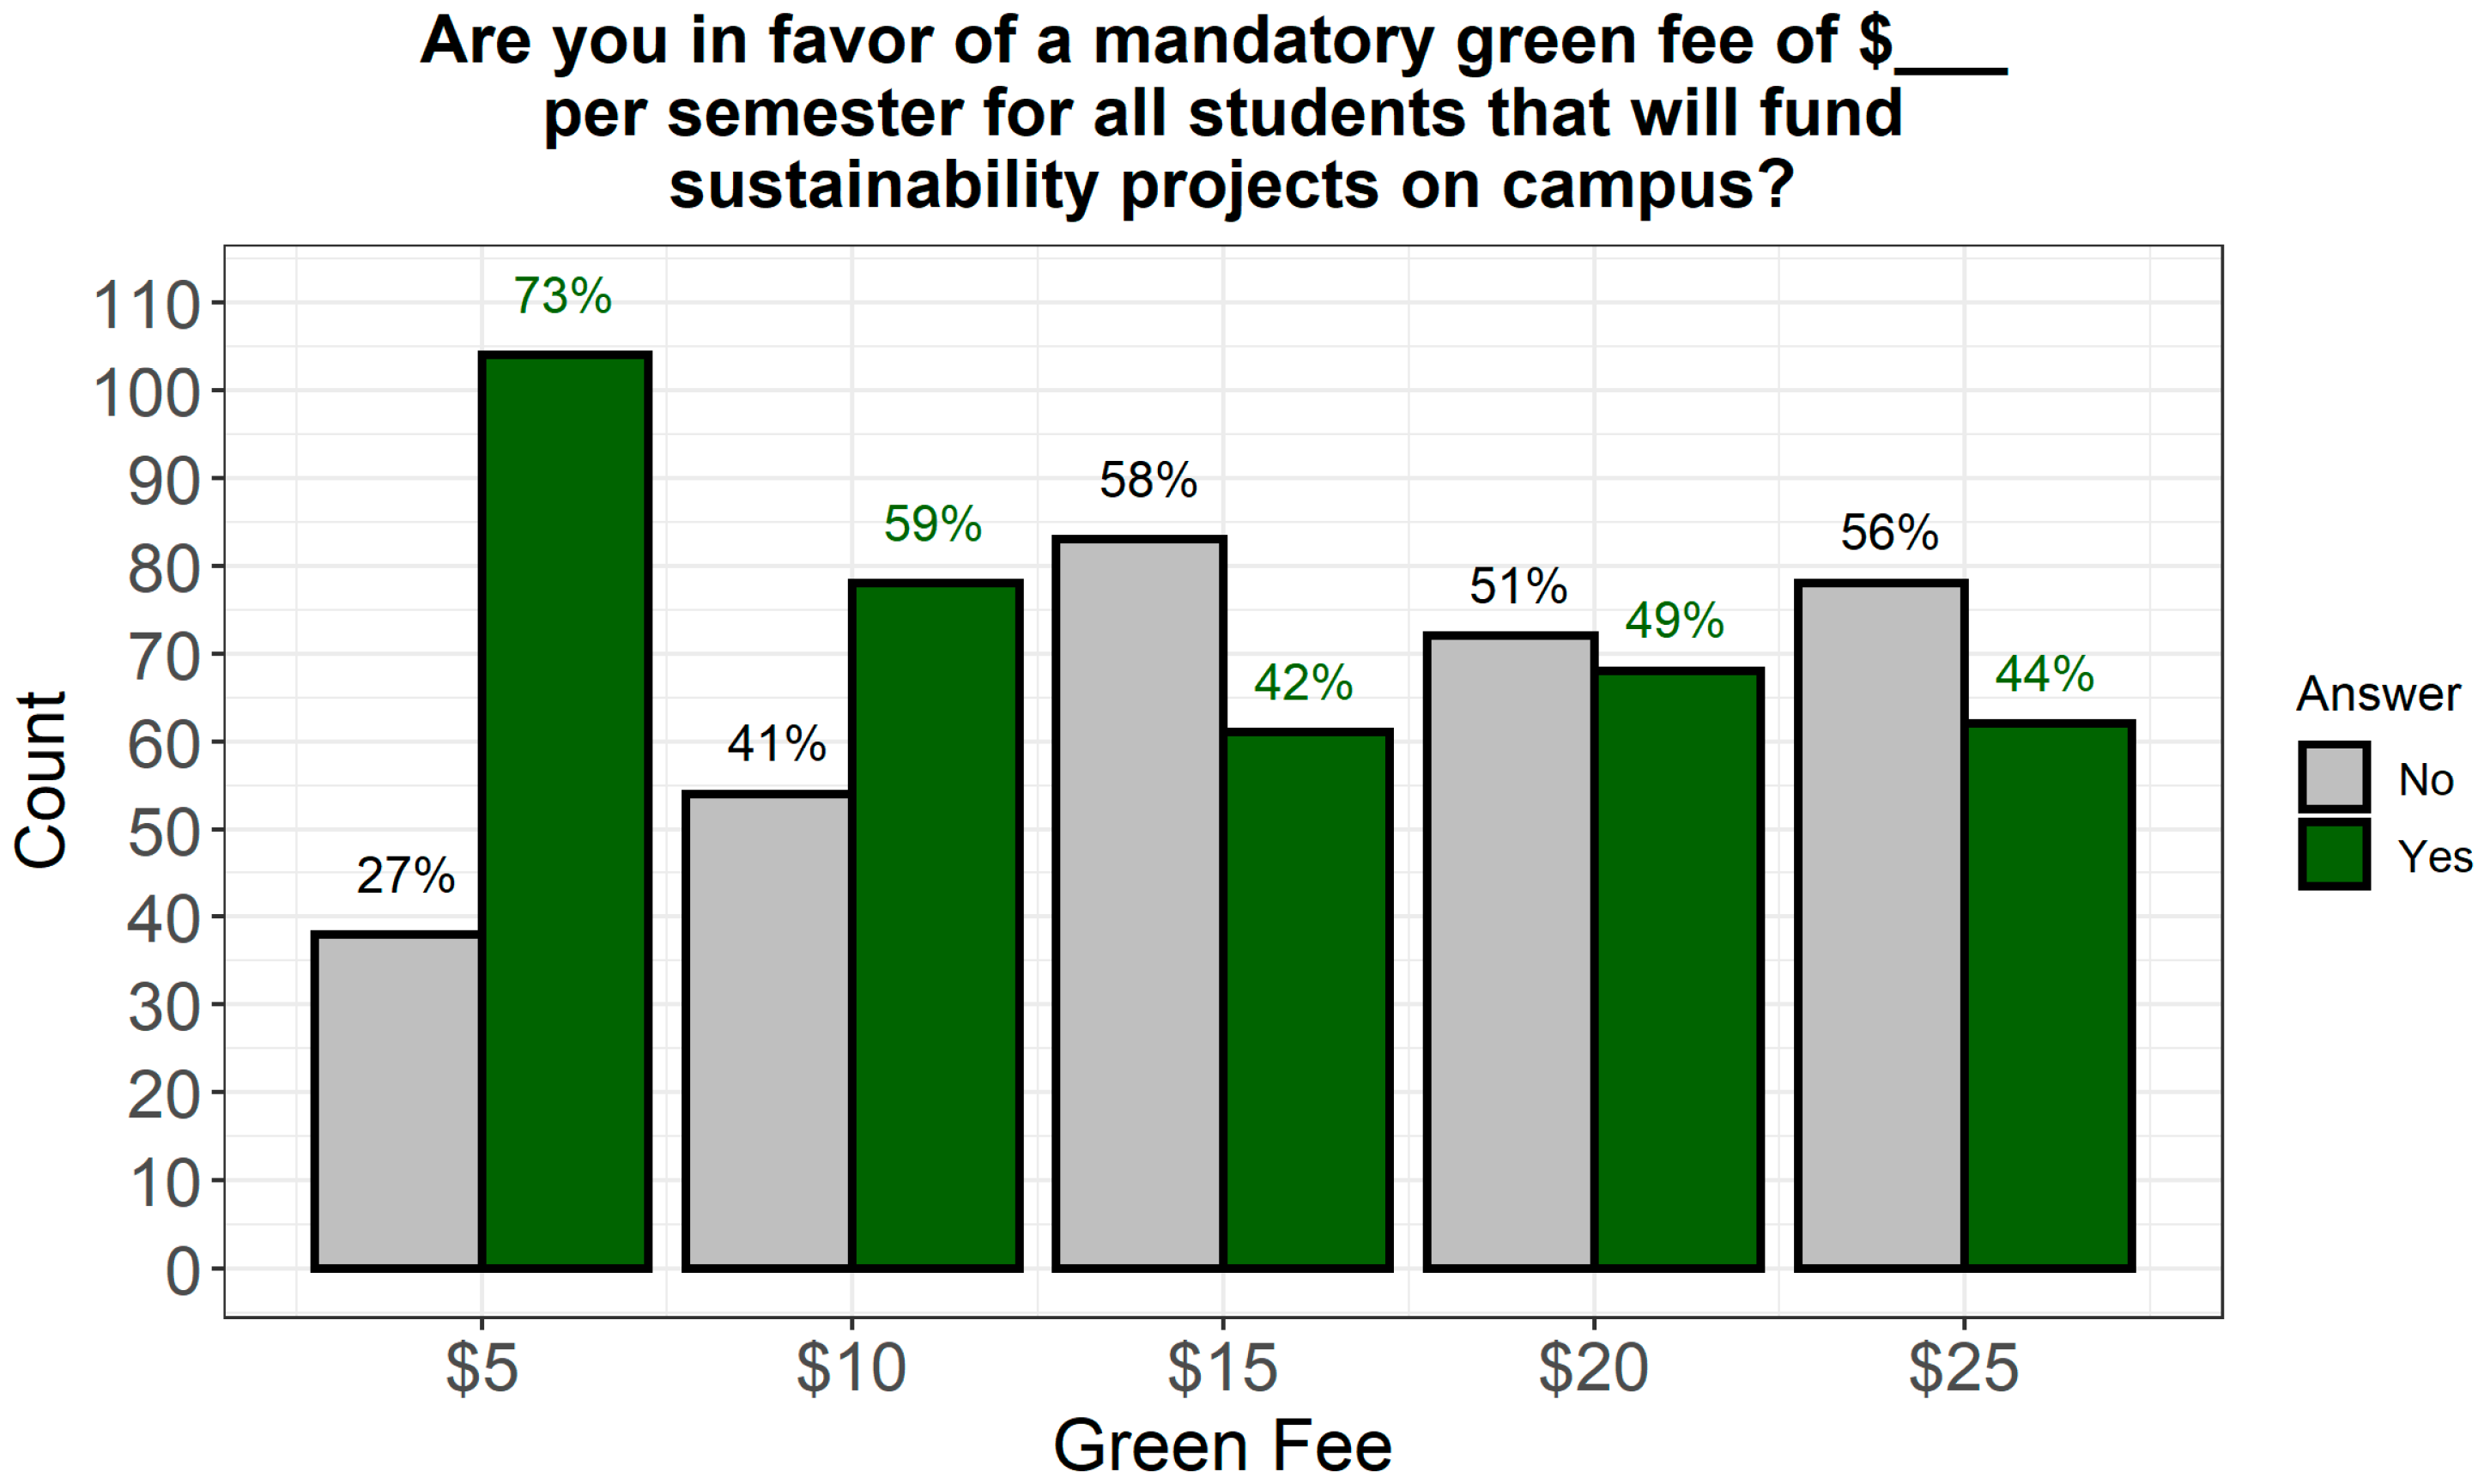
4.1. Support for a Green Fee

To answer our first research question, we examined the ballot initiative responses. Figure 2 shows the results from the green fee support question.
For the lowest fee value, there was a strong support among students, with 104 students (73%) that approved a $5 mandatory green fee and 38 students (27%) that rejected the proposal. For the second monetary value, 78 students (59%) supported a $10 fee, while 54 (41%) were against it. For the remaining values, there were more students against, but the contrast between the counts was not as sharp as for the $5 fee. For $15, 61 students (42%) supported it, and 83 (58%) were against it. For $20, 68 students (49%) selected yes, while 72 (51%) selected no. Lastly, for $25, 62 (44%) supported the fee, while 78 (56%) rejected it. Overall, a clear support for green fee values of $5 and $10 was observed. As expected, the support was stronger for lower values. Even though more students rejected the proposal for the higher values, at least 40% of students supported the green fee within these groups. In other words, the distribution of responses offered evidence of support among students. Support for higher fee values may be interpreted as students valuing sustainability more and their willingness to support more sustainability projects on campus. After aggregating the results to include all fee values, we found that 373 students (53.4%) supported the green fee ballot while 325 students (46.6%) rejected the proposal. Following the green fee steps recommended in [14], we completed the first step of polling students to examine the support of a green fee. In the following subsection, we performed a willingness-to-pay analysis to choose a green fee amount to be implemented, which was the second step [14].

4.2. Willingness to Pay to Support Sustainability on Campus

Using the DCchoice R package [35], we estimated a single-bounded dichotomous choice model using both parametric and non-parametric approaches described in the previous section. Both approaches were implemented to offer the most comprehensive range of estimates possible, as this was the first study to perform such analysis for a green fee. Moreover, we report our complete estimation results to offer transparent documentation of our research process, as recommended by the literature [15]. For robustness, we estimated four parametric models with different distributional assumptions of the error term: log-logistic, log-normal, logistic, and normal and two non-parametric models using both the Kriström [36] and Kaplan–Meier–Turnbull [37] methods. In our parametric estimations, we included different demographic and college-related characteristics that may have influenced a student’s choice of voting in favor or against the green fee. Most importantly, all these models included the green fee value, denoted as bid in our regressions. For the log-logistic and log-normal models, we included the natural log of the bid. Table 2 includes our estimation results for the parametric models.
Table 2 shows that the models were fairly consistent across distributional assumptions of the error term. While the coefficients are not directly interpretable, we highlight the sign and statistical significance of age, environmental group membership, environmental course, republican political affiliation, non-meat diet (for model III only), and the bid value. These coefficients had the expected sign. We confirmed the hypothesis that the green fee value (or its log) has a negative and statistically significant coefficient, matching economic theory. For our second hypothesis, we did not find gender differences. It is plausible that the conflicting gender results found in the previous two studies [2,19] disappeared by controlling for environmental experiences or behaviors (e.g., environmental group membership, environmental course, and non-meat diet) that were not included in their models.
To answer our second research question, we estimated the mean and median WTP using both parametric and non-parametric models following the literature [35,36,37,38] and by employing the DCchoice R package. For the mean, our parametric estimations were truncated at the maximum bid, which was $25 in our survey. We also estimated the 95% confidence interval using a bootstrap method with 1000 replications for the parametric models. Table 3 summarizes our findings.
Table 3 shows that the average WTP was between $14 and $15. The median WTP was between $15 and $18, with confidence intervals that went from approximately $13 to about $20. To complement this parametric analysis, we included non-parametric estimates, which did not assume any distribution. Table 4 summarizes the non-parametric results.
We employed the Kaplan–Meier-Turnbull mean estimate, which is based on the area under the survival probability [32]. Both non-parametric methods showed that the mean WTP was around $13. The Kaplan–Meier–Turnbull method offered a range for the median WTP, as it uses a step survival function. The median WTP was between $10 and $15 when using this method and about $13 when using the Kriström method. Relative to the parametric models, these estimates were slightly lower, because the Kaplan–Meier–Turnbull estimates are the lower bounds of these mean and median statistics [32].
Using both parametric and non-parametric methods, our study indicated that the mean WTP was between $13 and $15 and the median WTP was between $10 and $18. However, since the parametric estimations of the WTP required distributional assumptions, nonparametric approaches offered a purely empirical method that do not require such assumptions [32]. Thus, we relied on non-parametric results to offer recommendations while still presenting the different estimation results for completeness and transparency. From these estimations, we concluded that students valued an increase in sustainability on campus and supported the green fee proposal. However, since our sample likely had more environmentally-minded students, we recommend a green fee towards the lower values of the non-parametric median WTP range estimates (e.g., $10 or $13). Since the non-parametric estimates did not impose distributional assumptions, these estimates were more reliable. Moreover, since the median WTP was considered a more robust measure of central tendency [33], we narrowed our attention to it. We also note that, given the high cost of living in New York City, these values should be attainable for students and should not be as burdensome. As students are accustomed to the financial circumstances of living in New York City, they may perceive higher fee values as more attainable relative to students living in areas with lower costs of living. It can be asserted that a lower fee of $10 or $13 would be comparable to the cost of a regular lunch in New York City. With that being said, we believe lower values to be very financially realistic for students residing in a city with a high cost of living.

5. Discussion

Several college and universities support campus sustainability initiatives because they recognize their importance in addressing climate change and protecting our future. Some schools use a mandatory student green fee to finance such initiatives through a green fund that is typically managed by a group of students and faculty [6]. Green fees have multiple benefits beyond financing sustainability projects, including empowering students and offering them active roles [6]. Students from all majors and backgrounds can contribute to greener campuses through projects funded by a green fee. These experiences offer concrete opportunities for students to actively work toward a more sustainable future.
Our manuscript was motivated by the desire to establish a new mandatory student green fee to fund sustainability projects at Manhattan College following other academic institutions. The literature on green fees is limited to two reports [1,14] and two peer-reviewed articles [2,16], showing the gap in the literature on this subject and the need for more research to examine and understand this way of funding sustainability on university campuses. The two reports [1,14] provided information on existing fees and suggested steps to establish one. Following the recommended steps of [14], we surveyed students to assess the support for a green fee and to perform a WTP analysis. Moreover, we provided a recommendation for a green fee value. Our research differed from the two peer-reviewed publications on green fees [2,16] in two distinct ways. First, we designed an incentive-compatible dichotomous referendum question, which differed from the open-ended question used in [16] and that improved the payment card mechanism in [2]. As a result, our research contributes to the literature by being the first to use an incentive-compatible question to study the support for a green fee. Secondly, our research design allowed us to estimate the mean and median WTP using both parametric and non-parametric discrete choice models, which have not been used in the existing green fee literature, as described in the literature review. As a result, our work advances the green fee literature by offering the first and most reliable range of WTP estimates thus far. Moreover, our manuscript describes clear research steps to examine the support for establishing a green fee and estimating students’ WTP, which can be followed by other institutions.
In this manuscript, we answered two research questions. First, we assessed the support for a new mandatory green fee on campus using a referendum-type ballot question. We found that the majority of students supported the establishment of a green fee. As expected, there was more support for lower fee values, with $5 and $10 having the highest support. For the $15, $20, and $25 values, most students rejected the proposal, but at least 40% supported it.
To the best of our knowledge, we are the first paper to estimate the mean and median WTP to support sustainability initiatives through a green fee using both parametric and non-parametric discrete choice models, providing the most reliable range of estimates to date. Previous peer-reviewed research used open-ended [16] or payment card [2] questions and limited the analysis to regression analysis without estimating mean or median WTP. Using a single-bounded discrete choice contingent valuation model, we advanced the green fee literature by improving incentive compatibility and by estimating mean and median WTP. We answered our second research question and estimated the mean and median WTP to be between $13 and $15 and between $10 and $18, respectively, using both parametric and non-parametric methods. However, since parametric estimates are free of distributional assumptions, they offer more reliable estimates. As a result, our recommendations were based on the non-parametric analyzes. Moreover, since our sample was likely composed of more environmentally-minded students, we recommend a green fee in the lower values of the non-parametric median WTP range estimates, which were found to be between $10 and $13.
Using our research results, we suggest following the recommendations of [1] and presenting evidence to the student government. The student government may put forward a green fee ballot/referendum among the entire student body. If the ballot is supported by a simple majority, the student government should bring this proposal to senior administrators and, ultimately, the board of trustees for final approval. While our sample was from a private regional college in New York City, our results offer insights for similar institutions. Importantly, we hope other academic institutions follow our steps in researching the support for a green fee and on suggesting a green value for it, which are critical steps in the establishment of a green fee. Research-based initiatives to attain greener campuses may receive more support by administrators and members of boards of trustees. Since the research on green fees is limited to two peer-reviewed articles and this manuscript, we also highlight the need for more research on green fees and similar initiatives to promote sustainability and greener campuses.

6. Limitations

While our research contributes to the literature by offering a research path to examine the support for a green fee and to study students’ willingness to pay, it had some limitations. While we considered our sample and the likely over-representativeness of environmentally-minded students in our recommendations, more research may be done to understand the sensitivity of the results to sample characteristics. Secondly, since our research was based on a single private university in the United States, the generalizations of our results to other types of institutions and countries is limited. However, the steps and methods illustrated in this manuscript are applicable to other institutions and countries. We emphasize that a major contribution of our research is to offer the steps to conduct a WTP analysis with the purpose of establishing a green fee using incentive-compatible contingent valuation methods.

7. Future Research

Given the limitations of our research, studies at other types of universities and in other countries are needed to further examine students’ support for green fees and their willingness to pay. Moreover, the difference between stated preference and revealed preferences estimates may be explored. In particular, future research can compare estimation differences derived from a stated preference survey and a referendum by the student government at a university. While we framed the contingent valuation question in such a way that the green fee would fund sustainability projects on campus, future research may also include WTP questions connected to specific projects to be funded.

Supplementary Materials

The following are available online at https://www.mdpi.com/2071-1050/13/5/2528/s1, Document S1: Survey.

Author Contributions

J.G.-R. led the literature review with help and feedback from H.C. and S.A.. Every author participated in the research design, survey creation, and data collection. J.G.-R. completed the data analysis and data visualization. J.G.-R. led the first draft of the manuscript. H.C. and S.A. offered feedback. Thus, the three authors participated in the editing process of the manuscript. J.G.-R. led the revisions with input from H.C. All authors have read and agreed to the published version of the manuscript.

Funding

This research was supported by the Gabriel Hauge Fellowship, the Dean’s Office at the O’Malley School of Business, and the Jasper Summer Research Scholars Program at Manhattan College. In addition, this research benefitted from support from the National Science Foundation and the AEA Mentoring Program (NSF Awards #1357478 & 1730651).

Institutional Review Board Statement

The study was conducted according to the guidelines of the Institutional Review Board of Manhattan College (Approved on 27 March 2018).

Informed Consent Statement

Informed consent was obtained from all subjects involved in the study. The consent statement was included at the top of the survey, which is available as supplemental material.

Data Availability Statement

Data sharing is restricted due to privacy. All materials, data, and protocols were approved by the Institutional Review Board. Due to IRB privacy policies, our data cannot be shared. Our survey instrument is included as supplementary material.

Acknowledgments

We acknowledge that Veronica Cheng was part of the survey and data collection, but she focused on a different research question. We also thank the Cindy Duggan, Jake Holmquist, and members of the Information Technology Services from Manhattan College, who helped with the distribution of the survey. We are grateful for the feedback obtained at the O’Malley School of Business Seminar Series, Eastern Economic Association (EEA) conference, at the Association for Environmental and Resource Economists (AERE) sessions at the Midwest Economic Association (MEA) conference, and at the Association for the Advancement of Sustainability Conference (AASHE) conference. We acknowledge Andrew Meyer for sharing his survey instrument with us. Lastly, we thanked the anonymous reviewers for their feedback and suggestions that helped us improve the manuscript.

Conflicts of Interest

The authors declare no conflict of interest.

References

  1. Ozeki, M.A. Student Green Fund Implementation in US Colleges and Universities from 1973–2010; Harvard Extension School: Boston, MA, USA, 2010. [Google Scholar]
  2. Meyer, A.; Yang, G. How Much versus Who: Which Social Norms Information is More Effective? Appl. Econ. 2016, 48, 389–401. [Google Scholar] [CrossRef]
  3. Sustainable Endowments Institute. The College Sustainability Report Card. Available online: http://www.greenreportcard.org/ (accessed on 8 January 2020).
  4. The Princeton Review Green Colleges | The Princeton Review. Available online: https://www.princetonreview.com/college-rankings?rankings=green-colleges (accessed on 8 January 2020).
  5. Association for the Advancement of Sustainability in Higher Education (AASHE) STARS, Sustainability Tracking Assessment & Rating System. Available online: https://stars.aashe.org/ (accessed on 8 January 2020).
  6. Krumbein, A.; Martinez, M.; Rappaport, B.; Springsteen, L.; Xie, A. Green Fee Strategy for the University of Michigan; University of Michigan: Ann Arbor, MI, USA, 2010; pp. 1–71. [Google Scholar]
  7. Zhao, S.; Song, Q.; Wang, C. Characterizing the Energy-Saving Behaviors, Attitudes and Awareness of University Students in Macau. Sustainability 2019, 11, 6341. [Google Scholar] [CrossRef] [Green Version]
  8. Ma, Y.; Men, J.; Cui, W. Does Environmental Education Matter? Evidence from Provincial Higher Education Institutions in China. Sustainability 2020, 12, 6338. [Google Scholar] [CrossRef]
  9. Kukkonen, J.; Kärkkäinen, S.; Keinonen, T. Examining the Relationships between Factors Influencing Environmental Behaviour among University Students. Sustainability 2018, 10, 4294. [Google Scholar] [CrossRef] [Green Version]
  10. Situmorang, R.O.P.; Liang, T.-C.; Chang, S.-C. The Difference of Knowledge and Behavior of College Students on Plastic Waste Problems. Sustainability 2020, 12, 7851. [Google Scholar] [CrossRef]
  11. Sandoval Hamón, L.A.; Martinho, A.P.; Ramos, M.R.; Bayas Aldaz, C.E. Do Spanish Students Become More Sustainable after the Implementation of Sustainable Practices by Universities? Sustainability 2020, 12, 7502. [Google Scholar] [CrossRef]
  12. Conner, D.; Falkner, A.; Lantieri, N.; McGavisk, B.; McShea, B. Stakeholder Perceptions of Campus Sustainability Efforts: Lessons from Vermont. Sustainability 2018, 10, 3849. [Google Scholar] [CrossRef] [Green Version]
  13. Abubakar, I.R.; Al-Shihri, F.S.; Ahmed, S.M. Students’ Assessment of Campus Sustainability at the University of Dammam, Saudi Arabia. Sustainability 2016, 8, 59. [Google Scholar] [CrossRef] [Green Version]
  14. Indvik, J.; Foley, R.; Orlowski, M. Green Revolving Funds: An Introductory Guide to Implementation & Management; Sustainable Endowments Institute: Cambridge, MA, USA, 2013. [Google Scholar]
  15. Rappaport, A. Campus Greening Behind the Headlines. Environ. Wash. 2008, 50, 7–16. [Google Scholar] [CrossRef]
  16. Rosentrater, K.A.; Burke, B.R. University Students and Sustainability. Part 1: Attitudes, Perceptions, and Habits. J. Sustain. Educ. 2017, 16, 25. [Google Scholar]
  17. Naz, F.; Oláh, J.; Vasile, D.; Magda, R. Green Purchase Behavior of University Students in Hungary: An Empirical Study. Sustainability 2020, 12, 10077. [Google Scholar] [CrossRef]
  18. Uehara, T.; Ynacay-Nye, A. How Water Bottle Refill Stations Contribute to Campus Sustainability: A Case Study in Japan. Sustainability 2018, 10, 3074. [Google Scholar] [CrossRef]
  19. Attaran, S.; Celik, B.G. Students’ Environmental Responsibility and Their Willingness to Pay for Green Buildings. Int. J. Sustain. High. Educ. 2015, 16, 327–340. [Google Scholar] [CrossRef]
  20. Kim, Y.; Kling, C.L.; Zhao, J. Understanding Behavioral Explanations of the WTP-WTA Divergence through a Neoclassical Lens: Implications for Environmental Policy. Annu. Rev. Resour. Econ. 2015, 7, 169–187. [Google Scholar] [CrossRef] [Green Version]
  21. Ajzen, I. The Theory of Planned Behavior. Organ. Behav. Hum. Decis. Process. 1991, 50, 179–211. [Google Scholar] [CrossRef]
  22. Meyer, A. Heterogeneity in the Preferences and Pro-Environmental Behavior of College Students: The Effects of Years on Campus, Demographics, and External Factors. J. Clean. Prod. 2016, 112, 3451–3463. [Google Scholar] [CrossRef] [Green Version]
  23. Sills, S.J.; Song, C. Innovations in Survey Research: An Application of Web-Based Surveys. Soc. Sci. Comput. Rev. 2002, 20, 22–30. [Google Scholar] [CrossRef]
  24. Dillman, D.A.; Smyth, J.D.; Christian, L.M. Internet, Phone, Mail, and Mixed-Mode Surveys: The Tailored Design Method; John Wiley & Sons: Hoboken, NJ, USA, 2014. [Google Scholar]
  25. Johnston, R.J.; Boyle, K.J.; Adamowicz, W.; Bennett, J.; Brouwer, R.; Cameron, T.A.; Hanemann, W.M.; Hanley, N.; Ryan, M.; Scarpa, R.; et al. Contemporary Guidance for Stated Preference Studies. J. Assoc. Environ. Resour. Econ. 2017, 4, 319–405. [Google Scholar] [CrossRef] [Green Version]
  26. Vossler, C.A.; Holladay, J.S. Alternative Value Elicitation Formats in Contingent Valuation: Mechanism Design and Convergent Validity. J. Public Econ. 2018, 165, 133–145. [Google Scholar] [CrossRef]
  27. Cheng, H.; Gonzalez-Ramirez, J. Trust and the Media: Perceptions of Climate Change News Sources Among US College Students. Postdigit Sci. Educ. 2020. [Google Scholar] [CrossRef]
  28. Annabi, A.; González-Ramírez, J.; Müller, F. What Determines Financial Knowledge among College Students? J. Financ. Educ. 2018, 44, 344–366. [Google Scholar]
  29. Gonzalez-Ramirez, J.; Mulqueen, K.; Zealand, R.; Silverstein, S.; Reina, C.; BuShell, S.; Ladda, S. Emergency Online Learning: College Students’ Perceptions during the COVID-19 Pandemic. Coll. Stud. J. 2021, in press. [Google Scholar]
  30. Bustamante, J. College Enrollment & Student Demographic Statistics. Available online: https://educationdata.org/college-enrollment-statistics (accessed on 29 January 2021).
  31. Center for First-Generation Student Success. Fact Sheet 1: Demographic Characteristics and Postsecondary Enrollment. Available online: https://firstgen.naspa.org/7A515490-E6AA-11E9-BAEC0242AC100002 (accessed on 29 January 2021).
  32. Aizaki, H.; Nakatani, T.; Sato, K. Stated Preference Methods Using R; CRC Press/Taylor & Francis Group: Boca Raton, FL, USA, 2014; ISBN 978-1-4398-9048-6. [Google Scholar]
  33. Hanemann, M. Welfare Evaluations in Contingent Valuation Experiments with Discrete Responses. Am. J. Agric. Econ. 1984, 66, 332–341. [Google Scholar] [CrossRef]
  34. Bateman, I.J.; Carson, R.T.; Day, B.; Hanemann, M.; Hanley, N.; Hett, T.; Jones-Lee, M.; Loomes, G.; Mourato, S.; Özdemirog lu, E.; et al. Economic Valuation with Stated Preference Techniques: A Manual.; Edward Elgar Publishing Ltd.: Cheltenham, UK, 2002; ISBN 1843769194. [Google Scholar]
  35. Nakatani, T.; Aizaki, H.; Sato, K. Package ‘DCchoice’. CRAN 2016. Available online: https://cran.microsoft.com/snapshot/2016-08-02/web/packages/DCchoice/DCchoice.pdf (accessed on 30 December 2020).
  36. Kriström, B. A Non-Parametric Approach to the Estimation of Welfare Measures in Discrete Response Valuation Studies. Land Econ. 1990, 66, 135–139. [Google Scholar] [CrossRef]
  37. Carson, R.T.; Hanemann, W.M. Chapter 17 Contingent Valuation. In Handbook of Environmental Economics; Valuing Environmental Changes; Mler, K.-G., Vincent, J.R., Eds.; Elsevier: Amsterdam, The Netherlands, 2005; Volume 2, pp. 821–936. [Google Scholar]
  38. Hanemann, M.; Kanninen, B. Chapter 11 The Statistical Analysis of Discrete-Response CV Data. In Valuing Environmental Preferences: Theory and Practice of the Contingent Valuation Method in the US, EU, and Developing Countries; Oxford University Press on Demand: Oxford, UK, 2001; Volume 302. [Google Scholar]
Figure 1. Green fee contingent valuation question.
Sustainability 13 02528 g001
Figure 2. Green fee support.
Sustainability 13 02528 g002
Table 1. Summary statistics.
VariableType of VariableSample AveragePopulation Average
MaleDummy0.35190.5362
CaucasianDummy0.61950.5900
LatinoDummy0.20170.2100
School of BusinessDummy0.21030.2500
School of EngineeringDummy0.28040.3233
School of Liberal ArtsDummy0.25180.2004
School of EducationDummy0.13880.1280
School of ScienceDummy0.11870.0943
AgeNumeric20.070120.6000
Grade Point Average (GPA)Numeric3.33393.1200
First generationDummy0.33480.3300
Hours worked per weekNumeric8.2190
AthleteDummy0.1187
Environmental courseDummy0.4492
Environmental groupDummy0.4993
Non-meat dietDummy0.0830
DemocratDummy0.4034
IndependentDummy0.1530
No affiliationDummy0.2604
RepublicanDummy0.1831
1 The average for dummy variables is the proportion of the sample for that variable. For example, for the first row, the sample has about 35% male and 65% female.
Table 2. Parametric single-choice discrete model results.
Log-Logistic
(I)
Log-Normal
(II)
Logistic
(III)
Normal
(IV)
Intercept−24.1861 **−14.9015 **−25.5229 **−15.7197 **
(7.4407)(12.1728)(12.1728)(7.4263)
Age2.4576 **1.5139 **2.4649 **1.5191 **
(0.7289)(1.1929)(1.1929)(0.7277)
Age2−0.0575 **−0.0354 **−0.0578 **−0.0356 **
(0.0177)(0.0290)(0.0290)(0.0177)
Male0.01380.00570.01250.0061
(0.1137)(0.1856)(0.1856)(0.1134)
Caucasian0.19630.11420.20440.1202
(0.1117)(0.1822)(0.1822)(0.1114)
First Generation−0.0164−0.0116−0.0030−0.0025
(0.1108)(0.1807)(0.1807)(0.1104)
Republican−0.4175 *−0.2438 *−0.4143 *−0.2435 *
(0.1343)(0.2194)(0.2194)(0.1338)
Job0.34690.19850.32650.1886
(0.1420)(0.2317)(0.2317)(0.1416)
Wage−0.0010−0.0006−0.0010−0.0006
(0.0005)(0.0008)(0.0008)(0.0005)
School of Engineering−0.3586−0.2178−0.3603−0.2192
(0.1478)(0.2411)(0.2411)(0.1474)
School of Arts0.18050.11520.19200.1241
(0.1535)(0.2504)(0.2504)(0.1529)
School of Education−0.2595−0.1571−0.2534−0.1528
(0.1771)(0.2879)(0.2879)(0.1766)
School of Science0.32720.18300.33340.1879
(0.1854)(0.3049)(0.3049)(0.1851)
Environmental Group0.6059 ***0.3712 ***0.5989 ***0.3690 ***
(0.1024)(0.1673)(0.1673)(0.1022)
Environmental Course0.3166 *0.1883 **0.3257 *0.1939 *
(0.1045)(0.1708)(0.1708)(0.1043)
Non-Meat Diet0.54260.30950.5417 *0.3083
(0.1931)(0.3227)(0.3227)(0.1927)
Athlete−0.1140−0.0715−0.1170−0.0711
(0.1582)(0.2583)(0.2583)(0.1577)
ln(bid)−0.8832 ***−0.5386 ***
(0.0900)(0.0118)
Bid −0.0646 ***−0.0396 ***
(0.0118)(0.0071)
N698698698698
Log-Likelihood−436.9631−437.247−439.809−440.027
Pseudo-R20.09370.09320.08780.0874
Adjusted-R20.05640.05580.05050.0501
AIC909.92910.493915.617916.054
BIC991.794992.36997.49997.922
Standard errors in parentheses. Significance levels: * 10%, ** 5%, and *** 1%.
Table 3. Green fee mean and median estimation results from parametric models. WTP: willingness to pay.
DistributionMean WTP95% Confidence IntervalMedian WTP95% Confidence Interval
LowerUpper LowerUpper
Log-logistic$14.77$13.94$15.76$15.69$13.21$20.13
Log-normal$14.78$13.93$15.77$15.67$13.10$19.67
Logistic$14.39$13.40$15.45$17.47$14.90$20.83
Normal$14.37$13.42$15.41$17.44$14.99$20.71
Table 4. Green fee mean and median estimation results from non-parametric models.
MethodMean WTPMedian WTP
Kaplan–Meier–Turnbull$13.37[$10, $15]
Kriström$13.37$13.33
Publisher’s Note: MDPI stays neutral with regard to jurisdictional claims in published maps and institutional affiliations.

