
Economic Transformation and Sustainable Development through Multilateral Free Trade Agreements


Abstract
1. Introduction
2. Model Description
2.1. Heterogenous Firms
2.2. Heterogenous Workers
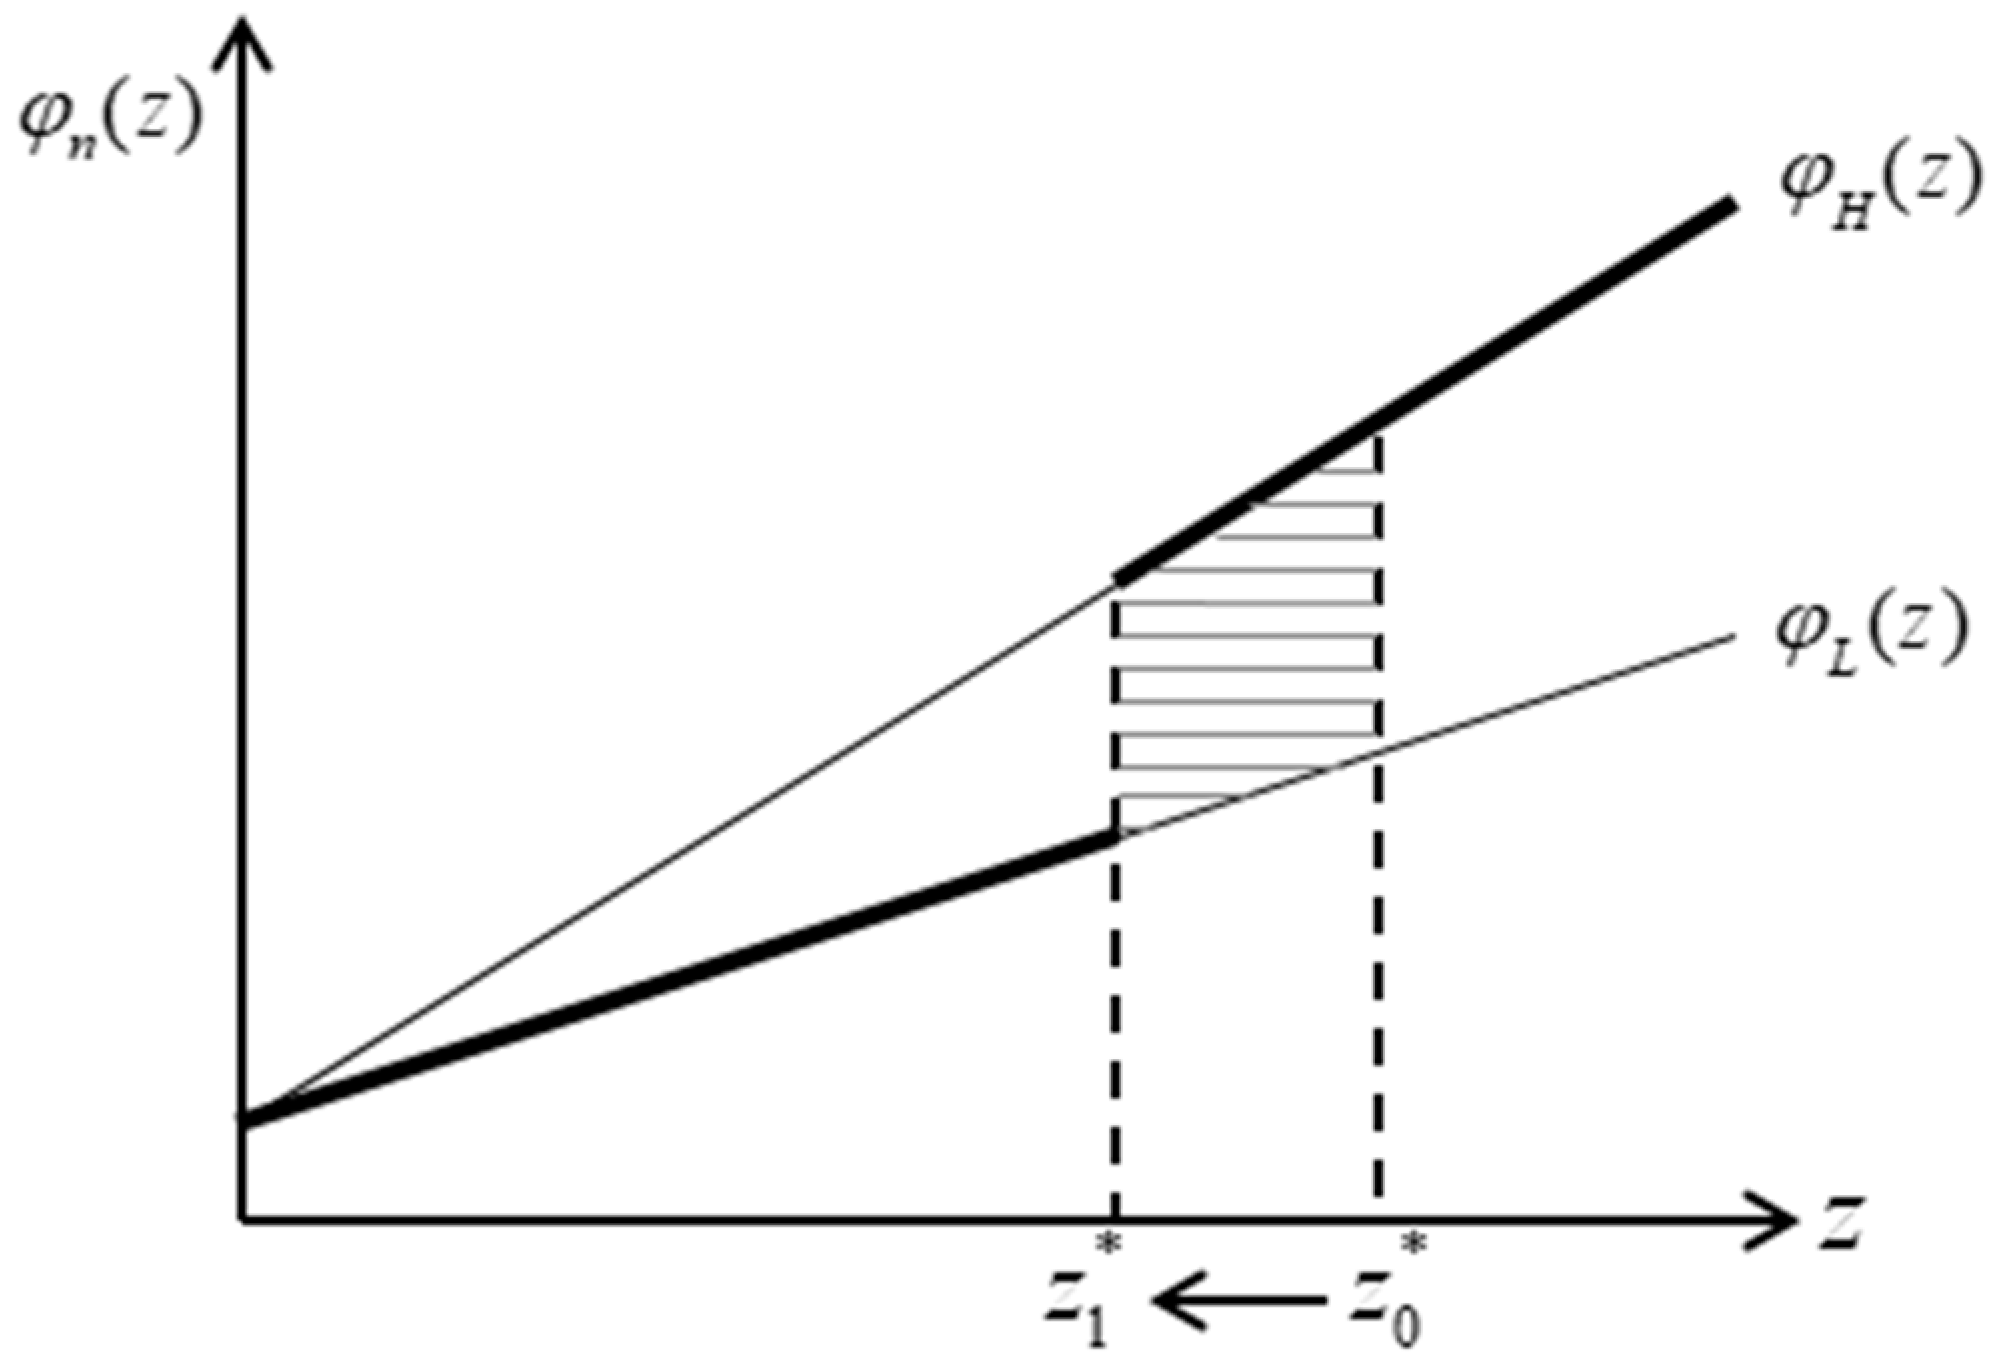
2.3. Technology Upgrading Mechanism
2.4. Global CGE Application
3. Data and Calibration
4. Effects of the RCEP
4.1. Productivity Effects
4.2. Market Structure Effects
4.3. Economic Transformation Effects
5. Conclusions
Funding
Institutional Review Board Statement
Informed Consent Statement
Data Availability Statement
Conflicts of Interest
Appendix A

| 1.1 Times (7.7) | 1.3 Times (9.1) | 1.5 Times (10.5) | 1.7 Times (11.9) | ||
|---|---|---|---|---|---|
| RCEP Members Average | (1) | −24.042 | −24.745 | −34.615 | −53.760 |
| (2) | 0.150 | 0.390 | 0.651 | 0.939 | |
| (3) | −47.729 | −36.954 | −45.195 | −66.576 | |
| (4) | 2.264 | 9.522 | 10.409 | 19.868 | |
| World Average | (1) | −16.730 | −18.026 | −27.130 | −33.904 |
| (2) | −0.065 | 0.159 | 0.385 | 0.483 | |
| (3) | −34.842 | −28.811 | −36.921 | −43.982 | |
| (4) | 1.338 | 7.547 | 10.130 | 11.453 |
References
- Ocampo, J.A.; Rada, C.; Taylor, L. Growth and Policy in Developing Countries: A Structuralist Approach; Columbia University Press: New York, NY, USA, 2009. [Google Scholar]
- McMillan, M.; Page, J.; Booth, D.; te Velde, D.W. Supporting Economic Transformation: An Approach Paper; Overseas Development Institute: London, UK, 2017. [Google Scholar]
- Duarte, M.; Restuccia, D. The role of the structural transformation in aggregate productivity. Q. J. Econ. 2010, 125, 129–173. [Google Scholar] [CrossRef]
- Rodrik, D. Unconditional convergence in manufacturing. Q. J. Econ. 2013, 128, 165–204. [Google Scholar] [CrossRef]
- Timmer, C.P.; Akkus, S. The Structural Transformation as a Pathway out of Poverty: Analytics, Empirics and Politics; Center for Global Development: Washington, DC, USA, 2008. [Google Scholar]
- Hsieh, C.-T.; Klenow, P.J. Misallocation and manufacturing TFP in China and India. Q. J. Econ. 2009, 124, 1403–1448. [Google Scholar] [CrossRef]
- Wu, W.; Su, Q.; Li, C.; Yan, C.; Gozgor, G. Urbanization, disasters, and tourism development: Evidence from RCEP countries. Sustainability 2020, 12, 1221. [Google Scholar] [CrossRef]
- Zainuddin, M.R.K.V.; Sarmidi, T.; Khalid, N. Sustainable production, non-tariff measures, and trade performance in RCEP countries. Sustainability 2020, 12, 9969. [Google Scholar] [CrossRef]
- Roberts, M.J.; Tybout, J.R. Producer turnover and productivity growth in developing countries. World Bank Res. Obser. 1997, 12, 1–18. [Google Scholar] [CrossRef]
- Bernard, A.B.; Jensen, J.B. Exporting and productivity in the USA. Oxford Rev. Econ. Pol. 2004, 20, 343–357. [Google Scholar] [CrossRef]
- Aw, B.; Chung, S.; Roberts, M. Productivity and turnover in the export market: Micro-level evidence from the republic of Korea and Taiwan (China). World Bank Econ. Rev. 2000, 14, 65–90. [Google Scholar] [CrossRef]
- Clerides, S.; Lach, S.; Tybout, J. Is learning by exporting important? Micro-dynamic evidence from Colombia, Mexico, and Morocco. Q. J. Econ. 1998, 113, 903–947. [Google Scholar] [CrossRef]
- Girma, S.; Gorg, H.; Strobl, E. Exports, international investment, and plant performance: Evidence form a non-parametric test. Econ. Lett. 2004, 83, 317–324. [Google Scholar] [CrossRef][Green Version]
- Grossman, G.M.; Maggi, G. Diversity and trade. Am. Econ. Rev. 2000, 90, 1255–1275. [Google Scholar] [CrossRef]
- Grossman, G.M. The Distribution of talent and the pattern and consequences of international trade. J. Polit. Econ. 2004, 112, 209–239. [Google Scholar] [CrossRef]
- Yeaple, S.R. A simple model of firm heterogeneity, international trade, and wages. J. Int. Econ. 2005, 65, 1–20. [Google Scholar] [CrossRef]
- Rossi-Hansberg, E.; Garicano, L.; Antras, P. Offshoring in a Knowledge Economy. Q. J. Econ. 2006, 121, 31–77. [Google Scholar] [CrossRef]
- Costinot, A.; Vogel, J. Matching and inequality in the world economy. J. Polit. Econ. 2010, 118, 747–786. [Google Scholar] [CrossRef]
- Helpman, E.; Itskhoki, O.; Redding, S. Inequality and unemployment in a global economy. Econometrica 2010, 78, 1239–1283. [Google Scholar] [CrossRef]
- Blanchard, E.; Willmann, G. Trade, education, and the shrinking middle class. J. Int. Econ. 2016, 99, 263–278. [Google Scholar] [CrossRef]
- Jung, J.; Mercenier, J. On modeling task, skill and technology upgrading effects of globalization with heterogeneous labor. Econ. Model. 2014, 39, 49–62. [Google Scholar] [CrossRef]
- Jung, J. Technology, skill, and growth in a global economy. Econ. Theory 2019, 68, 609–641. [Google Scholar] [CrossRef]
- Acharya, R. Regional Trade Agreements and the Multilateral Trading System; WTO Publications: Geneva, Switzerland, 2016. [Google Scholar]
- Mayer, T.; Melitz, M.; Ottaviano, G. Product Mix and Firm Productivity Responses to Trade Competition; NBER Working Paper 22433; NBER: Cambridge, MA, USA, 2016. [Google Scholar]
- Manova, K.; Yu, Z. Multi-product firms and product quality. J. Int. Econ. 2017, 109, 116–137. [Google Scholar] [CrossRef]
- Atkin, D.; Khandelwal, A.K.; Osman, A. Exporting and firm performance: Evidence from a randomized experiment. Q. J. Econ. 2017, 132, 551–615. [Google Scholar] [CrossRef]
- Halpern, L.; Koren, M.; Szeidl, A. Imported inputs and productivity. Am. Econ. Rev. 2015, 105, 3660–3703. [Google Scholar] [CrossRef]
- Boler, E.A.; Moxnes, A.; Ulltveit-Moe, K.H. R&D, international sourcing, and the joint impact on firm performance. Am. Econ. Rev. 2015, 105, 3704–3739. [Google Scholar] [CrossRef]
- Bas, M.; Strauss-Kahn, V. Input-trade liberalization, export prices and quality upgrading. J. Int. Econ. 2015, 95, 250–262. [Google Scholar] [CrossRef]
- Fieler, A.C.; Eslava, M.; Xu, D.Y. Trade, quality upgrading, and input linkages: Theory and evidence from Colombia. Am. Econ. Rev. 2018, 108, 109–146. [Google Scholar] [CrossRef]
- Bas, M.; Berthou, A. Does input-trade liberalization affect firms’ foreign technology choice? World Bank Econ. Rev. 2017, 31, 351–384. [Google Scholar] [CrossRef]
- Bloom, N.; Draca, M.; van Reenen, J. Trade induced technical change? The impact of Chinese imports on innovation, IT and productivity. Rev. Econ. Stud. 2016, 83, 87–117. [Google Scholar] [CrossRef]
- Brandt, L.; van Biesebroeck, J.; Wang, L.; Zhang, Y. WTO accession and performance of Chinese manufacturing firms. Am. Econ. Rev. 2017, 107, 2784–2820. [Google Scholar] [CrossRef]
- Autor, D.; Dorn, D.; Hanson, G.H.; Pisano, G.; Shu, P. Foreign Competition and Domestic Innovation: Evidence from U.S. Patents; NBER Working Paper 22879; NBER: Cambridge, MA, USA, 2017. [Google Scholar]
- Xu, R.; Gong, K. Does Import Competition Induce R&D Reallocation? Evidence from the U.S.; IMF Working Paper 17/253; IMF: Washington, DC, USA, 2017. [Google Scholar]
- Raff, H.; Ryan, M.; Stahler, F. Financial frictions and foreign direct investment: Evidence from Japanese microdata. J. Int. Econ. 2018, 112, 109–122. [Google Scholar] [CrossRef]
- Amiti, M.; Weinstein, D.E. Exports and financial shocks. Q. J. Econ. 2011, 126, 1841–1877. [Google Scholar] [CrossRef]
- Bilir, L.K.; Chor, D.; Manova, K. Host-country financial development and multinational activity. Eur. Econ. Rev. 2016, 115, 192–220. [Google Scholar] [CrossRef]
- Zhang, K.H. Does foreign direct investment promote economic growth? Evidence from East Asia and Latin America. Contemp. Eon. Policy 2001, 19, 175–185. [Google Scholar] [CrossRef]
- Makki, S.S.; Somwaru, A. Impact of FDI and trade on economic growth: Evidence from developing countries. Am. J. Agr. Econ. 2004, 86, 795–801. [Google Scholar] [CrossRef]
- Liu, Z. Foreign direct investment and technology spillovers: Theory and evidence. J. Dev. Econ. 2008, 85, 176–193. [Google Scholar] [CrossRef]
- Jung, J. Institutional quality, FDI, and productivity: A theoretical analysis. Sustainability 2020, 12, 7057. [Google Scholar] [CrossRef]
- Wei, S.J. How taxing is corruption on international investors? Rev. Econ. Stat. 2000, 82, 1–11. [Google Scholar] [CrossRef]
- Buchanan, B.G.; Quan, V.L.; Meenakshi, R. Foreign direct investment and institutional quality: Some empirical evidence. Int. Rev. Financ. Anal. 2012, 21, 81–89. [Google Scholar] [CrossRef]
- Benassy-Quere, A.; Coupet, M.; Mayer, T. Institutional determinants of foreign direct investment. World Econ. 2007, 30, 764–782. [Google Scholar] [CrossRef]
- Aizenman, J.; Spiegel, M. Institutional efficiency and the investment share of foreign direct investment. Rev. Int. Econ. 2006, 14, 683–697. [Google Scholar] [CrossRef]
- Knack, S.; Keefer, P. Institutions and economic performance: Cross-country tests using alternative institutional measures. Econ. Polit. Oxford 1995, 7, 207–228. [Google Scholar] [CrossRef]
- Lee, J.-Y.; Mansfield, E. Intellectual property protection and U.S. foreign direct investment. Rev. Econ. Stat. 1996, 78, 181–186. [Google Scholar] [CrossRef]
- Gani, A. Governance and foreign direct investment links: Evidence from panel data estimations. Appl. Econ. Lett. 2007, 14, 753–756. [Google Scholar] [CrossRef]
- Daude, C.; Stein, E. The quality of institutions and foreign direct investment. Econ. Polit. Oxford 2007, 19, 317–344. [Google Scholar] [CrossRef]
- Jensen, N.M. Democratic governance and multinational corporations: Political regimes and inflows of foreign direct investment. Int. Organ. 2003, 57, 587–616. [Google Scholar] [CrossRef]
- Samuelson, P.A. The transfer problem and transport costs: The terms of trade when impediments are absent. Econ. J. 1952, 62, 278–304. [Google Scholar] [CrossRef]
- Cieslik, A.; Wcislik, D.R. Convergence among the CEE-8 economies and their catch-up towards the EU-15. Struct. Chang. Econ. Dyn. 2020, 55, 39–48. [Google Scholar] [CrossRef]
- Balistreri, E.J.; Tarr, D.G. Comparison of deep integration in the Melitz, Krugman and Armington models: The case of the Philippines in RCEP. Econ. Model. 2020, 85, 255–271. [Google Scholar] [CrossRef]
- Melitz, M.J. The impact of trade on intra-industry reallocations and aggregate industry productivity. Econometrica 2003, 71, 1695–1725. [Google Scholar] [CrossRef]
- Armington, P.S. A theory of demand for products distinguished by place of production. IMF Staff Pap. 1969, 16, 159–178. [Google Scholar] [CrossRef]
- Jung, J. Introducing Roy-like worker assignment into computable general equilibrium models. Appl. Econ. Lett. 2020, 27, 503–510. [Google Scholar] [CrossRef]
- Roy, A.D. Some thoughts on the distribution of earnings. Oxf. Econ. Pap. 1951, 3, 135–146. [Google Scholar] [CrossRef]
- Shoven, J.B.; Whalley, J. Applying General Equilibrium; Cambridge University Press: Cambridge, UK, 1992. [Google Scholar]
- Ginsburgh, V.; Keyzer, M. The Structure of Applied General Equilibrium Models; MIT Press: Cambridge, MA, USA, 2002. [Google Scholar]
- Francois, J.F.; Reinert, K.A. Applied Methods for Trade Policy Analysis: A Handbook; Cambridge University Press: Cambridge, UK, 2007. [Google Scholar]
- Aguiar, A.; Chepeliev, M.; Corong, E.; McDougall, R.; van der Mensbrugghe, D. The GTAP data base: Version 10. J. Glob. Econ. Anal. 2019, 4, 1–27. [Google Scholar] [CrossRef]
- Bernard, A.; Jensen, B. Exceptional exporter performance: Cause, effect, or both? J. Int. Econ. 1999, 47, 1–25. [Google Scholar] [CrossRef]
- Broda, C.; Weinstein, D.E. Globalization and the gains from variety. Q. J. Econ. 2006, 121, 541–585. [Google Scholar] [CrossRef]


| N° | Code | Description | N° | Code | Description |
|---|---|---|---|---|---|
| 1 | KOR | Korea | 13 | JPN | Japan |
| 2 | CHN | China | 14 | AUS | Australia |
| 3 | THA | Thailand | 15 | NZL | New Zealand |
| 4 | IDN | Indonesia | 16 | CAN | Canada |
| 5 | PHL | Philippines | 17 | MEX | Mexico |
| 6 | KHM | Cambodia | 18 | PER | Peru |
| 7 | LAO | Laos | 19 | CHL | Chile |
| 8 | MMR | Myanmar | 20 | USA | United States of America |
| 9 | VNM | Viet Nam | 21 | IND | India |
| 10 | MYS | Malaysia | 22 | EU | European Union |
| 11 | SGP | Singapore | 23 | RoW | Rest of World |
| 12 | BRN | Brunei |
| (1) | (2) | (3) | (4) | (5) | (6) | (7) | (8) | (9) | (10) | (11) | (12) | (13) | (14) | (15) | ||
|---|---|---|---|---|---|---|---|---|---|---|---|---|---|---|---|---|
| (1) | KOR | 0.00 | 0.56 | 0.35 | 0.00 | 0.25 | 0.00 | 0.00 | 0.52 | 0.17 | 0.00 | 0.00 | 0.00 | 0.07 | 0.04 | 0.17 |
| (2) | CHN | 0.04 | 0.00 | 0.00 | 0.00 | 0.00 | 0.00 | 0.00 | 0.00 | 0.00 | 0.00 | 0.00 | 0.00 | 0.03 | 0.00 | 0.01 |
| (3) | THA | 0.00 | 0.01 | 0.00 | 0.00 | 0.00 | 0.00 | 0.00 | 0.00 | 0.00 | 0.00 | 0.00 | 0.00 | 0.00 | 0.01 | 0.06 |
| (4) | IDN | 0.00 | 0.00 | 0.03 | 0.00 | 0.00 | 0.00 | 0.00 | 0.00 | 0.03 | 0.00 | 0.03 | 0.00 | 0.00 | 0.04 | 0.04 |
| (5) | PHL | 0.00 | 0.06 | 0.23 | 0.00 | 0.00 | 0.00 | 0.00 | 0.00 | 0.38 | 0.00 | 0.00 | 0.00 | 0.00 | 0.02 | 0.00 |
| (6) | KHM | 0.00 | 0.00 | 0.08 | 0.00 | 0.00 | 0.00 | 0.00 | 0.00 | 0.00 | 0.00 | 0.00 | 0.00 | 0.29 | 0.00 | 0.00 |
| (7) | LAO | 0.00 | 0.00 | 0.04 | 0.00 | 0.00 | 0.00 | 0.00 | 0.00 | 0.00 | 0.00 | 0.00 | 0.00 | 0.00 | 0.00 | 0.00 |
| (8) | MMR | 0.04 | 0.02 | 0.00 | 0.00 | 0.00 | 0.00 | 0.00 | 0.00 | 0.00 | 0.00 | 0.00 | 0.00 | 0.00 | 0.00 | 0.00 |
| (9) | VNM | 0.03 | 0.01 | 0.00 | 0.01 | 0.00 | 0.04 | 0.00 | 0.00 | 0.00 | 0.00 | 0.00 | 0.00 | 0.04 | 0.04 | 0.03 |
| (10) | MYS | 0.00 | 0.00 | 0.12 | 0.00 | 0.00 | 0.19 | 0.00 | 0.00 | 0.05 | 0.00 | 0.00 | 0.00 | 0.00 | 0.00 | 0.00 |
| (11) | SGP | 0.00 | 0.00 | 0.00 | 0.00 | 0.00 | 0.00 | 0.00 | 0.00 | 0.00 | 0.00 | 0.00 | 0.00 | 0.00 | 0.00 | 0.00 |
| (12) | BRN | 0.00 | 0.00 | 0.00 | 0.00 | 0.00 | 0.00 | 0.00 | 0.00 | 0.00 | 0.00 | 0.00 | 0.00 | 0.00 | 0.00 | 0.00 |
| (13) | JPN | 0.06 | 0.06 | 0.16 | 0.00 | 0.05 | 0.14 | 0.00 | 0.05 | 0.00 | 0.00 | 0.00 | 0.00 | 0.00 | 0.02 | 0.11 |
| (14) | AUS | 0.00 | 0.00 | 0.00 | 0.00 | 0.00 | 0.00 | 0.00 | 0.00 | 0.00 | 0.00 | 0.00 | 0.00 | 0.00 | 0.00 | 0.00 |
| (15) | NZL | 0.00 | 0.00 | 0.00 | 0.00 | 0.00 | 0.00 | 0.00 | 0.00 | 0.00 | 0.00 | 0.00 | 0.00 | 0.00 | 0.00 | 0.00 |
| (1) | (2) | (3) | (4) | (5) | (6) | (7) | (8) | (9) | (10) | (11) | (12) | (13) | (14) | (15) | ||
|---|---|---|---|---|---|---|---|---|---|---|---|---|---|---|---|---|
| (1) | KOR | 0.00 | 0.04 | 0.05 | 0.01 | 0.01 | 0.03 | 0.00 | 0.00 | 0.01 | 0.01 | 0.01 | 0.00 | 0.05 | 0.13 | 0.14 |
| (2) | CHN | 0.04 | 0.00 | 0.01 | 0.02 | 0.00 | 0.00 | 0.01 | 0.00 | 0.00 | 0.01 | 0.00 | 0.00 | 0.06 | 0.02 | 0.03 |
| (3) | THA | 0.02 | 0.01 | 0.00 | 0.00 | 0.00 | 0.00 | 0.00 | 0.00 | 0.00 | 0.00 | 0.00 | 0.00 | 0.04 | 0.00 | 0.02 |
| (4) | IDN | 0.01 | 0.01 | 0.01 | 0.00 | 0.00 | 0.00 | 0.00 | 0.00 | 0.00 | 0.00 | 0.00 | 0.00 | 0.07 | 0.05 | 0.04 |
| (5) | PHL | 0.01 | 0.01 | 0.00 | 0.00 | 0.00 | 0.00 | 0.00 | 0.00 | 0.00 | 0.00 | 0.00 | 0.00 | 0.03 | 0.00 | 0.01 |
| (6) | KHM | 0.08 | 0.02 | 0.04 | 0.04 | 0.00 | 0.00 | 0.00 | 0.00 | 0.03 | 0.00 | 0.04 | 0.00 | 0.10 | 0.00 | 0.00 |
| (7) | LAO | 0.27 | 0.05 | 0.03 | 0.00 | 0.00 | 0.00 | 0.00 | 0.00 | 0.01 | 0.00 | 0.00 | 0.00 | 0.21 | 0.00 | 0.00 |
| (8) | MMR | 0.03 | 0.02 | 0.01 | 0.00 | 0.00 | 0.00 | 0.00 | 0.00 | 0.00 | 0.00 | 0.01 | 0.00 | 0.13 | 0.00 | 0.00 |
| (9) | VNM | 0.05 | 0.05 | 0.02 | 0.02 | 0.01 | 0.00 | 0.00 | 0.00 | 0.00 | 0.02 | 0.04 | 0.00 | 0.03 | 0.03 | 0.03 |
| (10) | MYS | 0.02 | 0.01 | 0.00 | 0.00 | 0.00 | 0.00 | 0.00 | 0.00 | 0.00 | 0.00 | 0.00 | 0.00 | 0.01 | 0.00 | 0.00 |
| (11) | SGP | 0.00 | 0.00 | 0.00 | 0.00 | 0.00 | 0.00 | 0.00 | 0.00 | 0.00 | 0.00 | 0.00 | 0.00 | 0.00 | 0.00 | 0.00 |
| (12) | BRN | 0.00 | 0.01 | 0.00 | 0.00 | 0.00 | 0.00 | 0.00 | 0.00 | 0.00 | 0.00 | 0.00 | 0.00 | 0.00 | 0.00 | 0.00 |
| (13) | JPN | 0.02 | 0.02 | 0.01 | 0.01 | 0.00 | 0.01 | 0.02 | 0.01 | 0.01 | 0.01 | 0.02 | 0.00 | 0.00 | 0.04 | 0.09 |
| (14) | AUS | 0.05 | 0.03 | 0.00 | 0.00 | 0.00 | 0.00 | 0.00 | 0.00 | 0.00 | 0.00 | 0.00 | 0.00 | 0.10 | 0.00 | 0.00 |
| (15) | NZL | 0.02 | 0.00 | 0.00 | 0.01 | 0.00 | 0.00 | 0.00 | 0.00 | 0.01 | 0.00 | 0.00 | 0.00 | 0.04 | 0.00 | 0.00 |
| (a) | (b) | (c) | (d) | (e) | Total | ||
|---|---|---|---|---|---|---|---|
| (1) | KOR | 16.3 | 21.9 | 18.1 | 24.9 | 18.8 | 100.0 |
| (2) | CHN | 51.4 | 10.1 | 14.4 | 15.4 | 8.7 | 100.0 |
| (3) | THA | 35.7 | 16.2 | 6.8 | 25.9 | 15.4 | 100.0 |
| (4) | IDN | 52.1 | 19.0 | 5.0 | 8.3 | 15.6 | 100.0 |
| (5) | PHL | 28.7 | 10.5 | 7.3 | 39.4 | 14.0 | 100.0 |
| (6) | KHM | 57.2 | 12.9 | 3.9 | 14.3 | 11.7 | 100.0 |
| (7) | LAO | 70.3 | 6.0 | 3.5 | 11.1 | 9.1 | 100.0 |
| (8) | MMR | 50.6 | 13.6 | 5.3 | 17.4 | 13.2 | 100.0 |
| (9) | VNM | 52.1 | 10.9 | 4.6 | 16.6 | 15.9 | 100.0 |
| (10) | MYS | 32.5 | 13.3 | 7.7 | 21.8 | 24.8 | 100.0 |
| (11) | SGP | 5.1 | 10.7 | 7.8 | 51.1 | 25.4 | 100.0 |
| (12) | BRN | 23.5 | 9.7 | 11.6 | 30.9 | 24.3 | 100.0 |
| (13) | JPN | 24.6 | 13.4 | 9.1 | 27.3 | 25.6 | 100.0 |
| (14) | AUS | 17.2 | 12.8 | 10.7 | 40.7 | 18.6 | 100.0 |
| (15) | NZL | 14.2 | 11.5 | 9.8 | 44.4 | 20.1 | 100.0 |
| KOR | CHN | THA | IDN | PHL | KHM | LAO | MMR |
| −1.218 | −32.736 | −20.861 | −29.769 | 13.141 | −9.182 | −93.737 | −55.982 |
| VNM | MYS | SGP | BRN | JPN | AUS | NZL | CAN |
| −55.739 | −38.414 | −32.644 | −22.520 | −21.840 | −67.326 | −50.400 | 27.983 |
| MEX | PER | CHL | USA | IND | EU | RoW | Mean |
| 108.452 | −0.759 | −70.359 | −8.764 | −77.491 | −63.115 | −20.701 | −27.130 |
| KOR | CHN | THA | IDN | PHL | KHM | LAO | MMR |
| −29.098 | −36.253 | −27.851 | −35.328 | 5.118 | −49.336 | −96.676 | −63.796 |
| VNM | MYS | SGP | BRN | JPN | AUS | NZL | CAN |
| −64.567 | −40.791 | −35.242 | −40.090 | −32.076 | −74.138 | −57.797 | 15.961 |
| MEX | PER | CHL | USA | IND | EU | RoW | Mean |
| 67.959 | −2.018 | −70.999 | −9.850 | −79.525 | −64.933 | −27.858 | −36.921 |
| KOR | CHN | THA | IDN | PHL | KHM | LAO | MMR |
| −27.374 | 25.683 | 10.130 | 19.396 | −18.886 | −39.194 | 7.018 | 29.683 |
| VNM | MYS | SGP | BRN | JPN | AUS | NZL | CAN |
| 25.352 | 33.625 | 27.904 | −5.207 | 5.736 | 33.833 | 28.434 | −33.405 |
| MEX | PER | CHL | USA | IND | EU | RoW | Mean |
| −98.515 | −0.544 | 70.353 | 7.169 | 65.109 | 57.046 | 9.653 | 10.130 |
| Primary | Manufac. | Service | Total | ||
|---|---|---|---|---|---|
| Korea | Base | 2.7 | 50.0 | 47.3 | 100.0 |
| RCEP | 1.8 | 44.2 | 54.0 | 100.0 | |
| China | Base | 9.3 | 50.3 | 40.4 | 100.0 |
| RCEP | 9.8 | 50.7 | 39.6 | 100.0 | |
| Thailand | Base | 10.3 | 48.6 | 41.1 | 100.0 |
| RCEP | 10.4 | 47.8 | 41.8 | 100.0 | |
| Indonesia | Base | 15.9 | 33.9 | 50.2 | 100.0 |
| RCEP | 15.5 | 33.6 | 50.9 | 100.0 | |
| Philippines | Base | 15.2 | 32.6 | 52.2 | 100.0 |
| RCEP | 15.1 | 31.5 | 53.4 | 100.0 | |
| Cambodia | Base | 22.6 | 41.4 | 36.0 | 100.0 |
| RCEP | 20.4 | 34.6 | 45.0 | 100.0 | |
| Laos | Base | 47.3 | 24.0 | 28.7 | 100.0 |
| RCEP | 47.1 | 21.6 | 31.4 | 100.0 | |
| Myanmar | Base | 27.3 | 30.9 | 41.8 | 100.0 |
| RCEP | 27.1 | 30.5 | 42.4 | 100.0 | |
| Viet Nam | Base | 18.1 | 53.8 | 28.1 | 100.0 |
| RCEP | 17.3 | 51.2 | 31.6 | 100.0 | |
| Malaysia | Base | 8.0 | 45.8 | 46.2 | 100.0 |
| RCEP | 8.1 | 46.7 | 45.2 | 100.0 | |
| Singapore | Base | 0.3 | 31.6 | 68.1 | 100.0 |
| RCEP | 0.3 | 32.0 | 67.7 | 100.0 | |
| Brunei | Base | 43.3 | 1.6 | 55.1 | 100.0 |
| RCEP | 34.6 | 1.5 | 63.9 | 100.0 | |
| Japan | Base | 1.7 | 35.1 | 63.2 | 100.0 |
| RCEP | 1.5 | 34.0 | 64.5 | 100.0 | |
| Australia | Base | 10.7 | 14.8 | 74.5 | 100.0 |
| RCEP | 9.8 | 14.1 | 76.1 | 100.0 | |
| New Zealand | Base | 9.5 | 20.8 | 69.8 | 100.0 |
| RCEP | 9.0 | 20.2 | 70.8 | 100.0 | |
| Canada | Base | 9.9 | 22.0 | 68.1 | 100.0 |
| RCEP | 8.3 | 20.2 | 71.5 | 100.0 | |
| Mexico | Base | 6.9 | 36.1 | 57.0 | 100.0 |
| RCEP | 5.7 | 32.1 | 62.2 | 100.0 | |
| Peru | Base | 17.1 | 43.0 | 39.9 | 100.0 |
| RCEP | 17.0 | 42.6 | 40.4 | 100.0 | |
| Chile | Base | 12.0 | 25.7 | 62.3 | 100.0 |
| RCEP | 13.3 | 27.3 | 59.5 | 100.0 | |
| USA | Base | 3.8 | 25.8 | 70.4 | 100.0 |
| RCEP | 3.9 | 25.9 | 70.2 | 100.0 | |
| India | Base | 14.1 | 34.7 | 51.1 | 100.0 |
| RCEP | 15.1 | 35.7 | 49.2 | 100.0 | |
| EU | Base | 3.2 | 29.9 | 66.9 | 100.0 |
| RCEP | 3.5 | 31.0 | 65.5 | 100.0 | |
| RoW | Base | 16.4 | 28.1 | 55.4 | 100.0 |
| RCEP | 16.1 | 27.6 | 56.3 | 100.0 |
| Primary | Manufac. | Service | Total | ||
|---|---|---|---|---|---|
| Korea | Base | 2.7 | 29.4 | 67.9 | 100.0 |
| RCEP | 1.5 | 22.1 | 76.4 | 100.0 | |
| China | Base | 15.1 | 28.3 | 56.6 | 100.0 |
| RCEP | 16.3 | 28.6 | 55.1 | 100.0 | |
| Thailand | Base | 13.2 | 27.0 | 59.9 | 100.0 |
| RCEP | 13.3 | 26.1 | 60.6 | 100.0 | |
| Indonesia | Base | 23.5 | 21.7 | 54.8 | 100.0 |
| RCEP | 22.9 | 21.4 | 55.7 | 100.0 | |
| Philippines | Base | 16.3 | 18.6 | 65.1 | 100.0 |
| RCEP | 16.1 | 17.5 | 66.4 | 100.0 | |
| Cambodia | Base | 32.2 | 26.5 | 41.3 | 100.0 |
| RCEP | 27.5 | 18.6 | 53.9 | 100.0 | |
| Laos | Base | 62.4 | 16.0 | 21.6 | 100.0 |
| RCEP | 62.0 | 12.9 | 25.1 | 100.0 | |
| Myanmar | Base | 40.1 | 9.4 | 50.5 | 100.0 |
| RCEP | 39.5 | 9.0 | 51.5 | 100.0 | |
| Viet Nam | Base | 28.3 | 31.7 | 40.0 | 100.0 |
| RCEP | 25.9 | 28.2 | 45.9 | 100.0 | |
| Malaysia | Base | 16.3 | 28.2 | 55.5 | 100.0 |
| RCEP | 16.6 | 29.2 | 54.1 | 100.0 | |
| Singapore | Base | 0.4 | 21.3 | 78.4 | 100.0 |
| RCEP | 0.4 | 21.7 | 77.9 | 100.0 | |
| Brunei | Base | 53.9 | 0.9 | 45.2 | 100.0 |
| RCEP | 44.1 | 0.8 | 55.0 | 100.0 | |
| Japan | Base | 1.4 | 17.8 | 80.7 | 100.0 |
| RCEP | 1.2 | 16.7 | 82.1 | 100.0 | |
| Australia | Base | 12.1 | 9.4 | 78.5 | 100.0 |
| RCEP | 10.8 | 8.6 | 80.6 | 100.0 | |
| New Zealand | Base | 8.7 | 13.5 | 77.8 | 100.0 |
| RCEP | 8.1 | 12.8 | 79.1 | 100.0 | |
| Canada | Base | 10.8 | 11.8 | 77.4 | 100.0 |
| RCEP | 8.6 | 9.8 | 81.5 | 100.0 | |
| Mexico | Base | 6.9 | 21.9 | 71.2 | 100.0 |
| RCEP | 5.4 | 17.7 | 76.9 | 100.0 | |
| Peru | Base | 20.6 | 33.6 | 45.9 | 100.0 |
| RCEP | 20.4 | 33.1 | 46.5 | 100.0 | |
| Chile | Base | 11.9 | 18.3 | 69.9 | 100.0 |
| RCEP | 13.6 | 20.1 | 66.3 | 100.0 | |
| USA | Base | 3.5 | 15.6 | 80.9 | 100.0 |
| RCEP | 3.6 | 15.8 | 80.6 | 100.0 | |
| India | Base | 19.9 | 13.8 | 66.4 | 100.0 |
| RCEP | 21.8 | 14.7 | 63.6 | 100.0 | |
| EU | Base | 3.6 | 17.1 | 79.3 | 100.0 |
| RCEP | 4.0 | 18.3 | 77.6 | 100.0 | |
| RoW | Base | 21.7 | 15.7 | 62.5 | 100.0 |
| RCEP | 21.2 | 15.2 | 63.6 | 100.0 |
Publisher’s Note: MDPI stays neutral with regard to jurisdictional claims in published maps and institutional affiliations. |
© 2021 by the author. Licensee MDPI, Basel, Switzerland. This article is an open access article distributed under the terms and conditions of the Creative Commons Attribution (CC BY) license (http://creativecommons.org/licenses/by/4.0/).
Share and Cite
Jung, J. Economic Transformation and Sustainable Development through Multilateral Free Trade Agreements. Sustainability 2021, 13, 2519. https://doi.org/10.3390/su13052519
Jung J. Economic Transformation and Sustainable Development through Multilateral Free Trade Agreements. Sustainability. 2021; 13(5):2519. https://doi.org/10.3390/su13052519
Chicago/Turabian StyleJung, Jaewon. 2021. "Economic Transformation and Sustainable Development through Multilateral Free Trade Agreements" Sustainability 13, no. 5: 2519. https://doi.org/10.3390/su13052519
APA StyleJung, J. (2021). Economic Transformation and Sustainable Development through Multilateral Free Trade Agreements. Sustainability, 13(5), 2519. https://doi.org/10.3390/su13052519