Article

Green Water from Green Roofs—The Ecological and Economic Effects

1
Department of Environmental Development, Institute of Environmental Engineering, Warsaw University of Life Sciences—SGGW, Nowoursynowska 159, 02-776 Warsaw, Poland
2
Innovative City Department, Collegium of Business Administration, SGH Warsaw School of Economics, Niepodleglosci 162, 02-554 Warsaw, Poland
*
Author to whom correspondence should be addressed.
Sustainability 2021, 13(4), 2403; https://doi.org/10.3390/su13042403
Submission received: 10 February 2021 / Revised: 18 February 2021 / Accepted: 19 February 2021 / Published: 23 February 2021

Abstract

:
Green roofs (GRs) have been one of the most popular solutions for water harvesting in urban areas. Apart from their water retention role and increasing biodiversity, they constitute the missing link between the built and the natural environment, which is required for sustainable human living in cities. This paper aims to calculate the ecological (EE) and economic effect (EcE) of water harvesting via GRs, by contrasting with a traditional roof, and to perform an economic analysis of the social cost benefits that GRs generate during their life cycle, using the Net Present Value (NPV) method. All the calculations and analyses were conducted for both intensive and extensive GRs in 11 of the largest municipalities in Poland, with a population of >250,000 inhabitants. According to the results of this study, water retention and the economic and ecological effects of GRs are highest in the municipalities with the highest assumed number of GRs (Warsaw, Krakow, Wroclaw, and Szczecin). The average EE and EcE equals 507,000 m3/yr and 621,000 USD/yr. The NPV results show that the effectiveness of investments in intensive GRs is, to a certain extent, more significant than in extensive GRs and the average equals 60.77 and 4.47 USD/yr for intensive and extensive GRs, respectively. The results could serve as a reference for the evaluation and optimization of the energy efficiency of rainwater harvesting schemes, in European cities.

1. Introduction

Urban areas are becoming a living environment for an increasing number of people, and now more than 70.9% of the total EU-28 population lives in cities, towns, and suburbs [1]. It is estimated that by 2050, more than 80% of the EU-28 population will live in cities [1,2] and further that the estimation of Europe’s level of urbanization is expected to increase to approximately 83.7% in 2050 [3]. Globally, cities are major socioeconomic centres in which more than 50% of the global population live and where the population is forecast to double by 2050. These are considerable challenges in terms of maintaining and restoring green spaces within urban areas. Urbanization also affects the hydrological cycle, by reducing infiltration on the one hand and simultaneously increasing runoff on the other [4]. Green roofs (GRs) (also known as living roofs, vegetable roofs, or eco-roofs [5]) are building roofs which are entirely or partially covered with vegetation and growth medium (so called substrate) planted over a waterproofing membrane [6]. GRs are a generally recognized method of restoring the biologically active surface in cities and seem to be the missing link between built-up areas and natural resources and ecosystems. The idea of implementing GRs in urban areas forms part of sustainable stormwater management, such as Sustainable Urban Drainage Systems (SUDS), Best Management Practices (BMPs), Low Impact Development (LID), or Green Infrastructure (GI). These constitute practices and systems which use natural processes, including infiltration, evapotranspiration, and stormwater, and have been applied to protect urban areas [4,7,8,9,10]. According to Grand View Research the global GRs’ market size was valued at USD 1.4 billion in 2020 and is expected to grow at a compound annual growth rate (CAGR) of 17%, from 2020 to 2027, reaching USD 4.2 billion by 2027 [11].
Generally, GRs are regarded as intensive or extensive, according to their purpose. Intensive GRs are characterized by a deep growing medium, ranging from 20–100 cm [12] even to 200 cm [13,14], as well as high-cost maintenance requirements like traditional gardens [15]. The vegetation planted on intensive GRs ranges from lawns and low-lying shrubs, to tall shrubs, coppices, and large bushes, and from small to large trees [12]. On account of the intense vegetation, GRs of this kind often require irrigation that increases the significant maintenance cost. Intensive GRs are functional and aesthetic in terms of purpose, with an enhanced living space [15]. The alternative to intensive roofs is that of extensive roofs, which are considered to be virtually self-sustaining [12,16,17], although, they do require some maintenance, but this is less compared with intensive roofs [17]. Extensive roofs have a relatively thin layer of lightweight substrate (usually ≤20 cm [12]) of high porosity and low organic matter [15,18]. Generally, extensive GRs do not require irrigation [15], therefore, low-growing communities of plants and mosses, selected for their stress-tolerance qualities (e.g., Sedum spp., Sempervivum spp.) are best suited to these living conditions [12,15]. The Sedum species is the most common choice of plant for extensive GRs, due to the relatively shallow roots that can store water and their crassulacean acid metabolism which reduces water loss [19]. The main purpose of building extensive GRs is to increase the biologically active area in cities, rather than making spaces more accessible or developing them for recreational purposes [15]. Li and Yeung [12] also identified a third kind of GR, namely, semi-intensive, which is an intermediate type between intensive and extensive roofs, characterized by its substrate thickness, inhabiting plants and visual aspects.
Despite increasing investment costs [20] and determining the level and structure of its expense [21], GRs are becoming more and more popular and generate a number of social and environmental benefits in the context of sustainability and living closer to a natural background [22]. The problem of the relationship between the economy, society, and the environment has been, is and still is an important subject of interdisciplinary research at a time of aiming for climate neutrality. Sustainable development is a response to dynamic changes in the global economy, with particular emphasis on the natural environment. GRs also contribute to the sustainability of the building, promoting GR application to the community by adapting local culture in sustainable GR technology innovation [22]. Also, GRs as an eco-innovation and an increasingly sustainable development tool, play an important role in tackling climate change as well as the water harvesting that is necessary to achieve sustainable development and eradicate water poverty. The GR eco-innovation model is capable of developing more sustainable eco-innovative design alternatives for a building construction project [23] and also promote sustainable building growth [24]. The most important environmental benefits include a reduction of the urban heat island effect, urban air pollution, the energy consumption of buildings, stormwater runoff, and noise pollution, as well as an increase in the number of biologically active surfaces [9,16,18,25,26,27,28]. The main social benefits are improved aesthetics and amenities, the provision of recreational space (mainly intensive GRs), an extension of the lifespan of roof materials, as well as a reduced flood risk [16,25].
According to Hoekstra’s [29] water footprint concept, the rainwater harvested and stored in the soil as soil moisture, and on GRs, is called a green water footprint. The water retention capacity of GRs is variable, and ranges from a low percentage to 100% [30,31,32,33,34,35,36,37,38,39,40]; this may vary depending on such factors as the slope of the GR, the thickness and type of the substrate layer, the kind of vegetation, and the amount of water accumulated in its structure, before the rain event [4,14]. The water retained on GRs in terms of the thickness and the type of substrate layer, is presented in Table 1. Comparing traditional roofs and GRs, the green water ecological effect of the latter increases water retention in urban areas. According to Mekonnen and Hoekstra [41], Poland has one of the lowest green water footprints in the EU, indicating the low level of rainwater harvested.
The average water resources in Poland amount to approx. 60 billion m3, and in the dry seasons, this level may even drop below 40 billion m3 [42]. Nevertheless, in Poland, systems to control the economic use of rainwater are rarely used. The presence of an urban heat island, air pollution, reduction of biodiversity as well as pollution and degradation of the surface and underground water resources is the result of agglomerations that strongly transform the environment [43]. The presence of GRs alleviates the urban climate and reduces extreme weather phenomena resulting from climate change. For these reasons, we attempted to conduct an economic analysis of GRs, examining the conditions in Poland. To our knowledge, no attempt has been made to evaluate the economic efficiency of GRs with a simultaneous evaluation of the water harvested from GRs in Poland. Also, the research gap that we would like to fill is that there have been no attempts to evaluate both intensive and extensive GRs in Polish conditions. Therefore, we have tried to outline the efficiency of such solutions from a socio-environmental aspect. The added value and novelty of this research is the implementation of the method in the assessment of both ecologic and economic effects of GR investments on Polish markets.
We stated the expected research results in a hypothesis that intensive GRs provide better ecological and economic effects than extensive GRs.
The aim of the study was (1) to calculate the ecological and economic effect of the water harvested from GRs by contrast with a traditional roof and (2) to perform an economic analysis of the social-cost benefits that GRs generate during their life cycle, using the Net Present Value (NPV) method. All the calculations and analyses were conducted in relation to both intensive and extensive GRs in the 11 largest municipalities of Poland, with a population of >250,000 inhabitants.

2. Materials and Methods

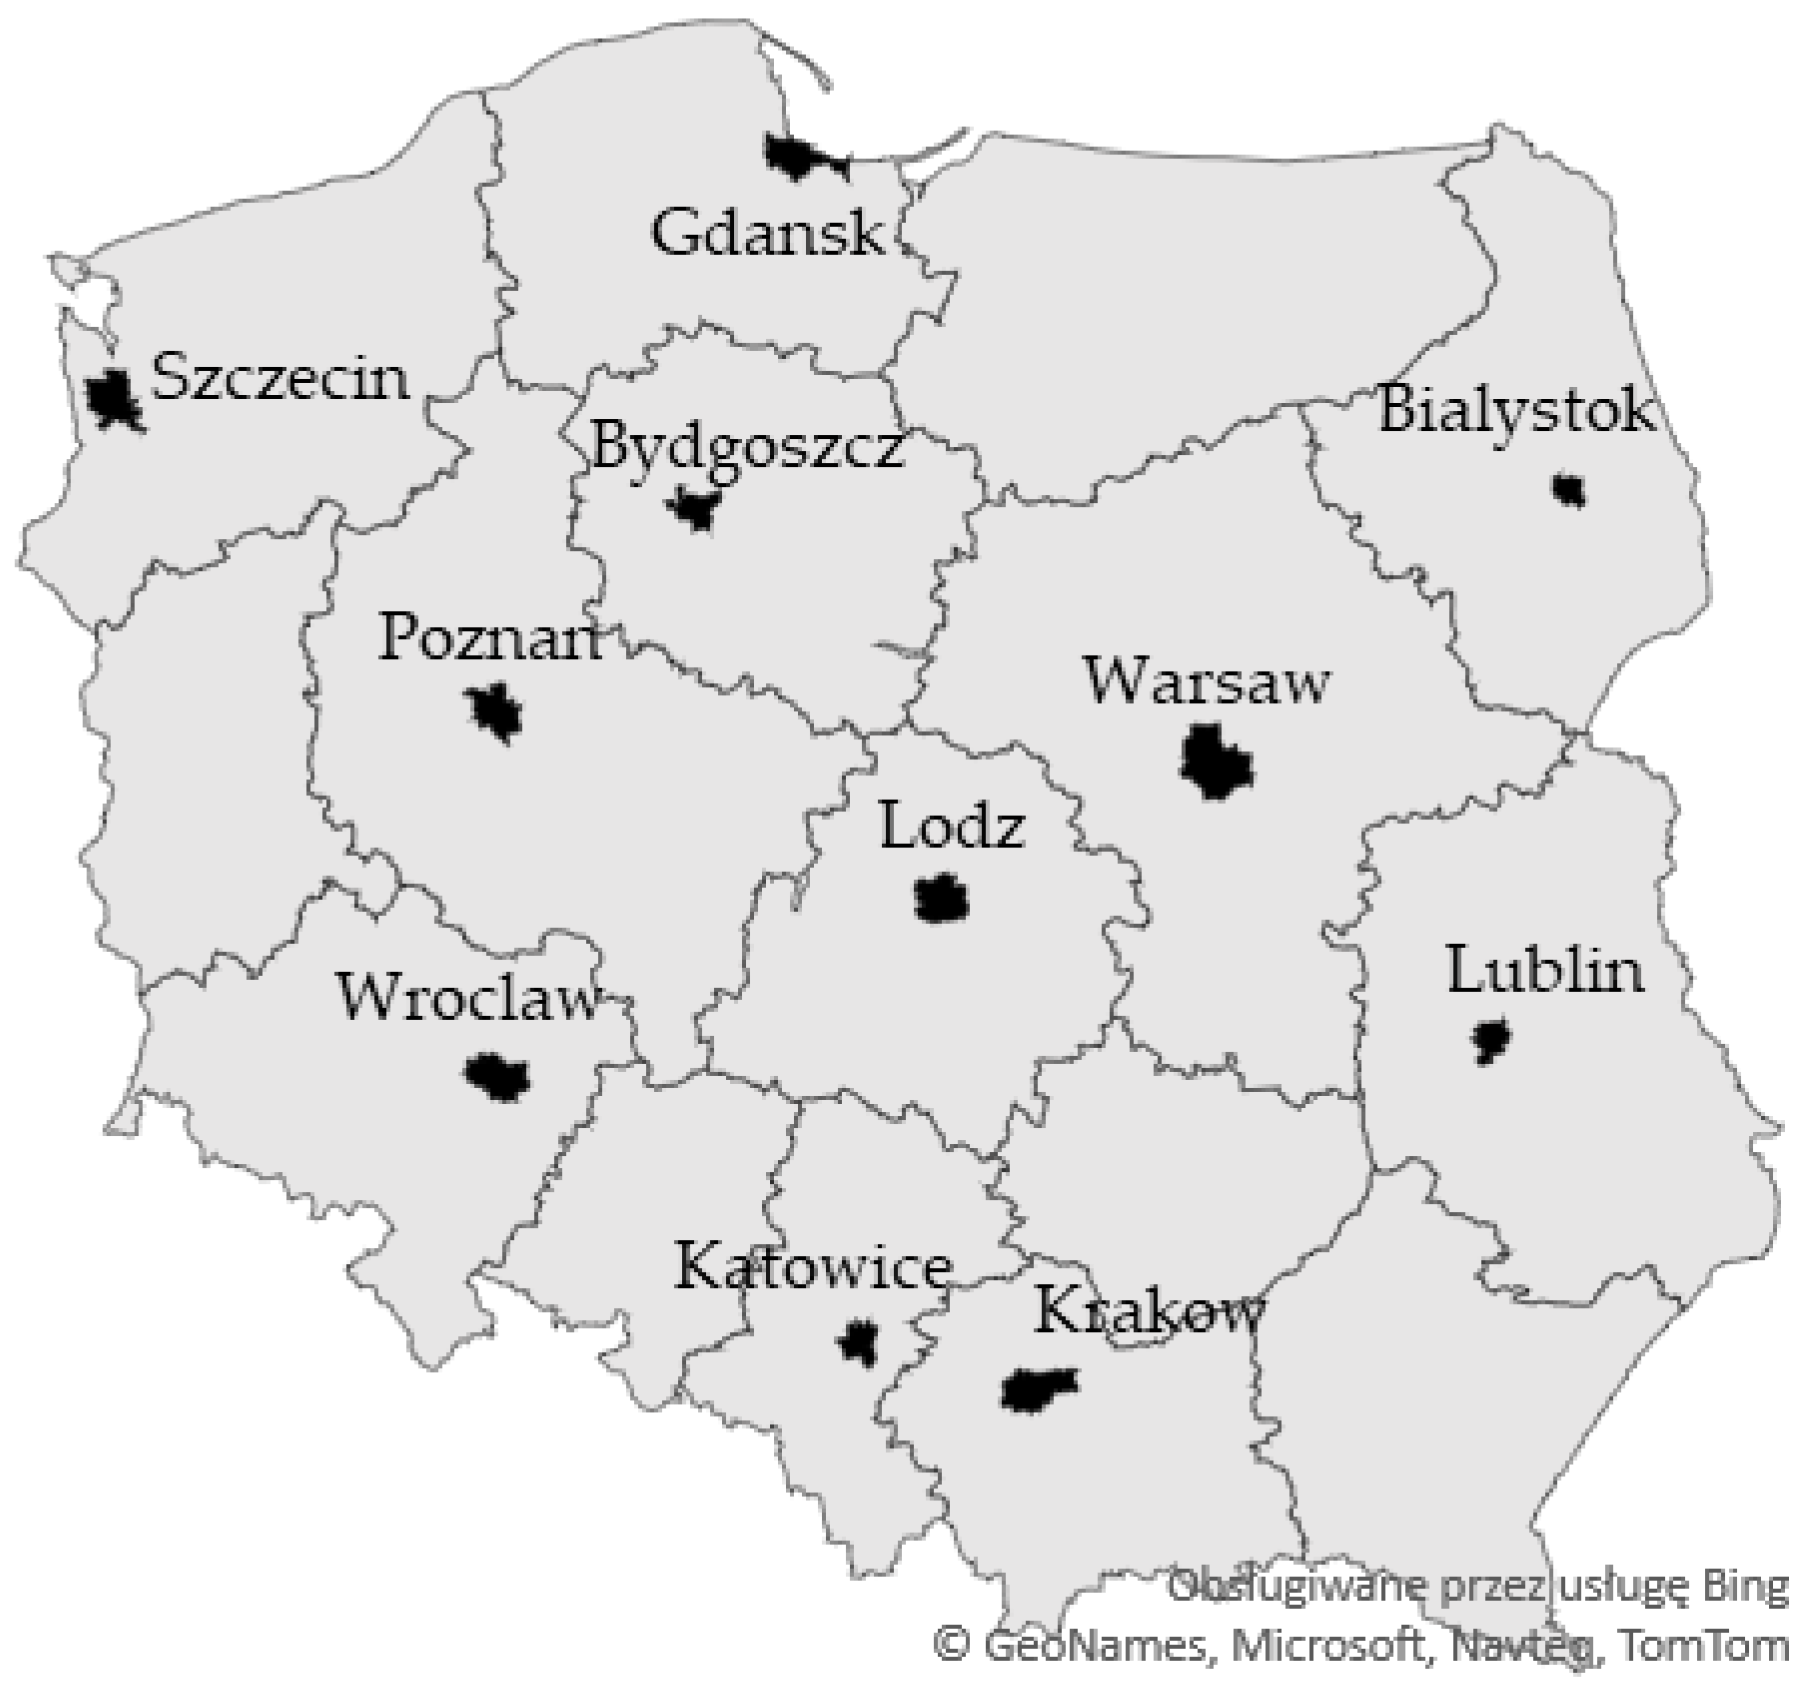
2.1. Characterization of Municipalities

An assessment of the ecological and economic effects of GRs was carried out within the 11 largest municipalities in Poland (Figure 1) with a population >0.250 mil. Poland has a temperate, warm, transitional climate, a total population of 38.3 mil. inhabitants and covers an area of 312,722 km2. The average annual precipitation is around 583 mm [44].
The list of municipalities, as well as their characterization and references are set out in Table 2. The household water price in the year 2020 for each municipality, is published on the web page of the municipal water company [45,46,47,48,49,50,51,52,53,54,55].

2.2. Ecological and Economic Effects of Water Retention

A method of calculating ecological and economic effects was proposed. Usually, the GRs water retention was presented as a percentage of water supplied to the GRs. However, we made an attempt to recalculate it for a natural unit (m3) and convert into a monetary unit. Based on the difference between the water harvested on a GR and that drained from a traditional roof, the ecological effect (EE) was calculated as the volume of stored water (m3). The EE, expressed in a monetary unit, was calculated as an economic effect (EcE). The data needed for the calculations are presented in Table 2. The general water retention level (60%) of GRs, as an average, is taken from Table 1. The runoff coefficient for built-up areas is 0.95 [58], and the assumption is made that GRs constitute 1% of the municipality area.
The calculations of the ecological and economic effects were made according to Equations (1) and (2):
E E = ( A · P · R ) ( A · P · ψ ) ,
E c E = E E · C ,
where: EE is an ecological (environmental) effect, equal to the water retained by the GRs [m3/yr]; EcE is an economic (environmental) effect, equal to the monetary benefit of the retained water on the GRs [USD/yr]; A is the GR surface area [m2]; P is the average annual precipitation [m]; R is the average GR retention (Table 1) [%]; ψ is the runoff coefficient [-] and C is the average water price [USD/m3].

2.3. Economic Analysis of Green Roofs

The economic analyses of the profitability of GR investments corresponding to 1 m2 of intensive and extensive GRs, were based on the NPV and calculated using the standard formula (Equation (3)):
N P V =     I + C F 1 1 + r + C F 2 ( 1 + r ) 2 + + C F t ( 1 + r ) t ,
where: I is the initial investment [USD], CF is cash flow [USD], r is the discount rate [%] and t is time [years]. Cash flows (CF) [USD] are defined as the difference between the benefits and the costs of GRs.
The assumptions for the NPV analysis are presented in Table 3. The value of the discount rate was adopted from previous studies concerning environmental services [59,60]. The lifespan of GRs was calculated, based on the depreciation rate, specified in Polish law [61]. The exchange rate of USD1 = 3.7312PLN was used [62]. Yearly price indices, as a measure of the inflation rate, were used to recalculate the costs from the existing literature, which were expressed in terms of prices and related to a year other than 2020 [63]. The cost of water retention was calculated as a product of the water price and precipitation (Table 2) in the municipalities being assessed, and the average water retention on the GRs (Table 1). We also assumed that intensive GRs required maintenance every year and vegetable planting (0.5 of the GRs in each area) every two years. In the case of extensive GRs, we factored in maintenance costs every second year, whereas vegetable planting costs were incurred only in the first year. All the benefits, highlighted in Table 1, were taken into account in the calculation regarding intensive GRs. In the case of extensive GRs, the benefit of providing recreational space was excluded.
The internal rate of return (IRR) is the interest rate at which the NPV of all the CFs (both positive and negative) from a project or investment becomes equal to zero. The IRR is used to evaluate the attractiveness of a project or investment. The IRR can be mathematically calculated following Equation (4).
C F 0 + C F 1 ( 1 + r ) 1 + C F 2 ( 1 + r ) 2 + + C F t ( 1 + r ) t ,
where, CF is cash flow in the last period (t) [USD] and r is the IRR to be calculated [%].
The discounted payback period (DPP) is included in the dynamic methods of assessing the profitability of investment projects. It sets the time after which the investment inflows will cover the investments incurred during the project, after which time they will be recovered [65]. The DPP value was determined from the dependence in Equation (5).
D P P k = Y k + | N P V k Y | C F k ( Y + 1 ) ,
where DPPk is the DPP, designated for option k, [years]; Yk constitutes the number of full years before the total return is determined for option k, [years]; CFk(Y+1) is the discounted cash flow in the year (Y + 1), designated for variant k, [USD]; NPVkY is the unrecovered expenditure, determined at the beginning of the year (Y + 1), designated for variant k, [USD].
Additionally, a sensitivity analysis for a different discount rate (1%; 3%; 6%) and for a water retention of 60%, was also conducted. The discount rate of 1 and 3% were chosen to observe the increasing economic efficiency of projects, in contrast to 6% when the NPV started to show negative values.

3. Results

3.1. Ecological and Economic Effects of Water Retention

Table 4 shows the water retention of both ecological effects, expressed per 1000 cubic meters and the economic effects per 1000 USD. These statistics illustrate the difference in the aforementioned effects for the 11 municipalities analysed.
The EE in terms of water retention is calculated as the difference between the drained water on the traditional roof (measured in m3) and the water retained on the GR (measured in m3). The water retained on GRs is calculated by multiplying the GR area in the city, precipitation, and the index of GR water retention from GRs (60%). The drained water is calculated by multiplying the GR area in the city, the precipitation, and the runoff coefficient (0.95). The EE of water retention ranges from 205,000 m3 in Bialystok and 269,000 m3 in Lublin to 776,000 m3 in Krakow and 90,700 m3 in Warsaw. Such a difference is mainly a result of the existing GR area that was lowest in Bialystok (1.02 mil m2), Lublin (1.47 mil m2), Katowice (1.64 mil m2), Bydgoszcz (1.76 mil m2), Poznan (2.61 m2), Gdansk (2.62 m2), Wroclaw (2.92 mil m2), and Lodz (2.93 mil m2). The largest GR area was in Warsaw (5.17 mil m2), Krakow (3.27 mil m2) and Szczecin (3.00 mil m2). Hence, the average EE in relation to water retention in the cities analysed, was 507,000 m3 (SD ± 208,000). The size of the GR area determines the greatest EE in terms of water retention. Apart from the assumed area, the EE is also influenced by precipitation in a particular municipality. The average noted precipitation of 11 municipalities is 567 mm (SD ± 60 mm) with a minimum value of 501 mm for Warsaw and a maximum of 686 mm for Katowice.
Similar to the EE, the EcE of water retention, measured per 1000 USD was the highest in Warsaw, Krakow and Lodz (Table 4). Similarly, the lowest EcE was in Bialystok and Lublin. The average EcE for these 11 cities was 631,000 USD (SD ± 235,000). The EcE of water retention is calculated by multiplying the EE and the water price. Therefore, the water price is the crucial dependent variable in the calculation of the EcE. The average water price in 2020 among the group of municipalities analysed, was 1.25 UDS/m3 (SD ± 0.17 UDS/m3). The inhabitants of Lublin and Bialystok have the lowest water prices (1.00 UDS/m3), the highest price was in Katowice (1.56 UDS/m3) which is located in a mining area where they do not possess their own water intakes and are obliged to buy water from shopping wells [66]. On the other hand, the largest Polish city (Warsaw) has one of the lowest water prices in Poland (1.04 UDS/m3).

3.2. An Economic Analysis of GRs

This analysis compares the investment costs of the intensive and extensive GRs with the resulting water retention savings during the 40-year lifespan of the investment, in order to decide on the effectiveness of such a project. Table 5 presents the results of the effectiveness of intensive and extensive GRs per 1 m2, calculated using the NPV, the IRR, and the DPP method. These three indicators, classified according to the discounted methods, are used to evaluate the economic efficiency of the investment project.
It is assumed that investments with a positive NPV will be profitable. This means that the value of the revenues (cash inflows) is greater than the costs (cash outflows). Both intensive and extensive GRs have a positive NPV. However, intensive GRs are more cost-effective than extensive GRs, primarily due to the benefits of providing recreational space. The average NPV per 1 m2 of intensive GR is over 13 times higher than the average NPV per 1 m2 of extensive GR.
The best NPV per 1 m2 of intensive GR is in Katowice (64.42 USD), Krakow (61.71 USD), Wroclaw (61.62 USD), Bydgoszcz (61.01 USD), Szczecin (60.81 USD), Lodz (60.32 USD), Gdansk (60.31 USD), Poznan (60.27 USD), and Bialystok (60.16 USD). The lowest NPV per 1 m2 of intensive GR is calculated for Lublin (58.94 USD) and Warsaw (58.79 USD). When analysing the NPV per 1 m2 of extensive GR, the lowest value was calculated for Warsaw (2.50 USD), Lublin (2.66 USD), Bialystok (3.88 USD), Poznan (3.98 USD), Gdansk (4.02 USD), Lodz (4.03 USD), Szczecin (4.52 USD), and Bydgoszcz (4.72 USD). The greatest NPV per 1 m2 of extensive GR was calculated for Wroclaw (5.33 USD), Krakow (5.43 USD), and Katowice (8.14 USD).
The next tool demonstrating effectiveness is that of the IRR, which compares returns to costs, by finding the interest rate that produces a zero NPV for the investment cash flow stream. In other words, the IRR is defined as the discount rate at which investors can ensure that the analysed investment makes more money than its actual cost. Should the IRR of the analysed project exceed the investors’ required rate of return, that project is most likely to be accepted. From an investor point of view, the most attractive projects are those with the highest IRR. The intensive GR projects within the municipalities analysed have, on average, an IRR seven times higher, than extensive GR projects (Table 5). The most attractive IRR is calculated for Katowice (7.08%), Krakow (6.80%), Wroclaw (6.79%), Bydgoszcz (6.72%), Szczecin (6.70%), Lodz, Poznan and Gdansk (6.65%), with a less attractive IRR for Bialystok (6.64%), Lublin (6.51%), and Warsaw (6.49). As far as extensive GRs are concerned, the most attractive intrinsic rate of return is expected to generate projects in Katowice (1.70%), Krakow (1.15%), Wroclaw (1.13%), Bydgoszcz (1.00%), Szczecin (0.96%), Bialystok (0.83%), Lublin (0.57%), Gdansk and Lodz (0.86%), Poznan (0.85%), and Warsaw (0.54%).
The greater effectiveness of intensive GR investments, by comparison with extensive GRs, also confirms the DPP (Table 5). The DPP is the amount of time (in years) for the initial cost of a project to equal the discounted value of expected cash flows. DPP is a tool which ranks investment projects and measures the payback time. On average it takes six years and 1.5 months (73.5 months) to break even from the outlay of the initial expenditure, by discounting future cash flows and recognizing the time value of money. In the case of extensive GRs, the investment cost will yield a return after 11.83 years (141.9 months). Katowice registered the fastest return on investment in relation to GRs of five years and 11 months; Wroclaw and Krakow registered six years and eight months, Bydgoszcz (six years and 1.2 months), Szczecin (six years and 1.3 months), Poznan, Gdansk and Bialystok (six years and 1.6 months), Lublin (six years and 2.4 months) and Warsaw (six years and 2.5 months). Taking into consideration the DPP of intensive GRs, the return on investment took 10 years and 10 months in Katowice, 11 years and six months in Krakow, 11 years and 6.7 months in Wroclaw, 11 years and eight months in Szczecin and Bydgoszcz, 11 years and 10 months in Gdansk and Lodz, 11 years and 11.1 months in Poznan, 11 years and 11.4 months in Bialystok, 12 years and three months in Lublin, and 12 years and four months in Warsaw.
The rule in relation to the IRR is that an investment should only be selected when the cost of capital is lower than the IRR. Hence, the final decision on investment depends on the discount rate (r) that may be derived from the cost of the capital, required to make the investment. Table 6 presents the sensitivity analysis of the NPV of intensive and extensive GR projects.
Apart from the cost of capital, the discount rate (r) is primarily determined by assessing the investment risks involved, the current opportunities in the roofing industry, the rates of return for similar investments, and other factors that could directly affect an investment. Assuming that the discount rate equals 1%, the NPV per 1 m2 of the intensive GRs, ranges from 174.55 USD in Katowice to 163.76 USD in Warsaw. Similarly, the NPV per 1 m2 of extensive GRs ranges from 44.78 USD in Katowice to 33.99 USD in Warsaw. Even during the era of almost zero-interest rates, it is impossible to calculate the cost of capital at a level of 1%. Taking into consideration the data in Table 5, and comparing the 1% discount rate with the IRR, investors should reject extensive GR projects in Bialystok, Warsaw, Lodz, Poznan, Gdansk, Szczecin, and Lublin (IRR < r). The discount rate at a level of 3% decreases the NPV per 1 m2, on average, by approximately 40% for intensive GRs and 55% for extensive GRs. In this case, the NPV per 1 m2 ranges from 106.29 USD in Katowice to 98.69 USD in Warsaw. In line with the lowest interest rates of loans for green investment, the cost of borrowing capital from banks is currently running at around a minimum of 3%. Therefore, investors should take into account a discount rate higher than 3% and lower than 6%. In Poland, the prevailing approach for the economic evaluation of public projects follows EU Commission requirements, with a constant rate of 5%, irrespective of the timescale of the project cycle [67]. If the discount rates are calculated at a level of 6% the project NPV per 1 m2 is, on average, over twice lower for intensive GRs. Additionally, extensive GR projects should be rejected by investors in Warsaw, Lodz, Poznan, Gdansk, Lublin, and Bialystok (NPV < 0).
The data in Table 5 were calculated at the 5% discount rate. From a financial point of view, only intensive GR projects can be accepted as a good investment by investors (NPV > 0, IRR > 5%). Extensive GR projects are not profitable for investors. In summary, the most attractive projects are the intensive GR projects in Katowice, Krakow, Wroclaw, and Bydgoszcz.

4. Discussion

The monetary (financial and economic) environmental effect of GR water retention depends mainly on the water price. The report [68] shows the average water price in Poland to be at the level of 3.34 USD/m3 (recalculated from the Euro on 02 February 2021). This is a similar value, corresponding to the Polish data presented by State Water Holding Polish Waters (3.22 USD/m3) [69]. However, the price range is extensive, ranging from 0.35 to 15.28 USD/m3. Comparing these values with the water prices in the largest Polish municipalities, they are much lower than the average. On the other hand, the Polish water price is lower than the EU-28 average price (4.30 USD/m3) [68]. Countries with the lowest water prices are Bulgaria (1.30 USD/m3), Greece (1.49 USD/m3), Romania (1.72 USD/m3), Spain (2.09 USD/m3), and Cyprus (2.21 USD/m3). The highest water prices may be found in Scandinavian countries, such as Norway (9.47 USD/m3) and Finland (7.18 USD/m3), as well as Denmark (11.32 USD/m3) however, these prices are still lower than the maximum Polish price. The low price of water for domestic supply in urban areas, does not encourage investment in GRs.
In our calculation, we assumed a GR area of 1% in the selected municipalities, since there are no data relating to the areas covered by GRs in Poland or the selected municipalities. Our assumptions were very bold, because by recalculating population numbers and assuming the 1% municipality area, the average area of GRs per capita in Poland (4.79 m2/inhabitant) rivals other cities around the world, namely, Basel (5.71 m2/inhabitant), followed by Stuttgart (3.38 m2/inhabitant) and Linz (2.57 m2/inhabitant) [70]. In the case of Basel (Switzerland), the high ratio is a result of regulations stipulating the construction of new and renovated flat roofs, which has resulted in the greening of 15% of flat roofs [14]. On the other hand, it is estimated that building roof surfaces cover 20–25% of the urban areas [6] so assumptions of 1% GRs area seems to be justified.
To evaluate the efficiency of GRs the total benefits and costs need to be converted into an NPV, by means of discounting. The NPV is one of the most popular dynamic methods commonly used worldwide in almost assessing the effectiveness of long-term investment projects. For these reasons, the results are easy to compare. Usually, calculations are made for an estimated lifespan of a minimum of 40 [16,18,20,28] to 50 years [71,72] or a maximum of 55 years [73]. The lifespan is an important factor that influences the analysis. The second factor that affects the NPV results is the discount rate. The lower the discount rate, the more effective and profitable the NPV. The value of the discount rate can vary between regions, for example, Mahmoud et al. [28] and Bianchini and Hewage [16] used a 2% rate, as well as an 8% rate; Carter and Keeler [18] proposed 4% and Blackhurst et al. [74], 5%. In addition, the final value of the NPV influences the investment and maintenance costs of GRs. For these reasons, the obtained NPV results are varied. The NPV relating to the energy and economic viability of the GR technology of a four-bedroom residential building, ranges from 6.34 USD/m2 to 18.14 USD/m2 [28]. The results also differ in the case of analysing the private or public GR sector. The NPV equals 96.27 and 16,735.3 USD/m2 for private and public roofs, respectively [18]. A comparison of the NPV of a conventional roof system with an extensive GR system shows that after 40 years, the NPV for the GR is between 20.3 and 25.2% less than the NPV for the conventional roof [20]. Carter and Keeler [18] also discovered that the NPV of the conventional roof is currently between 10% and 14% less expensive than that of GRs. On the other hand, GRs generate several benefits [14,75] and despite the analyses carried out, they are subjectively valued. GRs are also viewed as a tool to enhance the aesthetic appeal of urban spaces [14].

5. Conclusions

GRs are one of many instruments that aim to encourage more urban greening to ensure that the urban environment becomes greener, healthier and more resilient to the impact of climate change. Such a solution can potentially help manage stormwater runoff, reduce urban heat island effects, and regulate building temperature. According to the results of this study, the EE and EcE of GR water retention are most significant in cities with the largest GR area (Warsaw, Krakow, Wroclaw, and Szczecin). The average EE and EcE for assessed municipalities equals 570,000 (±208,000) m3/yr and 631,000 (±235,000) USD/yr. Intensive GR projects are characterized by greater economic efficiency, a higher IRR, as well as a shorter DPP than extensive GR projects. The average NPV for intensive GRs is more than 13 times higher than for extensive GRs and resulted in 60.77 and 4.47 USD per 1 m2, respectively. The higher the water price, the more attractive the intensive GR project. These determinants will influence the decisions of investors more and more with regard to rainwater harvesting in towns and cities. Water is essential both for life and as an indispensable resource for the green economy. The diamond–water paradox of Adam Smith still seems to be relevant: water, which is essential for life, has a high value in terms of usage but commands a low market price; jewellers’ diamonds, which are luxury goods, have a low use-value but command a high market price [76]. Such dichotomies between economic value, price, and cost determine the consumer’s ecological behaviour and further sustainable development.

Author Contributions

Conceptualization, A.B. and A.S.; methodology, A.B.; formal analysis, A.B.; investigation, A.B.; resources, A.B. and A.S.; writing—original draft preparation, A.B. and A.S.; writing—review and editing, A.B. and A.S.; visualization, A.B.; supervision, A.B. and A.S. All authors have read and agreed to the published version of the manuscript.

Funding

This research received no external funding.

Institutional Review Board Statement

Not applicable.

Informed Consent Statement

Not applicable.

Data Availability Statement

Data is contained within the article.

Conflicts of Interest

The authors declare no conflict of interest.

References

  1. Eurostat. 2020. Available online: https://ec.europa.eu/eurostat/web/products-eurostat-news/-/EDN-20200207-1 (accessed on 31 January 2021).
  2. EEA. SOER 2015—The European environment—state and outlook 2015, European Environment Agency. 2015. Available online: http://www.eea.europa.eu/soer. (accessed on 15 December 2020).
  3. European Commission. 2020. Available online: https://knowledge4policy.ec.europa.eu/foresight/topic/continuing-urbanisation/developments-and-forecasts-on-continuing-urbanisation_en (accessed on 1 February 2021).
  4. da Silva, M.; Najjar, M.K.; Hammad, A.W.A.; Haddad, A.; Vazquez, E. Assessing the Retention Capacity of an Experimental Green Roof Prototype. Water 2020, 12, 90. [Google Scholar] [CrossRef] [Green Version]
  5. Walters, S.A.; Stoelzle Midden, K. Sustainability of Urban Agriculture: Vegetable Production on Green Roofs. Agriculture 2018, 8, 168. [Google Scholar] [CrossRef] [Green Version]
  6. Abass, F.; Ismail, L.H.; Wahab, I.A.; Elgadi, A.A. A review of green roof: Definition, history, evolution and functions. In IOP Conference Series: Materials Science and Engineering; IOP Publishing: Bristol, UK, 2020; Volume 713. [Google Scholar]
  7. Liu, L.; Jensen, M.B. Green infrastructure for sustainable urban water management: Practices of five forerunner cities. Cities 2008, 74, 126–133. [Google Scholar] [CrossRef]
  8. Ahiablame, L.M.; Engel, B.A.; Chaubey, I. Effectiveness of Low Impact Development Practices: Literature Review and Suggestions for Future Research. Water Air Soil Pollut. 2012, 223, 4253–4273. [Google Scholar] [CrossRef]
  9. Young, R.; Zanders, J.; Lieberknecht, K.; Fassman-Beck, E. A comprehensive typology for mainstreaming urban green infrastructure. J. Hydrol. 2014, 519, 2571–2583. [Google Scholar] [CrossRef]
  10. Bus, A.; Karczmarczyk, A. P-binding mineral materials to enhance phosphate removal using nature-based solutions in urban areas. Desalin. Water Treat. 2020, 205, 198–207. [Google Scholar] [CrossRef]
  11. Grand View Research. 2020. Available online: https://www.grandviewresearch.com/industry-analysis/green-roof-market (accessed on 31 January 2020).
  12. Li, W.C.; Yeung, K.K.A. A comprehensive study of green roof performance from environmental perspective. Int. J. Sustain. Built Environ. 2014, 3, 127–134. [Google Scholar] [CrossRef] [Green Version]
  13. Report on the Environmental Benefits and Costs of Green Roof Technology for the City of Toronto. Available online: https://mpra.ub.uni-muenchen.de/70526/ (accessed on 2 February 2021).
  14. Vijayaraghavan, K. Green roofs: A critical review on the role of components, benefits, limitations and trends. Renew. Sustain. Energy Rev. 2016, 57, 740–752. [Google Scholar] [CrossRef]
  15. Oberndorfer, E.; Lundholm, J.; Bass, B.; Coffman, R.R.; Doshi, H.; Dunnett, N.; Rowe, B. Green roofs as urban ecosystems: Ecological structures, functions, and services. BioScience 2007, 57, 823–833. [Google Scholar] [CrossRef]
  16. Bianchini, F.; Hewage, K. Probabilistic social cost-benefit analysis for green roofs: A lifecycle approach. Build Environ. 2012, 58, 152–162. [Google Scholar] [CrossRef]
  17. Molineux, C.J.; Fentiman, C.H.; Gange, A.C. Characterising alternative recycled waste materials for use as green roof growing media in the U.K. Ecol. Eng. 2009, 35, 1507–1513. [Google Scholar] [CrossRef]
  18. Carter, T.; Keeler, A. Life-cycle cost–benefit analysis of extensive vegetated roof systems. J. Environ. Manag. 2008, 87, 350–363. [Google Scholar] [CrossRef] [PubMed]
  19. MacIvor, J.S.; Lundholm, J. Performance evaluation of native plants suited to extensive green roof conditions in a maritime climate. Ecol. Eng. 2011, 37, 407–417. [Google Scholar] [CrossRef]
  20. Clark, C.; Adriaens, P.; Talbot, F.B. Green roof valuation: A probabilistic economic analysis of environmental benefits. Environ. Sci. Technol. 2008, 42, 2155–2161. [Google Scholar] [CrossRef] [PubMed]
  21. Strzelecka, A.M.; Zawadzka, D. Why Households Borrow Money? Socio-Economic Factors Affecting Households Debts: A Model Approach. Eur. Res. Stud. J. 2020, 23, 820–839. [Google Scholar] [CrossRef]
  22. Yuliani, S.; Hardiman, G.; Setyowati, E. Green-roof: The role of community in the substitution of green-space toward sustainable development. Sustainability 2020, 12, 1429. [Google Scholar] [CrossRef] [Green Version]
  23. Yu, W.D.; Cheng, S.T.; Miao, C.M.; Perng, G.Y. Green innovation of green roof technology-a case study. Mater. Sci. Eng. Technol. 2017, 48, 420–429. [Google Scholar] [CrossRef]
  24. Igartua, J.I.; Garrigós, J.A.; Hervas-Oliver, J.L. How innovation management techniques support an open innovation strategy. Res. Technol. Manag. 2010, 53, 41–52. [Google Scholar] [CrossRef]
  25. Francis, L.F.M.; Jensen, M.B. Benefits of green roofs: A systematic review of the evidence for three ecosystem services. Urban For. Urban Green. 2017, 28, 167–176. [Google Scholar] [CrossRef]
  26. Akbari, H.; Pomerantz, M.; Taha, H. Cool surfaces and shade trees to reduce energy use and improve air quality in urban areas. Sol. Energy 2001, 70, 295–310. [Google Scholar] [CrossRef]
  27. Zinzi, M.; Agnoli, S. Cool and Green Roofs. An energy and comfort comparison between passive cooling and mitigation urban heat island techniques for residential buildings in the Mediterranean region. Energy Build. 2012, 55, 66–76. [Google Scholar] [CrossRef]
  28. Mahmoud, A.S.; Asif, M.; Hassanain, M.A.; Babsail, M.O.; Sanni-Anibire, M.O. Energy and economic evaluation of green roofs for residential buildings in hot-humid climates. Buildings 2017, 7, 30. [Google Scholar] [CrossRef]
  29. Hoekstra, A.Y. Virtual Water Trade: Proceedings of the International Expert Meeting on Virtual Water Trade, Delft, The Netherlands, 12–13 December 2002; Value of Water Research Report Series No. 12; UNESCO-IHE: Delft, The Netherlands, 2003. [Google Scholar]
  30. Metselaar, K. Water retention and evapotranspiration of green roofs and possible natural vegetation types. Resour. Conserv. Recycl. 2012, 64, 49–55. [Google Scholar] [CrossRef]
  31. Wong, G.K.L.; Jim, C.Y. Quantitative hydrologic performance of extensive green roof under humid-tropical rainfall regime. Ecol. Eng. 2014, 70, 366–378. [Google Scholar] [CrossRef]
  32. Stovin, V.; Poe, S.; Berreta, C. A modeling study of long term green roof retention performance. J. Environ. Manag. 2013, 131, 206–215. [Google Scholar] [CrossRef] [PubMed] [Green Version]
  33. Graceson, A.; Hare, M.; Monaghan, J.; Hal, N. The water retention capabilities of growing media for green roofs. Ecol. Eng. 2013, 761, 328–334. [Google Scholar] [CrossRef]
  34. Lee, J.Y.; Lee, M.J.; Han, M. A pilot study to evaluate runoff quantify from green roofs. J. Environ. Manag. 2015, 152, 171–176. [Google Scholar] [CrossRef]
  35. Longobardi, A.; D’Ambrosio, R.; Mobilia, M. Predicting Stormwater Retention Capacity of Green Roofs: An Experimental Study of the Roles of Climate, Substrate Soil Moisture, and Drainage Layer Properties. Sustainability 2019, 11, 6956. [Google Scholar] [CrossRef] [Green Version]
  36. Gnecco, I.; Palla, A.; Lanza, L.G.; La Barbera, P. A green roof experimental site in the Mediterranean climate: The storm water quality issue. Water Sci. Technol. 2013, 68, 1419–1424. [Google Scholar] [CrossRef]
  37. Baryła, A.; Karczmarczyk, A.; Bus, A. Role of Substrates Used for Green Roofs in Limiting Rainwater Runoff. J. Ecol. Eng. 2018, 19, 86–92. [Google Scholar] [CrossRef]
  38. Teemusk, A.; Mander, Ű. Rainwater runoff quantity and quality performance from a green roof: The effects of short-term events. Ecol. Eng. 2007, 30, 271–277. [Google Scholar] [CrossRef]
  39. Baryła, A.; Karczmarczyk, A.; Brandyk, A.; Bus, A. The influence of a green roof drainage layer on retention capacity and leakage quality. Water Sci. Technol. 2018, 77, 2886–2895. [Google Scholar] [CrossRef] [Green Version]
  40. Burszta-Adamiak, E.; Stańczyk, J.; Łomotowski, J. Hydrological performance of green roofs in the context of the meteorological factors during the 5-year monitoring period. Water Environ. J. 2019, 33, 144–154. [Google Scholar] [CrossRef] [Green Version]
  41. Mekonnen, M.M.; Hoekstra, A.Y. National Water Footprint Accounts: The Green, Blue and Grey Water Footprint of Production and Consumption; Value of Water Research Report Series; UNESCO-IHE: Delft, The Netherlands, 2011; Volume 50, Available online: https://www.waterfootprint.org/media/downloads/Report50-NationalWaterFootprints-Vol1.pdf (accessed on 6 February 2021).
  42. Environment 2020, Warsaw 2020. Available online: https://stat.gov.pl/obszary-tematyczne/srodowisko-energia/srodowisko/ochrona-srodowiska-2020,1,21.html (accessed on 31 January 2021).
  43. Borowski, P.F. Nexus between water, energy, food and climate change as challenges facing the modern global, European and Polish economy. AIMS Geosci. 2020, 6, 397–421. [Google Scholar] [CrossRef]
  44. Concise Statistical Yearbook of Poland, Warsaw 2020. Available online: https://stat.gov.pl/obszary-tematyczne/roczniki-statystyczne/roczniki-statystyczne/maly-rocznik-statystyczny-polski-2020,1,22.html (accessed on 31 January 2021).
  45. Water Price Warsaw. Available online: https://www.mpwik.com.pl/view/taryfa-za-zbiorowe-zaopatrzenie-w-wode-i-zbiorowe-odprowadzanie-sciekow-na-terenie-m-st-warszawy-gmin-michalowice-nieporet-raszyn-serock-wieliszew-oraz-miast-piastow-i-pruszkow-na-okres-od-dnia-2-czerwca-2018-roku-do-dnia-2-czerwca-2021-roku (accessed on 31 January 2021).
  46. Water Price Krakow. Available online: https://wodociagi.krakow.pl/strefa-klienta/taryfa-i-cenniki.html (accessed on 31 January 2021).
  47. Water Price Lodz. Available online: http://www.zwik.lodz.pl/dla-klientow/taryfy-i-cenniki/oplaty-od-13062018r-do-12062021r/ (accessed on 31 January 2021).
  48. Water Price Wrocław. Available online: https://www.mpwik.wroc.pl/strefa-klienta/taryfy-i-cenniki/ (accessed on 31 January 2021).
  49. Water Price Poznań. Available online: https://bip.poznan.pl/bip/oplaty-za-wode-i-scieki,p,49429,49430,49431.html (accessed on 31 January 2021).
  50. Water Price Gdańsk. Available online: https://www.sng.com.pl/StrefaKlienta/cenywodyisciekow.aspx (accessed on 31 January 2021).
  51. Water Price Szczecin. Available online: http://zwik.szczecin.pl/klienci/faktury_i_rozliczenia/aktualne-taryfy-i-opaty (accessed on 31 January 2021).
  52. Water Price Bydgoszcz. Available online: http://bip.mwik.bydgoszcz.pl/index.php/komunikaty/oplaty-za-wode-i-scieki/rok-2018 (accessed on 31 January 2021).
  53. Water Price Lublin. Available online: http://www.mpwik.lublin.pl/index.php?option=site&id=3&sid=13&subid=206 (accessed on 2 February 2021).
  54. Water Price Bialystok. Available online: https://www.wobi.pl/images/aktualnosci/BI_RET_070_684_2018_IT.pdf (accessed on 2 February 2021).
  55. Water Price Katowice. Available online: https://bip.katowice.eu/Lists/Dokumenty/Attachments/106810/Og%C5%82oszenie%20Taryfy%202018-2021.PDF (accessed on 31 January 2021).
  56. Baza Demografia, Główny Urząd Statystyczny. Available online: www.demografia.stat.gov.pl (accessed on 1 December 2020).
  57. Population. Size and Structure and Vital Statistics in Poland by Territorial Division in 2020. As of 30th June, Warsaw, 2020. Available online: https://stat.gov.pl/obszary-tematyczne/ludnosc/ludnosc/ludnosc-stan-i-struktura-ludnosci-oraz-ruch-naturalny-w-przekroju-terytorialnym-stan-w-dniu-30-06-2020,6,28.html (accessed on 31 January 2021).
  58. PN-EN 12056-3: 2002. Gravity Drainage Systems for Buildings—Part 3: Rainwater Pipes—Layout Design and Calculations; PKN: Warsaw, Poland, 2002. [Google Scholar]
  59. Sikorska, D.; Macegoniuk, S.; Łaszkiewicz, E.; Sikorski, P. Energy crops in urban parks as a promising alternative to traditional lawns–Perceptions and a cost-benefit analysis. Urban For. Urban Green. 2020, 49, 126579. [Google Scholar] [CrossRef]
  60. Karczmarczyk, A.; Bus, A.; Baryła, A. Assessment of the Efficiency, Environmental and Economic Effects of Compact Type On-Site Wastewater Treatment Plants—Results from Random Testing. Sustainability 2021, 13, 982. [Google Scholar] [CrossRef]
  61. Act of 26 July 1991 on Personal Income Tax. Polish Journal of Laws of 2020, item 1426.
  62. National Bank of Poland. Available online: https://www.nbp.pl/home.aspx?f=/kursy/arch_a.html (accessed on 14 January 2021).
  63. Central Statistical Office in Poland. Available online: https://stat.gov.pl/ (accessed on 2 February 2021).
  64. Jung, Y.; Yeo, K.; Oh, J.; Lee, S.; Park, J.; Song, C.G. The economic effect of green roofs on non-point pollutant sources management using the replacement cost approach. KSCE J. Civ. Eng. 2016, 20, 3031–3044. [Google Scholar] [CrossRef]
  65. Ehrhardt, M.C.; Brigham, E.F. Corporate Finance: A Focused Approach, 5th ed.; Cengage Learning: Mason, OH, USA, 2013. [Google Scholar]
  66. Tap Water in Katowice. Available online: https://www.wodociagi.katowice.pl/main/szluknij-sie-z-kokotka (accessed on 5 February 2021).
  67. European Commission. Guide to Cost-Benefit Analysis of Investment Projects, Economic Appraisal Tool for Cohesion Policy 2014–2020. Directorate-General for Regional and Urban Policy. 2014. Available online: https://ec.europa.eu/regional_policy/sources/docgener/studies/pdf/cba_guide.pdf (accessed on 1 February 2021).
  68. The Governance of Water Services in Europe 2020 Edition. EurEau, Brussels 2020. Available online: https://www.eureau.org/resources/publications/5268-the-governance-of-water-services-in-europe-2020-edition-2/file (accessed on 2 February 2021).
  69. Water and Sewage Tariffs. What Affects Prices? State Water Holding Polish Waters, Wasaw 2019. Available online: https://wody.gov.pl/images/dokumenty/broszura-taryfy.pdf (accessed on 2 February 2021).
  70. Meadowbank Development Green Roof Options Appraisal, April 2020. Available online: https://www.nature.scot/sites/default/files/2020-05/Meadowbank%20Develoment%20Green%20Roof%20Options%20Appraisal.pdf (accessed on 2 February 2021).
  71. Tsang, S.W.; Jim, C.Y. Game-theory approach for resident coalitions to allocate green-roof benefits. Environ. Plan 2011, 43, 363–377. [Google Scholar] [CrossRef]
  72. Comparative Life Cycle Assessment of Standard and Green Roofs. Available online: https://pubs.acs.org/doi/abs/10.1021/es0517522 (accessed on 7 February 2021).
  73. Acks, K. A Framework of Cost–Benefit Analysis of Green Roofs: Initial Estimates; Columbia University Center for Climate Systems Research and NASA Goddard Institute for Space Studies: New York, NY, USA, 2006. [Google Scholar]
  74. Blackhurst, M.; Hendrickson, C.; Matthews, H.S. Cost-Effectiveness of Green Roofs. J. Archit. Eng. 2010, 16, 136–143. [Google Scholar] [CrossRef]
  75. Shafique, M.; Kim, R.; Rafiq, M. Green roof benefits, opportunities and challenges—A review. Renew. Sustain. Energy Rev. 2018, 90, 757–773. [Google Scholar] [CrossRef]
  76. Grafton, R.Q.; Chu, L.; Wyrwoll, P. The paradox of water pricing: Dichotomies, dilemmas, and decisions. Oxford Rev. Econ. Policy 2020, 36, 86–107. [Google Scholar] [CrossRef] [Green Version]
Figure 1. Location of municipalities assessed in Poland.
Sustainability 13 02403 g001
Table 1. Water retention on selected green roofs (GRs).
GR TypeLocationType of SubstrateSubstrate Thickness [cm]Retention [%]
Extensive and intensive [30]NetherlandsFine subsoil sand, subsoil peat, topsoil clayey peat, peat moss5, 10, 20, 40, 60, and 80Average from 55 to 75
Intensive [31]Hong Kong, ChinaLoamy sand to sandy loam soil, decomposed granite, a natural saprolitic soil with hydrophilic mineral rock wool layer40 and 80Average from 39 to 43
Extensive [32]UKLightweight growing media overlying a drainage layer5 (prototype)Average of 34
Extensive [33]Yorkshire, UKFine crushed brick, fine crushed tile and pelletized power station fly ash2044
Extensive [34]Seoul, KoreaVolcanic materials and soil with peat moss, perlite, and a drainage plate20From 43 to 61
Extensive [35]Salerno, ItalyA mix of blond peat, Baltic brown peat, zeolites, and simple non-composted vegetable primer (coconut fibers) and mineral fertilizer15 (prototype)Above 75
Between 50 and 100
Extensive [36]Genoa, ItalyLapillus (70%) with pumice and peat or lapillus (70%) with pumice, zeolite, and peat20Average of 85
Intensive [37]Warsaw, PolandWashed sand with mineral grits (chalcedonite, brick, LECA), low moor peat and compost4From 8.3 to 100
Average 54
Extensive [38]Tartu, EstoniaLWA (66%) with humus (30%) and clay (4%)1087.5
Intensive [39]Warsaw, Polandwashed
Sand, chalcedony, clay, low peat, and compost with expanded clay
1567.5
Extensive [40]Wroclaw, PolandGrowing medium with drainage properties10Average 33.6–81.5
Table 2. Characteristics of assessed municipalities.
MunicipalityPopulation [mil] [56]Total Area
[km2] [57]
Average Annual Precipitation [mm] [44]Water Price
[USD/m3]
Warsaw1.794517.25011.04 [45]
Krakow0.781327.06781.19 [46]
Lodz0.677293.25641.19 [47]
Wroclaw0.644292.85511.45 [48]
Poznan0.534261.85201.28 [49]
Gdansk0.472262.05411.24 [50]
Szczecin0.401300.65421.33 [51]
Bydgoszcz0.347176.05351.38 [52]
Lublin0.340147.55401.00 [53]
Bialystok0.298102.15741.00 [54]
Katowice0.276164.76861.56 [55]
Table 3. Assumptions for the economic analysis.
AssumptionValue Reference
Discount rate, r5%-
Depreciation rate, s2.5%[61]
Life of GR, t 40 years [61]
Costs [USD/m2]
Investment cost of intensive GR45.56Local market
Intensive vegetable planting16.08
Intensive GR maintenance cost4.95
Investment cost of extensive GR26.80
Extensive vegetable planting5.36
Extensive GR maintenance cost1.65
Benefits [USD/m2]
Nitrogen oxide uptake0.11[18]
Carbon reduction0.00017[16]
Mitigation of heat island effect0.81[26,27,64]
Provision of recreational space (average)11.00[16]
Reduction of flood risk0.0024[16]
Habitat creation advantage0.675[28]
Thermal isolation (heating and cooling)0.68[16]
Water retention0.31–0.64Calculated
Table 4. Results of EE and EcE.
MunicipalityThe Ecological Effect, EE [thousand m3]The Economic Effect, EcE [thousand USD]
Warsaw907946
Krakow776923
Lodz579689
Wroclaw565817
Poznan476610
Gdansk496615
Szczecin570757
Bydgoszcz330455
Lublin279278
Bialystok205235
Katowice395617
Average ± SD507 ± 208631 ± 235
Table 5. Results of the economic analysis.
MunicipalityIntensive Green RoofExtensive Green Roof
Net Present Value, USDInternal Rate of Return, %Discounted Payback Period, yrNet Present Value, USDInternal Rate of Return, %Discounted Payback Period, yr
Warsaw58.796.496.212.500.5412.35
Krakow61.716.806.075.431.1511.53
Lodz60.326.656.144.030.8611.91
Wroclaw61.626.796.075.331.1311.56
Poznan60.276.656.143.980.8511.93
Gdansk60.316.656.144.020.8611.91
Szczecin60.816.706.114.520.9611.77
Bydgoszcz61.016.726.104.721.0011.72
Lublin58.946.516.202.660.5712.31
Bialystok60.166.646.143.880.8311.95
Katowice64.427.085.958.141.7010.86
Average
±SD
60.76
±1.53
6.70
±0.16
6.13
±0.07
4.47
±0.07
0.95
±0.31
11.83
±0.41
Table 6. Sensitivity analysis of the NPV of intensive and extensive GRs (average water retention = 60%).
Municipalityr = 1%r = 3%r = 6%
IntensiveExtensiveIntensiveExtensiveIntensiveExtensive
Warsaw163.7633.9998.6914.4644.63−1.74
Crakow169.3639.60102.6418.4147.200.83
Lodz166.6936.92100.7616.5345.97−0.40
Wroclaw169.1839.41102.5118.2847.110.74
Poznan166.5936.82100.6916.4645.93−0.44
Gdansk166.6736.90100.7416.5145.97−0.40
Szczecin167.6337.87101.4217.1946.410.04
Bydgoszcz168.0138.25101.6917.4646.580.21
Lublin164.0634.2998.9014.6744.77−1.60
Bialystok166.3936.63100.5516.3245.84−0.53
Katowice174.5544.78106.2922.0649.583.21
Average
±SD
167.53
±2.92
37.77
±2.92
101.35
±2.06
17.12
±2.06
46.36
±1.34
−0.01
±1.34
Publisher’s Note: MDPI stays neutral with regard to jurisdictional claims in published maps and institutional affiliations.

