Abstract
To analyze the characteristics, influencing factors, and microscopic mechanisms of county-level city shrinkage, this paper uses a quantitative push-pull model to explore the shrinking counties of Shandong Province between 2000 and 2018. The measurement method formulates three research objectives. First, the shrinking intensity and characteristics are analyzed according to statistics about the average annual rate of population growth, the primary production proportion, and public expenditure. Second, the influence factors are explored. Living standards, industrial development, social input, and public resource indicators are selected to quantitatively identify the push factors and pull factors and the correlated relationship of how the factors influence the population decline using ridge regression. Finally, the circular feedback mechanism and push-pull effect of multiple factors are explained. How do the factors affect each other and which is the decisive factor shaping county shrinkage? The push-pull mechanism is analyzed using dynamic relationship testing and the Granger causality test. The results show that the shrinkage of county-level cities faces common problems, including lack of resources, slowing down of the economy, and declining cityscape quality of life, which are the push factors for the population decline. There are differentiated characteristics of shrinkage. There has not yet been a full-scale recession in Shandong Province in terms of the degree of shrinkage. The towns with population loss accounted for only 15.4%, and the loss of population was less than 10% in ten years. In terms of impact mechanisms, county economic strength has a nonlinear correlation to population migration. Some counties tend to shrink in population and society. The degradation of the cultural environment, quality of life, and social welfare highlight social shrinkage signs in counties. A healthy living environment, equal public services, and a slowing down of relative deprivation have become essential pull factors for migration. County governments should shift from economic growth to people’s well-being, balancing government governance, economic growth, cultural development, environmental protection, and improving the livability level, as they are important directions for improving shrinking counties’ resilience.
1. Introduction
At present, there are many related studies on urban shrinkage, and the definition is generally based on population decline [1,2] as the primary indicator. The loss of population and the sharp increase in the number of unemployed people leads to a reduction in the quality of life [3], and the number of population loss accounts for at least 10% of the total population, or the average annual population loss rate is greater than 1% [4]. Some scholars have put forward a broad concept of urban shrinkage, which refers to the overall decline of population, economy, society, environment, and culture on the spatial [5]. In addition to the demographic dimension, the nightlight intensity of National Polar-orbiting Partnership Visible Infrared Imaging Radiometer Suite (NPP-VIIRS) data was also used to identify shrinking cities [6] in the spatial recognition dimension. The definition of the Shrinking Cities International Research Network (SCIRN) is more comprehensive. Shrinking cities refer to densely populated urban areas with no less than 10,000 people, most of which have experienced population decline for more than 2 years, accompanied by structural economic transformation and crisis [7]. Such definitions provide a framework to understand the standards of shrinking cities. Shrinking cities are challenges that globalization brings to cities [8], regions that have lost capital, human resources, and innovative spirit face a very unfavorable situation [9]. Michael Stoiper believes that the interaction of the economy, system, social interaction, and politics directly determines a city’s growth or shrinkage [10]. Justin Hollander paid attention to how neighborhoods physically change when they lose population, illustrating that population decline can be more painful in some neighborhoods than in others, and smart decline may be useful to implement [11]. Economic structural dependency is one well-documented element in shrinking cities; two other potential elements received very little attention: social structural dependency and urban sprawl [12]. Although economic shrinkage is a harbinger of urban shrinkage, shrinking cities show different effects at different stages of urban development cyclical theory. From a comparative perspective, the characteristics of shrinking cities in Germany, Japan, and the United States, and the policy response [13] are significantly different [14]. Maxwell D. Hartt [15] examined the population trajectories of the top 100 largest American cities from 1980 to 2010, showing that many cities that experience population loss do not simultaneously experience an economic decline. Twelve of the twenty cities examined in North America had divergent economic and population trajectories, which indicate the complex characteristics of the urban shrinkage mechanism, the single-factor influence mechanism cannot describe the whole picture, and it is vital to deepen the comprehensive dimensional evaluation of social, cultural, ecological, and other related factors. Since 2000, through plans, land banks, rightsizing and greening strategies, shrinking cities has become a topic in discourse and local action [16]. As an unrecognized opportunity [17], the city is applying a social-ecological understanding to shaping urban form and function along sustainable trajectories. A crucial role of ecology for the shrinking city is identifying innovative pathways that create locally desired amenities, so as to provide ecosystem services and contribute to urban sustainability at multiple scales [18]. For example, cities in the American Rust Belt look more like successional woodlands than bustling metropolises. Through the provision of ecosystem services, they become a resource instead of a liability [19]. According to the typology of U.S. shrinking cities [20], using a geographic information system to identifies seven types of shrinking cities in the United States: large shrinking central cities, inner-ring suburbs of shrinking central cities, outer-ring suburbs of shrinking central cities, inner-ring suburbs of growing central cities, outer-ring suburbs of growing central cities, small shrinking central cities in small metropolitan statistical areas, and small shrinking cities in small metropolitan statistical areas. For the aging society of Japan, the government provides financial support to the local people for urban regeneration, including mixed urban land use [21] and public facilities placement [22]. Karina Pallagst has claimed that a paradigm shift is taking place from growth-centered planning to shrinking smart. Greening strategies with public transport, food production, waste, energy recycling, and environmentally friendly heating and power supplies are useful processes for quality and sustainable development in a shrinking city [23]. Different shrinking cities have different performance characteristics, so comparative research is necessary. China’s shrinking cities have similar manifestations of the population shrinking and spatial decline with Western developed countries, but there are obvious differences in systems, culture, and development stages. The influencing factors and generation mechanism of China’s shrinking cities deserve further discussion.
Domestic urban shrinkage entered the research horizon in 2014. The “China Shrinking Cities Research Network” was initiated by Long Ying, Li Xun, and others, which mainly focused on cognition [24], statistical discrimination [25], temporal and spatial characteristics, and driving mechanisms of shrinking cities. Based on demographic indicators, Long Ying et al. [26] analyzed China’s Beijing-Tianjin-Hebei and Yangtze River Delta’s local shrinkage pattern and explained the phenomenon from five aspects: population, environment, economy, politics, and space. Li Xun et al. [27] studied the Pearl River Delta’s shrinkage phenomenon, revealing the relationship between global economic restructuring, industrial upgrading, and local shrinkage. Other related studies have also focused on the phenomenon of large-scale and large-city shrinkage. The typical representatives of China are 34 prefecture-level cities in Northeast China [28]. The depletion of resources has led to a severe shrinkage, and industrial cities dominate the relative shrinkage. In the shrinkage evaluation of 288 cities above the prefecture-level cities, the number is increasing, traffic conditions, environmental quality, population growth, and technological innovation are the main factors causing shrinkage [29]. The research pays more attention to the negative impact of shrinkage on the urban economy [30]. Urban shrinkage hinders economic development, especially the shrinkage of youth, labor forces, and industrial employment, which have a significant hindering effect on economic growth [31]. These studies have been the prelude to the study of shrinking cities in China, and their main research aims and practical research objects are economic growth, space production, and urbanization rates of government governance. The social problems and planning countermeasures in shrinking cities require a lot of research and attention.
County shrinkage and governance [32] are closely related to the sustainable development of county cities. The current more consistent concept of governance is smart shrinkage. Smart shrinking addresses issues such as aging, declining birthrate, and vacant housing. The change of macro standards and the support of the elderly care system, the evolution of medium and micro space design concepts, such as the detailed space design of community public childcare, the symbiosis of the young and the old, and the activation plan of empty houses, all provide experience for reference [33]. There were 315 shrinking cities from 2000 to 2015 in China [34]. Andrea Sarzynski and Thomas J. Vicino analyzed the decline of American suburban shrinkage and found that suburbs experienced different population change trajectories and divergent outcomes. Planning theory does not explain the phenomenon of population loss in a small town, including the county cities [35]. County cities play an essential role in connecting villages and towns with regional centers, and bridge between “city” and “township”. In 2014, the World Bank released the “Overview of Small and Medium-sized Towns in China”, reflecting on Chinese cities’ development process and characteristics [36]. According to the report, county cities are the county’s administrative center, which has greater potential than ordinary towns in terms of attracting talents, absorbing fixed asset investment, and agriculture, infrastructure, and public welfare investment. The high-quality development of county cities plays an essential supporting role in China’s new urbanization. The high-quality development with county cities as a carrier will become a key to China’s promotion of efficient, inclusive, and sustainable urbanization in the future. However, the county cities’ industrial supporting facilities are frail, with increased production costs and enterprises’ transaction costs, offsetting the advantages of low labor and land costs in county cities. This leads to weak industrial competitiveness and sustainable development capabilities in county cities, and even counties [37], and has seriously hindered the progress of China’s new urbanization strategy. At present, the domestic in-situ urbanization learns from three international in-situ urbanization, while the French model focuses on adapting measures to local conditions and realizing the urbanization of nearby residents through the development of characteristic towns [38]. The German model mainly promotes urbanization by promoting the development of industrialization in rural areas into small towns [39]. Fei Xiaotong proposed the Sunan model [40], the Wenzhou model [41], and the Pearl River Delta model [42]. Subsequently, the small-town model was criticized for its scattered layout, insufficient power, and inability to form a scale effect [43].
The urban agglomeration development model is a supplement to the small town development model of in-situ urbanization. It is similar to integrating the American, French, and German models, and follows the development path of “urban agglomeration-big city-small town-rural area”. It not only includes the integration of small towns (county cities) into the urban agglomeration development system, but also needs to rely on the industrial foundation and infrastructure advantages of the county to gather population and industries, and promote the construction of rural communities to become the end of urbanization through agglomeration and diffusion effects and achieve balanced development of urbanization [44]. Simultaneously, the construction of small cities and towns needs to adapt to local conditions [45], which has resulted in diversified in-situ urbanization paths, such as the in-situ urbanization driven by the Yangling industry in the northwest, the in-situ urbanization of tourist villages and towns in Yongxin Town, Chongqing in the southwest, and the in-situ urbanization of small towns in Shandong, etc. The current in-situ urbanization is mainly manifested as a government-driven type [46], because of the difficulty of introducing high-end industries in small towns or the sustainable development capacity. Yang Chuankai (2019) [47] believes that in the context of the new era, the increasing trend of population return, farmers’ urbanization willingness, and national policies are the realistic basis for promoting in-situ urbanization. Promoting in-situ urbanization requires speeding up the land and household registration system’s reform, expanding the grassroots government’s administrative power [48], enhancing the attractiveness of small and medium-sized cities, and accelerating the cultivation and construction of characteristic towns.
The enlightenment of existing research summarizes the typical characteristics of shrinking cities, the current development situation, the impact of related factors on the shrinking process, and provides a perspective on the formation of shrinking and the multiple interactions between the economy, society, and population. From Professor Xuefei Ren’s studies, three common characteristics can be singled out about urban China [49]. First, economic take-off has brought about significant economic urbanization [50], thus bringing about urban growth in China [51]. Second, the institutional reforms of the city governments [52] have further released the energy of urban economic growth, such as land policy reform, housing reform, and national decentralization [53]. Third, the rise of local entrepreneurial urban governments has greatly improved the urban transformations in China [54]. However, relevant research on shrinking cities pays more attention to the shrinkage phenomenon, development mechanism, and restoration of large cities, and there are relatively few observations on small towns and villages. There are more studies on the relationship between population loss and the economic, social, and material environments regarding the shrinkage problem. There are many quantitative studies on shrinkage determination, and there are few multidimensional characteristics and quantitative analyses of shrinkage mechanisms. Especially in the study of the shrinkage phenomenon, its features, and the micro-mechanism in demographic-economy-society of the county as a study area, different types of areas need to be supplemented. For China’s development, counties play an essential role in the evacuation of large cities and the urbanization of rural populations in the process of urbanization. In particular, in the new era of “urbanization of people,” as an important entry point to promote urban-rural integration, studying counties’ shrinkage mechanism and governance measures will become a key to encourage efficient, inclusive, and sustainable urbanization in China in the future. China’s counties’ growth and shrinkage also provide a sample of differentiated research on the green and healthy development of different types of small towns worldwide.
Shandong is a populous province. In 2017, it became the second province in China with a population of over 100 million. In 2018, the proportion of the population over 65 in Shandong Province exceeded the national average by 3%. It is a large province with an aging population. In 2019, it had 16 prefecture-level cities and 137 counties with a permanent population of more than 100 million [55]. The province’s permanent population’s urbanization rate exceeds 60%, and the registered population’s urbanization rate reaches 50% [56]. Between 2010 and 2018, the number of cities with a shrinking population reached 15, second only to the Northeast. In 2017, the County Development Institute of Shandong University released the report, “Assessment and Ranking of the Scientific Development of Shandong Counties from the Perspective of Five Development Ideas,” which pointed out that the population change trends in the province are unevenly distributed, with higher population growth occurring in the southwest of Lu and slow population growth in Jiaodong. With the pressure of foreign workers returning to their hometowns and local workers moving to urban centers, the counties are generally facing population loss [57]. The shrinkage of county-level cities in Shandong Province is worthy of attention. According to observations of county-level macroeconomic indicators in Shandong Province from 2000 to 2018, in the past 20 years, the counties’ GDP has generally been in a growth trend. However, there is still a 15.4% decline in the county population. Simultaneously, a small number of counties have also experienced a trend of population return during the economic downturn. What are the influencing factors and internal mechanisms of the county’s shrinkage under this growth trend? This is the original intention of this article and the question it tries to answer.
Taking the shrinkage of county-level cities in Shandong Province as an example, this article includes three main contents: ① The current situation and extent of the county’s shrinkage, and their differences with the shrinking cities. ② The identification of factors and micro-mechanisms of county shrinkage. Based on the push-pull model, the paper quantitatively analyzes county shrinkage’s economic and social linkage mechanisms. ③ The strategies for county shrinkage management. Based on connotative spatial development, we will discuss strategies that consider government management, economic growth, cultural development, and environmental protection, improve the level of livability, and improve resilience to urban shrinkage.
2. Theoretical Background
There are two theoretical perspectives for identifying and valuing urban shrinkage: one is “population movement,” which focuses on the degree, structure, and response of population loss. The other is “population dependence,” which focuses on the spatial, economic, and social interactions behind population shrinkage. This article combines these two perspectives and uses population shrinkage as an identification indicator to get the overall situation. The influencing mechanism extends to comprehensive dimensions such as population-economy, population-space, and population-society and quantitatively identifies shrinkage braking factors and process mechanisms. The current effects of urban degradation under contraction mainly focus on the degradation of the economic, social, and spatial environment.
2.1. The Shrinkage of the Population-Economic
The population contraction will inevitably lead to economic shrinkage. Resource depletion, industrial changes, and geographic position have become the main factors leading to economic shrinkage. China’s economic shrinkage is mainly concentrated in the Northeast and Inner Mongolia, where the industrial structure is relatively simple, and the lack of human capital restricts economic development [58]. In the Yellow River Basin, factors such as ecological conditions, institutional policies, industrial structure, insufficient development of central cities, and weak driving capacity have led to urban shrinkage. The decline of traditional industries will cause the outflow of urban population and demographic changes, thereby reducing housing demand. Corresponding industrial upgrading, the coordination of high-quality population gathering and high-quality housing supply have developmental significance in urban transformation [59]. Urban shrinkage also has a significant inhibitory effect on urban productivity. The main ways of impacting include reducing urban human capital and increasing urban productivity by reducing urban technological innovation capabilities [60].
The more significant crisis brought about by the urban economic shrinkage from a global perspective is poverty. Compared with large cities, poverty in small towns and rural areas is more prominent. Increasing poverty and income gaps have reduced the quality of life and social connections, making declining counties more vulnerable [61]. The pure introduction of industrial space has limited positive effects of economic recovery measures. Large-scale retail is not suitable for shrinking cities due to the increased polarization of urban areas and functions [62]. The dominant factors affecting the differentiation of rural poverty are labor, technology, land resources, and financial support. Correspondingly, for the poverty braking mechanism of labor constraint, land constraint, capital constraint, and technology constraint, it will be more meaningful to propose a land poverty alleviation model [63], find new economic growth for cities, create employment opportunities [64], reshape the image of cities, enhance the resilience of counties [65], and improve the multidimensional judgment criteria of social, economic, environmental, and historical systems [66].
2.2. The Shrinkage of the Population-Social
After the decline of the urban population and economy, cultural erosions and social degradation problems have arisen. The trend of population aging has intensified, social isolation has intensified, social capital has declined, and public activities have decreased, cities have lost vitality, and the motivation for innovation is insufficient, which ultimately leads to urban cultural decline, rising crime rates, increasing poverty, and poor urban management and social governance. Growing income disparity and rapidly growing housing prices reduce social happiness (World Happiness Report, 2017). The average wage of labor in shrinking cities in China is 33.08% lower than that in non-shrinking cities, and low-skilled labor is more likely to gather in shrinking cities [67]. In addition to the income gap, the most prominent gaps in consumption levels and living conditions are also notable in counties [68]. The shrinkage of counties affects the supply and space allocation of the local basic public services. It shows a spatial mismatch of population and public resources in the region, significantly reducing local essential public services [69]. Overall, by evaluating human well-being from economic, social, and ecological aspects, which can measure people’s quality of life and standard of living, we can find that the gap between urban and rural well-being is still prominent. Especially with the superposition of urban-rural gaps and regional gaps, the dilution of social welfare in counties has become the most significant problem affecting the speed of building a moderately prosperous society in all respects.
2.3. The Shrinkage of the Population-Space
The decline of space and its quality are common characteristics of shrinking cities around the world. The loss of population, industry, and capital causes changes in urban areas. The flow of people in space moves from urban centers to suburbs and satellite cities. Urban sprawl, suburbanization, and satellite city effects occur. The population density in some areas decreases, leading to unbalanced spatial development and decline in some areas. That shows three spatial types [70]. Resource-dependent cities are shrinking, similar to the old industrial base in Northeast China and Mount Isa in Australia [71]. The continuous population shrinkage and economic decline in large urban areas have divided the spatial form into doughnut and perforated forms. The small towns are shrinking and the hollowing out of the countryside is prominent.
Whereas most researchers have focused on the impact of resource development, economic growth, and spatial evolution based on the perspective of the urban noumenon, few studies have explored the impacts of human development impact factors on city shrinkage. Most research focused on the large-scale spatial heterogeneity characteristics, few studies explored the small town such as county-level city’s shrinking mechanisms. In this paper, on the basis of living standards, industrial development, and social input, public resources were constructed in accordance with relevant theories, existing literature, and available data. Furthermore, a count model based on push-pull theory was applied to quantitatively analyze the push-pull factors and the effects of population migration in Shandong in order to study the micro-mechanisms of county shrinkage.
3. Data Source and Methods
3.1. Data Sources
The paper selects Shandong Province as the case to collect research data from 2000 to 2018, including population, resources, natural conditions, infrastructure, social economy, and ecological environment. Data forms include geographic data, such as graphics, images, text, tables, image data, and attribute data. Critical statistical data come from the Guotaian database and the “China County Statistical Yearbooks (County Volume),” “Shandong Province Statistical Yearbooks,” and “Shandong Province Urban Construction Yearbooks” compiled by the Rural Economic and Social Survey Department of the National Bureau of Statistics.
The measurement analysis software used in this article is SPSSAU, ArcGIS10.2, Eviews10.
3.2. Methods
The paper focuses on using measurement methods to understand the internal mechanisms and generation mechanisms of counties shrinkage. It uses index measurement, the push-pull model, the Granger causality test and other techniques, quantitative analysis of the fundamental characteristics, and county-level small town shrinkage mechanisms. It judges counties’ shrinking situation from the three aspects of population, industrial development, and local fiscal revenue. For typical shrinking counties, the shrinkage mechanism is further tested through indicators such as living standards, industrial development, social investment, and public resource allocation.
The push-pull theory has a specific explanatory power in the field of population mobility. The earliest scholar to study population migration was E.G. Ravenstein in the United Kingdom, who published a paper, “The Law of Population Migration” in 1885. After being summarized and improved by D.J. Bagne and E.S. Lee, they put forward the push-pull theory of population migration and mobility [72]. Based on the push-pull theory, Chinese scholars established an urbanization population model with GNP (Gross National Product) functions, resident consumption, and regional population and made a prediction analysis of the urbanization population [73]. After 2000, scholars focused on the dynamics of the transfer of rural labor. They researched the flow of rural populations [74], the transfer of rural homesteads [75], and the household registration system [76]. At the same time, the push-pull theory also has applications in industrial transfer [77], international student mobility [78], employee turnover, and willingness to travel for the elderly [79]. Using push-pull theory to explore the reasons for shrinking cities’, it is usually used as the “physics” way that describes the impact factors of population migration as pushing and pulling forces, and population flow is generalized due to the combined action of pushing forces and pulling forces. This explanatory frame is concise and easy to understand. However, it is necessary to combine the quantitative analysis of the push-pull mechanism with other models. In this paper, a ridge regression model is used to analyze the push-pull factors of population decline, and a dynamic relationship test is used to identify the push-pull mechanism. It will help quantitatively analyze shrinking counties’ microscopic operating mechanisms. First, the paper measures the shrinking cities. Next, it checks its influencing factors, through the regression analysis in the measurement, the pushing and pulling force factors are analyzed. Last, the Granger causality test explores the causal circulation mechanism that may occur in the population loss.
- (1)
- Measure of shrinking counties
We analyze population, economic, and social data, using the average annual change rate to measure the county’s population, economic, and social decline. We recognize shrinking counties from the three aspects of population, industrial development, and public expenditure. To ensure the continuity and availability of population data, we use the total population at the end of the year to construct the average annual population change rate (AAPCR) as the shrinking county measure index. If the AAPCR is a negative value or below a certain threshold during a given period, then the county is deemed to be a shrinking county. The AAPCR is calculated as follows:
where AAPCRi indicates the average annual population change rate between t1 and t2 in county i. pt1 and pt2 refer to the total population at the end of the year.
Based on population data, this study eliminates statistical shrinkage counties whose population change is caused by the Administrative Zone division. The results of population change rate are shown in Table 1.

Table 1.
The average annual population change rate of county-level cities in Shandong Province (2000–2018).
We analyze the situation of the industrial structure change. The economic structure changing may cause population change. Shandong Province is the largest agricultural province in China, we calculate the average annual rate change in the proportion of primary production (AAPPP) as follows:
AAPPP indicates the average annual change rate of the proportion of primary industry between t1 and t2 in county i. it1 and it2 refers to the proportion of primary production.
We use local public expenditure as an indicator to measure county space quality and residents’ living environment. The annual average change in public expenditure (AACPP) is calculated as follows:
where AACPP indicates the average annual change rate of the public expenditure. et1 and et2 refer to the public expenditure for the whole year.
To further analyze the spatial differences in county shrinkage in Shandong Province, the average rate changes of AAPCR, AAPPP, and AACPP are manifested in the figure showing the shrinking intensity and spatial characteristics. Through the superimposed comparison of the above results, counties with a negative population change rate and a low change rate of the proportion of primary production and public expenditure are identified as shrinking counties. Finally, a quantitative analysis of the formation mechanism is carried out.
- (2)
- Push-pull influence factors quantitative analysis of ridge regression
Ridge regression is used to judge the influence of population, industry, society, and other environmental factors in counties’ shrinking process. The basic statistics are shown in Table 2. The establishment of a multiple regression model is as follows:
Table 2.
Descriptive statistics of variables.
In the formula, POPU is the core explanatory variable, namely population. DEPO represents the level of household savings and reflects the quality of life in the area. GRAIN, POW, and ENTERP represent the primary industry’s output and input and the scale of development of the secondary sector. They represent the economic structure of the area. PUBFIN is public finance expenditure, reflecting the level of urban construction in the area. STUPRI and MEDBED respectively reflect the level of education security and medical security in the area. The mutual restriction and influence of population, industry, and societal factors may cause multicollinearity problems of time series data. To reduce the influence of heteroscedasticity and multicollinearity, both sides of the model are treated with logarithms. Ordinary multiple linear regression has a severe multicollinearity problem, so the ridge regression method is fitting. The regression result calculated by ordinary least square in the presence of multicollinearity is not an unbiased estimator. Ridge regression is an improved algorithm based on the least square method. Ridge regression makes the regression more realistic by giving up precision and using biased estimation. The ridge parameter K is in the range of (0–1), the smaller the K value is, the smaller the original information loss is. In this study, the ridge parameter K = 0.02, and the ridge regression results are shown in Table 3.
Table 3.
The results of ridge regression analysis.
- (3)
- Push-pull mechanism quantitative test of the dynamic relationship
Relatively few studies focus on the dynamic relationship among population, industry, and society using the econometric model. Based on the data of population and its influencing factors from 2000 to 2018, this study explored the causal relationship between population decline and its influencing factors using the Granger test. The specific steps are as follows: first, it tests the stationarity of time series data. Considering the stability of time series data, the VAR (vector auto-regression) model is used to judge the dynamic changes of variables and the impact of various shocks on the variables [80], in order to avoid a false regression test, the unit root test method is used to verify its stability. The unit root test results are shown in Table 4. Secondly, we judge whether there is a long-term equilibrium relationship between the variables through the cointegration test; It can effectively avoid the false return problem. In this paper, the variables are the first-order simple integral sequence, to examine whether there is a long-term equilibrium relationship, the cointegration test is necessary. The results are shown in Table 5. Finally, the Granger causality test is used to determine whether there is a causal relationship between them. We mainly explore the relationship between industrial economy, social production, urban construction, and population decline in this study, whether they have a causal relationship, and what are the causality directions, those should be further studied by the Granger test. The causality test of the influencing variables in the previous step explores their mechanism of action in the counties’ shrinkage. The Granger test results are shown in Table 6 and Table 7.
Table 4.
The results of the serial stationarity test.
Table 5.
The results of the cointegration test.
Table 6.
The results of the Granger causality test of Donga County.
Table 7.
The results of the Granger causality test of Rushan City.
4. Results
4.1. Shrinkage Characteristics of County-Level Cities in Shandong Province
- (1)
- The population loss in counties within ten years only accounted for 15.4%, and the loss of population was less than 10%
Table 1 shows statistics on the population growth of 91 counties and county-level cities in Shandong Province from 2000 to 2018. The original data is the total population at the end of the year, and the average annual growth rate is calculated. It can be seen from the calculation results that most counties and cities are still in a state of population growth in the past ten years, with the average population growth rate of 14 county-level urban areas being negative or zero, accounting for 15.4% of the study area, resulting in significant shrinkage in population. Of the 14 county-level administrative regions, 12 are in the Jiaodong area. Among them, Fei County, Anqiu City, and Changyi City are mainly affected by policies. Fei County was affected by the adjustment of administrative divisions in 2011, and the administrative divisions of Anqiu City were also adjusted. The shrinkage in Changyi City is mainly due to the impact of the family planning policy. Since the 1990s, there has been negative population growth. Changdao County belongs to Yantai City, located at the intersection of the Yellow Sea and the Bohai Sea, and is the only island county in Shandong Province.
Affected by topographical conditions, the current industrial structure is unreasonable and heavily dependent on the primary industry. Although tourism has gradually developed, it has not become the leading local industry. Changdao County has always had a small population base, the birth rate is much lower than the death rate, the pressure on residents’ lives has increased, and the infrastructure is relatively scarce. Simultaneously, the exodus of young people is profound, causing the island’s population to show a negative growth trend. Qixia County’s primary industry accounts for a relatively large proportion. Qixia County is dominated by planting apples, cherries, and wheat. It is the largest apple production county in Yantai; it is also the water source of Yantai to protect water resources and the ecological environment, so its industrial development has been dramatically restricted. Qixia County’s various economic indicators are lower than the surrounding cities and counties, and it is a poor county with low-income levels and serious population exodus. Simultaneously, the natural population growth rate is negative, and population shrinkage is more pronounced.
- (2)
- The industrial structure has been continuously adjusted, and the proportion of the primary industry has declined
The proportion of primary industry in county-level cities across the province is declining. In recent years, Shandong Province has made every effort to accelerate the conversion of new and old kinetic energy and strives to create several high-quality, high-competitive industries. The economic structure is changing under the dual impetus of the government and the market. The decline in the proportion of the primary industry indicates to a certain extent that county-level cities have been led by the traditional primary industry in terms of industrial structure and turned to a diversified development model of secondary and tertiary sectors. Shandong Province is the largest agricultural province in China, with the continuous transformation of industrial structure, the comprehensive development of the secondary and tertiary industries, the improvement of science and technology, the advancement of agricultural technology, the rapid growth of modern agriculture, leisure agriculture, pastoral complex, and other new models caused the outflow of rural surplus labor and the return of the local employed population to coexist.
- (3)
- The macroeconomic situation is improving, and the increase in public expenditure is relatively lagging behind
Local fiscal revenue is used for local construction, urban maintenance, etc., as an indicator to measure the city’s quality and residents’ living environment. In recent years, the increase in county-level cities’ fiscal revenue in Shandong Province reflects the local economy’s positive development. Each county and city’s budgetary revenue growth rate ranges from 10.17 to 37.91% in the past two decades. In terms of economic development, all counties and cities have shifted to a new era of economic development paths. They are gradually moving away from resource-consuming industries and environmentally polluting industries. Although the overall financial situation is showing a good trend, there are still poor counties due to the unreasonable industrial structure and low per capita income levels, which have caused the exodus of young and middle-aged labor, especially in rural areas, and the population shrinkage brought about by it should not be underestimated. It can be seen from Figure 1c that public financial expenditures account for most of the proportion in the two segments of 0.15–0.20, and only eight cities and counties account for a small ratio of more than 0.20. The cities and counties with a proportion of less than 0.15 and the cities and counties with a negative average population growth rate are superimposed since it is only Anqiu City and Wendeng District.
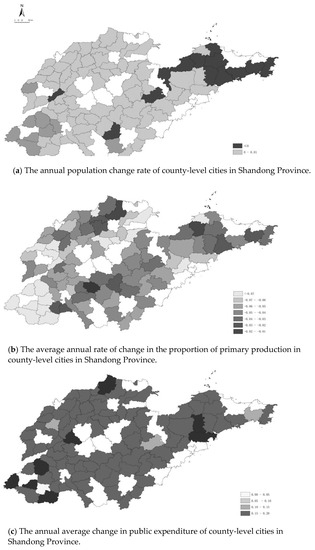
Figure 1.
The pattern of county-level city shrinkage in Shandong Province.
- (4)
- It tends to be more demographic-social shrinkage in type
The shrinkage of county-level cities in Shandong Province faces common problems, including lack of development resources, economic slowdown, a decline in urban style, and declining quality of life. In terms of population, most county-level cities have been increasing in recent years, but the population of 14 county-level cities has been declining and has not yet experienced a full-scale recession. Urban shrinkage occurred in a local area (Figure 1), and the spatial distribution was not balanced, both inland regions and the eastern part of the peninsula shrunk, but county-level cities on the east peninsula shrunk more. In terms of the economic and industrial structure, the fiscal revenue of the county-level cities in the province has grown steadily, the economic operation has been steadily rising, and the investment in public infrastructure construction has also been guaranteed. Although some county towns’ macroeconomy has slowed down, there is also a trend of population backflow, which indicates that the phenomenon of semi-urbanization in the county’s vicinity is a trend that cannot be ignored in the new urbanization. In terms of impact mechanism, the economic strength of the county is nonlinearly related to population migration. It tends to be more demographic-social shrinkage in type. Economic vitality is not always the most critical factor in the shrinkage of county-level towns, and the spatial decline of the cultural environment, quality of life, and social welfare tend to be a sign of social shrinkage. Typical cities are Rushan City, Penglai County, Qixia City, Wendeng District, Haiyang City, and Dong’e County. Considering the shrinkage intensity and the availability of research data, Rushan City and Dong’e County are selected as the case areas in the following article to analyze county-level cities’ shrinkage mechanisms quantitatively.
4.2. The Shrinkage Mechanism of County-Level Cities Based on the Push-Pull Model
Taking Dong’e County and Rushan City as examples, through the analysis of factors such as the level of residents’ savings, the number of industrial enterprises above designated size, and the total grain output, the focus is on the influencing factors and generation mechanisms of the shrinkage of county-level cities in Shandong Province.
4.2.1. Overview of Dong’e and Rushan
Dong’e County belongs to Liaocheng City, Shandong Province, located in the east of Liaocheng City, close to the Yellow River. By the end of 2017, its household population was 409,500, and its three-industry structure was 10.2:50.2:39.6. The administrative area of Dong’e County is small, the economic level is lower than the average level of the province, the industrial system is unreasonable, and most industrial chains are at the low and middle-end levels. Under the influence of the surrounding more developed cities such as Liaocheng and Jinan, Dong’e County has declined in population, technology, and other factors, and has fallen into developmental difficulties. Rushan City is affiliated to Weihai City, Shandong Province, located at the southeastern tip of Shandong Peninsula and bordered by the Yellow Sea in the south. It is named after the local Daru Mountain. By the end of 2017, the city’s total population was 551,300, and its three-industry structure was 7.89:46.64:45.47. Rushan City has sufficient coastline resources to develop the real estate industry to attract the population vigorously, but it has experienced negative population growth for 20 consecutive years and is known as a “ghost city.” Rushan City lacks pillar industries, the overall industry level is low, the industrial growth rate is slow, and the public budget revenue accounts for low GDP [81].
4.2.2. Variable Definitions
The data in the following analysis comes from the “China County Statistical Yearbook (County and City Volume)” (2000–2018) compiled by the Rural Economic and Social Survey Department of the National Bureau of Statistics, the missing data are obtained by interpolation, and the specific statistics are as follows (Table 2).
4.2.3. Regression and Causation Testing
- (1)
- Ridge regression analysis
From the Table 3 results, the population flow of Dong’e County is mainly due to the impact of residents’ savings, the number of industrial enterprises above designated size, and public financial expenditures, that is, the pushing and pulling effects of people’s lives. Industrial development and urban investment and construction are more pronounced, while Rushan City has been affected in many aspects. From the ridge regression results of the selected two county-level cities, social investment significantly impacts population shrinkage. In urban construction and development, social investment is an essential link for the government to guide public development and improve the urban environment. The happiness of residents caused by the urban environment has a significant impact on population migration. Represented by public financial expenditures, improving the level of social security, improving the appearance of the living environment, living environment health, equalizing public services, and reducing relative deprivation have become a critical pulling force for the county’s migration population. For the selection factors of population mobility, the degree of social investment can reflect the push and pull size. The outflow area has low public financial expenditure, a poor urban environment, and an imperfect urban social security mechanism, so the pushing force is large, and the pulling force is small. The inflow area government hopes to retain talents as much as possible, accelerate the transformation of the economic and social structure, achieve the most significant social benefits with the smallest investment, and maintain a suitable social development environment. In this way, the pulling force is large, and the pushing force is small, which has an important impact on the population agglomeration of county-level cities. Industrial development also has a major effect on urban shrinkage. If the industrial structure is reasonable, the economic expansion is relatively good, and the income level meets people’s needs and the pushing force of population loss in small towns will continue to decrease.
The living standard factor represented by the resident savings deposit balance is also a significant variable in Rushan City. The standard of living is another major cause of population mobility, and it is also an important part of pushing and pulling. From the perspective of maximizing personal income, the standard of living has a more direct impact and is more subjective. When the city’s various conditions are not enough to meet the residents’ pursuit of a higher standard of living, it will determine families’ and individuals’ migration decisions. As a result, population flow occurs, so living standards are also one reason for population shrinkage.
For Rushan City, the endowment of public resources has a significant impact on population shrinkage. The superior endowment of public resources in the inflow area may mean a decline in the cost of living and improved quality of life. The advantages of public resources significantly affect their quality of life and become a vital pulling force. Industrial structure factors are also one of the reasons for the population shrinkage in Rushan City, and the total grain output and the number of industrial enterprises above designated size have a significant impact on the population.
Due to the differences in the case cities’ development, their shrinkage factors and adjustment strategies are also different. Dong’e County is located inland and belongs to the Central Plains. The industrial structure is relatively simple, with small changes and limited development potential, so population flow is mainly related to personal income. Rushan City is close to the Yellow Sea, with good advantages in developing secondary and tertiary industries, and the population flow is more significantly affected by the local industrial structure. Moreover, Rushan City is in the hinterland where Qingdao, Weihai, and Yantai are connected, and these three cities have a more significant siphon effect on the surrounding areas. Looking at the shrinkage of the two counties, the county’s shrinkage results from the coupling of the macroeconomic environment, the quality of the meso, urban, and rural spaces, and the wishes of microscopic individuals, from economic growth to people’s livelihood and well-being, based on connotative spatial development, considering government governance, economic growth, cultural development, and environmental protection, improving livability, and improving the resilience to urban shrinkage.
- (2)
- Dynamic relationship testing
- ①
- Sequence Stationarity (Table 4) and Cointegration Test
Table 5 shows the cointegration test results of the variables in Dong’e County and Rushan City, it is known that each variable is a first-order single integer sequence, with reference to the ridge regression results, the VAR model is constructed separately, according to AIC (Akaike Information Criterion), SC (Schware Criterion), and LR (Likelihood Ratio) determine the optimal lag order and get the cointegration test results as shown in the table below.
From the table results, we can accept the null hypothesis that each variable has 1 cointegration relation. At least 2 cointegration relations exist among the variables in Rushan City, and the causality test can be continued.
- ②
- Granger causality test
The test (Table 6 and Table 7) shows a causal relationship between the population shrinkage in Rushan City and some ridge regression variables. The test results show that the causality between population size and economic and social variables is not significant among the variables with cointegration relation. At the same time, there is a specific causal relationship between the variables of the socioeconomic environment. For example, grain output may cause changes in the balance of household savings deposits, which may cause changes in the number of enterprises, increased deposit balances, better local economic development, a more reasonable and complete industrial structure, and more stable population changes. The above reflects that population flow is not just a one-way effect of pushing and pulling forces but also the interaction and dynamic running-in between multiple factors. From the linear economic causal mechanism to the complex circular feedback mechanism, economic vitality is not always the principal factor in county-level towns’ shrinkage. The well-being of residents caused by the urban environment is significantly correlated with county-level cities’ shrinkage. A healthy living environment, equal public services, and a slowing down of relative deprivation have become necessary pulls for the county population’s migration.
Summarizing the research results, the main factors driving the county’s population flow are the industrial and social environment. The counties mainly absorb the rural population of the county scale in local urbanization. Agriculture is the leading industry in counties and villages. The practical realization of agricultural modernization and sustainability has provided an essential foundation for non-agriculturalization and labor urbanization. The case area’s primary industry has improved agricultural production efficiency and liberated agricultural labor by transforming modern agriculture and mechanized production. Land intensive, industrial parks are the driving factors for realizing county economic growth.
On the one hand, the spatial urbanization of county land has been realized. On the other hand, through the promotion of green production methods such as green environmental protection industries and sightseeing agricultural parks, the county’s environmental health has been improved. Most importantly, it provided opportunities to absorb the surplus agricultural labor and realized the agricultural population’s local urbanization. Increasing capital investment in the rapid construction of urban infrastructure, equalizing public services, and realizing the integration of urban and rural lifestyles, living standards, and quality of life are the fundamentals for improving the counties’ quality of urbanization. This is fundamentally different from the widespread urbanization model in China that uses urbanization rate and GDP as indicators. This is county development based on the premise of human development. On the realization path, reasonable spatial development planning and necessary financial support are crucial.
5. Discussion and Conclusions
5.1. Conclusions
On the other side of urbanization, the shrinkage of counties reflects the reality of sustainable development. In general, county-level cities’ shrinkage is a multidimensional phenomenon that includes the population, economy, society, and material environment. Facing common problems, including lack of development resources, economic slowdown, declining urban style, and declining quality of life, have become the pushing forces of population loss. The scope and extent of county-level city shrinkage have not reached an irreversible stage, and the structural adjustment of the industrial economy has played a positive role in the regional revival. Population mobility is affected by many factors, and the motivations are different in different regions. Although the regression coefficients are generally similar in terms of the direction, each factor’s significance gap is more discernable. The factors affecting population movement in Dong’e County and Rushan City are quite different from the ridge analysis results in regression. Differences in living standards, regional public resource endowments, industrial structure, and other factors influence population shrinkage. The shrinkage of county-level cities and towns is a dynamic process, and the relationship between population change and economic and social reconstruction is not a simple causal relationship in this process. According to the causality test results, the shrinkage of county-level towns is affected by the dual effects of push and pull, which includes factors such as socioeconomic environment and the living standards of individuals and families. The flow of production factors, the development of regional industries, and the urban environment’s quality are mutually causal, confirming urban contraction’s transformation from an economical linear causal mechanism to a complex circular feedback mechanism. Economic vitality is not always a paramount factor in the shrinkage of county-level towns. The well-being of residents caused by the urban environment is significantly correlated with county-level cities’ shrinkage. A healthy living environment, equal public services, and relative deprivation reduction have become a decisive pulling force for the county population’s migration. The county’s shrinkage results from the coupling of the macroeconomic environment, the quality of the meso, urban, and rural spaces, and the wishes of microscopic individuals. The governance of shrinkage shifts from economic growth to people’s well-being, based on connotative spatial development, considering government governance, economic growth, cultural development, and environmental protection, and improving the level of livability to strengthen resilience to urban shrinkage.
The shrinkage mechanism of county-level cities has a systematic and dynamic nature, with regional heterogeneity and individual differences. Identifying the influencing factors and formation mechanisms of shrinkage and guiding the active tool of urban rejuvenation is the key to revitalizing county-level cities and alleviating shrinkage. Based on the fundamental development goals of public health and the well-being of the people, considering the new paradigm of system development of rational planning, environmental sustainability, social tolerance, economic prosperity, and cooperation and sharing, the shrinking governance of county towns will be a long-term process of continuous adjustment.
5.2. Discussion and Policy Implications
The results presented in this paper make a quantitative analysis of the shrinking counties. Compared with big cities, the statistical information and the socioeconomic data are not complete. The data that can be used in the paper is limited. The work of this paper is just a preliminary attempt that only distinguished a limited number of indexes. The results show the social factors are crucial to the county shrinkage. It further proves that “incrementalism” may not apply to the new-type of urbanization in China. A high-quality pattern in the county’s sustainability is worth considering here in the era of rapid urban-rural transformation in China. From a more micro perspective, the migration intention of the individual citizen should be comprehensively collected to evaluate the social influence mechanism. Especially, family-based migration desire may be more suitable during the process of urbanization in county cities. Rural people move to towns, which means a whole family seeks jobs, education, and medical treatment in the city. Social production in the county development and shrinking organization will be equally as important as economic production.
To the policy implications, it is important to rebuild the spatial planning system, improve the quality of urban space, and achieve urban connotative development as China’s urbanization has entered a new stage. High-quality spatial planning meets hierarchies of human needs from basic survival needs to safety, health, association, respect, and participation. The promotion of spatial planning should focus on the living circle planning to ensure the individual basic survival demands. It is necessary to add the special planning of safety and health to ensure individual higher needs. In the Shandong Province case study, agricultural modernization and sustainable development provide the basic support for urbanization. Through planning, construction, and capital investment, the foundation of agricultural production has improved, and agricultural laborers have been liberated from land production, which has promoted the rural population’s urbanization. The increase in the proportion of green industries and leisure industries is another positive factor for urbanization in counties. The intensive use of land has realized the non-agriculturalization and spatial urbanization of agricultural land use. Many job opportunities accept the transfer of laborers and realize the local urbanization of the agricultural population. The most important thing is the reasonable allocation of production, living, and ecological spaces to ensure no difference in the quality of life between the county and rural residents to improve the quality of urbanization. Based on this, the local urbanization model of Shandong Province promoted on the premise of respecting the wishes of the villagers is manifested as a logical result of respecting the social and economic development of the county. Unlike the compulsory measures led by local governments, starting from the soundness of infrastructure, public services, and commercial service facilities, constructing a non-government-led local urbanization model is also a useful supplement to coping with the county’s shrinkage.
County shrinkage would be quite different between China and European countries. There is more advanced modern agriculture in European countries. It is a quite different development model of combining industrialization, agricultural modernization, and urbanization. There are agricultural culture and rural economic traditions in China’s counties. Government and local organizations have made great efforts for balanced urban-rural development. Large financial resources are used to contain the relevant balance of public services, social welfare, and income levels, even though the declining trend of traditional agricultural areas is still difficult to reverse. Similar situations have also occurred in East Asian countries as they are based on the same traditional small-peasant economy. It is internationally important and worthy of revealing the rules and mechanisms and making international comparative studies. Identifying the characteristics and generation mechanisms of county-level town shrinkage is a descriptive study, which only answers the question of “why.” To answer the question of “how to do it,” it is also required to analyze and simulate its dynamic mechanism by scientific methods. On the one hand, it is necessary to measure the degree of urban shrinkage; on the other hand, it must reveal the changing influence factors and the mechanism of action in reconstruction from shrinking to revival. On this basis, the reconstruction model and optimization strategy of shrinking urban regeneration are proposed, which need to be strengthened in subsequent research. Due to the diversified types of towns and development differences, the data of selected districts in this paper have limitations, and the validity and universality of relevant research conclusions need to be further verified.
Author Contributions
Conceptualization, M.W.; methodology, H.G.; software, S.Y.; validation, S.Y., K.A. and H.G.; formal analysis, M.W.; investigation, M.W., S.Y., H.G.; data curation, S.Y.; writing—original draft preparation, M.W.; writing—review and editing, M.W., S.Y., K.A.; project administration, M.W.; funding acquisition, M.W. All authors have read and agreed to the published version of the manuscript.
Funding
This research was funded by the National Natural Science Foundation of China (41701199).
Institutional Review Board Statement
Not applicable.
Informed Consent Statement
Not applicable.
Data Availability Statement
Not applicable.
Conflicts of Interest
The authors declare no conflict interest.
References
- Schilling, J.; Logan, J. Greening the Rust Belt: A Green Infrastructure Model for Right Sizing America’s Shrinking Cities. J. Am. Plan. Assoc. 2008, 74, 451–466. [Google Scholar] [CrossRef]
- Delken, E. Happiness in shrinking cities in Germany. J. Happiness Stud. 2008, 9, 213–218. [Google Scholar] [CrossRef]
- Clark, T.N.; Lloyd, R.; Wong, K.K.; Jain, P. Amenities Drive Urban Growth. J. Urban Aff. 1989, 5, 493–515. [Google Scholar] [CrossRef]
- Oswalt, P.; Rieniets, T. Atlas of Shrinking Cities; Hatje Cantz: Berlin, Germany, 2006. [Google Scholar]
- Xu, B.; Pang, D.l. Growth and Recession: Research on International Urban Shrinkage and Its Enlightenment to China. Economist 2014, 04, 5–13. [Google Scholar]
- Jiang, Z.; Zhai, W.; Meng, X.; Long, Y. Identifying Shrinking Cities with NPP-VIIRS Nightlight Data in China. J. Urban Plan. Dev. 2020, 146, 04020034. [Google Scholar] [CrossRef]
- Hollander, J.B.; Nemeth, J. The Bounds of Smart Decline: A Foundational Theory for Planning Shrinking Cities. House Policy Debate 2011, 21, 349–367. [Google Scholar] [CrossRef]
- Martinez-Fernandez, C.; Audirac, I.; Fol, S.; Cunningham-Sabot, E. Shrinking Cities: Urban Challenges of Globalization. Int. J. Urban Reg. Res. 2012, 36, 213–225. [Google Scholar] [CrossRef] [PubMed]
- Bernt, M.; Rink, D. “Not Relevant to the System”: The Crisis in the Backyards. Int. J. Urban Reg. Res. 2010, 34, 678–685. [Google Scholar] [CrossRef]
- Storper, M. Keys to the City: How Economics, Institutions, Social Interaction, and Politics Shape Development; Princeton University Press: Princeton, NJ, USA, 2013. [Google Scholar]
- Hollander, J.B. Moving Toward a Shrinking Cities Metric: Analyzing Land Use Changes Associated With Depopulation in Flint, Michigan. J. Pol. Dev. Res. 2010, 12, 133–151. [Google Scholar] [CrossRef]
- Reckien, D.; Martinez-Fernandez, C. Why Do Cities Shrink? Eur. Plan. Stud. 2011, 19, 1375–1397. [Google Scholar] [CrossRef]
- Martinez-Fernandez, C.; Weyman, T.; Fol, S.; Audriac, I.; Cunningham-Sabot, E.; Wiechmann, T.; Yahagi, H. Shrinking cities in Australia, Japan, Europe and the USA: From a global process to local policy responses. Prog. Plan. 2016, 105, 1–48. [Google Scholar] [CrossRef]
- Mallach, A.; Haase, A.; Hattori, K. The shrinking city in comparative perspective: Contrasting dynamics and responses to urban shrinkage. Cities 2017, 69, 102–108. [Google Scholar] [CrossRef]
- Hartt, M. The diversity of North American shrinking cities. Urban Stud. 2018, 55, 2946–2959. [Google Scholar] [CrossRef]
- Mallach, A. What we talk about when we talk about shrinking cities: The ambiguity of discourse and policy response in the United States. Cities 2017, 69, 109–115. [Google Scholar] [CrossRef]
- Haase, D. Urban Ecology of Shrinking Cities: An Unrecognized Opportunity? Nat. Cult. 2008, 3, 1–8. [Google Scholar] [CrossRef]
- Herrmann, D.L.; Schwarz, K.; Shuster, W.D.; Berland, A.; Chaffin, B.C.; Garmestani, A.S.; Hopton, M.E. Ecology for the Shrinking City. Bioscience 2016, 66, 965–973. [Google Scholar] [CrossRef] [PubMed]
- Burkholder, S. The New Ecology of Vacancy: Rethinking Land Use in Shrinking Cities. Sustainability 2012, 4, 1154–1172. [Google Scholar] [CrossRef]
- Ribant, M.; Chen, X. A Typology of U.S. Shrinking Cities. Prof. Geogr. 2020, 72, 152–164. [Google Scholar] [CrossRef]
- Oda, K.; Rupprecht, C.D.D.; Tsuchiya, K.; McGreevy, S.R. Urban Agriculture as a Sustainability Transition Strategy for Shrinking Cities? Land Use Change Trajectory as an Obstacle in Kyoto City, Japan. Sustainability 2018, 10, 1048. [Google Scholar] [CrossRef]
- Wang, Y.; Fukuda, H. Sustainable Urban Regeneration for Shrinking Cities: A Case from Japan. Sustainability 2019, 11, 1505. [Google Scholar] [CrossRef]
- Pallagst, K. From urban shrinkage to urban qualities? J. Urban Des. 2019, 24, 68–70. [Google Scholar] [CrossRef]
- Wu, K.; Qi, W. Shrinking cities: Misunderstandings, identifications and reflections. Geog. Res. 2021, 40, 213–229. (In Chinese) [Google Scholar]
- Long, Y.; Wu, K.; Wang, J.H. Shrinking Cities in China. Mod. Urban Res. 2015, 9, 14–19. (In Chinese) [Google Scholar]
- Wu, K.; Long, Y.; Yang, Y. Urban Shrinkage in the Beijing-Tianjin-Hebei Region and Yangtze River Delta: Pattern, Trajectory and Factors. Mod. Urban Res. 2015, 9, 26–35. (In Chinese) [Google Scholar]
- Lang, W.; Deng, J.; Li, X. Identification of “Growth” and “Shrinkage” Pattern and Planning Strategies for Shrinking Cities Based on a Spatial Perspective of the Pearl River Delta Region. J. Urban Plan. Dev. 2020, 146. [Google Scholar] [CrossRef]
- Wu, S.Y.; Dong, H.H.; Geng, C. Measurement and Comparative Analysis of Urban Shrinkage in Northeast China. Res. Dev. Mark. 2020, 30, 1252–1258. (In Chinese) [Google Scholar]
- Zhang, S.; Wang, C.X.; Wang, J.; Yao, S.; Zhang, F.; Yin, G.; Xu, X. On the comprehensive measurement of urban shrink in China and its spatio-temporal differentiation. China Pop Res. Environ. 2020, 30, 72–82. (In Chinese) [Google Scholar]
- Du, Z.; Zhang, H.; Ye, Y.; Jin, L.; Xu, Q. Urban shrinkage and growth: Measurement and determinants of economic resilience in the Pearl River Delta. J. Geogr. Sci. 2019, 29, 1331–1345. (In Chinese) [Google Scholar] [CrossRef]
- Zhang, M.D.; Qu, J.X. Study on the Impact of Urban Shrinkage on Economic Development: “Facilitate” or “Hinder”. Urban Dev. Res. 2020, 27, 50–57. (In Chinese) [Google Scholar]
- Zhou, K.; Liu, L.L.; Dai, Y.G. The Governance of Urban Shrinkage: Theoretical Models, International Comparisons and Policy Issues. Int. Urban Plan. 2020, 35, 12–19, 37. (In Chinese) [Google Scholar]
- Shen, Y.; Zhu, H.F.; Liu, M.; Kinoshita, I. A Study on the Planning Strategies in the Urban Shrinkage of Japan Under the Background Fertility Rate and Aging. Int. Urban Plan. 2020, 35, 47–53. (In Chinese) [Google Scholar]
- Guan, D.; He, X.; Hu, X. Quantitative identification and evolution trend simulation of shrinking cities at the county scale, China. Sustain. Cities Soc. 2021, 65, 102611. [Google Scholar] [CrossRef]
- Sarzynski, A.; Vicino, T.J. Shrinking Suburbs: Analyzing the Decline of American Suburban Spaces. Sustainability 2019, 11, 5230. [Google Scholar] [CrossRef]
- World Bank. Overview of Small and Medium-Sized Towns in China; World Bank: Washington, DC, USA, 2012. [Google Scholar]
- Hu, Z.C. Substantial achievements made in strengthening weak links of county towns by raising awareness and implementing well-targeted policies. Mac Man. 2020, 9, 1–3, 7. (In Chinese) [Google Scholar]
- Tang, S.; Feng, J. Function Expansion and Policy Evolution of Rural Area in France During the Rapid Urbanization Period. Urban Plan. Int. 2017, 32, 104–110. [Google Scholar] [CrossRef]
- Liao, Y.L. Urbanization in situ and nearby: The realistic path choice of new urbanization. Guizhou Social Sci. 2015, 11, 123–127. (In Chinese) [Google Scholar]
- Fei, X.T. Small town, explore again. Outlook 1984, 20, 14–15. (In Chinese) [Google Scholar]
- Fei, X.T. Wenzhou trip. Outlook 1986, 20, 1, 21–22. (In Chinese) [Google Scholar]
- Fei, X.T. Academic Self-Report and Reflection; Sanlian Bookstore: Hong Kong, China, 1996. [Google Scholar]
- Tian, P. Research on the Dynamic Mechanism of In Situ Urbanization: On the Modern Turn of the Strategy of Small Towns. J. HNU 2017, 57, 77–82. (In Chinese) [Google Scholar]
- Gu, S.Z.; Zheng, C.; Cao, Y.B. Strategic Thinking on Developing Small and Medium-sized Cities to Balance Urbanization. Pop Res. 2014, 38, 19–26. (In Chinese) [Google Scholar]
- Dan, J.; Yin, J. Floating Population within County and in Situ Urbanization. Urban Dev. Stud. 2016, 23, 2, 88–93. [Google Scholar]
- Pan, L.H. A Review of Research on In-situ Urbanization. J. IMU 2020, 18, 91–94. (In Chinese) [Google Scholar]
- Yang, C.K. On the Foundation and Path of In-situ Urbanization within County in China. J. ECNU 2019, 51, 114–122, 187–188. (In Chinese) [Google Scholar]
- Peng, B.; Lu, Y. Analysis on the development path of in-situ urbanization under the strategy of rural revitalization. Theor. Guid. 2019, 12, 85–89. (In Chinese) [Google Scholar]
- Ren, X. Forward to the Past: Historical Preservation in Globalizing Shanghai. City Community 2008, 7, 23–43. [Google Scholar] [CrossRef]
- Ren, X. The Political Economy of Urban Ruins: Redeveloping Shanghai. Int. J. Urban Reg. Res. 2014, 38, 1081–1091. [Google Scholar] [CrossRef]
- Ren, X. China’s new towns. City 2019, 23, 686–689. [Google Scholar] [CrossRef]
- Ren, X. City power and urban fiscal crises: The USA, China, and India. Int. J. Urban Sci. 2015, 19, 73–81. [Google Scholar] [CrossRef]
- Ren, X. Governing the Informal: Housing Policies Over Informal Settlements in China, India, and Brazil. Hous. Policy Debate 2018, 28, 1051–1482. [Google Scholar] [CrossRef]
- Weinstein, L.; Ren, X. The Changing Right to the City: Urban Renewal and Housing Rights in Globalizing Shanghai and Mumbai. City Community 2009, 8, 407–432. [Google Scholar] [CrossRef]
- Shandong Provincial Bureau of Statistics. Shandong Statistical Yearbook 2019; China Statistics Press: Beijing, China, 2005.
- Shandong Provincial Bureau of Statistics. Statistical Bulletin of Shandong Province on the National Economic and Social Development; Shangdong Provincia Government: Jinan, China, 2018.
- Shandong University County Development Research Institute. Shandong County Scientific Development Evaluation and Ranking from the Perspective of Five Development Concepts; Shangdong University: Jinan, China, 2017. [Google Scholar]
- Zhang, M.D.; Qu, J.X. A Study on the Spatial Pattern and Generating Logic of Generalized Urban Shrinkage in China—Based on the Perspectives of Total Population and Economic Scale. Economist 2020, 1, 77–85. (In Chinese) [Google Scholar]
- Wang, J.; Ye, J.P. Population and housing market in shrinking cities with declining industries: Based on analysis in Dongguan City. Urban Prod. 2020, 6, 56–63. (In Chinese) [Google Scholar]
- Wen, J.N.; Song, Y.C. The impact of urban shrinkage on urban productivity. Mod. Econ. Res. 2020, 4, 68–74. (In Chinese) [Google Scholar]
- Peters, D.J. Community Resiliency in Declining Small Towns: Impact of Population Loss on Quality of Life over 20 Years. Rural. Sociol. 2019, 84, 635–668. [Google Scholar] [CrossRef]
- Slach, O.; Nováček, A.; Bosák, V.; Krtička, L. Mega-retail-led regeneration in the shrinking city: Panacea or placebo? Cities 2020, 104, 102799. [Google Scholar] [CrossRef]
- Min, M.; Lin, C.; Duan, X.; Jin, Z.; Zhang, L. Research on targeted land poverty alleviation patterns based on the precise identification of dominant factors of rural poverty: A case study of Siyang County, Jiangsu Province, China. Environ. Dev. Sustain. 2021, 1–23. [Google Scholar] [CrossRef]
- Kanbur, R.; Christiaensen, L.; Weerdt, J.D. Where to create jobs to reduce poverty: Cities or towns? J. Econ. Ineq. 2019, 17, 543–564. [Google Scholar] [CrossRef]
- Gerrity, B.F.; Phillips, M.R. Vulnerability and Resilience in San Mateo County: Identifying Social, Economic and Physical Discrepancies in Stakeholder Perception of Risk. J. Coast. Res. 2020, 95, 803–807. [Google Scholar] [CrossRef]
- Nesticò, A.; Fiore, P.; D’Andria, E. Enhancement of Small Towns in Inland Areas. A Novel Indicators Dataset to Evaluate Sustainable Plans. Sustainability 2020, 12, 6359. [Google Scholar] [CrossRef]
- Liu, Y.B.; Meng, M.X.; Zhang, X.L. How Has Urban Shrinkage Affected Labor Wage Differential in China?—Analysis Based on National census and CHFS Data. Shanghai Econ. 2020, 6, 59–72. (In Chinese) [Google Scholar]
- Jin, E.T.; Wang, S.Y.; Jiang, J.; Zheng, K.Q. Regional Difference and Policy Analysis of the Urban-Rural Well-Being Gap in China in the 21st Century. J. Pub Admin. 2019, 12, 143–160, 193–194. (In Chinese) [Google Scholar]
- Liu, Y.B.; Li, J.; Xiao, S.P.; Su, T. How Does Urban Shrinkage Affect the Supply of Local Public Services? Urban Dev Res. 2020, 27, 11–18. (In Chinese) [Google Scholar]
- Zhou, K.; Qian, F.F. Shrinking City: On Searching for Urban Development in Non-Growing Scenarios. Mod. Urban Res. 2015, 9, 8. (In Chinese) [Google Scholar]
- Martinez Fernandez, C.; Wu, C.T.; Laura, K.; Schatz, N.T.; Taira, N.; Vargas-Hernandez, J.G. The Shrinking Mining City: Urban Dynamics and Contested Territory. Int. J. Urban Reg. Res. 2012, 36, 245–260. [Google Scholar] [CrossRef]
- Hauser, P.M.; Duncan, O.D. The Study of Population; University of Chicago Press: Chicago, IL, USA, 1959; pp. 486–509. [Google Scholar]
- Liu, K.W. The Modeling of “Push-pull” Theory and its Forecasting—A Case Study of Shaanxi Province. J. NU 1995, 6, 715–718. (In Chinese) [Google Scholar]
- Zhang, J.R.; Wu, C.J. Migration, Wander and Return: The Differential Flow of Rural Population in Urbanization Process—A Survey in A Village in East Hubei. J. Social Dev. 2020, 7, 79–94, 243. (In Chinese) [Google Scholar]
- Zhang, Y.; Bao, T.T. Analysis of the driving force of rural homestead withdrawal—Based on the perspective of push-pull theory. Rural Econ. 2017, 4, 18–23. (In Chinese) [Google Scholar]
- Xiong, P. Analysis of the Mechanism of Farmers’ Citizenization from the Perspective of Household Registration System—Based on Push-Pull Theory. Rural Econ. 2012, 6, 122–124. (In Chinese) [Google Scholar]
- Zhong, X.G.; Xiao, M.H.; Liu, J.X. Comparative analysis of technological competitiveness of Internet of Things enterprises in the East and Midwest—Based on the push-pull model and the human technology symbiosis model. Sci. Man. Res. 2013, 31, 80–84. (In Chinese) [Google Scholar]
- An, Y.L.; Duan, S.F. Historical Evolution and Innovative Development of the Push-Pull Theory from the Perspective of Students’ International Mobility. J. BNU 2020, 4, 25–35. (In Chinese) [Google Scholar]
- Mo, K.; Zheng, P. Old-age Tourism Wishes Empirical Analysis of Factors Affecting: Based on Push-pull Theory. Res. Dev. Mark. 2014, 30, 758–762. (In Chinese) [Google Scholar]
- Zhang, H.Q.; Li, Y.M.; Zhang, C.J. Dynamic Effects and Regional Disparity of Population, Economy and Industrial Urbanization on the Water Consumption. J. Ind. Technol. Econ. 2019, 38, 83–90. (In Chinese) [Google Scholar]
- Xu, Y. Countermeasures and suggestions for accelerating the adjustment of industrial structure in Rushan City, Shandong Province. Shop Mall Mod. 2016, 13, 128–129. (In Chinese) [Google Scholar]

Publisher’s Note: MDPI stays neutral with regard to jurisdictional claims in published maps and institutional affiliations. |
© 2021 by the authors. Licensee MDPI, Basel, Switzerland. This article is an open access article distributed under the terms and conditions of the Creative Commons Attribution (CC BY) license (http://creativecommons.org/licenses/by/4.0/).