Article

Exploring the Impacts of Driving Environment on Crashes in Tunnel–Bridge–Tunnel Groups: An Eight-Zone Analytic Approach

1
School of Traffic and Transportation, Chongqing Jiaotong University, Chongqing 400074, China
2
School of Transportation Engineering, Tongji University, Shanghai 201804, China
*
Authors to whom correspondence should be addressed.
Sustainability 2021, 13(4), 2272; https://doi.org/10.3390/su13042272
Submission received: 29 December 2020 / Revised: 7 February 2021 / Accepted: 10 February 2021 / Published: 19 February 2021

Abstract

:
Tunnel–bridge–tunnel groups (TBTGs) are emerging roads that often involve simple road alignments, but complex driving environments. Investigating crashes occurred in TBTGs is essential for revealing the driving environment–adaptability relationships for such roads. This study seeks to analyze the crash characteristics of component sections in TBTGs with different driving environments and compare the impact of differences in the key factor on the crashes. After TBTGs were defined through a proposed safety-critical distance metric determined via visual theory and actual crash analyses, an eight-zone analytical method considering road types and lighting was developed to probe into crashes in TBTGs. The results show that the proper safety-critical distances for bridge–tunnel and tunnel–tunnel groups are 150 and 500 m, respectively. In TBTGs, the crash rate in ordinary sections is higher than that in bridges and tunnels, particularly in the access zone. The first passed tunnel witnesses a higher proportion of crashes at the access zone and transition zone than the second tunnel. The influence of bridge and tunnel ratios on crashes is related to the ratio and type of bridges and tunnels. The findings presented herein can provide evidence-based guidance for the safety design and management of TBTGs.

1. Introduction

With the rapid development of the economy and implementation of the national freeway network improvement plan, the lengths of mountainous freeways are increasing in the central and western regions of China. Being two cost-effective engineering avenues, bridges and tunnels can traverse complex mountainous terrains within a short distance, and are therefore conducive to the improvement of traffic efficiency, reduction of air pollution, and protection of the fragile ecological environment of mountainous areas. According to the statistical bulletin of the Chinese government on the development of transportation in 2019 [1], 26,800 bridges and 1329 tunnels with total lengths of 4.95 and 1.73 million meters, respectively, have been built. These lengths are 1.44 and 0.89 times the lengths of those built in 2018, and 1.60 and 1.38 times the lengths of those built in 2017, respectively. Therefore, tunnels and bridges are increasingly being used in the construction of mountainous freeways. Their proportion can be even higher than that of ordinary sections. For instance, the Ankang section of the Xihan freeway has a total length of 78 km, of which the proportion of bridges and tunnels is as high as 70%. Similarly, the Chengkai freeway in Chongqing has a total length of 128 km, of which 78% are bridges and tunnels. The tunnels and bridges located adjacent to each other form tunnel groups or bridge–tunnel groups, while some of them form even more complex tunnel–bridge–tunnel groups (TBTGs).
As far as the driving environment is concerned, TBTGs have dual characteristics of tunnel groups and bridge–tunnel groups to a certain extent. When a vehicle passes through a TBTG, the driver faces multiple hurdles, such as rapid cross-section switching, abrupt longitudinal changes in the driving environment, and alternations in visual light and dark adaptation [2,3,4,5]. Although some studies have attempted to address some of the related problems [6,7,8,9,10,11], these factors still inhibit the maintenance of driving consistency. If a driver cannot maneuver properly, this could easily lead to the occurrence of traffic crashes. Considering the complex and varying driving environments of TBTGs, the adaptability of drivers to the new type of road requires serious consideration before the large-scale implementation of TBTGs in the construction of mountainous freeways.
In fact, with the growth of TBTGs, the number of traffic crashes occurring on such roads cannot be neglected. For example, the number of crashes that occurred in TBTGs in the Chongqing section of the Yuxiang freeway accounts for approximately 23.2% of the total number of crashes [12]. In particular, the fatalities associated with these crashes have raised concerns regarding the safety of TBTGs and whether additional accident-sensitive factors exist under such complex environments. For instance, a crash occurred in the Qinling TBTGs of the Shanxi freeway on 10 August 2017, when a coach hit a tunnel entrance, resulting in 36 deaths and 13 injuries [13]. Another crash recently occurred in the Dadu River TBTGs of the Yaxi freeway on 16 May 2020, when a bus rammed into a bridge fence, resulting in six deaths and 20 injuries. Under these circumstances, traffic crash analysis might prove to be the most direct and effective method of solving these problems [14,15].
Numerous crash investigations have been conducted on road sections with tunnels, such as freeway tunnels, tunnel groups, and bridge–tunnel groups. Statistical regression models, such as a classification and regression tree [16], artificial neural networks [17], a generalized ordered logit model [18], a correlated random parameters approach [19], a negative binomial model [20], and multivariate nonlinear regression [21], have been extensively applied to analyze crash data to establish crash prediction models or explore factors contributing to crashes. It has been found that the factors sensitively influencing crashes include traffic volume, driving behavior, time, location, weather, slope, radius, and vehicle type.
Some studies [13,22,23,24] divide tunnel and tunnel groups into different zones according to the differences in the longitudinal driving environment, as shown in Figure 1. Then, the crash properties, such as the crash rate, crash severity, and crash type in each zone, are extracted to obtain the distribution characteristics of crashes along TBTGs. Table 1 summarizes the results of four previous studies on tunnels and tunnel groups. For tunnels, the results appear inconsistent to some extent in terms of the crash rates of the tunnel and its component zones and the ranking between zones, which may owe to the different data sources, scope, and sample sizes. Nonetheless, all of the results indicate that the crash rate and severity of crashes in inner zones are the lowest and highest among all of the zones, respectively. Crashes involving vehicles moving in the same direction are the main types of crashes, accounting for approximately half of the total crashes. Additionally, the results reveal that the tunnel length, annual average daily traffic (AADT), lane width [22], weather, month of the year [23], and proportion of single-vehicle crashes with high probability of casualties [24] are closely related to the crash rate and crash severity. For tunnel groups, Wang et al. [13] found that the connection zone exhibits the highest crash rate, owing to the more frequent occurrence of rear-ends, sideswipes, and single-vehicle collisions therein than in other zones. Furthermore, crashes in the interior entrance zone and exit impact zone occur more frequently than in other zones during daytime and nighttime, respectively, indicating that visual dark adaptation has a greater impact on drivers than visual bright adaptation does. Similar methods [25,26,27] have also been employed to analyze crashes occurring in other types of tunnels.
Many studies exist on traffic crashes in road sections related to tunnels. However, to the best of our knowledge, no such study has been conducted on TBTGs; moreover, the literature is even limited in terms of the methods for defining them. In fact, TBTGs are often incorporated with superior road alignments because of the high standards of tunnel and bridge alignment designs. Nonetheless, owing to the traffic environment created by the tunnel and bridge themselves or between one another, each zone of the TBTG forms a distinctive driving environment, which is independent of and different from the others. Therefore, driving environments that are more complex than road alignments have become a determinant for driving safety on TBTGs. Compared with statistical analysis methods, zone-based analytical methods can more closely integrate the change in the driving environment and emphatically utilize the difference between zones, while extracting the local characteristics of the crash rate, crash influence factor, and crash severity to ensure the disturbance degree of this key factor to driving. However, existing zone division methods are mainly designed in a symmetric manner for single tunnels, which is inconsistent with the actual change in driving environments in tunnels. Although Wang et al. [13] proposed a method for dividing tunnel groups, the connecting sections between tunnels and the adjacent tunnel exit and entrance, which have the most complicated environments, were simply defined as integrated zones. Consequently, existing zone division methods not only have their own specific applicable contexts, but other practical drawbacks as well. All of these defects materially hinder the application of such methods in the division of TBTGs, which are characterized as heterogeneous structural combinations of bridges and tunnels.
The present study intends to explore the adaptability of drivers to the diversified driving environment of TBTGs to discover underlying safety problems via investigation of the spatial distribution of traffic crashes. TBTGs were first defined based on a proposed safety-critical distance metric, which was determined using both visual theory analysis and actual crash tests. An original eight-zone analytical approach was developed to probe into police-reported crash data in terms of the road type and lighting zone in TBTGs. Furthermore, the effects of the tunnel–tunnel (bridge) spacing, bridge and tunnel length ratios, and travel process on the crash rate are discussed in detail. This systematic study will not only facilitate the exploitation of traffic crash data for the effective identification of safety hazards existing in the driving environments of TBTGs, therefore providing evidence for targeted interventions in enhancing the safety of TBTGs, but can also narrow the existing gap in research on traffic crashes between TBTGs and other road sections with tunnels.

2. Materials and Methods

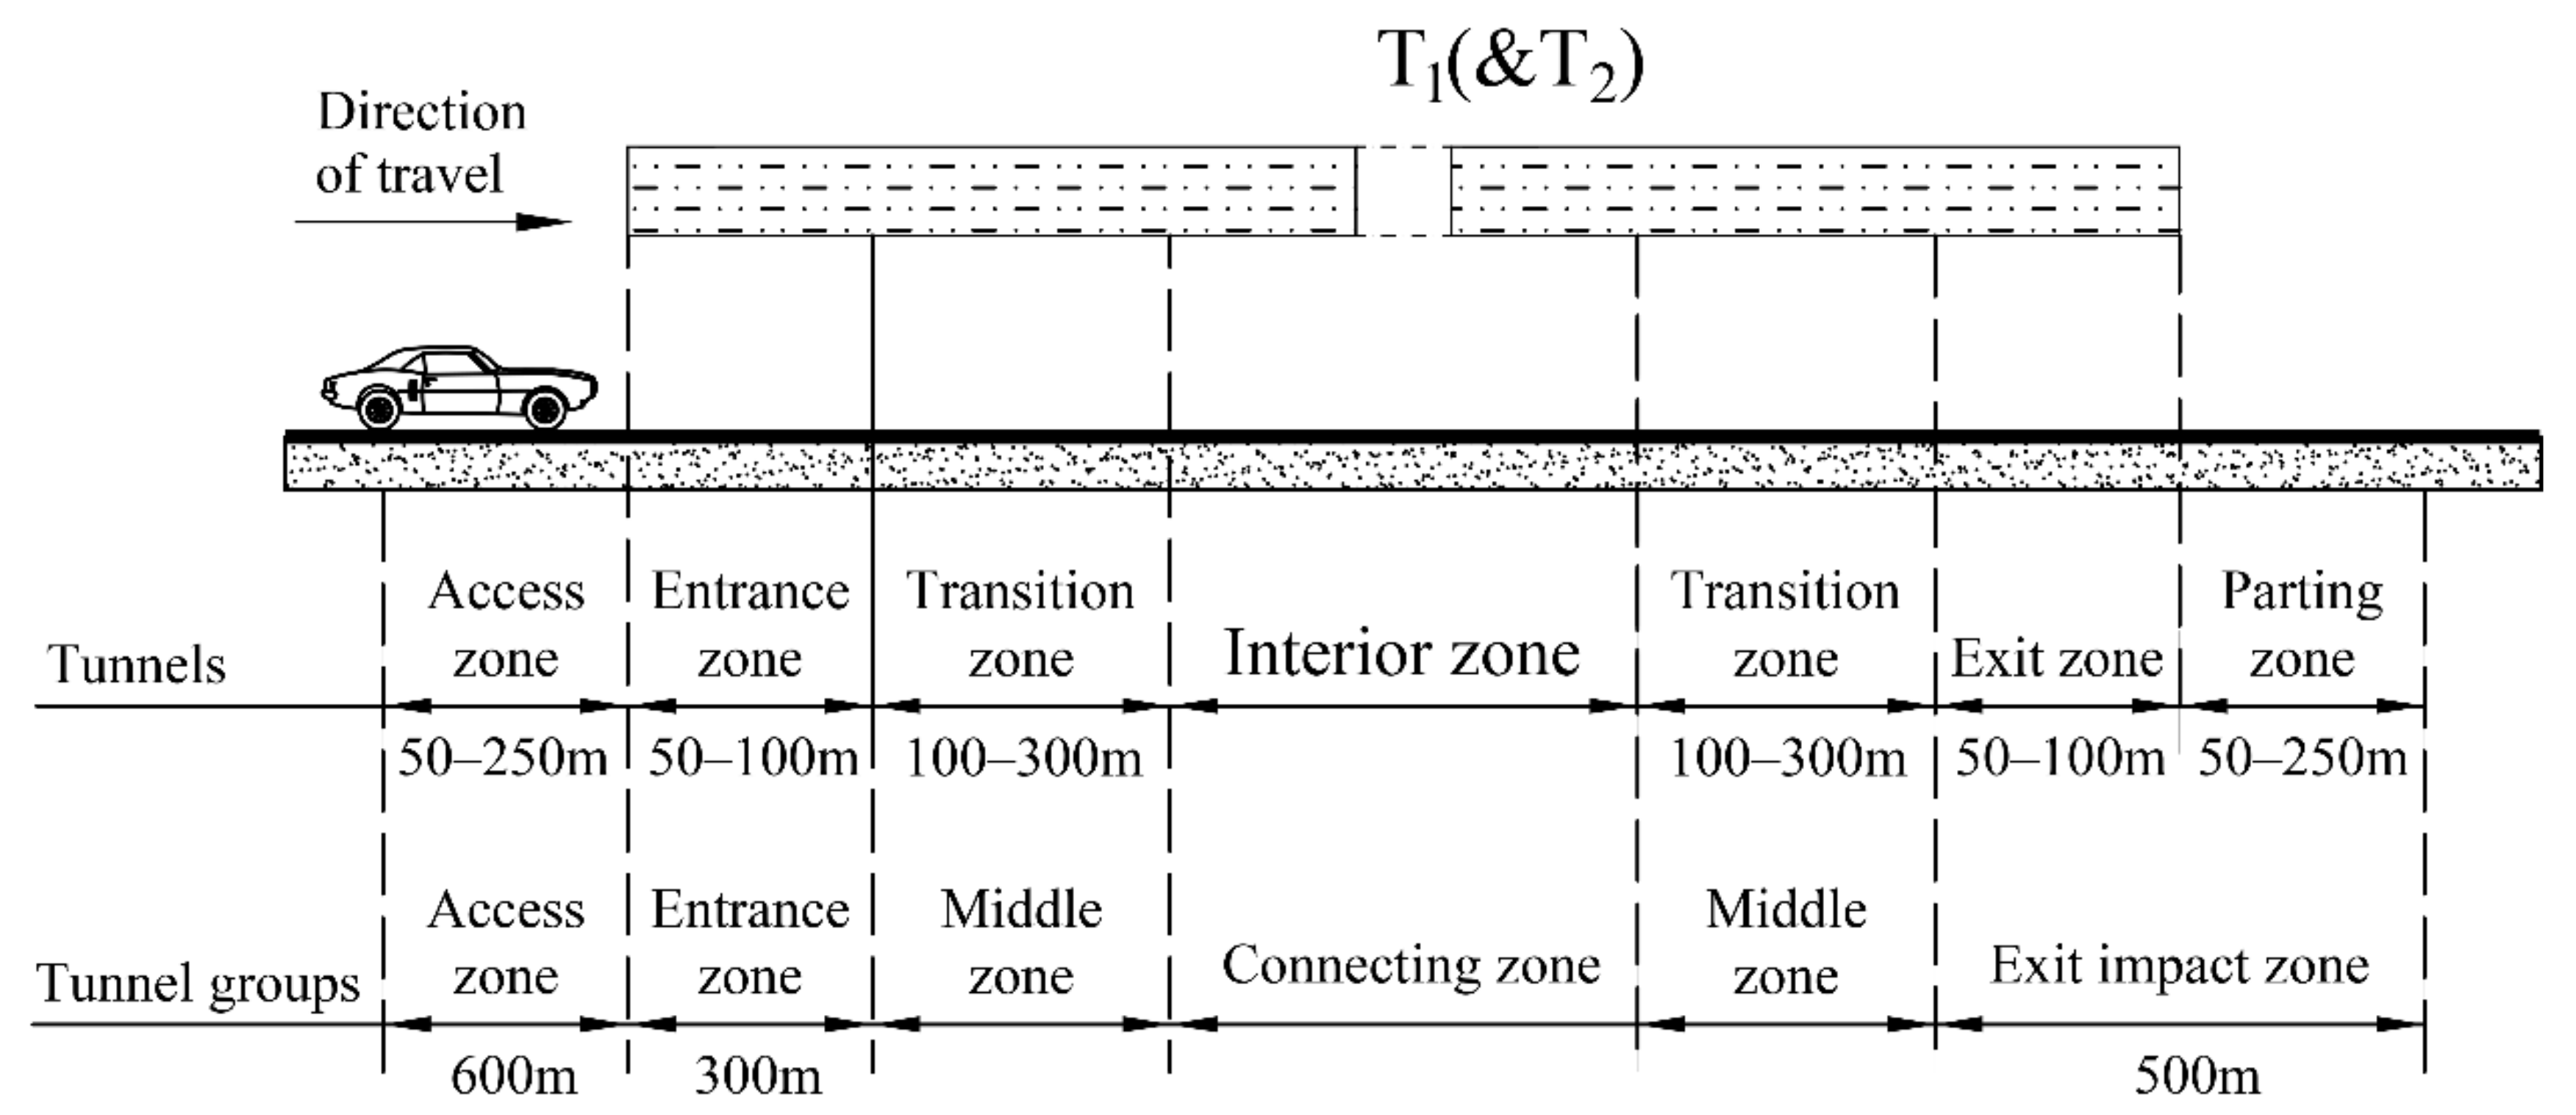
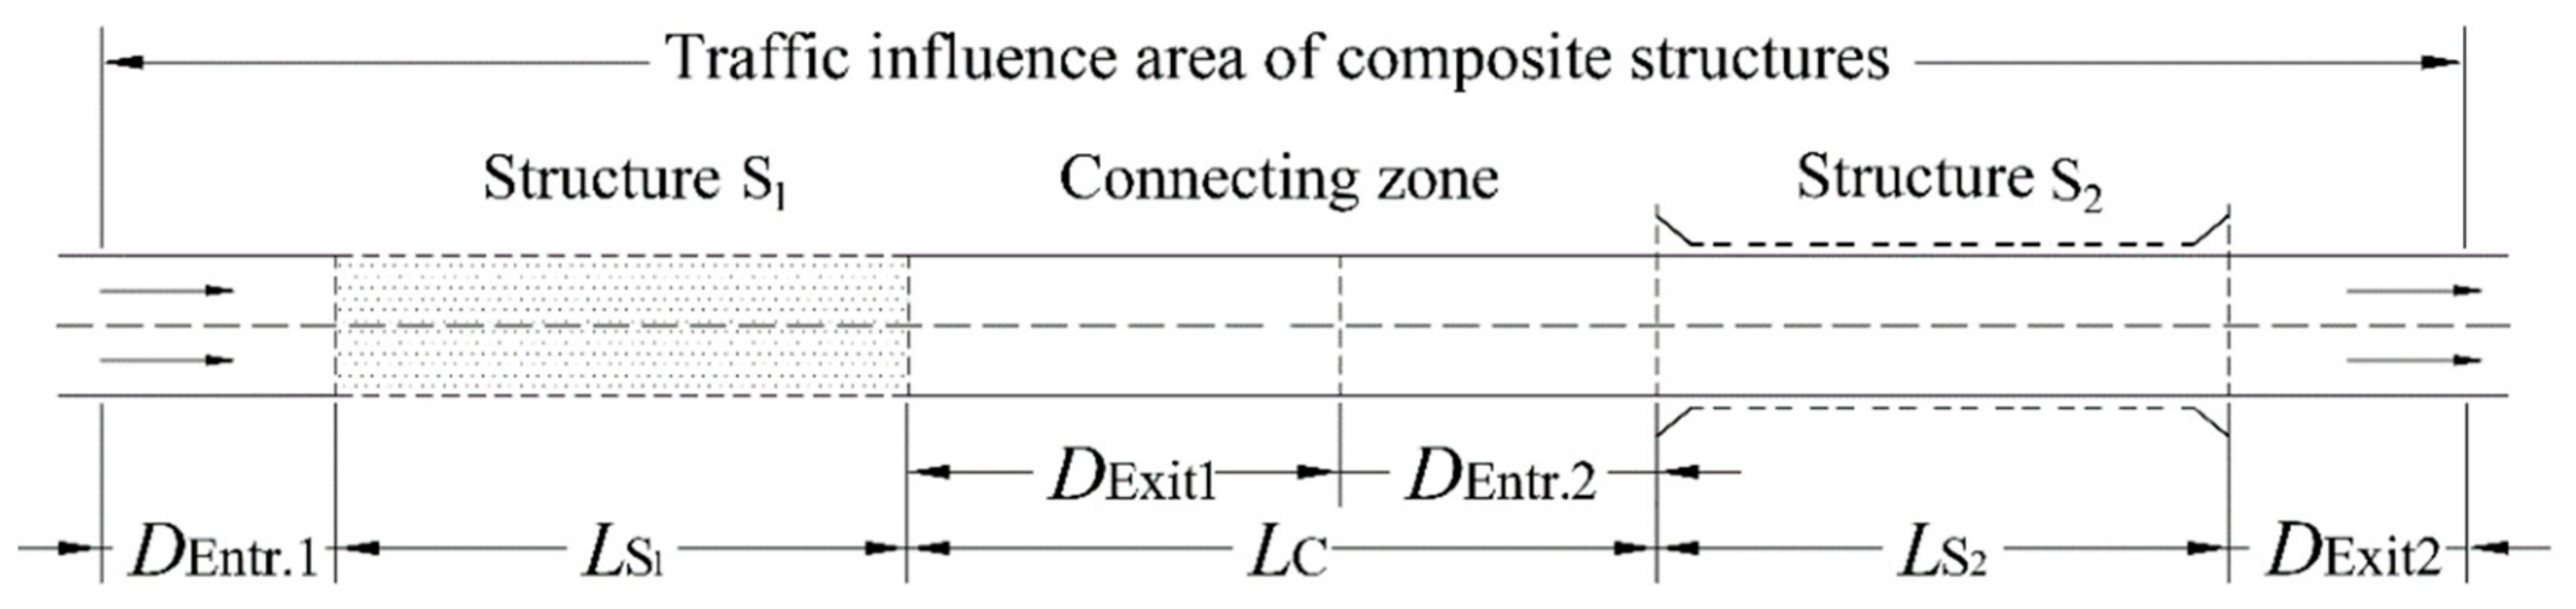
2.1. Definition of Tunnel–Bridge–Tunnel Groups

Before performing crash analysis, TBTGs should be properly defined. Although the definition of tunnel groups has been discussed in existing studies [13,16], that of TBTGs has rarely been mentioned, probably owing to the difficulty in determining the quantitative basis and criteria. Hence, we first define TBTGs as a road section containing two or more tunnels wholly connected by a bridge with a separation distance less than the safety-critical distance. In the definition, the safety-critical distance (LC), which denotes the distance between tunnels and bridges determined from the perspective of driving safety, is the only quantitative basis for judging whether a TBTG is constituted by a tunnel and a bridge. Figure 2 shows the calculation diagram of the safety-critical distance for composite structures in TBTGs.
As shown in Figure 2, S1 and S2 represent the adjacent tunnel and bridge in TBTGs, respectively. DExit1 and DEntr.2 denote the exit and entrance influence distances of the first and second passed structures, respectively; the safety-critical distance between them is given by L C = D Exit 1 + D Entr . 2 . Specifically, the DExit1 and DEntr.2 values vary with the order of passing through bridges and tunnels, which would lead to different values of LC. If the distance between adjacent bridges and tunnels (i.e., L) is less than LC, overlapping areas between the traffic influence areas of the two structures will exist. In these areas, the driving adaptation to leaving S1 will affect the driving process of approaching S2, which means that both S1 and S2 affect driving in the connecting section between them. Hence, such adjacent tunnels and bridges should be considered as a composite structure, instead of two separate structures. If the distance between them exceeds or equals LC, no overlapping areas exist between their traffic influence areas. The driving processes through the bridge and tunnel are independent of each other, thus, they can be treated as two separate road sections. The determination of the entrance and exit influence distances relies on the comprehensive measurement of the intervention of the driver’s visual requirements and adaptation to lighting, traffic control, and road facility conditions on driving. Nevertheless, the specific method for the abovementioned process remains an open question. In this study, these distances were analyzed mainly through visual perception characteristics, because they are considered the strongest and most direct factors with the maximum scope of influence.

2.1.1. Tunnels

When vehicles approach a tunnel entrance during the day, drivers often tend to slow the car down owing to the black hole effect. According to tunnel lighting guidelines [28], the tunnel access zone is defined as the open road immediately outside of the entrance, which begins at the stopping sight distance before the tunnel entrance and ends at the entrance itself. For a driving speed of 100 km/h (which is usually the speed limit outside of the tunnel section in Chinese mountainous freeways), the stopping sight distance is 150 m. However, to satisfy the visual requirements of driving, a driver always maintains a certain expected sight distance based on the perceived road information, vehicle speed, and driving safety and comfort. As a visual attention area under normal driving, the distance must also be related to driving safety. Based on the expected sight distance at different driving speeds [29], it is calculated as 500 m for a speed of 100 km/h. For these two aspects, the former is the minimum distance required to ensure an emergency stop before the entrance of a tunnel, and it is therefore closely related to driving safety, whereas the latter is the visual easing condition used by drivers for the initial perception of the road environment, with a wide safety margin. When a tunnel entrance appears in the distance, although drivers would perceive it at first sight, they need not adjust the driving immediately, but can maneuver subsequently for a short time. Therefore, it can be synthetically considered that the actual influence distance of the tunnel entrance lies between the two distances, that is, D ∈ (150,500).
When a vehicle exits a tunnel, the driver needs to adapt to the visual stimulation caused by the bright light outside of the tunnel, resulting in the white hole effect. According to a previous driving experiment conducted on Chinese freeway tunnels [30] and the Chinese tunnel lighting guideline (JTG/T D70/2-01-2014) [31], the time required for this adaptation is typically in the range of 3–15 s, depending on the tunnel length. In the Chinese highway engineering technique standard (JTG B01-2014) [32], road tunnels are categorized into four types: short tunnels (L < 500 m), medium tunnels (500 m ≤ L < 1000 m), long tunnels (1000 m ≤ L < 3000 m), and extra-long tunnels (L > 3000 m). Hence, the corresponding maximum light adaptation distances calculated in terms of their adaptation times are 250 m, 300 m, 350 m, and 400 m, respectively, which were considered as the influence distances of tunnel exits in this study.

2.1.2. Bridges

Regarding bridges, only if the deck of the bridge is high will the driver perceive that the canyon is sufficiently deep to induce injuries and casualties in the event of a fall. Nonetheless, the changes in the visual environment of a bridge are still less significant than those of a tunnel in general, and can therefore only have a weaker influence on driving, as demonstrated by the results of a driving test [33]. Hence, only the stopping sight distance (DStop), which is directly related to driving safety, was considered for estimating the bridge entrance and exit influence distances.
Because of the uncertainty in the influence distances for the entrance and exit, only the maximum value (not the actual one) of the safety-critical distance between bridges and tunnels can be calculated theoretically (see Table 2). This implies that, even if the distance between a bridge and a tunnel is below the maximum value, they do not necessarily form a composite road section. Similarly, Table 2 lists the theoretical maximum values of the safety-critical distance between tunnels. However, it should be noted that the influence of structures on driving may vary with their spacing, which is externally reflected by the rise or decline in the crash rate. Therefore, based on the theoretical maximum value, the safety-critical distance can be refined by analyzing actual crashes (see Section 3.1) to improve the comprehensiveness and accuracy of its determination. After combining the results of the above visual theory analysis and the latter crash statistics, a reasonable safety-critical distance will be finally determined for the definition of TBTGs.

2.2. Zone Division

Zone division occurs after the selection of a TBTG according to the definition. Because the driving environment varies greatly among the different zones in TBTGs, zone division is important for comparing and analyzing the effects of this difference on road safety. In view of the particularity of the driving environment in the different types of road sections, especially the lighting environment in tunnels, we propose a road type and lighting approach for TBTG division. Based on the type of road and drive-through function of the ordinary road, TBTGs are first divided into tunnels, bridges, an access zone, a connecting zone, and a parting zone. Then, the tunnels are further subdivided in terms of lighting conditions, which mainly contribute to the difference in the driving environment of zones in a tunnel. According to the Chinese tunnel lighting guidelines (JTG/T D70/2-01-2014), a one-way highway tunnel can be divided into the threshold, transition, interior, and exit zones, as shown at the center of Figure 3. If the speed limit is 80 km/h, which is common for tunnels in Chinese mountainous freeways, the lengths of the aforementioned sections, except for the interior zones, are set to approximately 90 m, 296 m, and 60 m, respectively. Finally, after super-positioning these zones, as shown in Figure 3, TBTGs can be divided into the following eight zones:
  • Zone 1 (Z1), access zone: the first 150 m in front of the first tunnel;
  • Zone 2 (Z2), threshold zone: the first 100 m inside the tunnel;
  • Zone 3 (Z3), transition zone: the next 300 m inside the tunnel;
  • Zone 4 (Z4), interior zone: the remainder of the tunnel;
  • Zone 5 (Z5), exit zone: the 60 m in front of the portal of the tunnel;
  • Zone 6 (Z6), connecting zone: the first 150 m behind the first tunnel or in front of the second tunnel;
  • Zone 7 (Z7), middle zone: the remainder of the bridge; and
  • Zone 8 (Z8), parting zone: the first 150 m behind the second tunnel.
In these zones, the lengths of Z1 and Z8 are restricted by the stopping sight distance (150 m), because it was previously found that the area within 100 m before and after the tunnel is particularly prone to crashes [34]. Compared with a wider range (such as the expected sight distance mentioned in Section 2.1.1), a distance of 150 m can not only effectively cover the key area where crashes occur frequently, but also avoid masking the actual crash characteristics because of the excessive length. Z6, a connecting zone of the bridge and tunnel, also belongs to the influence area of the tunnel exit and entrance. In addition to the aforementioned reason, another reason for its length being defined as 150 m is that this distance happens to be the safety-critical distance between bridges and tunnels (see Section 3.1). Hence, this value of the distance covers all of the connecting zones between the bridge and the tunnel, and even a part of the bridge entrance, where the transition zone is actually located. According to this division approach, TBTGs are divided to eight zones to explore the spatial distribution characteristics of crashes using statistical analysis and comparative analysis.

2.3. Data Basis and Preparation

The freeway section under consideration has a length of 254.12 km from Baima to Longtan, which is a part of the freeway connecting Chongqing and Hunan, located in the city of Chongqing, China. It passes through extremely mountainous areas, with two lanes in each direction, and is divided into 14 basic road sections by interchanges. Numerous bridges and dual-tube tunnels are situated adjacent to each other on the road, accounting for 61.85% of the total length. Figure 4 shows a map of the selected road section and summarizes the characteristics of the tunnels and bridges located therein. Based on the preliminary judgment using Table 2, these bridges and tunnels constitute 34 and 31 TBTGs, with a total length of 123.61 km in the eastbound direction and 120.5 km in the westbound, respectively. For each TBTG, the traffic volume was determined based on the traffic flow parameter detection data of each basic section, provided by Chongqing Expressway Group Company. The traffic crash data were obtained from police-reported crash records provided by the Chongqing Department of Traffic Police. The records register traffic crashes occurring daily, including detailed information, such as the time, location, type, and cause. During the study period between 2014 and 2016, a total of 951 crashes occurred in the preliminarily chosen TBTGs, which included fatal, injury, and property damage only crashes. Although some of these crashes may not have been caused by the special driving environment in TBTGs, this study does not exclude them from the overall data, because there is no statistical difference in the occurrence frequency of crashes between zones.

3. Results and Discussion

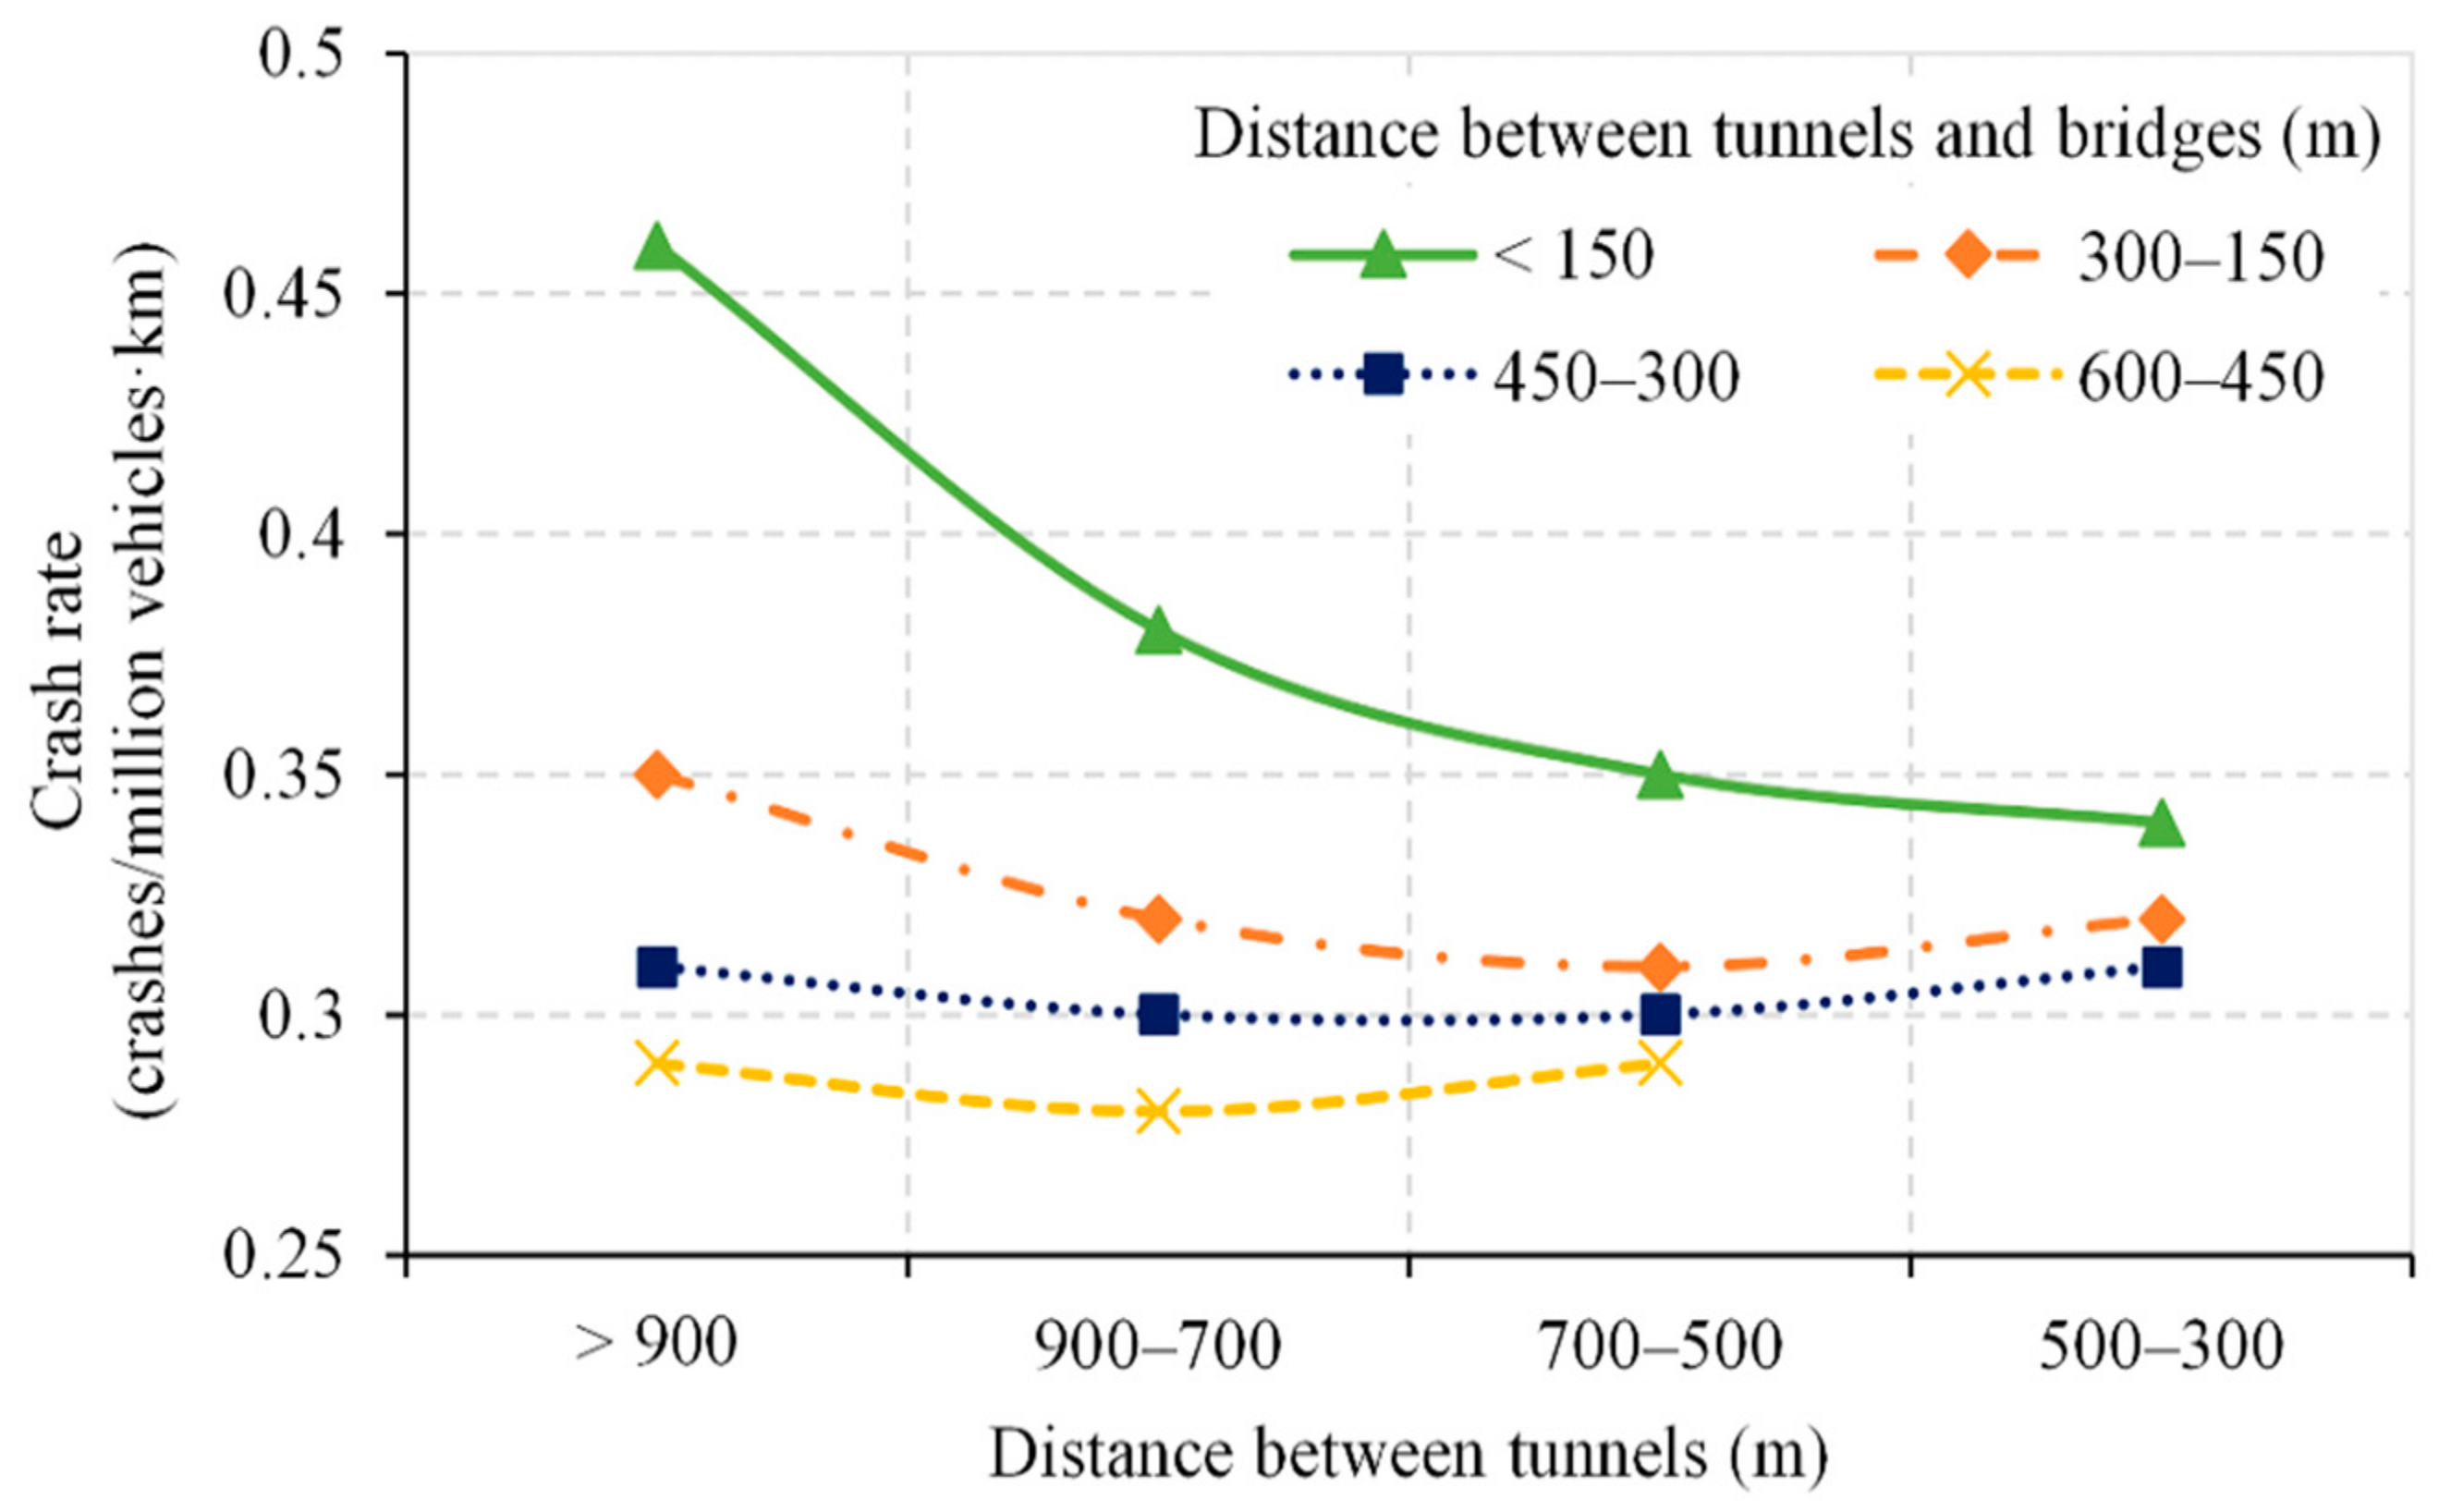
3.1. Crashes and Separation Distance between Structures

Crashes are another important aspect worthy to be considered when determining the safety-critical distance between structures. For TBTGs, the distance between tunnels may impact driving in bridge–tunnel groups in between, which may vary under different distances between the bridge and tunnel. Therefore, based on the theoretical maximum value of the safety-critical distance obtained in Section 2.1, the preliminarily chosen TBTGs are in turn divided into five groups in terms of the distance between tunnels and four groups in terms of the distance between bridges and tunnels to clarify the relationship between them. Figure 5 shows the relationship between the crash rate and distance between bridges and tunnels in bridge–tunnel groups. Regardless of the tunnel spacing, the crash rate in bridge–tunnel groups invariably increases with the decrease of the distance between the bridge and tunnel, but it does not rise rapidly until the distance approaches 150 m. When the distance between the tunnels increases, the trend is more evident, because tunnels interfere less with driving in the internal road section. This result indicates that, although all bridge–tunnel groups with small separation distances have a greater influence on driving than those with large distances, only those exerted by the parts with a tunnel–bridge distance below 150 m changed substantially. Based on the actual crash test results, 150 m appears to be a reasonable safety-critical distance between tunnels and bridges. The bridge–tunnel groups were also sorted by the passed order of tunnels and bridges to examine whether the crash rate varies any differently with the distance between tunnels and bridges upon changing the sorting order; no changes were found.
When the safety-critical distance between tunnels and bridges is reset to 150 m, the same 11 TBTGs were re-selected as the samples for the subsequent crash investigation in this study. This includes two three-connected tunnels and one four-connected tunnel, and amounts to a total length of 60.42 km in the eastbound direction and 60.36 km in the westbound. Particularly, because the distances between bridges and tunnels in these TBTGs are less than 150 m, and large, medium, and small bridges with lengths below 1000 m are common in connecting zones (see Figure 4), which restricts the distance between tunnels in TBTGs, most tunnels constitute tunnel groups per the standards listed in Table 2. As shown in Figure 5, the crash rate in tunnel groups initially increases with the decrease in the distance between tunnels, but the rise is most evident when the distance approaches 500 m, after which there is a decline. The initial increase suggests that the safety-critical distance between tunnels would be 500 m. The subsequent decline may occur because tunnel groups are separated by short distances. This means that drivers are unwilling and lack sufficient time to make significant driving adjustments in the section, thus avoiding the disturbance in traffic flow.
Figure 6 shows the influence of tunnel spacing on the crash rate of bridge–tunnel groups located between tunnels. The crash rates in bridge–tunnel groups with different separation distances vary so differently with distances between the tunnels that the difference between them gradually decreases. When the bridges and tunnels are separated by small distances, and therefore form a special composite road section, the crash rate rapidly decreases. Contrarily, when bridges and tunnels are separated by large distances that are independent of each other, the crash rate initially decreases slowly and then increases slightly. Thus, it can be observed that, when tunnels get closer to each other, even when constituting a tunnel group, driving through the contained bridge–tunnel groups is significantly influenced by the large driving environment created between tunnels. However, the role of this aspect in all environments affecting driving varies based on the distance between the bridge and tunnel. Although the crash rate in the bridge–tunnel composite section decreases from a high level, it remains higher than that of the tunnel groups at the end, which reflects the non-negligible effect of the environment formed between the bridge and tunnel on driving. Therefore, both environments greatly influence driving and determine the final crash rate. By contrast, the environment formed between the bridge and tunnel in the non-composite section has little effect on driving, which is mainly affected by the driving environment formed between tunnels instead. Therefore, the crash rate, which was ordinary, has changed, as seen in Figure 6.

3.2. Crash Rate in Road Zones and Types

3.2.1. General Analysis

Table 3 lists the calculated crash rates in each type of road section and zone for the chosen 22 TBTGs. Overall, the zones are ranked in ascending order based on their crash rates as follows: Z1 > Z8 > Z3 > Z7 > Z2 > Z6 > Z5 > Z4. It is evident that a driver would face more challenges while driving through the entrance of the first tunnel and the exit of the second tunnel, which must be given priority when applying improvement measures for raising TBTG safety. In terms of the road type, the crash rate is the highest in ordinary roads containing various connecting sections (Z1, Z8, and most of Z6) (0.59), while it is the lowest in the tunnels (0.34).
According to the sample distribution and Chinese highway engineering technique standard (JTG B01-2014), bridges and tunnels in TBTGs are divided into three and four different length groups, respectively; their corresponding crash rates are shown in Figure 7. As shown in the figure, the crash rate on bridges decreases gradually with the increase in length, which is consistent with the influence law of the distance between tunnels on the crash rate, because the bridge length is the determining factor in this regard. Unlike in bridges, the crash rate in tunnels increases first and then decreases with the increase in length, with the crash rate being the highest in medium tunnels. This result needs to be further analyzed based on the spatial distribution of crashes that occur in tunnels.

3.2.2. Crash Analysis of Tunnels

As shown in Table 3, Z3 has the highest crash rate (0.49) in tunnels, and is approximately 1.63 times that of Z4 (0.30). The crash rates of Z2 and Z5 lie between the two values, being 0.46 and 0.39, respectively. Generally, the crash rate first rises from Z2, then rapidly declines between Z3 and Z4, and finally rises again between Z4 and Z5 along the driving direction. In these results, what is consistent with those reported in another Chinese study [23], but distinctly different from the results of studies conducted in Scandinavian countries [22,25], is that the Z3 crash rate is not lower, but slightly higher than that of Z2. Therefore, it can be inferred that there may be some additional factors that exist in Z3 of the Chinese freeway tunnels that are detrimental to driving.
A comparison of the Chinese guidelines (JTG/T D70/2-01-2014) with the CIE guide (CIE 88:2004) for the lighting of road tunnels shown in Figure 8 reveals that the former may indeed have some non-negligible defects in the luminance setting of the entrance transition zone. First, the luminance reduction factor for the second half of the threshold zone in the Chinese guideline (50%) is significantly higher than that in the CIE guideline (40%), setting a brightness level that exceeds the one actually required. Second, the selection of the time lengths for the three-stepped lighting curves (4, 4, and 6 s) is unscientific, and the resulting total length of 14 s is insufficient to ensure a reasonable luminance transition between the last step and the interior zone. Finally, it is particularly inappropriate that the luminance in more than 50% of the length of each step is set below the lighting adaptation curve value (shaded areas in Figure 8), and the drop ratio of the luminance in the first step exceeds the maximum permissible value (3). Under such conditions, the lighting in the entrance transition section will inevitably cause visual discomfort to drivers and even a second black hole effect. Considering the relatively simple and closed environment in tunnels, this appears to be the most likely reason for the high crash rate in Z3 among the factors influencing driving behavior.
The reasons for the difference in the crash rates between tunnels with different lengths can be speculated based on the spatial distribution of crashes inside of the tunnels. The decrease in the crash rate between medium and extra long tunnels is mainly because of the fact that the interior zone with a length advantage has a lower crash rate than that in the transition zone, which has also been confirmed by studies conducted in Scandinavian countries [22,25]. In contrast, the difference between the crash rates of medium and short tunnels may be related to the luminance setting method employed for the entrance transition zone. In this study, the average length of short tunnels is less than 300 m. According to the Chinese tunnel lighting guidelines, one part of these tunnels is not illuminated because of good inter-visibility, and in the other part, only the initial segment of the transition zone has been set for lighting other than the threshold and exit zones. Therefore, the overall luminance levels of the short tunnels are high, which can only produce weak visual interference to drivers. In contrast, the length of medium tunnels determines that their luminance setting should be implemented for the entire entrance threshold and transition zones, the exit zone, and a short interior zone. Owing to the problems existing in the luminance setting of the entrance transition zone, this can undoubtedly cause more difficulties to the visual adaptation of drivers, easily leading to crashes. Coincidentally, for a speed of 80 km/h, the total length of the lighting transition zone at the entrance and exit specified in the Chinese guideline (JTG/T D70/2-01-2014) is approximately 460 m, which is close to the length threshold (500 m) for medium and short tunnels. This situation appears to further confirm the aforementioned speculation.

3.3. Crashes and Travel Process

Because of the symmetry of the structures in TBTGs, tunnels repeatedly appear while driving through TBTGs, making drivers adapt to the multiple visual alternations of light and dark. To explore the possible changes in the visual adaptability and its influence on driving safety, a chi-squared test (χ2) was performed to test whether the differences in the crash rates for homogeneous zones between tunnels are significant. Table 4 summarizes the number and proportion of crashes in each zone of tunnels. The result shows that, at a 0.05 significance level, crashes occurred more often at Z1 and Z3 in the first passed tunnel than the second one, whereas the other zones and the whole section do not exhibit significant differences. Considering that visual dark adaptation is the biggest challenge faced by a driver in Z1 and Z3, our finding seems to reflect an improvement in drivers’ ability to cope with this challenge after the vehicle passes through the first tunnel. As a result, in the face of the latter dark tunnel entrance, drivers can cope with visual dark adaptation in a better manner, and therefore effectively avoid the occurrence of some accidents. This result is not only consistent with that of a study conducted in Singapore [24], but also provides crash-based evidence for the luminance reduction in the second tunnel entrance of the tunnel groups.

3.4. Crashes and Bridge–Tunnel Ratios

Figure 9 shows the distributions and increases in the bridge ratio, tunnel ratio, and bridge–tunnel ratio for the TBTGs, and the changes in accident rates with them are shown in Figure 10 and Figure 11, respectively. The results show that the crash rate increases and decreases with the increase of the bridge ratio and tunnel ratio, respectively. This is expected, because the general crash rate in TBTGs (0.40) is higher than the tunnel crash rate (0.3), but lower than the bridge crash rate (0.43), as found in Section 3.2.1. Additionally, the crash rates decrease with the increase of their total ratio, which is similar to that of the tunnel ratio, but significantly different from that of the bridge ratio. This is mainly attributed to the manner in which the bridge and tunnel ratios increase. As shown in Figure 9, the bridge ratio only increases from 11.12% to 32.56%, and mostly lied between 20% and 30%, whereas the tunnel ratio increased continuously from 9.05% to 78.78%. Therefore, when the total ratio of bridges and tunnels exceeds a high level, the proportion of tunnels will significantly exceed that of bridges, contributing to most of the increases in it, which determines the main impact of tunnels on the crash rate. Furthermore, the significant increase in the tunnel ratio is often caused by the presence of long and extra-long tunnels, whose crash rates are lower than those in medium and short tunnels, as shown in Figure 7. Under these conditions, the crash rate declines with the bridge–tunnel ratio, as mentioned previously. In conclusion, bridge and tunnel ratios have different effects on the crash rate in mountainous freeways, which complicates the effects of their total ratio on crashes (i.e., bridge and tunnel ratios do not simply increase or decrease the crash rate). Further analysis considering the types and composition ratio of bridges and tunnels is required to achieve reliable results.

4. Conclusions

Based on police-reported crash data, the zone distribution characteristics of crashes in TBTGs were investigated by dividing TBTGs using changes in the driving environment. Particularly, the difference in the influence of various environments on crashes in TBTGs was compared and evaluated. Zone-based analysis enabled exploiting the full capability of crashes for characterizing the adaptability of drivers to driving environments. A safety-critical distance metric was proposed to define TBTGs quantitatively by combining visual theory analysis and an actual crash test, and the reasonable ones for defining bridge–tunnel and tunnel–tunnel groups were, respectively, determined to be 150 and 500 m. Then, an eight-zone analytical method combining road types and lighting was developed for the crash analysis of TBTGs.
The results showed that the access zone exhibits the highest crash rate, followed by the parting zone. Solely because of the high crash rates in the access, connecting, and parting zones, ordinary sections exhibited the highest crash rate among the different types of road sections. The crash rate in tunnels was the lowest, and that in bridges took intermediate values. The crash rate in bridges decreased with the increase in length, whereas that in tunnels first increased and then decreased with the increase in length. The crash rate was the highest in medium tunnels because of the differences in the crash rate between zones in the tunnels. The crash rate in the transition zone was unexpectedly higher than that in the threshold zone, which is inconsistent with Scandinavian research results. This may be because of the inherent drawbacks of the Chinese tunnel lighting guidelines (JTG/T D70/2-01-2014). Furthermore, the first passed tunnel had a higher proportion of crashes in the access and transition zones than that in the second passed tunnel, which implies that the adaptability of drivers to dark environments was enhanced after the vehicle passed through the first tunnel. The crash rate was found to increase and decrease when the bridge ratio and tunnel ratio increased, respectively; contrarily, it decreased with increasing total ratio.
The crash research results based on the distance between tunnels and bridges, road types, and zones can not only help systematically clarify the occurrence law of crashes in TBTGs, but can also shed some light on the design and operation management implications of TBTGs to raise their traffic safety. First, ordinary road sections, particularly the tunnel access and parting zone, should be appropriately designed and prioritized for the application of safety improvement measures because of the highest crash rates among all types of zones. Second, the safety design for the combined road sections with a tunnel and a bridge should consider the types of structures, the distance between them, and the length ratio of the structures of the whole section to achieve the desired results. Third, the luminance in the transition zone of the tunnel entrance should be strictly installed according to the lighting adaptation curve (CIE, 2004). When the distance between tunnels is below 1000 m, the luminance of the second tunnel entrance could be reduced based on the light adaptation characteristics of the drivers in the connection zone. Perhaps a more applicable study would explore the optical coupling of tunnel groups with translucent structures to avoid the loss of visual adaptation to weakly illuminated environments and the consequent high demands of lighting levels [11].
Several limitations of this study should be noted. Because of the limited crash data sources, this study only analyzed crashes in TBTGs that belong to different basic sections in the same mountainous freeway. TBTGs are unique roads, integrating multiple driving environments on continuous geometrical alignments, where the occurrence of a crash is caused by the coupling effect of both factors [14]. However, this study did not consider the geometrical alignments nor external environmental factors, such as weather, season, or time of day. Future studies with more data sources should analyze the interactions between these factors to better reveal the causal mechanism underlying crashes in TBTGs.

Author Contributions

Conceptualization, Z.S. and S.L.; Data curation, J.T.; Funding acquisition, Z.S.; Investigation, J.T. and P.W.; Methodology, Z.S.; Resources, B.T.; Supervision, B.T.; Validation, S.L. and P.W.; Writing—original draft, Z.S.; Writing—review & editing, S.L. All authors have read and agreed to the published version of the manuscript.

Funding

Financial support for this research was provided by the National Key R&D Program of China (2018YFB1600200) and the Natural Science Foundation of Chongqing, China (cstc2019jcyj-bshX0099).

Institutional Review Board Statement

Not applicable.

Informed Consent Statement

Not applicable.

Data Availability Statement

The data used to support the findings of this study are included within the article.

Conflicts of Interest

The authors declare no conflict of interest.

References

  1. 2019 Statistics Bulletin about the Development of Transportation Industry of China; Ministry of Transport of the People’s Republic of China: Beijing, China, 2020.
  2. Chen, F.; Peng, H.R.; Ma, X.X.; Liang, J.Y.; Hao, W.; Pan, X.D. Examining the safety of trucks under crosswind at bridge-tunnel section: A driving simulator study. Tunn. Undergr. Space Technol. 2019, 92, 1–9. [Google Scholar] [CrossRef]
  3. Chen, P.Y.; Chen, F.; Zhang, L.; Ma, X.X.; Pan, X.D. Examining the influence of decorated sidewall in road tunnels using fMRI technology. Tunn. Undergr. Space Technol. 2020, 99, 1–6. [Google Scholar] [CrossRef]
  4. He, S.Y.; Liang, B.; Pan, G.B.; Wang, F.; Cui, L.L. Influence of dynamic highway tunnel lighting environment on driving safety based on eye movement parameters of the driver. Tunn. Undergr. Space Technol. 2017, 67, 52–60. [Google Scholar] [CrossRef]
  5. Human Factors and Road Tunnel Safety Regarding Users; PIARC: Paris, France, 2008.
  6. Cantisani, G.; D’Andrea, A.; Moretti, L. Natural lighting of road pre-tunnels: A methodology to assess the luminance on the pavement—Part I. Tunn. Undergr. Space Technol. 2018, 73, 37–47. [Google Scholar] [CrossRef]
  7. Cantisani, G.; D’Andrea, A.; Moretti, L. Natural lighting of road pre-tunnels: A methodology to assess the luminance on the pavement—Part II. Tunn. Undergr. Space Technol. 2018, 73, 170–178. [Google Scholar] [CrossRef]
  8. Moretti, L.; Cantisani, G.; Mascio, P.D. Management of road tunnels: Construction, maintenance and lighting costs. Tunn. Undergr. Space Technol. 2016, 51, 84–89. [Google Scholar] [CrossRef]
  9. Peña-García, A.; López, J.; Grindlay, A. Decrease of energy demands of lighting installations in road tunnels based in the forestation of portal surroundings with climbing plants. Tunn. Undergr. Space Technol. 2015, 46, 111–115. [Google Scholar] [CrossRef]
  10. Peña-García, A. The impact of lighting on drivers well-being and safety in very long underground roads: New challenges for new infrastructures. Tunn. Undergr. Space Technol. 2018, 80, 38–43. [Google Scholar] [CrossRef]
  11. Peña-García, A. Optical coupling of grouped tunnels to decrease the energy and materials consumption of their lighting installations. Tunn. Undergr. Space Technol. 2019, 9, 1–6. [Google Scholar] [CrossRef]
  12. Sun, Z.Y.; Liu, S.; Li, D.X.; Tang, B.; Fang, S. Crash analysis of mountainous freeways with high bridge and tunnel ratios using road scenario-based discretization. PLoS ONE 2020, 15, e0237408. [Google Scholar] [CrossRef]
  13. Wang, J.; Amjad, P.; Wang, Z.; Han, C. Crash analysis of Chinese freeway tunnel groups using a five-zone analytic approach. Tunn. Undergr. Space Technol. 2018, 82, 358–365. [Google Scholar] [CrossRef]
  14. Bassan, S. Overview of traffic safety aspects and design in road tunnels. IATSS Res. 2016, 40, 35–46. [Google Scholar] [CrossRef] [Green Version]
  15. Lemke, K. Road safety in tunnels. Transp. Res. Rec. 2000, 1940, 170–174. [Google Scholar] [CrossRef]
  16. Huang, H.L.; Peng, Y.Y.; Wang, J.; Luo, Q.Z.; Li, X. Interactive risk analysis on crash injury severity at a mountainous freeway with tunnel groups in China. Accid. Anal. Prev. 2018, 111, 56–62. [Google Scholar] [CrossRef] [PubMed]
  17. Ma, Z.L.; Shao, C.F.; Li, X. Analysis of influence factors on severity for traffic accidents of expressway tunnel. J. Beijing Jiaotong Univ. 2009, 33, 52–55. [Google Scholar]
  18. Ma, Z.L.; Chien, I.J.; Dong, C.J.; Hu, D.W.; Xu, T. Exploring factors affecting injury severity of crashes in freeway tunnels. Tunn. Undergr. Space Technol. 2016, 59, 100–104. [Google Scholar] [CrossRef]
  19. Hou, Q.Z.; Tarko, A.P.; Meng, X.H. Analyzing crash frequency in freeway tunnels: A correlated random parameters approach. Accid. Anal. Prev. 2018, 111, 94–100. [Google Scholar] [CrossRef] [PubMed]
  20. Caliendo, C.; De Guglielmo, M.L.; Guida, M. A crash-prediction model for road tunnels. Accid. Anal. Prev. 2013, 55, 107–115. [Google Scholar] [CrossRef]
  21. Duan, M.M.; Tang, B.M.; Liu, T.Z.; Hu, Y.X. Accident prediction model of freeway with high ratio of bridges and tunnels based on multivariate nonlinear regression. Highway Eng. 2018, 43, 122–126. [Google Scholar]
  22. Amundsen, F.H.; Ranes, G. Studies on traffic accidents in Norwegian road tunnels. Tunn. Undergr. Space Technol. 2000, 15, 3–11. [Google Scholar] [CrossRef]
  23. Ma, Z.L.; Shao, C.F.; Zhang, S.R. Characteristics of traffic accidents in Chinese freeway tunnels. Tunn. Undergr. Space Technol. 2009, 24, 350–355. [Google Scholar] [CrossRef]
  24. Yeung, J.S.; Wong, Y.D. Road traffic accidents in Singapore expressway tunnels. Tunn. Undergr. Space Technol. 2013, 38, 534–541. [Google Scholar] [CrossRef]
  25. Brandt, R.; Schubert, M.; Høj, N.P. On risk analysis of complex road-tunnel systems. In Proceedings of the 6th International Conference on Tunnel Safety and Ventilation, Graz, Austria, 23–25 April 2012; pp. 41–48. [Google Scholar]
  26. Lu, L.J.; Lu, J.; Xing, Y.Y.; Wang, C.; Pan, F.Q. Statistical analysis of traffic accidents in Shanghai River crossing tunnels and safety countermeasures. Discret. Dyn. Nat. Soc. 2014, 1–7. [Google Scholar] [CrossRef]
  27. Nussbaumer, C. Comparative Analysis of Safety in Tunnels; Young Researchers Seminar: Brno, Czech Republic, 2007; pp. 1–9. [Google Scholar]
  28. Guide for the Lighting of Road Tunnels and Underpasses (CIE 88-2004); Commission Internationale de L’éclairage: Vienna, Austria, 2004.
  29. Hu, J.B.; Wang, W.L.; Zhang, S.R. Safety Analysis of Car Drivers’ Fixation Characteristics on Freeways. J. Southwest Jiaotong Univ. 2012, 47, 299–305. [Google Scholar]
  30. Du, Z.G.; Huang, F.M.; Yan, X.P.; Pan, X.D. Light and dark adaption time based on pupil area variation at entrance and exit areas of highway tunnel. J. Highway Transp. Res. Dev. 2013, 30, 98–102. [Google Scholar] [CrossRef]
  31. Guidelines for Design of Lighting of Highway Tunnels (JTG/T D70/2-01-2014); Ministry of Transport of the People’s Republic of China: Beijing, China, 2014.
  32. Highway Engineering Technique Standard (JTG B01-2014); Ministry of Transport of the People’s Republic of China: Beijing, China, 2014.
  33. Wu, H.B.; Zhen, D.X.; Zhou, R.G. Safety evaluation techniques for tunnel-bridge linkage sections on freeways in mountainous areas. J. Highway Transp. Res. Dev. 2012, 29, 125–132. [Google Scholar]
  34. Hu, S.F. Traffic accident characteristics and mechanism analysis of mountain highway tunnel group. Highway 2016, 5, 134–138. [Google Scholar]
Figure 1. Typical zone division of tunnels and tunnel groups for crash analysis in previous studies [13,22,23,24].
Sustainability 13 02272 g001
Figure 2. Calculation diagram of the safety-critical distance between structures in TBTGs.
Sustainability 13 02272 g002
Figure 3. Zone division for freeway tunnel–bridge–tunnel groups.
Sustainability 13 02272 g003
Figure 4. Sketch and characteristics of structures in the selected road section.
Sustainability 13 02272 g004
Figure 5. Crash rates as a function of the distance between tunnels in tunnel–bridge and tunnel groups.
Sustainability 13 02272 g005
Figure 6. Crash rates as a function of the distance between tunnels and bridges in tunnel–bridge groups located between tunnels with different distances.
Sustainability 13 02272 g006
Figure 7. Crash rates as a function of the length group and type of tunnels and bridges in TBTGs.
Sustainability 13 02272 g007
Figure 8. Comparison of tunnel entrance lighting between CIE and Chinese guidelines.
Sustainability 13 02272 g008
Figure 9. Distribution and increase in the bridge and tunnel ratios for TBTGs.
Sustainability 13 02272 g009
Figure 10. Correlation between traffic crashes and tunnel and bridge ratios.
Sustainability 13 02272 g010
Figure 11. Correlation between traffic crashes and bridge–tunnel ratios.
Sustainability 13 02272 g011
Table 1. Crash rates (crash/million vehicles·km) in tunnels and tunnel groups in previous studies.
ResearchTunnelCrashAccess ZoneEntrance ZoneTransition ZoneInner ZoneExit ZoneParting ZoneTotal
SumTypeYearsSumType
Amundsen [22]587All
tunnels
1992–1996499Injury0.30.230.160.10.230.30.13
Ma et al. [23]8Freeway tunnels2003–2004134All0.560.530.580.450.530.560.5
Yeung 1
[24]
6Expressway tunnels2009–2011608All5235 251016
Wang et al. [13]6Tunnel groups2012–2016442All1.342.572.98 31.771.34 41.72
1 Different measurement units of the crash rate: crashes/km/year. 2 The value of the crash rate was calculated in the entrance zone and transition zone. 3 The crash rate was calculated in the connecting zone between tunnels. 4 The value of the crash rate was calculated in the exit zone and parting zone.
Table 2. Maximum safety-critical distance between structures.
TypeCharacteristicsMaximum Safety-Critical Distance (m)
Tunnel-BridgeBridge before tunnel650
Tunnel
before
bridge
Tunnel
type
Short400
Medium450
Long500
Extra-long550
Tunnel-TunnelThe first tunnel typeShort750
Medium800
Long850
Extra-long900
Table 3. Crash rates in each type of zone and road in TBTGs.
Road
Type
Length
(km)
AADT 1
(vehicles/day)
Travel 2
(mill vehicles·km/yr)
Number of
Crashes
Crashes Rates 3
(crashes/mill vehicles·km)
Zone 11.65 14,4998.73260.98
Zone 22.60 14,49913.76190.46
Zone 36.80 14,71336.52530.49
Zone 433.88 14,878183.971660.30
Zone 51.56 14,4998.26100.42
Zone 64.50 14,49923.81310.44
Zone 77.75 14,25640.34570.47
Zone 81.65 14,4998.73150.59
Entire road60.39 14,499324.123780.39
Tunnels44.84 14,818242.502480.34
Bridges8.58 13,60342.59610.48
Ordinary
sections
7.38 14,40638.78690.59
1 AADT: average daily traffic volume between 2014 and 2016. 2 Travel unit: million vehicles·km per year. 3 Crash rate unit: crashes per million vehicles·km.
Table 4. χ2 test results for the distribution of crashes in each zone between tunnels.
ZoneThe First
Passed Tunnel (proportion)
The Second Passed Tunnel (proportion)χ2p-Value
Zone 135 (0.69)16 (0.31)4.3020.045
Zone 214 (0.64)8 (0.36)0.5780.447
Zone 341 (0.67)20 (0.33)3.9670.046
Zone 4 161 (0.49)63 (0.51)3.7830.052
Zone 55 (0.42)7 (0.58)1.0240.312
Zone 615 (0.42)21 (0.58)3.3440.067
Inside tunnel121 (0.55)98 (0.45)0.1240.724
Outside tunnel50 (0.57)37 (0.43)
1 The number of crashes in longer tunnels is calculated by the length of shorter tunnels.
Publisher’s Note: MDPI stays neutral with regard to jurisdictional claims in published maps and institutional affiliations.

