Abstract
In the VIEPI project (Integrated evaluation of the exposure to indoor particulate matter) framework, we carried out a 1-year study of the concentration and chemical composition of particulate matter (PM) in a 5 story building in the Sapienza University of Rome (Italy). Each sampling had a duration of 1 month and was carried out indoors and outdoors in six classrooms. The chemical analyses were grouped to obtain information about the main PM sources. Micro-elements in their soluble and insoluble fractions were used to trace additional sources. Indoor PM composition was dominated by soil components and, to a lesser extent, by the organics, which substantially increased when people crowded the sites. The penetration of PM components was regulated by their chemical nature and by the dimensions of the particles in which they were contained. For the first time in crowded indoor environments, three different chemical assays aimed to determine PM redox properties complemented chemical composition measurements. These preliminary tests showed that substantially different redox properties characterised atmospheric particles in indoor and outdoor sites. The innovative characteristics of this study (time duration, number of considered environments) were essential to obtain relevant information about PM composition and sources in indoor academic environments and the occupants’ role.
1. Introduction
Atmospheric pollution in indoor environments poses a significant threat to human health because we spend much more time inside homes, schools, offices, and vehicles than in the open air [1,2]. For this reason, the exposure, (i.e., the product of pollutant concentration and time over which a person is in contact with that pollutant) is much higher indoors than outdoors for most of the people, particularly in urban areas. This is especially true for children, older people, and other vulnerable groups [3,4,5,6].
In indoor sites, air quality is generally a more complicated issue than in outdoor environments, as pollutants produced inside add to those that penetrate from outdoor by infiltrating through the doors, windows and cracks of the building. Accordingly, the concentration of indoor pollutants is determined not only by the parameters that regulate their indoor production but also from those determining their concentration outdoors (meteorology, source intensity, formation, transformation, and deposition mechanisms) and by the way they penetrate through the building shell [7].
Concerning particulate matter (PM), these difficulties are further complicated by the variety of chemical species that constitute this group of pollutants, each with its sources, and by the wide range of its size distribution. The size of atmospheric particles, which vary from a few nanometres to tens of micrometres, significantly influences how they penetrate from the external environment. An extensive scientific literature has addressed the link between particle size and infiltration factor, i.e., the equilibrium fraction of ambient particles that penetrate indoors and remains suspended [8,9,10]. The conclusions reached are not unequivocal, as the infiltration factors measured by different researchers vary in the range of 0.3–0.82 for PM2.5 and 0.17–0.52 for PM10 [9]. In general, the infiltration factor of PM2.5 is higher than that of PM10 because the gravitational setting is stronger for larger particles.
For all the above reasons, there are few scientific studies fully describing the chemical composition of indoor particulate matter and comprehensively studying its different sources (penetration from outside and inside production [5,11,12,13,14,15]. Among the practical difficulties related to the design of a complete chemical characterisation study, there is the need to carry out many side-by-side simultaneous samplings. This necessity contrasts with the annoyance caused by the presence of several sampling instruments, generally cumbersome and noisy. Consequently, most of the studies focused on particle number concentration [16,17,18], or mass concentration [19,20], or specific PM components [21,22,23].
University classrooms provide a particularly suitable environment for the study of indoor pollution. Here, many of the sources that characterise domestic environments and, mainly, those related to combustion processes, are absent (e.g., cooking activities, cigarette smoke, wood heating, candle burning, but also use of household appliances and personal hygiene products). These features simplify the problem of apportioning PM sources, as it has been shown that in residential environments the primary sources contributing to indoor air concentrations are related to combustion processes [24,25,26,27,28,29]. Moreover, crowded environments, such as university classrooms, offer the opportunity to study the effects of people’s presence on PM concentration and composition [30].
In this study, carried out within the VIEPI project (Integrated evaluation of the exposure to indoor particulate matter) [31], some university environments of different size were studied for a whole year. Indoor and outdoor samplings were carried out in parallel, placing a first series of samplers inside environments ranging from a small research laboratory to a vast lecture hall, and a second series of samplers immediately outside them. It has been chosen to carry out long-duration samplings (one month each) and to use very quiet instrumentation of very small size, operating at the flow rate of 0.5 l min−1.
This work aimed to determine the main chemical components of PM in different university environments, quantify the weight of the main sources, evaluate their seasonal variations, and study the infiltration dynamics and their link with the particle size. On some samples, we also determined, for the first time in crowded indoor environments, the oxidative potential, that is the capability of ambient particles to generate in-vivo reactive oxygen species, a possible metric for estimating PM effects on health [32,33]. We also measured reducing species, with the aim to provides new, additional information about PM components that might be able to counteract the oxidative properties of the aerosol. In addition to the high number of measured parameters and the long duration of the measurement period, which make the results more robust and reliable, the novelty of the study is in the choice of university classrooms (much more crowded than school classrooms) during the regular activity of the students, which allows a better comprehension of occupants’ role.
2. Materials and Methods
2.1. Sampling Procedure
The study was carried out at the Physics Department of the Sapienza University of Rome, Italy (coordinates: 41°54’06” N; 12°30’57” E). Six indoor sampling sites located in the same five-story building were considered: a Lecture Hall (LH, at the ground floor, 1150 m3), a computer room (CR, at the 2nd floor, 450 m3), three identical classrooms (A3 and A4 at the 2nd floor, A7 at the 4th floor, 570 m3), and a physics laboratory (SL, at the 4th floor, about 300 m3). The building is located inside the University campus, in Rome’s central area, at about 50 m from a high-traffic road. A limited number of cars are allowed to enter the campus area. A detailed description of the sampling site is reported in Pelliccioni et al. [31].
Each indoor site was equipped with very-low-volume samplers operating at the flow rate of 0.5 L min−1 (Smart Sampler, Fai Instruments, Fonte Nuova, Rome, I). These devices were specifically designed to perform long-time samplings (1–2 months) aimed to study the long-term variations and spatial variability of the concentration of PM and its components. Their performance, evaluated by Catrambone et al. [34], is satisfactory: the repeatability of the measurements is 2.0–5.5% for inorganic ions, 10–17% for polycyclic aromatic hydrocarbons (PAH), 5.2% for levoglucosan, 5.6–16% for elements, 8.2% for PM mass concentration.
In each indoor sampling site, we arranged three PM10 samplers, equipped with Teflon (PTFE membrane filters with ring, 37 mm, 2.0 μm pore size, Whatman, Maidstone, United Kingdom), Quartz (QM-A quartz filters, 37 mm, Whatman) and polycarbonate filters (Isopore membrane filters, Millipore, Burlington, MA, USA), respectively. With the only exception of A3, each sampling site was also equipped with identical samplers located outdoor, immediately out of the window, about 30 cm from the wall. Outdoor samplers were also set on the building terrace (T1) and another building’s terrace at the same height from the ground (T2), at about 200 m from T1. Additional very-low-volume samplers equipped with PM2.5 impactors, and Teflon filters were set at all outdoor sites and at A3 and A4.
We also ran 24-h measurements of PM10 concentration at the ground floor using a beta attenuation monitor (SWAM 5aDual Channel Monitor, FAI Instruments, Fonte Nuova, Rome, Italy). To obtain information about the mixing properties of the lower atmosphere, we ran natural radioactivity measurements on a 1-h basis, using an automated monitor determining the total beta activity of the short-lived Radon progeny (PBL Mixing Monitor, FAI Instruments, Fonte Nuova, Rome, Italy). Natural radioactivity due to Radon progeny increases when atmospheric stability increases and decreases during advection or when the atmospheric mixing is efficient. It can be successfully used for describing changes in the mixing properties of the boundary layer [35,36,37,38].
All samplings were carried out from 1 November 2017, to 3 October 3 2018.
2.2. Analytical Procedure
Samples collected on Teflon filters were weighted using a microbalance (ME5, Sartorius AG, Goettingen, Germany), after conditioning at 50% R.H. and 20 °C for 48 h. Then they were analysed for their elemental content (Si, Al, Fe, Na, K, Mg, Ca and minor elements) by energy-dispersion X-ray fluorescence (XRF) (XEPOS, Spectro Analytical Instruments, Kleve, Germany). After XRF analysis, which is non-destructive, the samples were extracted for 20 + 20 min under sonication in deionised water and filtered using cellulose nitrate filters (0.45 pore size). The solutions were analysed for their ionic content (chloride, nitrate, sulfate, sodium, potassium, ammonium, magnesium, calcium) by ion chromatography (IC) (ICS1000, Dionex Co., Sunnyvale, CA, USA). Then they were analysed for the soluble fraction of elements (As, Ba, Cd, Ce, Co, Cr, Cs, Cu, Fe, Li, Mn, Mo, Ni, Pb, Rb, Sb, Sn, Sr, Ti, U, Tl, V, Zn) by Inductively Coupled Plasma Optical Emission Spectrometry with mass detection (ICP-MS) (Brucker 820-MS, Billerica, MA, USA). The residual (insoluble) fraction on both the sampling membrane and the filtration membrane was subjected to microwave-assisted acid digestion using HNO3:H2O2 (2:1), filtered again at 0.45 µm, and analysed by ICP-MS (same elements as for the extracted fraction). Chemical fractionation based on elemental solubility provides insight into the chemical form in which the element is released; thus, it adds useful information for the identification of PM sources and the estimation of the elemental bio-accessibility. The overall procedure, which allows a complete characterisation of the inorganic fraction of PM on a single collection filter, is described in Canepari et al. [39] and Perrino et al. [40,41]. The overall procedure allows a complete sample-by-sample quality control of the results by inter-technique comparison, as described in Canepari et al. [42]. The error associated with the measurements carried out with his method is below 20% (10% for most of the components). An overall discussion of the error sources is also reported in Canepari et al. [42].
Quartz filters were analysed for elemental carbon (EC) and organic carbon (OC) by thermo-optical analysis (TOA) (OCEC Carbon Aerosol Analyser, Sunset Laboratory, Tigard, OR, USA) using the NIOSH-QUARTZ temperature protocol.
Polycarbonate filters were used to determine bioaerosol (not discussed in this paper) and the redox properties of PM, using three different acellular methods. Two methods determine proxies of the oxidative potential (OP) and are based on ascorbic acid (AA) [43] and 2′,7′-dichlorofluorescin (DCFH) [44]. The analytical procedures are extensively described elsewhere [45,46]. Briefly, to detect oxidative potential by ascorbic acid (OPAA), PM samples were extracted in water and added with phosphate buffer and ascorbic acid solution. The antioxidant depletion rate (nmol AA min−1 m−3) was acquired by UV-Vis absorption spectrophotometry (Varian Cary 50 UV-VIS Spectrometer) at 265 nm. To detect OPDCFH, the water-extracted solutions were added with horseradish peroxidase enzyme solution and 2′,7′-dichlorodihydrofluorescein diacetate solution, kept for 5 minutes at 37 °C, and analysed for DCFH using a fluorescence detector (Jasco FP-920) at 530 nm wavelength (427 nm excitation wavelength).
A third test, based on 2,2-diphenyl-l-picrylhydrazyl (DPPH) measures reducing species [47], was recently adapted to atmospheric PM by Frezzini et al. [48]. The water-extracts were added with DPPH solution in ethanol, kept at room temperature in the dark, and analysed by UV-Vis absorption spectrophotometry at 517 nm to determine DPPH radical scavenging.
3. Results and Discussion
3.1. Mass Concentration of PM10
3.1.1. Outdoor PM10
PM10 concentration during the twelve months of the study at the three outdoor sites located at a different height from the ground, and the two sites located on the terraces are reported in Figure 1 (1-month sampling time). In the same graph, we also show PM10 values obtained by averaging, for each month, the daily concentrations measured at the university campus, close to the building (at the ground floor) and at the site “Arenula”, belonging to the urban network of the Regional Environmental Protection Agency of the Lazio region (ARPA Lazio), located about 4.4 km from the university campus.
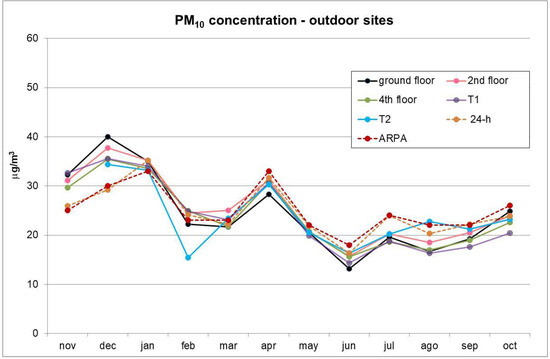
Figure 1.
Particulate matter (PM10) concentration at the five outdoor sites (1-month sampling time) and mean monthly concentration at the ground floor of the University campus and at the Regional Environmental Protection Agency (ARPA) site “Arenula” (1-day sampling time).
The data reported in Figure 1 show that the temporal patterns of the 1-month measurements generally follow those resulting from 24-h measurements at the Campus and in central Rome; values about 20% higher were recorded during the first two months. The results of the outdoor measurements carried out at different heights of the building were in very good agreement, and it was not possible to detect any vertical gradient.
PM10 concentration was in the range 13–40 μg/m3, with a seasonal pattern showing higher values during the cold months (December–January) and minimum concentrations during the summer. This is a typical pattern for urban areas in central Italy: the increase in concentration during the winter is mainly due to both the emission from domestic heating and the more frequent occurrence of atmospheric stability periods. The time pattern of natural radioactivity (Supplementary material, Figure S1) shows, for the first three months of the study, the succession of stability periods, characterised by high values of natural radioactivity during the night but also during the middle hours of the day, and advection periods, characterised by low values during the whole day. Atmospheric stability events became less frequent during the late winter. Then, from the beginning of the spring, natural radioactivity took the pattern that is characteristic of the warm season: a regular succession of high values during the night (stability) and low values during the day (convective mixing). At the beginning of the fall, the pattern began to take on again the typical characteristics of the cold season.
The increase in concentration recorded on April (Figure 1) was not due to variations in the mixing properties of the lower atmosphere, but it was most likely due to the many desert dust intrusions from the arid regions of North Africa towards Central and South Italy that took place on April 3–4, 11–20, and 24–30. Figure 2 (left side graph) shows the daily concentration of PM10 during April 2018, as measured at the University Campus and at the ARPA station “Arenula”, and of the coarse fraction of PM, calculated by the difference between PM10 and PM2.5 concentration at the same ARPA site. The data shows that most of the increase in PM10 concentration was due to the increase in the coarse fraction, as expected for desert dust intrusions. The right side panel of Figure 2 shows the dust surface concentration on Europe and North Africa on April 16th, when the desert dust transport reached its maximum intensity, as forecast by the Dust REgional Atmospheric Model (BSC-DREAM8b), operated by the Barcelona Supercomputing Center [49].
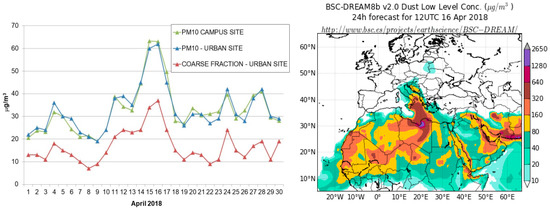
Figure 2.
Concentration of PM10 at the university campus and concentration of PM10 and the coarse PM fraction at the urban ARPA site “Arenula” during April 2018 (left side panel); dust transport from North-Africa on April 16th, as modelled by the Dust REgional Atmospheric Model (DREAM) (right side panel).
3.1.2. Indoor PM10
Indoor PM10 concentration recorded at the six sites is shown in Figure 3. The time patterns were in good agreement, with the only exception of the concentration recorded at SL in March, when some renovation works took place inside the laboratory. We can differentiate two groups of sites: the three identical classrooms (A3, A4, A7), where we recorded higher concentration, and the other three indoor sites. The difference between the two groups was high during classes months (November, December—considering Christmas holidays—, January, April, May, June, October), it decreased when the classrooms were used for individual studying or exams (February, March, July, September), and it became negligible during August, when the Department was closed. The three classrooms belonging to the first group were characterised by a high occupancy rate (ratio between the number of people and the volume of the environment), as these classes were often full. Instead, the Lecture Hall (LH) has twice the volume of A3, A4, and A7, but only a fraction of the 300 available seats were generally occupied. The Computer Room (CR) and the laboratory (SL) are smaller and were much less crowded than the classrooms. Moreover, during the cold period (May-October), air conditioners were switched on at SL (all day long) and, less frequently, at CR (only during classes). These observations are a further confirmation of the fundamental role played by the presence of people in determining PM concentration in indoor environments.
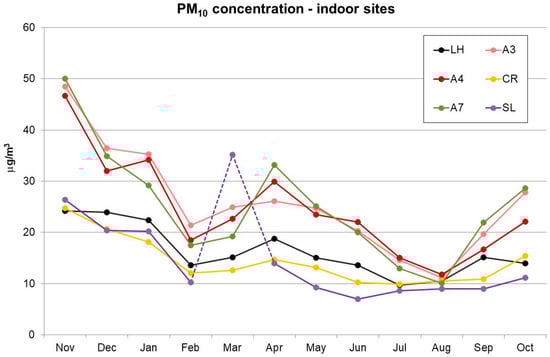
Figure 3.
PM10 concentration at the six indoor sites (1-month sampling time). On March there were renovation works at SL (dotted line).
3.2. Chemical Composition of PM10
The comparison between the gravimetric determination of PM10 and the mass reconstructed by adding the main PM10 chemical components is shown in Figure 4. To compute the reconstructed mass we considered elements as oxides [50,51], calculated carbonate as the sum of calcium ion multiplied by 1.5 and magnesium ion multiplied by 2.5 (stoichiometric ratios in CaCO3 and MgCO3), and multiplied organic carbon (OC) by a conversion factor to take into account non-C atoms in organic molecules (mainly H and O) to obtain organic matter [26,52]. The conversion factor was set as 1.8 and 1.3 for the outdoor and the indoor sites, respectively. The choice of these values is a critical issue, given the current poor knowledge of the speciation of organics in PM, particularly in indoor environments [53].
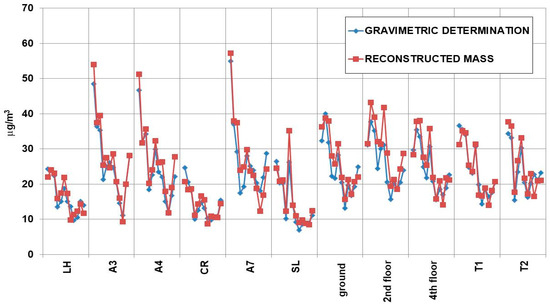
Figure 4.
Comparison between the gravimetric determination of PM10 and the mass reconstructed from the chemical analyses.
A satisfactory mass closure was obtained, with the reconstructed mass accounting for 105.5 ± 14.0% of the gravimetric mass in indoor sites and 107.1 ± 12.5% in outdoor sites. Pearson’s coefficients of the regressions between the two data sets were 0.934 and 0.854 for indoor and outdoor sites, respectively. These good results constitute a confirmation of the reliable analytical quality of the data.
The good results obtained at the mass closure allowed us to group the concentration of the main components to get a picture of the primary sources of PM: soil, sea, secondary production of inorganic species, traffic, and biosphere (organics). Details about the algorithms are reported in Farao et al. [54] and Perrino et al. [41]. Briefly, the contribution of soil was calculated by adding the concentration of elements (as metal oxides) that are generally associated with mineral dust: Al, Si, Fe, the insoluble fractions of K, Mg, and Ca (calculated as the difference between XRF and IC determinations), calcium and magnesium carbonate; sea-salt was estimated from the sum of Na+ and Cl−, multiplied by 1.176 to take into account minor sea-water components; secondary inorganics were calculated as the sum of non-sea-salt sulfate, nitrate and ammonium; the contribution of road traffic was estimated by adding elemental carbon to an equivalent amount of organic carbon; the remaining organic carbon, multiplied by 1.8 (outdoor) or 1.3 (indoor), constituted the organics.
Figure 5 reports the time pattern of the five primary PM sources at the indoor and outdoor sites during the study year. In general, the time patterns at the outdoor sites show a good agreement, while the indoor data need further discussion.
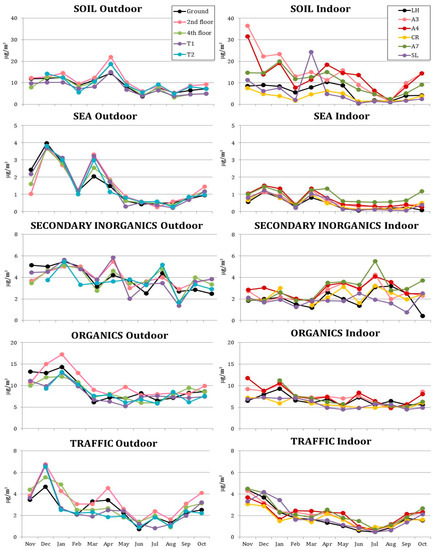
Figure 5.
Outdoor and indoor time patterns of the main sources of PM10.
An excellent agreement among the six indoor sites was observed only for the sea-salt, but the concentrations were much lower than those recorded outdoors. The particles released by this source, in fact, have no indoor contributions and have large dimensions and consequent low infiltration rate.
Soil, the other natural PM source, shows a significant increase in the indoor concentration at the three classrooms (A3, A4, A7), particularly during lesson months (November, December, January, April, May, June, October). At the other three indoor sites, soil components’ concentrations were generally lower than outdoors, particularly during the summer, when air conditioning was on (at CR and SL). For these PM components, indoor production due to the students’ presence and movements counterbalanced the low infiltration rate due to the large dimensions of these particles. As a result, indoor concentration was lower than outdoor when the rooms were empty. For the same reason, the high outdoor concentration recorded in April, due to desert dust intrusions, did not cause a significant increase in indoor PM. In August, when the building was closed, the concentration of soil components was lower than outdoors at all the indoor sites. These observations indicate that soil components were the main responsible for the pattern of PM10 concentration shown in Figure 3. It is worth noting that the increase in concentration recorded in April at SL, due to renovation works, was well explained by the increase in soil components.
Secondary inorganic species, which include ammonium nitrate and ammonium sulphate, showed a marked decrease in the transition from outdoor to indoor air during the winter months, a reduction that was not observed during the rest of the year. During the cold period, in fact, ammonium nitrate prevails over ammonium sulphate. When entering into heated indoor environments, this species’ equilibrium shifts towards its gaseous precursors (nitric acid and ammonia), which are subsequently lost by deposition and adsorption on indoor surfaces [8,55]. As a consequence, its concentration in the particle phase decreases dramatically. Instead, during the summer months, most of the secondary inorganics were constituted by ammonium sulphate, a species of photochemical formation, thermostable, and contained in small particles (good infiltration capacity). For these reasons, during the warm period, outdoor and indoor concentrations of secondary inorganics were very close.
The indoor concentration of organics shows a flat pattern. Small differences between the three classrooms and the other three sites can be detected, having the same shape discussed for soil components. These differences can be interpreted as the contribution of bioaerosol (skin flakes) released by the students. More investigations are needed to understand why low indoor-to-outdoor ratio was observed for the organics during the cold months.
The particles emitted by vehicle exhausts are characterised by small dimensions. For this reason, they easily infiltrate, and their indoor time pattern and concentration were similar to those recorded outdoors.
Table 1 reports, for each month and each PM10 macro-source, the average concentration, standard deviation, and indoor/outdoor ratio (I/O) at the six indoor and five outdoor sites. For each indoor site, I/O was calculated considering the outdoor site located on the same floor.

Table 1.
Indoor and outdoor concentration (mean ± standard deviation) and indoor/outdoor (I/O) ratio of PM10 macro-sources. Number of data is N = 6 and N = 5 for indoor and outdoor sites, respectively.
In the case of soil, I/O were variable: the highest values (0.9–1.8) were recorded during the winter when the occupancy rate was at its maximum, and the lowest one in August when the building was empty (0.3). Instead, for sea-salt, very low I/O (0.3–0.4) were recorded throughout the winter when the natural ventilation was scarce, and higher values occurred during the spring and summer (0.5–0.6) when windows and doors were frequently opened.
I/O for secondary inorganics was 0.4–0.5 during the cold months because of the indoor shift in the ammonium nitrate equilibrium towards the gas phase, while it approached one during the summer period when indoor concentrations were mainly due to ammonium sulphate infiltration. I/O of the organics was in the range of 0.6–0.9. These values depend on many factors, including the variation in the occupancy of the indoor sites, the seasonality and changes in the intensity of the outdoor sources, and the different chemico-physical nature of the particles emitted by each primary and/or secondary source. In the case of traffic emission, a homogeneous source of fine, combustion particles, I/O did not show a defined seasonal pattern and was in the range of 0.6–0.9.
3.3. Chemical Composition of PM2.5
Additional measurements of PM2.5 allowed us to obtain more information about the infiltration of smaller particles. Figure 6 shows the concentration of potassium (K) and ammonium (NH4+) in PM10 at the outdoor sites (left side of each graph) and the indoor sites (right side of each graph) during December and June (blue bars). Where available, concentrations in PM2.5 are also reported (red bars).
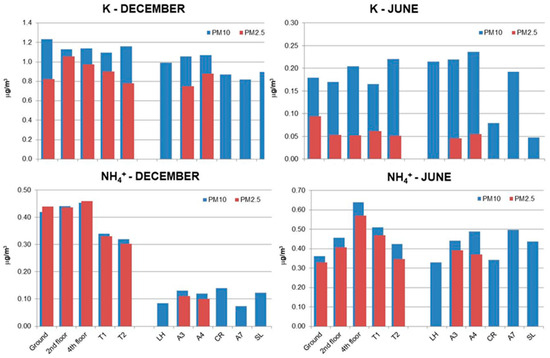
Figure 6.
Potassium and ammonium concentration in PM10 and PM2.5 during December and June.
In the case of potassium, the differences between December and June, and, within the same month, between PM10 and PM2.5 depended on the dominant emission source. K is released into the atmosphere by wood combustion for domestic heating and soil abrasion and re-suspension. The first source is active only during the cold season and emits particles in the fine size range; the second source prevails during the summer and releases particles in the coarse range. Accordingly, in December, the indoor concentration values of K were always close to those recorded outdoors (I/O > 0.8), and values in PM2.5 were a substantial fraction of those in PM10. In June, instead, the coarse fraction prevailed (K in PM2.5 << K in PM10) and indoor concentrations were generally higher than outdoor (natural ventilation by windows and doors, plus the effects due to the presence of the students), except for CR and SL, where air conditioning was switched on.
Instead, ammonium was only in the fine PM fraction, and its concentrations in PM2.5 and PM10 were very similar at all sites and during both periods. During December its indoor concentration dropped down because it was mainly in the form of ammonium nitrate. During June, due to the prevalence of ammonium sulphate, I/O was about 0.9. It is worth noting that the air conditioning had low efficiency in removing fine particles, and ammonium concentration at CR and SL were comparable to those determined at the other sites.
3.4. Micro-Elements
The insoluble fractions of Cr and Zn are not reported due to the low reliability of the analytical results (Cr is not efficiently recovered during the acid digestion, and Zn shows very high blank concentrations in membrane filters).
Table 2 details the yearly mean concentration of micro- and trace-elements in indoor and outdoor PM10; element concentrations in PM2.5 are reported in Supplementary Material (Table S1). In this study, the soluble and insoluble fractions of each element were considered independently, to increase the selectivity of elements as source tracers. It is well known, in fact, that each PM source is responsible for the emission of particular chemical species, each one having its solubility [39,56,57].
Table 2.
Indoor and outdoor concentration (yearly mean ± standard deviation) and I/O ratio of micro- and trace-elements in the soluble and insoluble fraction of PM10. The limits of detection (LOD) and the number of data > LOD (N) are reported for each element.
The data show that indoor and outdoor concentration levels were comparable for all the considered elements, with I/O ratio in the range of 0.5–1.3; values higher than one were generally found for crustal elements and were due to the re-suspension of deposited particles. As academic environments are characterised by the absence of combustion sources, these results suggest that the concentration of elements of anthropic origin in indoor environments was dominated by the infiltration from outdoors. Furthermore, I/O ratios of the soluble fractions were generally closer to unity than those of the insoluble fractions, indicating that soluble species infiltrate more efficiently.
This behaviour may be better understood considering the combination of the dimensional and chemical fractionation. As well known, the size of the particles released by each emission source reflects the emission process: combustion produces fine particles, while coarse particles are mainly released by abrasive-mechanical processes [58]. Figure 7 reports the dimensional and chemical fractionation of each element in this study’s indoor and outdoor environments, calculated from the two elemental fractions in PM10 and PM2.5, as described in Canepari et al. [39]. The results show that the soluble fraction of almost all the considered elements was contained in the fine fraction of PM, while scarcely soluble species dominated the coarse fraction. These findings agree with previous studies, which indicate combustion sources as the main responsible for the presence of soluble (and then bio-accessible) species containing elements that affect human health [39,59]. These smaller—and soluble—particles are more able to infiltrate in indoor environments. Furthermore, it can be observed that both the chemical and the size distribution were very similar in indoor and outdoor environments, confirming that the infiltration from outdoors was the primary process responsible for the indoor build-up of elements.
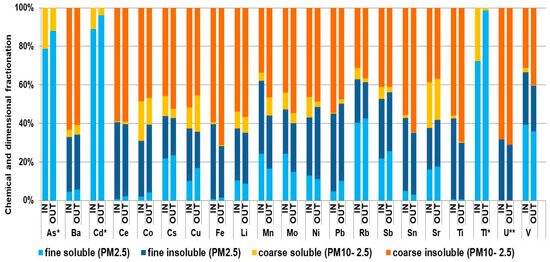
Figure 7.
Chemical and dimensional fractionation of micro- and trace-elements in outdoor and indoor samples (yearly mean values). * not detectable in the residual fraction; ** not detectable in the soluble fraction.
The behaviour of the particles released by specific sources may be characterised more accurately by considering some selective source tracers. Among the considered elements, the soluble fractions of Cs, Rb, Li, and Tl have been identified as reliable tracers of biomass burning, Cu, Sb, Mo, Ba, and Sn in their insoluble fraction have been used as tracers of brake abrasion coming from non-exhaust traffic contribution, Ni and V (soluble fraction) are known to be mainly released by coke and heavy oil combustion, Sr, Ce, U, and the insoluble fraction of Rb, Cs, Li have a crustal origin and may be used to trace the contribution of soil [57,58,59,60,61,62]. As the concentrations of all the elements associated with each source show the same time and space variability, these groups of elements are expected to be highly correlated. The high Pearson coefficients obtained by these groups of elements in the correlation matrices related to the whole database of this study (R2 > 0.7) confirm their reliability as source tracers (Supplementary Material, Tables S2 and S3 for the soluble and insoluble fractions, respectively).
In Figure 8, we report the yearly pattern of a selected tracer of the first three sources: the soluble fraction of Rb for biomass burning, the insoluble fraction of Cu for brake abrasion and the soluble fraction of V for heavy oil combustion. For each tracer, as already observed for PM10 and its macro-sources, the results obtained at different heights from the ground were in good agreement, and no vertical gradients were detected.
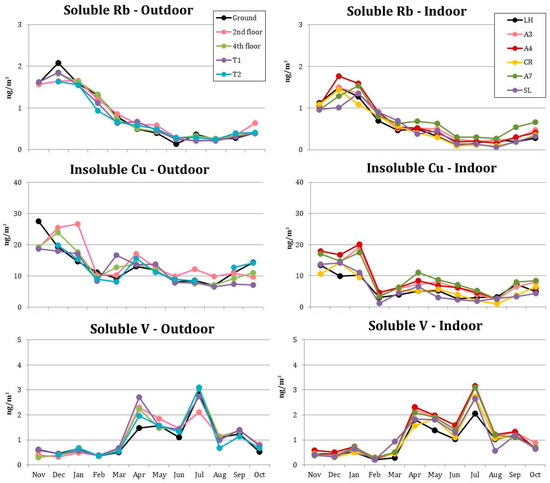
Figure 8.
Outdoor and indoor time patterns of the soluble fraction of Rb, the insoluble fraction of Cu and the soluble fraction of V.
The tracer of biomass burning showed, as expected, a marked seasonal trend, with higher values during the cold months. A very similar pattern was detected indoors. Indoor and outdoor concentrations were not so much different (I/O = 0.8) because combustion particles, in the fine size range, have a good ability to infiltrate inside the building.
In the case of brake abrasion, outdoor results were more variable, but without significant differences among the sampling sites. The time pattern of this tracer recalls that of the traffic source (Figure 5). Indoors, we detected a similar time pattern but lower concentrations, in agreement with the larger size of these particles (I/O = 0.6). As in the case of soil (Figure 5), the tracer concentration at A3, A4, and A7 was slightly higher than at the other sites, indicating that for particles from brake abrasion a small contribute due to the presence of the students may add to the infiltration from outdoors.
Particles from heavy oil combustion are typically in the finest size range of PM. In this case, indoor and outdoor time patterns were superimposable, and I/O was close to one, confirming, once again, that the infiltration inside the building depends on the particle dimensions. The seasonal trend shows higher values between April and July, probably due to a summer increase in ship traffic.
3.5. Redox Properties
To have a first insight about the redox properties of PM, which are a fundamental step in the comprehension of the mechanisms behind PM toxicity, some of the indoor and outdoor samples were analysed for their oxidative potential by ascorbic acid (OPAA) and 2′,7′-dichlorofluorescin (OPDCFH), two assays widely used as a proxy of the ability of PM to induce oxidative stress in the target organisms. Moreover, we also applied a test based on 2,2-diphenyl-l-picrylhydrazyl (RPDPPH), able to measure reducing species.
Figure 9 shows the results obtained by applying the three methods to the samples collected on polycarbonate filters at sites A7 and LH during November and April. In all cases, the pairs of measurements carried out at the two sites during the same periods gave similar results, in agreement with the small differences detected for most chemical components of PM among all outdoor sites and among all indoor sites (Figure 5).
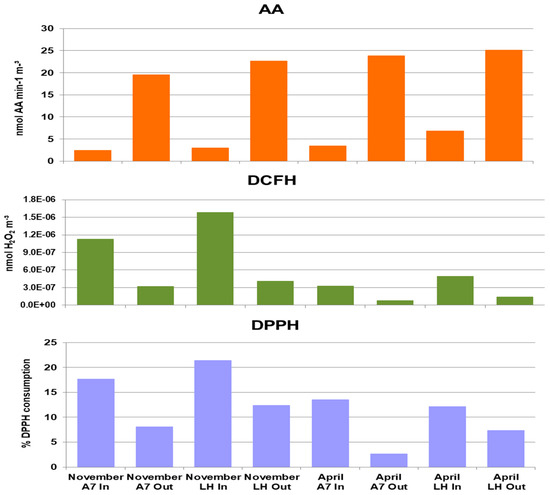
Figure 9.
Redox properties of PM10 determined by ascorbic acid (AA), 2′,7′-dichlorofluorescin (DCFH), and 2,2-diphenyl-l-picrylhydrazyl (DPPH) assays at A7 and Lecture Hall (LH) during November and April.
OPAA showed much higher values outdoors, with no significant differences between the two periods. In the literature, the results obtained by this assay are generally attributed to non-exhaust traffic emission, in particular to brake abrasion [32,45]. However, in these preliminary results, I/O ratios of OPAA appear lower than expected based on this only attribution. The same discrepancy was already reported by Szigeti et al. [63], although to a lesser extent.
OPDCFH showed the opposite pattern, with higher values recorded indoors and during the cold period. This assay determines reactive oxygen species (ROS) that were originally present on the particles; the results are generally related to combustion sources (in urban areas, road traffic and biomass burning for domestic heating). The higher values obtained for the outdoor samples collected during the cold period agree with this interpretation. However, given the absence of combustion sources inside the classrooms, the much higher OPDCFH values in indoor environments need additional explanation. It has been hypothesised that the atmospheric bioaerosol can be responsible for ROS generation and subsequent inflammation in the target body [64]. As indoor environments where many people group are characterised by high bioaerosol concentration [65], it is plausible that indoor OPDCFH increases as a consequence of the presence of people.
RPDPPH shows a similar pattern, with higher values indoors and during the cold period. Up to now, there is no information about the chemical species related to the outcomes of this assay. Our results, however, suggest that the presence of people can be responsible for the emission of some reducing species. The same species might also be responsible for the low values obtained in indoor environments at the OPAA test. It is worth noting, in fact, that the results of the RPDPPH assay can also be expressed in terms of equivalents of ascorbic acid (a natural antioxidant), highlighting a direct link between the two tests.
It should be underlined that the studies about the oxidative potential and, most of all, the reducing potential of PM are still in their development phase and that there is a gap of knowledge in identifying the chemical species responsible for the redox properties of the atmospheric aerosol. In addition, the ability of chemical proxies to simulate biological oxidation mechanisms are still a matter of debate [66]. Our preliminary results suggest a strong need to deepen the studies about PM’s redox properties in indoor environments where many people gather.
4. Conclusions
Long-duration samplings allowed us to obtain a representative and reliable picture of the concentration trend of PM and its chemical components both indoors and outdoors in the various sites of a University building during students’ regular activity.
We could evaluate the seasonal trend of the main PM sources, the infiltration capacity of the particles produced by each source and the relevance of additional indoor PM production. Indoors, most of PM increase was due to soil and organic species, with an essential role of the presence of people. Particles of different sizes showed a different infiltration degree: coarse particles infiltrated to a smaller extent, while finer particles showed higher infiltration capacity. In the first group, we find particles of natural origin, such as sea-salt components (I/O in the range 0.3–0.6), but also anthropic particles, such as those released by brake abrasion (I/O ratios about 0.6). In the case of soil particles, despite the low infiltration rate (I/O = 0.3 on August, when the building was empty), I/O values were up to 1.8 because of the re-suspension of deposited particles and the introduction of particles from outdoors on students’ boots. Fine particles produced by traffic, biomass burning, and heavy oil combustion showed I/O in the range 0.6–1.0.
Although preliminary, chemical assays of oxidative potential indicated that indoor particles show different redox characteristics from outdoors, suggesting an important role related to the presence of people. Since the exposure to atmospheric particles occurs mainly indoors, this aspect deserves further investigation in the future.
Although the air quality in the considered indoor environments would benefit from a better airtightness of the building, the contribution to PM of the organic species due to people’s presence would be not influenced by this measure. Instead, using air conditioners, convector heaters, and heat pumps, which are able to reduce particles concentration, mainly the coarse fraction, might be of great benefit to the occupants.
Supplementary Materials
The following are available online at https://www.mdpi.com/2071-1050/13/4/2263/s1, Figure S1: Time pattern of natural radioactivity during the study period, Table S1: Indoor and outdoor concentration (yearly mean ± standard deviation) and I/O ratio of micro- and trace-elements in the soluble and insoluble fraction of PM2.5, Table S2: Correlation matrix of elemental concentrations in indoor and outdoor samples: soluble fraction, Table S3: Correlation matrix of elemental concentrations in indoor and outdoor samples: insoluble fraction.
Author Contributions
Conceptualisation, S.C., C.P.; formal analysis: L.T., M.A.F., L.M., C.P.; funding acquisition: A.P., C.P.; investigation: L.T., M.C., M.G., S.P., E.R., T.S., M.A.F., L.M., M.R.; methodology: S.C., C.P.; project administration: A.P., C.P.; resources: L.T., M.C., E.R., T.S.; supervision: C.P.; validation: L.T., M.C.; visualisation: S.C., C.P.; writing - original draft: S.C., C.P.; writing—review and editing: S.C., C.P. All authors have read and agreed to the published version of the manuscript.
Funding
This research was funded by INAIL in the frame of its scientific research programs (2016–2018).
Institutional Review Board Statement
Not applicable.
Informed Consent Statement
Not applicable.
Data Availability Statement
Data is contained within the article or supplementary material.
Acknowledgments
The Authors are indebted to S. Dalla Torre for his invaluable help in the starting phase of this project and to S. De Santis, A. Gallo, and M. Segreto, for their administrative support.
Conflicts of Interest
The authors declare no conflict of interest.
References
- Cassee, F.R.; Héroux, M.-E.; Gerlofs-Nijland, M.E.; Kelly, F.J. Particulate matter beyond mass: Recent health evidence on the role of fractions, chemical constituents and sources of emission. Inhal. Toxicol. 2013, 25, 802–812. [Google Scholar] [CrossRef]
- Morawska, L.; Afshari, A.; Bae, G.N.; Buonanno, G.; Chao, C.Y.H.; Hänninen, O.; Hofmann, W.; Isaxon, C.; Jayaratne, E.R.; Pasanen, P.; et al. Indoor aerosols: From personal exposure to risk assessment. Indoor Air 2013, 23, 462–487. [Google Scholar] [CrossRef] [PubMed]
- Lai, H.; Kendall, M.; Ferrier, H.; Lindup, I.; Alm, S.; Hänninen, O.; Jantunen, M.; Mathys, P.; Colvile, R.; Ashmore, M.; et al. Personal exposures and microenvironment concentrations of PM2.5, VOC, NO2 and CO in Oxford, UK. Atmos. Environ. 2004, 38, 6399–6410. [Google Scholar] [CrossRef]
- Brasche, S.; Bischof, W. Daily time spent indoors in German homes e baseline data for the assessment of indoor exposure of German occupants. Int. J. Hyg. Environ. Health 2005, 208, 247–253. [Google Scholar] [CrossRef]
- Carrion-Matta, A.; Kang, C.-M.; Gaffin, J.M.; Hauptman, M.; Phipatanakul, W.; Koutrakis, P.; Gold, D.R. Classroom indoor PM2.5 sources and exposures in inner-city schools. Environ. Int. 2019, 131, 104968. [Google Scholar] [CrossRef] [PubMed]
- Bai, L.; He, Z.; Li, C.; Chen, Z. Investigation of yearly indoor/outdoor PM2.5 levels in the perspectives of health impacts and air pollution control: Case study in Changchun, in the northeast of China. Sustain. Cities Soc. 2020, 53, 101871. [Google Scholar] [CrossRef]
- Chithra, V.S.; Shiva Nagendra, S.M. A review of scientific evidence on indoor air of school building: Pollutants, sources, health effects and management. Asian J. Atmos. Environ. 2018, 12, 87–108. [Google Scholar] [CrossRef]
- Nazaroff, W.W. Indoor particle dynamics. Indoor Air 2004, 14, 175–183. [Google Scholar] [CrossRef]
- Chen, C.; Zhao, B. Review of relationship between indoor and outdoor particles: I/O ratio, infiltration factor and penetration factor. Atmos. Environ. 2011, 45, 275–288. [Google Scholar] [CrossRef]
- Martins, V.; Faria, T.; Diapouli, E.; Manousakas, M.I.; Eleftheriadis, K.; Viana, M.; Almeida, S.M. Relationship between indoor and outdoor size-fractionated particulate matter in urban microenvironments: Levels, chemical composition and sources. Environ. Res. 2020, 183, 109203. [Google Scholar] [CrossRef]
- Amato, F.; Rivas, I.; Viana, M.; Moreno, T.; Bouso, L.; Reche, C.; Alvarez-Pedrerol, M.; Alastuey, A.; Sunyer, J.; Querol, X. Sources of indoor and outdoor PM2.5 concentrations in primary schools. Sci. Total. Environ. 2014, 490, 757–765. [Google Scholar] [CrossRef]
- Tofful, L.; Perrino, C. Chemical composition of indoor and outdoor PM2.5 in three schools in the city of Rome. Atmosphere 2015, 6, 1422–1443. [Google Scholar] [CrossRef]
- Perrino, C.; Tofful, L.; Canepari, S. Chemical characterisation of indoor and outdoor fine particulate matter in an occupied apartment in Rome, Italy. Indoor Air 2016, 26, 558–570. [Google Scholar] [CrossRef]
- Saraga, D.; Maggos, T.; Sadoun, E.; Fthenou, E.; Hassan, H.; Tsiouri, V.; Karavoltsos, S.; Sakellari, A.; Vasilakos, C.; Kakosimos, K. Chemical characterisation of indoor and outdoor particulate matter (PM2.5, PM10) in Doha, Qatar. Aerosol Air Qual. Res. 2017, 17, 1156–1168. [Google Scholar] [CrossRef]
- Oliveira, M.; Slezakova, K.; Delerue-Matos, C.; Pereira, M.C.; Morais, S. Children environmental exposure to particulate matter and polycyclic aromatic hydrocarbons and biomonitoring in school environments: A review on indoor and outdoor exposure levels, major sources and health impacts. Environ. Int. 2019, 124, 180–204. [Google Scholar] [CrossRef] [PubMed]
- Mazaheri, M.; Reche, C.; Rivas, I.; Crilley, L.R.; ÁlvarezPedrerol, M.; Viana, M.; Tobias, A.; Alastuey, A.; Sunyer, J.; Querol, X.; et al. Variability in exposure to ambient ultrafine particles in urban schools: Comparative assessment between Australia and Spain. Environ. Int. 2016, 88, 142–149. [Google Scholar] [CrossRef]
- Fuoco, F.C.; Stabile, L.; Buonanno, G.; Trassiera, C.V.; Massimo, A.; Russi, A.; Mazaheri, M.; Morawska, L.; Andrade, A. Indoor air quality in naturally ventilated italian classrooms. Atmosphere 2015, 6, 1652–1675. [Google Scholar] [CrossRef]
- Isaxon, C.; Gudmundsson, A.; Nordin, E.; Lönnblad, L.; Dahl, A.; Wieslander, G.; Bohgard, M.; Wierzbicka, A. Contribution of indoor-generated particles to residential exposure. Atmos. Environ. 2015, 106, 458–466. [Google Scholar] [CrossRef]
- Meng, Q.Y.; Turpin, B.J.; Korn, L.; Weisel, C.P.; Morandi, M.; Colome, S.; Zhang, J.; Stock, T.; Spektor, D.; Winer, A.; et al. Influence of ambient (outdoor) sources on residential indoor and personal PM2.5 concentrations: Analyses of RIOPA data. J. Expo. Sci. Environ. Epidemiol. 2005, 15, 17–28. [Google Scholar] [CrossRef]
- Gaidajis, G.; Angelakoglou, K. Indoor air quality in university classrooms and relative environment in terms of mass concentrations of particulate matter. J. Environ. Sci. Health Part A 2009, 44, 1227–1232. [Google Scholar] [CrossRef] [PubMed]
- Liu, C.; Zhang, Y. Relations between indoor and outdoor PM2.5 and constituent concentrations. Front. Environ. Sci. Eng. 2018, 13, 5. [Google Scholar] [CrossRef]
- Viana, M.; Rivas, I.; Querol, X.; Alastuey, A.; Alvarez-Pedrerol, M.; Bouso, L.; Sioutas, C.; Sunyer, J. Partitioning of trace elements and metals between quasi-ultrafine, accumulation and coarse aerosols in indoor and outdoor air in schools. Atmos. Environ. 2015, 106, 392–401. [Google Scholar] [CrossRef]
- Sulaiman, F.R.; Bakri, N.I.F.; Nazmi, N.; Latif, M.T. Assessment of heavy metals in indoor dust of a university in a tropical environment. Environ. Forensics 2017, 18, 74–82. [Google Scholar] [CrossRef]
- Hussein, T.; Glytsos, T.; Ondráček, J.; Dohányosová, P.; Ždímal, V.; Hämeri, K.; Mihalis, L.; Smolík, J.; Kulmala, M. Particle size characterization and emission rates during indoor activities in a house. Atmos. Environ. 2006, 40, 4285–4307. [Google Scholar] [CrossRef]
- Wallace, L. Indoor sources of ultrafine and accumulation mode particles: Size distributions, size-resolved concentrations, and source strengths. Aerosol Sci. Technol. 2006, 40, 348–360. [Google Scholar] [CrossRef]
- Turpin, B.J.; Lim, H. Species contribution to PM2.5 mass concentration: Revisiting common assumptions for estimating organic mass. Aerosol Sci Technol. 2001, 35, 602–610. [Google Scholar] [CrossRef]
- Wierzbicka, A.; Bohgard, M.; Pagels, J.; Dahl, A.; Londahl, J.; Hussein, T.; Swietlicki, E.; Gudmundsson, A. Quantification of differences between occupancy and total monitoring periods for better assessment of exposure to particles in indoor environments. Atmos. Environ. 2015, 106, 419–428. [Google Scholar] [CrossRef]
- Ali, M.Y.; Hanafiah, M.M.; Khan, F.; Latif, M.T. Quantitative source apportionment and human toxicity of indoor trace metals at university buildings. Build. Environ. 2017, 121, 238–246. [Google Scholar] [CrossRef]
- Alves, C.A.; Vicente, E.D.; Evtyugina, M.; Vicente, A.M.; Nunes, T.; Lucarelli, F.; Calzolai, G.; Nava, S.; Calvo, A.I.; del Blanco Alegre, C.; et al. Indoor and outdoor air quality: A university cafeteria as a case study. Atmos. Pollut. Res. 2020, 11, 531–544. [Google Scholar] [CrossRef]
- Braniš, M.; Řezáčová, P.; Domasová, M. The effect of outdoor air and indoor human activity on mass concentrations of PM10, PM2.5, and PM1 in a classroom. Environ. Res. 2005, 99, 143–149. [Google Scholar] [CrossRef]
- Pelliccioni, A.; Monti, P.; Cattani, G.; Boccuni, F.; Cacciani, M.; Canepari, S.; Capone, P.; Catrambone, M.; Cusano, M.; D’Ovidio, M.C.; et al. Integrated evaluation of indoor particulate exposure: The VIEPI project. Sustainability 2020, 12, 9758. [Google Scholar] [CrossRef]
- Bates, J.T.; Fang, T.; Verma, V.; Zeng, L.; Weber, R.J.; Tolbert, P.E.; Abrams, J.Y.; Sarnat, S.E.; Klein, M.; Mulholland, J.A.; et al. Review of acellular assays of ambient particulate matter oxidative potential: Methods and relationships with composition, sources, and health effects. Environ. Sci. Technol. 2019, 53, 4003–4019. [Google Scholar] [CrossRef]
- Molina, C.; Toro, A.R.; Manzano, C.A.; Canepari, S.; Massimi, L.; Leiva-Guzmán, M.A. Airborne aerosols and human health: Leapfrogging from mass concentration to oxidative potential. Atmosphere 2020, 11, 917. [Google Scholar] [CrossRef]
- Catrambone, M.; Canepari, S.; Cerasa, M.; Sargolini, T.; Perrino, C. Performance Evaluation of a Very-low-volume Sampler for Atmospheric Particulate Matter. Aerosol Air Qual. Res. 2019, 19, 2160–2172. [Google Scholar] [CrossRef]
- Perrino, C.; Pietrodangelo, A.; Febo, A. An atmospheric stability index based on radon progeny measurements for the evaluation of primary urban pollution. Atmos. Environ. 2001, 35, 5235–5244. [Google Scholar] [CrossRef]
- Perrino, C.; Catrambone, M.; Pietrodangelo, A. Influence of atmospheric stability on the mass concentration and chemical composition of atmospheric particles: A case study in Rome, Italy. Environ. Int. 2008, 34, 621–628. [Google Scholar] [CrossRef]
- Wang, F.; Chambers, S.D.; Zhang, Z.; Williams, A.G.; Deng, X.; Zhang, H.; Lonati, G.; Crawford, J.; Griffiths, A.D.; Ianniello, A.; et al. Quantifying stability influences on air pollution in Lanzhou, China, using a radon-based “stability monitor”: Seasonality and extreme events. Atmos. Environ. 2016, 145, 376–391. [Google Scholar] [CrossRef]
- Vecchi, R.; Piziali, F.; Valli, G.; Favaron, M.; Bernardoni, V. Radon-based estimates of equivalent mixing layer heights: A long-term assessment. Atmos. Environ. 2019, 197, 150–158. [Google Scholar] [CrossRef]
- Canepari, S.; Astolfi, M.L.; Farao, C.; Maretto, M.; Frasca, D.; Marcoccia, M.; Perrino, C. Seasonal variations in the chemical composition of particulate matter: A case study in the Po Valley. Part II: Concentration and solubility of micro- and trace-elements. Environ. Sci. Pollut. Res. 2014, 21, 4010–4022. [Google Scholar] [CrossRef] [PubMed]
- Perrino, C.; Canepari, S.; Cardarelli, E.; Catrambone, M.; Sargolini, T. Inorganic constituents of urban air pollution in the Lazio region (Central Italy). Environ. Monit. Assess. 2007, 136, 69–86. [Google Scholar] [CrossRef]
- Perrino, C.; Catrambone, M.; Torre, S.D.; Rantica, E.; Sargolini, T.; Canepari, S. Seasonal variations in the chemical composition of particulate matter: A case study in the Po Valley. Part I: Macro-components and mass closure. Environ. Sci. Pollut. Res. 2013, 21, 3999–4009. [Google Scholar] [CrossRef]
- Canepari, S.; Perrino, C.; Astolfi, M.L.; Catrambone, M.; Perret, D. Determination of soluble ions and elements in ambient air suspended particulate matter: Inter-technique comparison of XRF, IC and ICP for sample-by-sample quality control. Talanta 2009, 77, 1821–1829. [Google Scholar] [CrossRef] [PubMed]
- Fang, T.; Verma, V.; Bates, J.T.; Abrams, J.; Klein, M.; Strickland, M.J.; Stefanie, E.; Sarnat, S.E.; Chang, H.H.; Mulholland, J.A.; et al. Oxidative potential of ambient water-soluble PM2.5 in the southeastern United States: Contrasts in sources and health associations between ascorbic acid (AA) and dithiothreitol (DTT) assays. Atmos. Chem. 2016, 16, 3865–3879. [Google Scholar] [CrossRef]
- Huang, W.; Zhang, Y.; Zhang, Y.; Fang, D.; Schauer, J.J. Optimisation of the measurement of particle-bound reactive oxygen species with 2’,7’-dichlorofluorescin (DCFH). Water Air Soil Pollut. 2016, 227, 164. [Google Scholar] [CrossRef]
- Simonetti, G.; Conte, E.; Perrino, C.; Canepari, S. Oxidative potential of size-segregated PM in an urban and an industrial area of Italy. Atmos. Environ. 2018, 187, 292–300. [Google Scholar] [CrossRef]
- Massimi, L.; Ristorini, M.; Simonetti, G.; Frezzini, M.A.; Astolfi, M.L.; Canepari, S. Spatial mapping and size distribution of oxidative potential of particulate matter released by spatially disaggregated sources. Environ. Pollut. 2020, 266, 115271. [Google Scholar] [CrossRef]
- Molyneux, P. The use of the stable free radical diphenylpicrylhydrazyl (DPPH) for estimating antioxidant activity. Songklanakarin J. Sci. Technol. 2004, 26, 211–219. [Google Scholar]
- Frezzini, M.A.; Castellani, F.; De Francesco, N.; Ristorini, M.; Canepari, S. Application of DPPH assay for assessment of particulate matter reducing properties. Atmosphere 2019, 10, 816. [Google Scholar] [CrossRef]
- BSC. Dust Regional Atmospheric Model (BSC-DREAM8b), operated by the Barcelona Supercomputing Center. Available online: http://www.bsc.es/ess/bsc-dust-daily-forecast/ (accessed on 6 August 2020).
- Chan, Y.; Simpson, R.; McTainsh, G.; Vowles, P.; Cohen, D.; Bailey, G. Characterisation of chemical species in PM2.5 and PM10 aerosols in Brisbane, Australia. Atmos. Environ. 1997, 31, 3773–3785. [Google Scholar] [CrossRef]
- Marcazzan, G.M.; Vaccaro, S.; Valli, G.; Vecchi, R. Characterisation of PM10 and PM2.5 particulate matter in the ambient air of Milan (Italy). Atmos. Environ. 2001, 35, 4639–4650. [Google Scholar] [CrossRef]
- Viidanoja, J.; Sillanpää, M.; Laakia, J.; Kerminen, V.M.; Hillamo, R.; Aarnio, P.; Koskentalo, T. Organic and black carbon in PM2.5 and PM10: 1 year of data from an urban site in Helsinki, Finland. Atmos. Environ. 2002, 36, 3183–3193. [Google Scholar] [CrossRef]
- Zhang, Q.; Jimenez, J.L.; Canagaratna, M.R.; Ulbrich, I.M.; Ng, N.L.; Worsnop, D.R.; Sun, Y. Understanding atmospheric organic aerosols via factor analysis of aerosol mass spectrometry: A review. Anal. Bioanal. Chem. 2011, 401, 3045–3067. [Google Scholar] [CrossRef]
- Farao, C.; Canepari, S.; Perrino, C.; Harrison, R.M. Sources of PM in an industrial area: Comparison between receptor model results and semiempirical calculations of source contributions. Aerosol Air Qual. Res. 2014, 14, 1558–1572. [Google Scholar] [CrossRef]
- Lunden, M.M.; Revzan, K.L.; Fischer, M.L.; Thatcher, T.L.; Littlejohn, D.; Hering, S.V.; Brown, N.J. The transformation of outdoor ammonium nitrate aerosols in the indoor environment. Atmos. Environ. 2003, 37, 5633–5644. [Google Scholar] [CrossRef]
- Sato, K.; Tamura, T.; Furuta, N. Partitioning between soluble and insoluble fractions of major and trace elements in size-classified airborne particulate matter collected in Tokyo. J. Environ. Monit. 2008, 10, 211–218. [Google Scholar] [CrossRef]
- Canepari, S.; Pietrodangelo, A.; Perrino, C.; Astolfi, M.L.; Marzo, M.L. Enhancement of source traceability of atmospheric PM by elemental chemical fractionation. Atmos. Environ. 2009, 43, 4754–4765. [Google Scholar] [CrossRef]
- Mazzei, F.; D’alessandro, A.; Lucarelli, F.; Nava, S.; Prati, P.; Valli, G.; Vecchi, R. Characterisation of particulate matter sources in an urban environment. Sci. Total Environ. 2008, 401, 81–89. [Google Scholar] [CrossRef] [PubMed]
- Canepari, S.; Perrino, C.; Olivieri, F.; Astolfi, M.L. Characterisation of the traffic sources of PM through size-segregated sampling, sequential leaching and ICP analysis. Atmos. Environ. 2008, 42, 8161–8175. [Google Scholar] [CrossRef]
- Sarti, E.; Pasti, L.; Rossi, M.; Ascanelli, M.; Pagnoni, A.; Trombini, M.; Remelli, M. The composition of PM 1 and PM 2.5 samples, metals and their water soluble fractions in the Bologna area (Italy). Atmos. Pollut. Res. 2015, 6, 708–718. [Google Scholar] [CrossRef]
- Perrino, C.; Tofful, L.; Dalla Torre, S.; Sargolini, T.; Canepari, S. Biomass burning contribution to PM10 concentration in Rome (Italy): Seasonal, daily and two-hourly variations. Chemosphere 2019, 222, 839–848. [Google Scholar] [CrossRef]
- Massimi, L.; Simonetti, G.; Buiarelli, F.; Di Filippo, P.; Pomata, D.; Riccardi, C.; Ristorini, M.; Astolfi, M.L.; Canepari, S. Spatial distribution of levoglucosan and alternative biomass burning tracers in atmospheric aerosols, in an urban and industrial hot-spot of Central Italy. Atmos. Res. 2020, 239, 104904. [Google Scholar] [CrossRef]
- Szigeti, T.; Dunster, C.; Cattaneo, A.; Cavallo, D.; Spinazzè, A.; Saraga, D.E.; Sakellaris, I.A.; de Kluizenaar, Y.; Cornelissen, E.J.M.; Hanninen, O.; et al. Oxidative potential and chemical composition of PM2. 5 in office buildings across Europe–The OFFICAIR study. Environ. Int. 2016, 92, 324–333. [Google Scholar] [CrossRef] [PubMed]
- Hirvonen, M.-R.; Ruotsalainen, M.; Nevalainen, A. Toxicity and inflammatory mechanisms of bioaerosols. Pathophysiology 1998, 5, 107. [Google Scholar] [CrossRef]
- Marcovecchio, F.; Perrino, C. Bioaerosol contribution to atmospheric particulate matter in indoor university environments. Sustainability 2021, 13, 1149. [Google Scholar] [CrossRef]
- Øvrevik, J. Oxidative potential versus biological effects: A review on the relevance of cell-free/abiotic assays as predictors of toxicity from airborne particulate matter. Int. J. Mol. Sci. 2019, 20, 4772. [Google Scholar] [CrossRef] [PubMed]


Publisher’s Note: MDPI stays neutral with regard to jurisdictional claims in published maps and institutional affiliations. |
© 2021 by the authors. Licensee MDPI, Basel, Switzerland. This article is an open access article distributed under the terms and conditions of the Creative Commons Attribution (CC BY) license (http://creativecommons.org/licenses/by/4.0/).