Abstract
Nitrogen (N) and Phosphorus (P) deficiency is a major yield limiting factor across the globe and their proper management plays a vital role in optimizing crop yield. This field experiment was conducted to assess the impact of soil and plant nitrogen N and P ratio on the growth and yield of wheat (Triticum aestivum L.) in alkaline calcareous soil. The study consisted of various levels of nitrogen (0, 40, 80, and 160 kg ha−1 as urea) and phosphorus (0, 30, 60, and 90 kg P2O5 ha−1 as diammonium phosphate), and was carried out in randomized complete block design (RCBD) with factorial arrangement having three replications. The result showed that the addition of 160 kg N ha−1 significantly improved biological yield (10,052 kg ha−1), grain weight (3120 kg ha−1), chlorophyll content at tillering stage soil plant analysis development (SPAD) value (35.38), N uptake in straw (33.42 kg ha−1), and K uptake in straw (192 kg ha−1) compared to other N levels. In case of P, 90 kg P2O5 ha−1 had resulted maximum biological yield (9852 kg ha−1), grain yield (3663 kg ha−1), chlorophyll content at tillering stage (SPAD value 34.36), P (6.68 mg kg−1) and K (171 kg ha−1) uptake in straw. The sole use of N and P have positively influenced the biological and grain yield but their interaction didn’t response to biological yield. The present study reveals that SPAD value (chlorophyll meter) is the better choice for determining plant N and P concentrations to estimate the yield potential.
1. Introduction
Among cereal crops, wheat is the most edible crop that Pakistan produces, with an average of 24–26 million tons of wheat a year from an 8.97 million hectare area [1], whereas Khyber Pukhtunkhwa produces 1.15 million tons of wheat from an 0.8 million hectare land area [1,2]. Therefore, instead of increasing production area, we have to increase wheat production per unit area [3]. For sustainable production, the fertilization of nitrogen and phosphorus must be applied in a specific ratio. In short, for future generations, balanced N:P should be considered as an investment towards soil fertility and an eco-friendly approach. The use of indispensable nutrients in a balanced amount is essential for improving production in Pakistan as continuous cropping of wide crop varieties has caused the removal of essential elements from the soil resulting in poor soil fertility [4].
Nitrogen and phosphorus are essential elements that play a vital role in the plant’s metabolic activities. Macronutrient nitrogen occupies an important place in the plant metabolism system where it is an essential component of a protein associated with all vital processes in plants [5]. For the enhancement of grain yield, N:P ratio, and water use efficiency, nitrogen fertilizers are the most common fertilizers [6,7]. Both N and P are the most deficient nutrients in the soil. Therefore, their simultaneous application is necessary for maximum crop production [8,9,10]. Nitrogen enhances the quality of grain as well as the production of crops [11,12,13]. As an integral part of chlorophyll, it increases the photosynthetic process. It plays an important role in the various physiological process of the plant as it gives a dark green color to leaves, and promotes the growth and development of the stem, leaves, and other vegetative parts. It also stimulates plant root growth [14,15,16]. Nitrogen deficiency causes the appearance of the red and purple spots on the leaves and reduces vegetative growth, root growth, fruit quality, and yield of crops [17,18]. Phosphorus also plays a vital role in storing energy and takes part in various chemical reactions that are taking place inside the cells and for the good performance of crops [19,20]. Phosphorus act as a labile pool in soil that goes through adsorption and desorption, both the processes limiting the P in soil for plant uptake. Adsorption reduces P’s phytoavailability and desorption can cause the loss of P from soil [21,22]. Some portion of the adsorbed P are available for plant uptake [23]. Plants take Phosphorus through root hair, root tip, and by external surfaces of roots. Mycorrhizal (fungi and plant root association) also help in the absorption of phosphorus. It is available for plant up taking in different inorganic form H2PO41−, HPO42−, and H3PO3 in solution, taken by diffusion plants [24,25].
Pakistani soils are located in arid and semiarid areas, but their calcareous nature inhibits P mobility that could be enhanced by altering soil conditions [26]. As most deficient and most required nutrients (N and P), their simultaneous application is crucial for optimum crop production [10]. For instance, P fertilization counterbalances the high level of nitrogen by speeding up plant growth, enhancing grain quality by decreasing the extra growth of the vegetative parts [27]. As Pakistan is underdeveloped, Pakistani farmers had poor awareness regarding the use of fertilizers that ultimately resulted in over or under dosing of N fertilization which accentuates P deficiency and, in turn, poor yield. Considering the importance of N-P, the present research was conducted to assess the suitable ratio of N-P for sustainable wheat production, in prevailing soil and climatic conditions. This study investigates the mutual influence of N-P on their respective use efficiency, plant uptake, and protein content development in wheat. It also looks at the effect of varying soil and plant N-P ratio on soil fertility, organic matter, and NPK uptake by wheat.
2. Materials and Methods
Nitrogen from urea at 0, 90, 120, and 150 and P from Di-ammonium phosphate (DAP) as 0, 30, 60, and 90 kg P2O5 ha−1 were applied to induce varying N:P ratio in soil on sowing time. The experiment was designed on two factorial randomized complete block design (RCBD) on 4 × 3 m2 plots at Agricultural Research Farm, the University of Agriculture, Peshawar, Pakistan during winter 2018–2019. The required quantity of nitrogen in formula of Urea were added in two split doses, half dose was applied on time of sowing while the remaining dose was added on the time of first irrigation. However, P in the form of DAP was applied at the time of sowing. Wheat seeds (cv Pir-Sabak 2013) at the rate of 120 kg ha−1, were sown with hand row drill, with 30 cm inter-row spacing. Pre-sowing tests for different soil properties like EC, pH, organic matter, along with total and mineral N in soil and ammonium bicarbonate-diethylene triamine pentaacetic acid (AB-DTPA) extractable P and K in soils were done (Table 1). After crop harvesting, soil and crop samples were studied for nitrogen, phosphorus, and potassium. Along with some chemical properties, total and mineral N and AB-DTPA ext P and K also were analyzed in the postharvest soil sample.

Table 1.
Treatment combination of nitrogen and phosphorus ratios applied in experiment.
2.1. 1000 Grain Weight
A Thousand-grain weight was determined by taking 1000 grains from all plots, weighted by an electronic balance.
2.2. Grains Spike−1
Ten plants were randomly selected from each plot and counted per spike of grain, and their means were calculated.
2.3. Grain Yield
After harvesting the wheat crop from selected central rows (from all plots), grain yield was calculated by weighing the grain after threshing. Using the formula, the recorded data was changed into grain yield kg ha−1 (Equation (1)) [28].
2.4. Biological Yield
Harvested plants from four selected central rows were sun-dried and weighed as a whole. After proper drying, the recorded data was put into the following formula to calculate yield per hectare (Equation (2)) [28].
2.5. Total Nitrogen
The total nitrogen in plant and soil samples was determined by using the Kjeldal procedure. A 0.2 g soil sample had 3 mL concentrated H2SO4 added in the presence of 1.10 g digestion mixture (K2SO4, Cu SO4, and Selenium) ratio 200:100:1. The mixture was heated until it became colorless. The mixture was transferred into a 100 mL volumetric flask and made up the volume to mark. Ten to 20 mL of digested sample was distilled into five-milliliter Boric Acid mix indicator. The volatilization of NH3 was facilitated by addition of NaOH (40%) 5 mL into soil or plant sample, which was collected in the form of NH4+ in acidified Boric Acid mixed indicator solution. Distillation was stopped after reaching the distillate up to 60 or 75 mL. The distillate was titrated against 0.005 N HCL until a light pinkish color appeared [29]. Total Nitrogen was calculated by using the following formula. (Equation (3)) [29].
2.6. AB-DTPA Extractable P
AB-DTPA solution was prepared by adding 1 N ammonium carbonate along with 0.005 M of DTPA in 2 L of distilled water with pH adjusted by addition of NH4OH or HCL. A 10 g soil sample was used in 125 mL Erlenmeyer flask and 20 mL volume of AB-DTPA solution was made. The samples were shaken at the rate of 180 cycle min−1 for 30 min and filtered through whatman filter paper no 42 after shaking. P takes 1 mL of the sample treated with 5 mL ascorbic acid in 25 mL round bottle flask [30]. The volume was adjusted by adding distilled water up to the mark. The sample was kept in the dark for 15 min to appear the color. The concentration of P was determined using a UV spectrophotometer by setting the wave length to 880 nm.
2.7. Chlorophyll Content
Randomly selected plants per plot were analyzed for chlorophyll content by using SPAD device [31].
2.8. Total P and K in Plant
Total P in plant was analyzed by mixing 1 g ground sample with concentrated HNO3. The sample was kept for 24 h and 4 or 5 mL perchloric acid was added the following day. Then the mixture was heated on a hot plate until the white and transparent liquid appeared [32]. After cooling the samples were added to distilled water to make a total of 50 mL volume [29]. Phosphorous concentration was determined in solution by using spectrophotometer, K by Flame photometer, and N by Kjeldal Method. P concentration was changed into plant uptake by the following formula (Equation (4)) [29].
2.9. Statistical Analysis
All the recorded parameters were subjected for the analysis of variance according to two factorial (N and P) randomized complete block designs with three replications for evaluating the significant effect of the treatment [33]. Statistics computer software was used for these analyses. Least significant difference (LSD) test was used for the difference among the treatments.
3. Results and Discussion
Soil analysis was done before the sowing of the wheat crop (Table 2). Soil analysis showed that the soil texture was silt loam with low organic matter, 0.73%, while alkaline calcareous in nature and strongly calcareous with lime content of 15.1%. Furthermore, the soil under study was low in nitrogen and phosphorus and such soils are considered to be responsive to fertilizer of these nutrients.
Table 2.
Physicochemical properties of experimental soil before sowing of wheat and treatment application.
3.1. 1000 Grain Weight
When averaging the values across P levels it was revealed that the highest grain weight of 37.36 was recorded in treatments receiving 40 kg N ha−1, which was more than the weight of grain observed at 80 and 160 kg N ha−1. Similarly, when values were averaged across the P levels, the mean higher grain weight was observed at 60 and 90 kg P2O5 ha−1 thus exhibiting prominent P role in enhancing the grain quality and size as compared to N application. The application of N at the rate of 40 kg and P2O5 at 60 kg ha−1 resulted in the highest grain weight, i.e., 40.18 g which was 14.34% higher than control, 8.2% than P alone and 28.82% than N alone at higher levels as mentioned in (Table 3) and by graph in (Figure 1a). These results revealed that a higher dose of N could reduce the grain size, whereas P played an important role in grain quality and should be applied to enhance the grain size and resultantly the grain yield. Siddique et al. [34] concluded that 1000 grain weight and yield of grain were found significantly improved by increasing NPK levels. Rusek et al. [35] and Fazlullah et al. [36] declared that the maximum grain yield of wheat with the application of mineral fertilizers such as N and P enhanced the weight of wheat grain.
Table 3.
Number of grain spike−1 and 1000 grain weight (g) of wheat as influenced by N and P application.
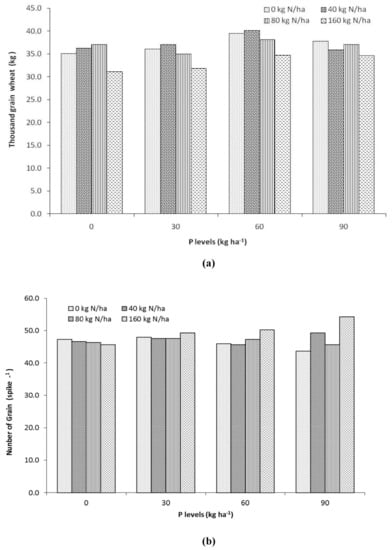
Figure 1.
(a) 1000 grain weight, (b) Grain spike−1 of wheat after threshing as influenced by various N and P levels and N-P ratios.
3.2. Number of Grain Spike−1
Data analysis of grain per spike was statistically found non-significant at p < 0.05; however, it showed variation with various levels of N and P, as shown in (Figure 1b). The non-significant variations could be attributed to variation in data among replications. The grains per spike varied from 43.6 to 54.3 g among the treatments. When values were averaged across the P levels, the maximum value of grain per spike (49.9 g) was found when N was applied at 160 kg ha−1, followed by 80 and 40 levels of N, which was 7.0% more than control. The increase in grain spike−1 may be due to maximum availability of N nutrient in the soil. Similarly, when averaging across N’s values, the highest value of grain per spike (48.2 g) was obtained in plots having 90 kg P2O5 ha−1 as shown in (Table 3). The maximum grain weight was obtained in treatments receiving 160 kg N and 90 kg P2O5 ha−1, which was 12.9% higher than control and 24.2% higher than treatment. The result of our findings is similar to Zaid et al. [37], who experimented with investigating the effect of various nitrogen levels on wheat growth and yield.
3.3. Grain Yield
Nitrogen and phosphorus application significantly improved the grain yield of wheat. Mean grain yield significantly influenced N levels up to 80 kg N ha−1 which was 15.9% higher than control when values were averaged across P levels. The increase in grain yield beyond 80 kg N ha−1 was statistically similar. Likewise, averaging the yield across the N levels saw a significant increase with P level up to maximum levels, i.e., 90 kg P2O5 ha−1. Regarding the application of 90 kg P2O5 ha−1, the yield produced, i.e., 3499 kg ha−1, was higher than treatments receiving no phosphorus, i.e., 1232 kg ha−1 (Table 4). As far as N and P effect on grain yield is concerned, (Figure 2a) showed the variation in grain yield from 1661 kg ha−1 in control to 3768 kg ha−1 in treatments that received 160 kg nitrogen and 90 kg P2O5 ha−1. At control P2O5, N application enhanced the yield from 1661 kg ha−1 to 2800 kg ha−1 when N was applied at 160 kg N ha−1. Still, when applied at 30 and 60, such increases were up to 3046 and 3379 kg per hectare after 80 kg N ha−1, respectively, and higher N levels proved ineffective. At 90 kg P2O5 ha−1, each increment of N increased the yield, and maximum yield was recorded at 160 kg N ha−1, i.e., 3768 kg ha−1 followed by 3505 kg ha−1. These results revealed that both N and P should be applied for maximum crop production and the proper level of P is even more important than N levels in our soils. The highest grain yield of 3768 kg ha−1 and 3505 kg ha−1 observed at 160 and 80 kg N with 90 kg P2O5 ha−1 can be considered the optimum levels for N and P with an N:P ratio of 4:1 and 2:1 in the present soils. The increase in yield with N could be attributed to N’s essential constituent chlorophyll content. Protein, amino acids, and enzymes played a significant role in photosynthate production, grain formation, and the grain yield of the crop. Several researchers (Haileselassie et al. [38], Sandana and Pinochet [39]), also stated highest biomass and grain yield with N application in different soil and climatic condition. These researchers reported a higher yield at 120 kg N ha−1 and considered the recommend level for N in wheat crops in our soils. However, in our study, a significantly higher value was observed at 80 kg N ha−1, which showed the huge gap between this level and maximum level of 160 kg N ha−1 used in our study. This supports the idea that it is important not to evaluate N’s suitable level but rather to see the N:P ratio’s effect on the yield and chlorophyll content. The level of 90 kg P2O5 ha−1 (equivalent to 40 kg P ha−1) at which the maximum grain yield was received in our study is a general recommended level for wheat production in the studied area.
Table 4.
Grain yield and Biological yield of wheat as influenced by N and P applied.
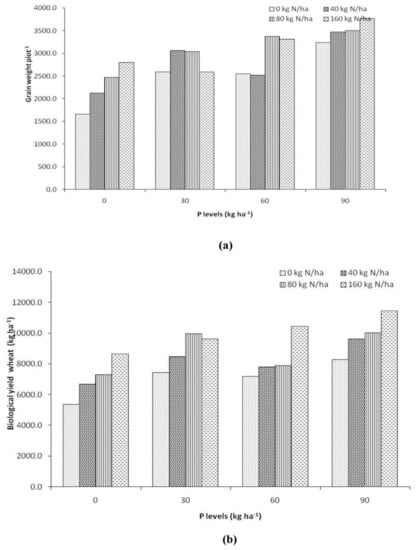
Figure 2.
(a) Grain and (b) Biological yield of wheat crop at maturity stage as influenced by various N and P levels and N-P ratio.
3.4. Biological Yield
Regarding increased N levels, up to 160 kg ha−1 increased the biological yield. This was followed by 80 and 40 kg N ha−1. Mean values of biological yield were 10,052 kg ha−1 in treatments receiving 160 kg nitrogen ha−1, which was 42% higher than 0 N, and values were averaged across the P levels. Similarly, when the yield was averaged across the N levels, it showed significant increases with the P level up to maximum levels, i.e., 90 kg P2O5 ha−1. Application of 90 kg P2O5 ha−1 produced a mean biological yield of 9852 kg ha−1 which was 40.72% higher than control treatment (Table 4). Both N and P showed a significant role with similar intensity in increasing the crops’ biological yields. Regarding the N and P ratios, no N resulted in P increasing the yield from 5369 to 8653 kg ha−1 with the highest 160 kg N ha−1, showing 61.1% increase over 0 kg N ha−1 and 0 kg P2O5 ha−1. However, with the increasing of P levels, i.e., 60 and 90 kg P ha−1, the increase was recorded to be 45.0% and 38.25% over 0 kg N ha−1 at given P levels and 94.74% and 113.24%, respectively of P2O5 ha−1 as clearly mentioned in (Figure 2b). The maximum biological yield of 11,449 kg ha−1 was recorded in treatment receiving 160 kg N and 90 kg P2O5 ha−1 with N:P ratio of 4:1. This was closely followed by 160 kg N and 60 kg P2O5 with the value of 10,456 kg ha−1 that received an N:P ratio of 6.2:1. The increase in N’s biological yield could be credited because N is an essential constituent of chlorophyll, protein, amino acids, and enzymes, and plays a significant role in cell formation and structure. On the other hand, P is an essential macronutrient that improves root growth and the up taking of nutrients from soil, which may also be the main reason for increasing biological yield. Our results are aligned with reports of Solangi et al. [40] and Firoz [41], who reported that increasing N and P levels improve biological yield.
3.5. Soil Nitrogen
The results regarding soil nitrogen were significantly (p < 0.01) affected by different levels of P (Table 5). The total soil N significantly increased with P levels up to 60 kg P2O5 ha−1 and decreased at 90 kg P2O5 ha−1, 25% more than control. By application of different levels of N, the total N in soil was non-significantly affected. Similarly, the result is reported by Chang et al. [42], who determined the effect of NP fertilization on crop yield in a field pea-spring wheat-potato rotation system with calcareous soil in semiarid environments. The interaction was also found to be non-significant.
Table 5.
N and P in soil after harvesting as influenced by N and P applied.
3.6. Soil Phosphorus
Statistically, the analysis revealed that soil P was significantly affected by N’s different levels (Table 5). The soil P was significantly increased with N levels. The maximum amount 2.37 kg ha−1 of soil P was recorded in the treatment having zero N-levels, while the minimum value 1.70 kg ha−1 was observed at 160 kg N ha−1 which was 39.41% more than control. the extractable soil P was not significantly affected with the application of phosphorus at different rates. The interactive effect of N and P was found statistically significant. The maximum amount 3.30 kg ha−1 of soil P was observed at the application of 160 kg N ha−1 and 60 kg P2O5 per hectare. The percent increase was 202% over the treatment receiving 80 kg ha−1 and 60 kg ha−1 N and P. Bednarek et al. [43] and Mathew et al. [44] also reported the effect of phosphorus levels on soil properties and plant tissues of two Nerica varieties.
3.7. Chlorophyll Content (SPAD)
The result regarding chlorophyll contents in leaves at the tillering stage was significantly (p < 0.01) affected by different N and P levels (Table 6). Averaging values across P levels, a significant increase in the chlorophyll content was observed with N levels up to 160 kg N ha−1, i.e., 35.38% higher than control was observed. Similarly, when the chlorophyll content was averaged across the N levels, it showed significant increases with P levels, i.e., 90 kg P2O5 ha−1, revealing that both N and P gave significant green color to leaves, which proves the synthesis of chlorophyll. According to (Figure 3), the addition of 90 kg P2O5 ha−1 produced SPAD 34.36, which was 32.63 higher than treatments receiving no phosphorus. The increase in chlorophyll content with N, could enhanced the protein, amino acid and enzymes, which play a significant role in photosynthetic production, grain formation, etc. While the interactive effect of nitrogen and phosphorus were found statistically non-significant, the application of N behaved differently at different P levels. The highest SPAD value of 36.4 was recorded at 90 kg P2O5 and 160 kg N ha−1 with an N:P ratio of 4:1. These results are affiliated with Joao et al. [45] and Biljana et al. [46], who stated the correlation between nitrogen and chlorophyll content in wheat.
Table 6.
Chlorophyll content in wheat leaves at tillering as influenced by N and P applied.
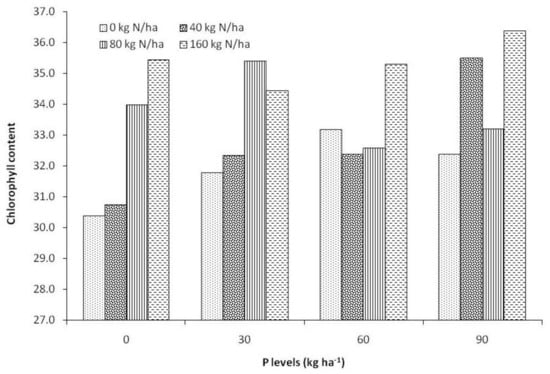
Figure 3.
Chlorophyll content in wheat leaves at the tillering stage as influenced by various N and P levels and N-P ratios.
3.8. N Uptake (Straw)
Statistical analysis revealed that nitrogen uptake was significantly (p < 0.01) affected by different levels of N application (Table 7). The mean maximum value of 33.42 kg ha−1 was recorded when N was applied at 160 kg ha−1, while the minimum value 16.37 kg ha−1 was found in 0 kg N ha−1 after averaging values across the P levels. A boost in N uptake was found after the application of N at the rate of 160 kg ha−1, i.e., 104% higher over 0 kg N ha−1, followed by 80 kg and 40 kg N ha−1 with values of 44% and 22% over 0 kg N ha−1. Application of P also resulted in increases of N uptake by wheat crop, and as such, the values were standardized across the N levels; the application of 90 kg P2O5 ha−1 induced increases of 13.74% over 0 kg P2O ha−1 followed by 30 kg P2O5 ha−1 with values of 23.92%. The maximum N uptake as 38.86% was recorded by applying 160 kg N ha−1 and 0 levels of P2O5v, which was 216% higher than control (0 kg N and 0 kg P2O5 ha−1). These results are similar to Belete et al. [46], who reported higher straw total N uptake from nitrogenous fertilizer. Research results are also supported by Belete et al. [47] and Thavaprakash et al. [48], who stated that N uptake is improved by the application of nitrogenous and phosphorous fertilizers.
Table 7.
Nitrogen, P, and K uptake in wheat straw as influenced by N and P applied.
3.9. P Uptake (Straw)
Statistical analysis revealed that phosphorus uptake is non-significantly (p < 0.01) affected by various levels of N application (Table 7). However, the mean maximum value of 6.03 mg kg−1 was observed at 160 kg N ha−1 application, while the minimum value 4.9 mg kg−1 was found in the treatment of zero N levels when values were averaged across P levels. Application of P significantly increased P uptake in wheat straw. After standardizing the values across the N application, the maximum P uptake 6.67 mg kg−1 was recorded at 90 kg ha−1 P2O5 application—64.7% higher than the treatment having no levels of N and P. The interactive effect of N and P was found to be non-significant. These results are supported by Meena et al. [49] who concluded the uptake of nutrients such as P by wheat was significantly enhanced with the application of mineral fertilizers at the right time.
3.10. K Uptake (Straw)
The result of K uptake was influenced at different N and P levels, as shown in (Table 7). K uptake in wheat straw was significantly (p < 0.05) increased with N levels, and a maximum mean value of 192 kg ha−1 was recorded at 160 kg N ha−1 application after averaging the values across P levels, while the lowest value, i.e., 110.83 kg ha−1, was recorded at 0 kg N ha−1 after averaging values across P levels. The increase in K uptake with the application of 160 kg ha−1 was 73.23% over 0 kg N ha−1 followed by 80 kg and 40 kg N ha−1 with values of 26.73% and 39.13% over 0 kg N ha−1 after standardizing values across the N levels, the application of N statistical analysis showed that different levels of nitrogen and phosphorous effect K uptake. Potassium uptake was significantly (p < 0.05) influenced when different N and P levels showed that straw K influenced with increasing N and P. Application of P also significantly increased K uptake in wheat straw when values were averaged across N levels. The highest value of K uptake, 171.25 kg ha−1 was found at 90 kg P2O5 ha−1, while minimum of 123.58 kg ha−1 was observed in the treatment receiving zero level of P2O5. This was 38.57% higher than control, followed by 60 kg and 30 kg P2O5 ha−1. Similar results were recorded by several researchers [50,51,52,53,54,55,56] in which it was stated that plant K uptake is increased with increasing N and P levels.
3.11. Correlation of Wheat Yield with N:P Ratio and SPAD Values
Figure 4a shows the correlation of grain yield and Figure 4b shows biomass with different N and P ratios at the tillering stage. These graphs show that grain yield and biomass were non-significantly (p < 0.05) influenced by different N and P ratios in leaf at tillering or maturity. There are irregular changes that occur in grain yield and biomass with increasing nitrogen and phosphorous ratio. Similarly, biomass was non-significantly (p < 0.05) correlated with percent nitrogen at tillering stage. The graph did not show any proper increase in biomass with percent nitrogen. The reason may be dilution or concentration effect. These observations suggest that the ratio and the ratio with the total amount of nutrients are important to predicting crop yield potential.
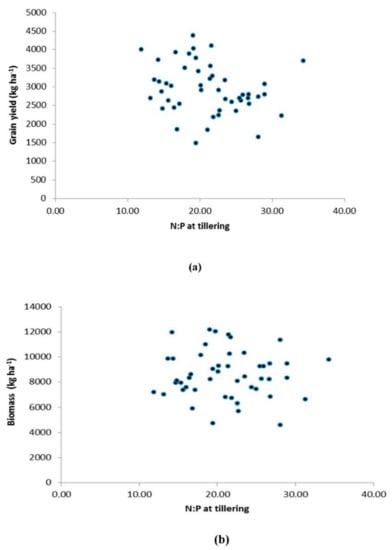
Figure 4.
Correlation of wheat yield, (a) biomass (b) with N-P ratio and SPAD values.
3.12. Correlation of Grain Yield with Chlorophyll (SPAD) Value
The above results indicated that grain yield is highly affected by chlorophyll content (Figure 5a). Grain yield is significantly (p < 0.05) increased by the improvement of chlorophyll content. The highest value of (3663 kg ha−1) grain yield was observed on chlorophyll value 37, and the lowest value of (2267 kg ha−1) grain yield was observed at 27. The percent increase was 37% for 37 values of chlorophyll, followed by 35, 31, and 29 over the 27 value of chlorophyll. The increase of grain yield may be due to more photosynthesis through which higher grain yield is obtained. Results regarding the biomass; it was significantly (p < 0.05) influenced by increasing chlorophyll value (Figure 5b). The maximum value of (10,052 kg ha−1) of biomass was recorded on the 38 value of chlorophyll while a significantly minimum value (7001 kg ha−1) was observed on 29 value of chlorophyll. The % increase was found to be 44% for 38 value of chlorophyll over 29 value of chlorophyll. N uptake in wheat straw was significantly (p < 0.05) enhanced by chlorophyll (Figure 5c). The maximum (26.4 kg ha−1) N uptake increased by 62 over 39 value of chlorophyll while the minimum N uptake 16.26 kg ha−1 was found at 29 value of chlorophyll. The straw N is significantly (p < 0.05) influenced by chlorophyll content (Figure 5d). The maximum percentage 0.49% of straw N was observed on 38 value of chlorophyll, while the minimum 0.35% straw N was recorded on 25 value of chlorophyll. The percent increase was recorded 40% for 38 values of chlorophyll over 25 value of chlorophyll. As N is an integral component of chlorophyll, N percentage is directly increased in wheat straw by improving chlorophyll content.
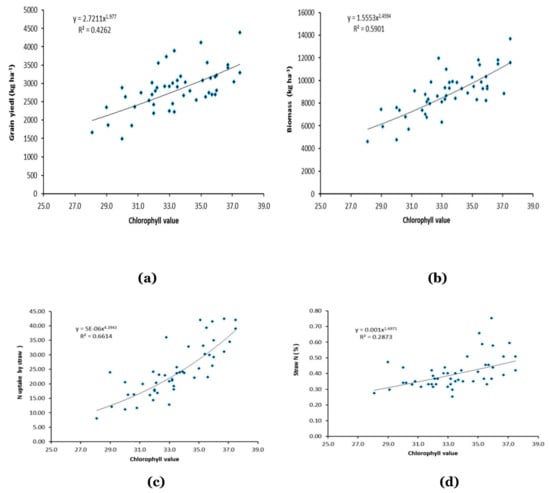
Figure 5.
Correlation of (a) grain yield, (b) Biomass, (c) N uptake in starw and (d) concentration of N in straw with Chlorophyll (SPAD) value.
4. Conclusions
Plant growth, biomass, and wheat grain yield significantly improved with N and P application, however, the increase in P application was more than by N in the present study. Chlorophyll, N, and P concentrations in plant leaf and straw significantly increased with N and P application in the given calcareous alkaline soil with the climatic conditions. Similarly, the total N, P, and K uptake by the plant also improved with the application of nitrogen and phosphorus fertilizers. The N:P widened (increased) with N and narrowed with P in both plant leaf at tillering and postharvest stages, however, it did not show significant correlation with chlorophyll, plant growth, and yield in this study. On the other hand, SPAD values (chlorophyll value) significantly correlated with leaf N, plant growth, grain, and biological yield revealing its significance in the present study.
Author Contributions
Conceptualization, M.M., I.A.M.; Data curation, M.M., D.M., S.K., S.A., M.A. (Manzoor Ahmad), M.A. (Muhammad Adnan 2), F.K.; Investigation, M.M., M.S., D.M., A.Z., S.A., H.I., M.A. (Manzoor Ahmad); Formal analysis, M.S., S.K., E.S.D., A.Z., H.S.; Writing—Original draft, M.S.; Methodology, D.M., M.A. (Muhammad Adnan 1), S.F.; Funding acquisition, I.A.M., E.S.D., A.E.S., H.B.; Supervision, M.A. (Muhammad Adnan 1); Writing—Review and editing, S.F., H.B.; Project administration, A.E.S.; Software, B.K., H.I. All authors have read and agreed to the published version of the manuscript.
Funding
The current work was funded by Taif University Researchers Supporting Project number (TURSP-2020/85), Taif University, Taif, Saudi Arabia.
Institutional Review Board Statement
Not applicable.
Informed Consent Statement
Not applicable.
Acknowledgments
The authors extend their appreciation to Taif University for funding current work by Taif University Researchers Supporting Project number (TURSP-2020/85), Taif University, Taif, Saudi Arabia.
Conflicts of Interest
The authors declare no conflict of interest.
References
- Prikhodko, D.; Zrilyi, O. Review of the Wheat Sector and Grain Storage Issues; Food and Agriculture Organization of the United Nations (FAO): Rome, Italy, 2013. [Google Scholar]
- Abid, M.; Ali, S.; Qi, L.K.; Zahoor, R.; Tian, Z.; Jiang, D.; Snider, J.L.; Dai, T. Physiological and bio-chemical changes during drought and recovery periods at tillering and jointing stages in wheat (Triticum aestivum L.). Sci. Rep. 2018, 8, 4615. [Google Scholar] [CrossRef] [PubMed]
- Tahir, M.; Ali, M.A.; Iqbal, S.; Yamin, M. Evaluation of the effect of use of N.P fertilizer in different ratios on the yield of Wheat (Triticum aestvum L.) crop. Pak. J. Life. Soc. Sci. 2004, 2, 145–147. [Google Scholar]
- Sadiq, M. Toxic Metal Chemistry in Marine Environments; Marcel Dekker: New York, NY, USA, 1992. [Google Scholar]
- Stewart, W.M.; Dibb, D.W.; Johnston, A.E.; Smyth, T.J. The Contribution of Commercial Fertilizer Nutrients to Food Production. Agron. J. 2005, 97, 1–6. [Google Scholar] [CrossRef]
- Sadras, V.O. The N: P stoichiometry -of cereal, grain legume and oilseed crops. Field Crop. Res. 2006, 95, 13–29. [Google Scholar] [CrossRef]
- Fan, T.; Stewart, B.; Yong, W.; Junjie, L.; Guangye, Z. Long-term fertilization effects on grain yield, water-use efficiency and soil fertility in the dryland of Loess Plateau in China. Agric. Ecosyst. Environ. 2005, 106, 313–329. [Google Scholar] [CrossRef]
- Güsewell, S. N:P ratios in terrestrial plants: Variation and functional significance. New Phytol. 2004, 164, 243–266. [Google Scholar] [CrossRef]
- Cernusak, L.A.; Winter, K.; Turner, B.L. Leaf nitrogen to phosphorus ratios of tropical trees: Experimental assessment of physiological and environmental controls. New Phytol. 2010, 185, 770–779. [Google Scholar] [CrossRef]
- Begum, M.A.; Islam, A.; Ahmed, Q.M.; Islam, A.; Rahman, M. Effect of nitrogen and phosphorus on the growth and yield performance of soybean. Res. Agric. Livest. Fish. 2015, 2, 35–42. [Google Scholar] [CrossRef]
- Ullah, M.A.; Anwar, M.; Rana, A.S. Effect of nitrogen fertilization and harvesting intervals on the yield and forage quality of elephant grass (Pennisetum purpureum L.) under mesic climate of Pothowar plateau. Pak. J. Agri. Sci. 2010, 47, 231–234. [Google Scholar]
- Ahmad, S.; Ahmad, R.; Ashraf, M.Y.; Ashraf, M.; Waraich, E.A. Sunflower (Helianthus annuus L.) response to drought stress at germination and seedling growth stages. Pak. J. Bot. 2009, 41, 647–654. [Google Scholar]
- Rafiq, M.A.; Ali, A.; Malik, M.A.; Hussain, M. Effect of fertilizer levels and plant densities on yield and protein contents of autumn planted maize. Pak. J. Agri. Sci. 2010, 47, 201–208. [Google Scholar]
- Adnan, M.; Fahad, S.; Zamin, M.; Shah, S.; Mian, I.A.; Danish, S.; Zafar-Ul-Hye, M.; Battaglia, M.L.; Naz, R.M.M.; Saeed, B.; et al. Coupling phosphate-solubilizing bacteria with phosphorus supplements im-prove maize phosphorus acquisition and growth under lime induced salinity stress. Plants 2020, 9, 900. [Google Scholar] [CrossRef]
- Bloom, A.J. The increasing importance of distinguishing among plant nitrogen sources. Curr. Opin. Plant Biol. 2015, 25, 10–16. [Google Scholar] [CrossRef] [PubMed]
- Adnan, M.; Shah, Z.; Arif, M.; Khan, M.J.; Mian, I.A.; Alam, M.; Basir, A.; Ullah, H.; Rahman, I.-U.; Saleem, N.; et al. Impact of rhizobial inoculum and inorganic fertilizers on nutrients (NPK) availability and uptake in wheat crop. Can. J. Soil Sci. 2016, 96, 169–176. [Google Scholar] [CrossRef]
- King, B.J.; Siddiqi, M.Y.; Glass, A.D.M. Studies of the uptake of nitrate in barley: V. Estimation of root cytoplasmatic nitrate concentration using reductase-activity—Implications for nitrate influx. Plant Physio. 1992, 99, 1582–1589. [Google Scholar] [CrossRef]
- Magistad, O.C.; Reitemeier, R.F.; Wilcox, L.V. Determination of soluble salts in soils. Soil Sci. 1945, 59, 65–76. [Google Scholar] [CrossRef]
- Ryan, J.; Sommer, R.; Ibrikci, H. Fertilizer best management practices: A perspective from the dry-land West Asia–North Africa region. J. Agron. Crop Sci. 2012, 198, 57–67. [Google Scholar] [CrossRef]
- Wahid, F.; Sharif, M.; Fahad, S.; Adnan, M.; Khan, I.A.; Aksoy, E.; Ali, A.; Sultan, T.; Alam, M.; Saeed, M.; et al. Arbuscular mycorrhizal fungi improve the growth and phosphorus uptake of mung bean plants fertilized with composted rock phosphate fed dung in alkaline soil environment. J. Plant Nutr. 2019, 42, 1760–1769. [Google Scholar] [CrossRef]
- Wang, L.; Liang, T. Effects of exogenous rare earth elements on phosphorus adsorption and desorption in different types of soils. Chemosphere 2014, 103, 148–155. [Google Scholar] [CrossRef] [PubMed]
- Lair, G.J.; Zehetner, F.; Khan, Z.H.; Gerzabek, M.H. Phosphorus sorption-desorption in alluvial soils of a young weathering sequence at the Danube River. Geoderma 2009, 149, 39–44. [Google Scholar] [CrossRef]
- Gérard, F. Clay minerals, iron/aluminum oxides, and their contribution to phosphate sorption in soils—A myth revisited. Geoderma 2016, 262, 213–226. [Google Scholar] [CrossRef]
- Hinsinger, P. Bioavailability of soil inorganic P in the rhizosphere as affected by root-induced chemical changes: A review. Plant Soil. 2001, 237, 173–195. [Google Scholar] [CrossRef]
- Adnan, M.; Shah, Z.; Fahad, S.; Arif, M.; Alam, M.; Khan, I.A.; Mian, I.A.; Basir, A.; Ullah, H.; Arshad, M.; et al. Phosphate-Solubilizing Bacteria Nullify the Antagonistic Effect of Soil Calcification on Bioavailability of Phosphorus in Alkaline Soils. Sci. Rep. 2017, 7, 1–13. [Google Scholar] [CrossRef]
- Cordell, D.; Drangert, J.-O.; White, S. The story of phosphorus: Global food security and food for thought. Glob. Environ. Chang. 2009, 19, 292–305. [Google Scholar] [CrossRef]
- Ahmad, I.; Jamil, M.; Zia, M.H.; John, A. Nitrogen management for wheat production through integrated plant nutrition system. Pak. J. Soil Sci. 1999, 17, 59–64. [Google Scholar]
- Edwards, J. Estimating Wheat Grain Yield Potential; Oklahoma State University: Stillwater, OK, USA, 2009. [Google Scholar]
- Bremner, J.M. Nitrogen-total. In Methods of Soil Analysis, Part III. Chemical Methods; SSSA Book Series No. 5; Sparks, D.L., Page, A.L., Helmke, P.A., Loeppert, R.H., Eds.; American Society of Agronomy: Madison, WI, USA, 1996; pp. 1085–1121. [Google Scholar]
- Soltanpour, P.N.; Schwab, A.P. A new soil test for simultaneous extraction of macro- and micro-nutrients in alkaline soils. Commun. Soil Sci. Plant Anal. 1977, 8, 195–207. [Google Scholar] [CrossRef]
- Zhu, J.-X.; Deng, J.-S.; Shi, Y.-Y.; Chen, Z.-L.; Han, N.; Wang, K. Diagnoses of rice nitrogen status based on characteristics of scanning leaf (in Chinese with English abstract). Spectrosc. Spect. Anal. 2009, 29, 2171–2175. [Google Scholar]
- Kuo, S. Phosphorus. In Methods of Soil Analysis, Part III. Chemical Methods; SSSA Book Series No., 5, Sparks, D.L., Page, A.L., Helmke, P.A., Loeppert, R.H., Eds.; American Society of Agronomy: Madison, WI, USA, 1996; pp. 869–920. [Google Scholar]
- Steel, R.G.D.; Torrie, J.; Torrie, J. Principles and Procedures of Statistics. A Biometric Approach, 2nd ed.; Mc Gras Hill International Book Co.: New York, NY, USA, 1981. [Google Scholar]
- Siddique, M.R.B.; Hamid, A.; Islam, M.S. Drought stress effects on water relations of wheat. Bot. Bull. Acad. Sinca. 2000, 41, 35–39. [Google Scholar]
- Rusek, P.; Mikos-Szymańska, M.; Karsznia, M.; Sienkiewicz-Cholewa, U.; Igras, J. The effectiveness of nitrogenphosphorus fertilization in winter wheat (Triticum aestivum L.) cultivation. Bulg. J. Agri. Sci. 2016, 22, 752–755. [Google Scholar]
- Fazullah; Adnan, M.; Fahad, S.; Iqbal, S.; Arshad, M.; Muhammad, D.; Wahid, F.; Hussain, A.; Roman, M.; Perveez, R.; et al. Integrated application of phosphorus (p) and phosphate solubilizing bacteria (psb) improve maize yield. Pure Appl. Biol. 2018, 7, 494–499. [Google Scholar]
- Zaid, I.U.; Zheng, X.; Xing, C. Breeding Low-Cadmium Wheat: Progress and Perspectives. Agronomy 2018, 8, 249. [Google Scholar] [CrossRef]
- Haileselassie, B.; Habte, D.; Haileselassie, M.; Gebremeske, G. Effects of mineral nitrogen and phosphorus fertilizers on yield and nutrient utilization of bread wheat (Tritcum aestivum L.) on the sandy soils of Hawzen District, Northern Ethiopia. J. Agric. For. Fish. 2014, 3, 189–198. [Google Scholar]
- Sandana, P.; Pinochet, D. Grain yield and phosphorus use efficiency of wheat and pea in a high yielding environment. J. Soil Sci. Plant Nutr. 2014, 14, 973–986. [Google Scholar] [CrossRef]
- Solangi, M.; Suthar, V.; Wagan, B.; Siyal, A.G.; Sarki, A.; Soothar, R.K. Evaluate the Effect of Nitrogen and Phosphorus Fertilizer Doses on Growth and Yield of Spinch (Spinacia Oleraceal). Sci.Int. 2015, 28, 379–383. [Google Scholar]
- Firoz, Z.A. Impact of Nitrogen and Phosphorus on the Growth and yield of Okra (Abelmoschus esculentus L.) in Hill slope condition. Bangladesh J. Agril. Res. 2009, 34, 713–722. [Google Scholar] [CrossRef]
- Chang, J.; Clay, D.E.; Smart, A.J.; Clay, S.A. Estimating Annual Root Decomposition in Grassland Systems. Rangel. Ecol. Manag. 2016, 69, 288–291. [Google Scholar] [CrossRef]
- Bednarek, R.; Paroutis, S.; Sillince, J. Transcendence through Rhetorical Practices: Responding to Paradox in the Science Sector. Organ. Stud. 2017, 38, 77–101. [Google Scholar] [CrossRef]
- Stevens, G.; Dunn, D.; Rhine, M.D. Soil Testing Bray-1 Phosphorus with Non-Reagent Grade Hydrochloric and Sulfuric Acids. Commun. Soil Sci. Plant Anal. 2018, 49, 958–966. [Google Scholar] [CrossRef]
- Carneiro, F.M.; Nabout, J.C.; Vieira, L.C.G.; Roland, F.; Bini, L.M. Determinants of chlorophyll-a concentration in tropical reservoirs. Hydrobiologia 2014, 740, 89–99. [Google Scholar] [CrossRef]
- Bojović, B.; Marković, A. Correlation between nitrogen and chlorophyll content in wheat (Triticum aestivum L.). Kragujev. J. Sci. 2009, 31, 69–74. [Google Scholar]
- Belete, F.; Dechassa, N.; Molla, A.; Tana, T. Effect of nitrogen fertilizer rates on grain yield and nitrogen uptake and use efficiency of bread wheat (Triticum aestivum L.) varieties on the Vertisols of central highlands of Ethiopia. Agric. Food Secur. 2018, 7, 78. [Google Scholar] [CrossRef]
- Thavaprakash, N.; Siva, K.S.D.; Raja, K.; Senthil, K.G. Effect of nitrogen and phosphorus levels and ratios on seed yield and nutrient uptake of sunflower hybrid (Dsh-I). Helia 2002, 25, 59. [Google Scholar] [CrossRef]
- Meena, L.R.; Singh, R.K.; Gautam, R.C. Effect of moisture conservation practices, phosphorus levels and bacterial inoculation on chickpea under rainfed condition. Indian J. Agron. 2002, 47, 398–404. [Google Scholar]
- Choudhary, S.K.; Singh, R.N.; Upadhyay, P.K.; Singh, R.K.; Choudhary, H.R.; Vijay, P. Effect of Vegetable Intercrops and Planting Pattern of Maize on Growth, Yield and Economics of Winter Maize (Zea mays L.) in Eastern Uttar Pradesh. Environ. Ecol. 2014, 32, 101–105. [Google Scholar]
- Shafi, M.I.; Adnan, M.; Fahad, S.; Wahid, F.; Khan, A.; Yue, Z.; Danish, S.; Zafar, M.; Brtnický, M.; Datta, R. Application of Single Superphosphate with Humic Acid Improves the Growth, Yield and Phosphorus Uptake of Wheat (Triticum aestivum L.) in Calcareous Soil. Agronomy 2020, 10, 1224. [Google Scholar] [CrossRef]
- Huq, E.; Fahad, S.; Shao, Z.; Sarven, M.S.; Khan, I.A.; Alam, M.; Saeed, M.; Ullah, H.; Adnan, M.; Saud, S.; et al. Arsenic in a groundwater environment in Bangladesh: Occurrence and mobilization. J. Environ. Manag. 2020, 262, 110318. [Google Scholar] [CrossRef]
- Wahid, F.; Fahad, S.; Danish, S.; Adnan, M.; Yue, Z.; Saud, S.; Siddiqui, M.H.; Brtnický, M.; Hammerschmiedt, T.; Datta, R. Sustainable Management with Mycorrhizae and Phosphate Solubilizing Bacteria for Enhanced Phosphorus Uptake in Calcareous Soils. Agriculture 2020, 10, 334. [Google Scholar] [CrossRef]
- Rafiullah; Tariq, M.; Khan, F.; Shah, A.H.; Fahad, S.; Wahid, F.; Ali, J.; Adnan, M.; Ahmad, M.; Irfan, M.; et al. Effect of micronutrients foliar supplementation on the production and eminence of plum (Prunus domestica L.). Qual. Assur. Saf. Crop. Foods 2020, 12, 32–40. [Google Scholar] [CrossRef]
- Arif, M.; Ali, S.; Ilyas, M.; Riaz, M.; Akhtar, K.; Ali, K.; Wang., H. Enhancing phosphorus availability, soil organic carbon, maize productivity and farm profitability through biochar and organic–inorganic fertilizers in an irrigated maize agroecosystem under semi-arid climate. Soil Use Manag. 2020, 1–16. [Google Scholar] [CrossRef]
- Khan, S.; Shah, Z.; Mian, I.A.; Dawar, K.; Tariq, M.; Khan, B.; Mussarat, M.; Amin, H.; Ismail, M.; Ali, S.; et al. Soil Fertility, N2 Fixation and Yield of Chickpea as Influenced by Long-Term Biochar Application under Mung-Chickpea Cropping System. Sustainability 2020, 12, 9008. [Google Scholar] [CrossRef]


Publisher’s Note: MDPI stays neutral with regard to jurisdictional claims in published maps and institutional affiliations. |
© 2021 by the authors. Licensee MDPI, Basel, Switzerland. This article is an open access article distributed under the terms and conditions of the Creative Commons Attribution (CC BY) license (http://creativecommons.org/licenses/by/4.0/).