Article

Impact of Logistics Development Level on International Trade in China: A Provincial Analysis

1
School of Geography and Tourism, Shaanxi Normal University, Xi’an 710119, China
2
Center for Land Resources Research in Northwest China, Shaanxi Normal University, Xi’an 710119, China
3
Institute of Global Regional and Urban Studies, Shaanxi Normal University, Xi’an 710119, China
*
Author to whom correspondence should be addressed.
Sustainability 2021, 13(4), 2107; https://doi.org/10.3390/su13042107
Submission received: 25 January 2021 / Revised: 12 February 2021 / Accepted: 12 February 2021 / Published: 16 February 2021
(This article belongs to the Special Issue Global and International Logistics)

Abstract

:
Transport infrastructure and logistics are gradually becoming important factors affecting global trade. At the same time, with the international logistics corridor along the Belt and Road Initiative (BRI) going deep into construction, China is emerging as a unique case to study how logistics affects international trade. Therefore, based on the evaluation index system of logistics development level of China’s provinces by using the entropy method, this paper systematically analyzed the impact of logistics development level on bilateral trade from 31 China’s provinces to 65 countries along the BRI by using the improved gravity model with data for the period 2008–2018. Empirical results show: (1) Logistics development level had significantly promoted international trade development. (2) Compared with partner countries, China’s provincial logistics development level presented a greater impact on bilateral trade. (3) Influence of logistics development level was manifested in different periods, different international and regions, especially, logistics development level coefficient of the western region was negative, while that in eastern region was positive. In view of the above research results, we argue that strengthening domestic and international logistics construction is not only conductive to the sustainable development of China’s future trade, but also help to realize the coordinated development between China’s eastern, central and western regions.

1. Introduction

With the rapid advancement of economic globalization and trade liberalization, tariffs and non-tariff barriers have been significantly reduced, while transport and logistics are gradually becoming important factors affecting global trade. “Sound development of logistics is a prerequisite for promoting a country’s competitiveness”, according to Connecting to Compete: Trade Logistics in the Global Economy issued by the World Bank in 2018. In 2013, China’s President Xi Jinping put forward major initiatives to jointly build the Silk Road Economic Belt and the 21St Century Maritime Silk Road, which has attracted great attention from the international community [1]. The proposals are officially termed the Belt and Road Initiative (BRI). Since the launch of the BRI, the Chinese government has been paying special attention to the construction and investment of logistics infrastructures and introduces a series of plans such as Medium- and Long-Term Plan for the Development of the Logistics Industry (2014–2020), China-Europe Railway Express Construction Development Plan (2016–2020), National Logistics Hub Layout and Construction Plan, and Overall Plan for the Country’s New Western Land-sea Corridor. By carrying out the abovementioned plans, the government aims to strengthen the construction of domestic logistics hub and network, strives to build a large logistics corridor of land, sea, and air connecting China to foreign countries to enhance logistics support for the implementation of BRI [2].
As an important part of BRI’s cross-border logistics network, China-Europe railway express (CER-express) is a new type of international trade transportation mode between China and Eurasian continents [3]. By the end of 2019, the total number of operations on the CER-express had exceeded 21,161 round trips, reaching 57 cities in 18 European countries [4], and the role of logistics channel is gradually obvious. The implementation of CER-express has two advantages: (1) balance time and transport costs. On the one hand, CER-express is more time-sensitive and stable which transport time is half that of sea transport [5]. On the other hand, compared with air transport, CER-express has the characteristics of low transport costs and large volume. Therefore, CER-express is more suitable for transporting processed products and end consumer goods that have certain requirements on timeless, and have a certain scale and higher value; (2) balance regional sustainable development. With the vigorous development of CER-express, it is expected to break the logistics pattern of a single ocean-oriented direction. Furthermore, it provides a stable international logistics channel guarantee for inland enterprises in China’s central and western regions and Central Asia to go out along the BRI, so that the inland areas have the basic conditions for opening up and trade development [6,7]. However, some authors pointed out that the shortcomings of CER-express, such as gauge inconsistency, unreasonable layout, high return empty box rate, overreliance on government subsidies [8,9], so what is the level of logistics development in China’s provinces? Whether the improvement of logistics development level has promoted the growth of trade between China and countries along the BRI? If so, whether there are regional heterogeneity effects? Through the exploration of these issues, it is of great theoretical and practical significance to promote the construction of the logistics network of the BRI and expand the opening of inland areas to the outside world.
In view of the above, taking 65 countries along the BRI as research subjects, this paper firstly built an index system of the provincial logistics development level of China, then discussed the spatio-temporal evolution pattern of the trade between Chinese provinces and partner countries along the BRI, and eventually analyzed the impact of logistics development level on bilateral trade by using the improved gravity model from 2008 to 2018, in order to provide decision-making reference for promoting the coordinated development of China’s three major regions.
The remainder of this paper is organized as follows: Section 2 provides a review of previous studies. Section 3 presents the methodological approaches and data utilized in this paper. Spatio-temporal pattern of trade between China and countries along the BRI is shown in Section 4. Section 5 analyzes impact of logistics development level on bilateral trade. Discussions and conclusions are drawn in Section 6 and Section 7, respectively.

2. Literature Review

Under the background of economic globalization and market internationalization, domestic and international logistics plays an important role in improving the international trade environment and providing various conveniences for international trade. With the further expansion of global trade, logistics development level has a key factor affecting and restricting international trade. In this regard, a large number of studies have been carried out the impact of logistics on international trade.
Due to the lack of a widely accepted definition of logistics both at national and regional levels, previous studies only considered the impact of a certain aspect of logistics on international trade [10]. Limao and Venables [11], Martinez-Zarzoso et al. [12], Baier and Bergstrand [13] found that transport costs had a significant negative impact on international trade. Hummels [14], Nordas [15], Djankov et al. [16] found that trade time also had a remarkable negative impact on international trade, especially on the export of time-sensitive products such as agricultural products. In addition, most scholars have carried out a large number of empirical studies about the impact of logistics infrastructure on international trade. Longo and Sekkat [17] believed that weak highway infrastructure was one of the three major obstacles to the development of international trade in Africa. Egger and Larch [18] studied the impact of transport infrastructure on bilateral trade among 180 countries in the world and found that transport infrastructure had a notable positive impact on bilateral trade. Furthermore, compared with the highway network, the railway network was 50% higher in promoting international trade flow. By using microscopic data of exports from other ports in the world to the United States, Clark et al. [19] analyzed the relationship between port efficiency, shipping costs, and bilateral trade. Based on the survey data of 20 regions in Italy and 24 countries in Europe, Alderighi and Gaggero [20] analyzed the relationship between air transport services and international trade during 1998–2010 and found that direct flights can reduce “spatial and temporal distance” between trading partners, having a positive impact on exports.
Since the Logistics Performance Index (LPI) published by World Bank in 2007, most scholars have analyzed the effect of LPI on international trade from a broader perspective. Behar and Manner [21] held that LPI could significantly reduce the distance trade effect, and the exports of landlocked countries depended on the LPI of their neighbors. Puertas et al. [22] studied the influence of LPI on bilateral trade among EU countries, finding that the influence coefficients of the LPI of exporting countries were greater than that of importing countries. They also made a decomposition analysis of the six indicators of LPI, finding that goods traceability was the most influential among all the indicators. According to the research performed conducted by Celebi [23], the influence of LPI on international trade existed evident differences among countries with different levels of economic development, and the influence degree of LPI was larger in low-income countries. In recent years, with the proposal of the BRI, most scholars have focused on the influence of LPI on trade between China and countries along the BRI. Wang and Gong [24] analyzed the impact of LPI of Silk Road Economic Belt on China’s export of machinery and electronic products. Feng and Liu [25] found that LPI of countries along the BRI could significantly promote the export of China’s machinery and transportation equipment. Zhao et al. [26] discussed on the LPI of countries along Silk Road Economic Belt and its impact on international trade of Xinjiang. Wang et al. [1] found that LPI had a more positive effect on China’s exports after the BRI than before it.
Through the review of existing literature, studies on the impact of logistics on international trade can be divided into two directions: the first one is focusing on the impact of a specific logistics factor on trade (such as trade time, transport costs, and logistics infrastructure); the second one is through attempting to make a comprehensive evaluation of national logistics elements (mostly using LPI) to analyze the development of logistics and its influence on trade. Given the progress of current research, this paper may enrich and extend the existing studies in the following aspects: (1) the existing researches mostly adopt LPI as a logistics factor and focus on the international and national macro-scales to analyze the effect of logistics on trade from a comprehensive perspective, while the provincial and city medium-scale studies are relatively limited. However, with the carrying out of the BRI construction, the logistics conditions of China’s central and western provinces have witnessed an improvement, so it is more practical to reveal the trade effect of China’s logistics from a provincial perspective. (2) the development level of logistics is mainly determined through the logistics performance evaluation index system (involving efficiency of customs clearance, quality of logistics infrastructure, the convenience of international transportation, quality of logistics service, traceability of goods, and timeliness of goods transportation) released by World Bank. The index system is more frequently used at the national level, and cannot achieve effective application at the provincial scale due to the shortage of data. This paper, based on the existing literature, constructed a preliminary evaluation system of the provincial logistics development level and measures the level. (3) in the aspect of impact research, there are few literatures to compare the heterogeneity of the impact of logistics development level on bilateral trade from different spatial and temporal perspectives.

3. Construction of Index System, Methodology and Data

3.1. Construction of Index System

Based on the existing literature [27,28,29] and following the principles of scientific research, feasible method, systematical assessment, and comparable indicator, this paper divided the provincial logistics evaluation system into three subsystems (Table 1): regional economic support, logistics infrastructure, and logistics operation and development. The regional economic support system provides driven force for the development of regional logistics and generates the demand for the transportation of commodities and cargo through the developing economy. The logistics infrastructure system is the foundation of the formation and development of a regional logistics system, which realizes the cross-region and cross-nation flow of commodities and goods by hardware and software infrastructure. The logistics operation and development system not only demonstrate the size of regional logistics which involves the size of employment, investment, freight, output value, and others but also reflects the ability of regional logistics development to a certain extent.
Based on the above-mentioned index system, we adopted the entropy evaluation method to determine the weight of all indexes from each index layer. Firstly, using the extremum method to standardize the 13 indicators in Table 1, and converting original data into dimensionless scores ( x i j ) between 0 and 1. Secondly, we calculated the information entropy and information utility value of all the indexes:
e j = k i = 1 m x i j ln ( x i j )
where e j is the information entropy of the j index; x i j is the standardization value of the j index of the i province; m is the number of province, which is 31; k is the constant term ( k = 1 / ln m ). The information utility value of the j index is d j ( d j = 1 e j ).
Lastly, we calculated the weight and comprehensive evaluation value of the index. The calculation formula of the weight of the j index is w j = d j / j = 1 n d j ; n is the number of the index, which is 13; And the calculation formula of the comprehensive evaluation value of the i province is z i = j = 1 n w j x i j .
Table 2 reflects the evolution trend of the logistics development level of China. From 2008 to 2018, the overall logistics development level of China showed a steady upward trend, with the logistics development index rising from 0.189 to 0.277, the logistics development level increasing by 47.07%. Meanwhile, coefficient of variation (CV) of China’s logistics development level decreased from 0.579 to 0.320, indicating that the inter-provincial differences in the logistics development level are narrowing and tending to be balanced. During the ten years, with the 4 trillion stimulus plan put forward in 2008 and the BRI launched in 2013, transport infrastructure investment in the western and central regions kept growing rapidly and continuously. The logistics development level of the central and western regions increased by 66.31% and 77.16% respectively. However, the overall logistics development level of China remained an “east-center-west” gradient-descent pattern.

3.2. Methodology

As an important tool to study spatial interaction, gravity model is widely used in the field of economic research, and its application in investment and trade shows diversified characteristics. Tinbergen [30] firstly applied gravity model to international trade, believing that bilateral trade flows between two countries are proportional to their respective economic strength and inversely proportional to the distance between them. Subsequently, Anderson [31], Bergstrand [32,33] gave the theoretical basis of gravity model. The standard form of the gravity model is as follows:
l n X i j = α + β 1 l n G D P i + β 2 l n G D P j + β 3 l n D i j + ε i j
where X i j is the total volume of import and export between i province of China and j country along the BRI; G D P i and G D P j are the gross domestic product of i province and j country; D i j is the geographical distance between i province and j country. In order to test the impact of logistics development level on trade, logistics development level (LDL) variable is added based on the gravity model, and the model form changes into:
l n X i j = α + β 1 l n G D P i + β 2 l n G D P j + β 3 l n D i j + β 4 L D L i + β 5 L D L j + ε i j
where L D L i is the logistics development level of i province in China, and L D L j is the logistics development level of the j country. If β 4 is significantly positive, it means that the improvement of the provincial logistics development level of China can be conducive to promoting its trade growth. Likewise, if β 5 is significantly positive, it indicates that the logistics of trading partners also can promote the trade growth of China to a large extent. ε i j is the random error term.
Based on the formula (3), add two types of pseudo-variables: which country belongs to costal countries ( C o a s t j ). And whether the countries willing to reach free trade agreement with China ( F T A i j ). At the same time, this paper also takes boundary effect variable ( D o m e s t i c i ) into consideration to measure the boundary effect value (the times of Chinese provincial trade and international trade) of China’s provinces and countries along the BRI. The specific form of the formula is as follows:
l n X i j = α + β 1 l n G D P i + β 2 l n G D P j + β 3 l n D i j + β 4 L D L i + β 5 L D L j     + β 6 D o m e s t i c i + β 7 C o a s t j + β 8 F T A i j + ε i j
where if country i is a costal country, C o a s t j = 1 . If the country i is not a costal country, C o a s t j = 0 . When F T A i j = 1 , it means that country i reaches free trade agreement with China. But when F T A i j = 0 , it means that country i fails reach free trade agreement with China. When i = j , the gravity model reflects provincial trade. The index value e β 6 of the coefficient in front of   D o m e s t i c i is used to express boundary effect.

3.3. Data

Based on the availability of data, 31 provincial units in mainland China were selected as research samples, excluding Hong Kong, Macao, and Taiwan. As a global economic cooperation network, the BRI has not yet given a precise spatial scope. In this paper, the scope of the BRI was defined as 65 countries and we divided them into six groups (Table 3, Figure 1), and the time scope was 2008 to 2018.
The data in this paper were from multiple sources. For example, the data of bilateral trade flows between 31 provinces of China and 65 countries along the BRI were from the foreign trade database of the Development Research Center of the State Council Information Network [34]. The provincial trade volume was calculated by subtracting total exports from the share of tradable goods [35,36], and the trade distance was represented by the point-to-point linear distance between provincial capitals and national capitals, which can be obtained through Google Earth. The calculation of provincial trade distance adopted the calculation method of Poncet [37]. The free trade agreement data were from China Free Trade Area Service Network [38]. The country-level logistics data came from the database of World Bank [39] (since 2007, the World Bank has been publishing the logistics performance index of all countries in the world every two years, while the data of the rest of the year were obtained through interpolation). Data of indicators at the provincial level were obtained from China Statistical Yearbook (2009–2019) [40], China Transportation Yearbook (2009–2019) [41], and statistical yearbooks of all provinces.

4. Spatio-Temporal Patterns of Trade between China and Countries along the BRI

4.1. Temporal Evolution Characteristics

From 2008 to 2018, the trade between China and countries along the BRI showed an overall “W-shaped” fluctuating upward trend (“upward-downward-upward-downward”). At the same time, the proportion of the trade volume between China and countries in the total trade of China demonstrated a similar evolutionary trend (Figure 2). In the first stage (2008–2009), the total trade volume plummeted from $598.41 billion in 2008 to $503.60 billion in 2009, declining 15.84%. The decline was mainly due to the global economic downturn and a slump in the international market caused by the outbreak of the international financial crisis. In the second stage (2009–2014), the total trade volume presented a steady upward trend. On the one hand, China quickly introduced a 4 trillion-yuan investment plan after the financial crisis, effectively promoting the rapid development of transport infrastructure as well as creating favorable conditions for stabilizing domestic economic development for Chinese enterprises to “go out”. On the other hand, with the gradual opening of China Railway Express like Chongqing-Sinkiang-Europe International Railway in 2011, and the proposal of the BRI, China has established all-round, cross-field, open and inclusive cooperation platforms as well as increasingly closer economic and trade ties with countries along the BRI. In the third stage (2014–2015), the total trade volume declined for the second time, by 10.58%. The main reasons for the decline are the downturn of the international market, the decline of commodity prices, and the new normal transformation of domestic foreign trade structure; In the fourth stage (2015–2018), the total trade volume increased steadily again, with an increase of 28.78%. In 2018, the total trade volume between China and countries along the BRI accounted for 27.91% of China’s total trade volume, indicating that trade links with countries along the BRI have become a new growth point of China’s economy.

4.2. Spatial Evolution Characteristics

4.2.1. Overall Network Spatial Characteristics

With $100 million, and $1, $5, $10, and $15 billion being the critical values, we conducted quantitative statistics of the trade flows between the provinces of China and countries along the BRI (Table 4, Figure 3). On the whole, from 2000 to 2018, the breadth and intensity of trade links have increased significantly. In 2008, the trade flows of less than $100 million accounted for the majority, arriving at 75.48%. The second was the trade flows between $100 million and $1 billion, reaching 17.82%. While the trade flows over $10 billion occupied less than 0.5%. The high trade flows mainly existed between Guangdong and countries in Southeast Asia. In 2018, the proportion of trade flows less than $100 million presented a significant decline of 10%. While the rest types of the trade flows all showed an upward trend. In this stage, the trade flows were gradually shifting its close links with Southeast Asia to Russia, India, and countries on the Arabian Peninsula.

4.2.2. Domestic Spatial Characteristics

In the domestic aspect, the 31 provinces of China were divided into three regions (eastern, central, and western regions) according to the economic and geographical space of China (Table 2). From 2008 to 2018, the trade between the eastern, central, and western regions of China and countries along the BRI showed a “W” type fluctuating upward trend (Table 5). The total trade volume of the eastern region increased from $504.47 billion in 2008 to $1,030.27 billion in 2018, with an average annual growth rate of 7.40%. The total trade volume of the central region increased from $42.18 billion in 2008 to $105.43 billion in 2018, with an average annual growth rate of 9.61%. And the total trade volume of the western region increased from $51.82 billion in 2008 to $154.38 billion in 2018, with an average annual growth rate of 11.53%. The above-mentioned data indicated that the trade link between the eastern region and countries along the BRI was much higher than that of the central and western regions, and the trade link between the western region and the countries was a little higher than that of the central region. Among the development of foreign trade with the countries along the BRI, the inter-provincial differences of China have been narrowing to a certain extent. From 2008 to 2018, the CV values of the central and western regions have been declining, with the falling range being 39.18% and 32.18%. While the CV value of the eastern region enjoyed a lower falling range of 5.27%. It meant that with the rapid development of cross-border logistics like China Railway Express, the trade links between the regions of inland China and countries along the BRI were further strengthened, and provincial foreign trade differences of the central and western regions thus became smaller.
According to the statistics of the total trade volume between the provinces and countries along the BRI, the provinces were divided into high trade zone, relatively high trade zone, medium trade zone, relatively low trade zone, and low trade zone according to the critical value of $ 5, $10, $50 and $100 billion (Figure 4). From 2008 to 2018, the high trade zone, besides Guangdong, was newly added with other cities like Shanghai, Beijing, Jiangsu, and Zhejiang, while the relatively high trade zone included Shandong and Fujian. In the medium trade zone, provinces such as Xinjiang, Heilongjiang, Liaoning, Tianjin, and Hebei remained their positions, and the provinces newly added to the medium trade zone are mostly concentrated in the central and southwest regions. The pattern of relatively low trade zone encountered complete changes which were mainly concentrated in Jilin and Shaanxi. Shanxi, Ningxia, Gansu, Qinghai, Xizang, and Guizhou in the low trade zone remained unchanged all the time. In general, the total trade volume between China and countries along the BRI showed a spatial decreasing trend from the east to the west, with Beijing, Shanghai, Guangdong, and other provinces as the core.

4.2.3. International Spatial Characteristics

In the international aspect, according to the geographical distribution of the world, the 65 trade partner countries along the BRI were divided into Mongolia-Russia, Southeast Asia, South Asia, Central Asia, West Asia-North Africa, Central-Eastern Europe (Figure 3). Meanwhile, combining with the key direction of the development of the BRI regions, the above-mentioned six regions were further divided into the “Belt” (Silk Road Economic Belt) regions and the “Road” (21st-Century Maritime Silk Road) regions (Table 3).
From 2008 to 2018, the trade between the regions along the BRI and China showed a certain upward trend (Table 6). From the development of the total trade volume of the six regions of the Belt and Road, the descending order of the six regions was Southeast Asia, West Asia-North Africa, South Asia, Mongolia-Russia, Central-Eastern Europe, and Central Asia. During the study period, Southeast Asia showed an evolutionary trend of “W”, increasing from $231.07 billion in 2008 to $587.72 billion in 2018, with an average annual growth rate of 9.79%. The evolutionary trend of West Asia-North Africa was the same as Southeast Asia, but the annual growth rate of the former was 6.17% which was much smaller compared with the latter. The total trade volume of the other four regions was relatively small, and the sum of which only accounted for 28% to 34%. In terms of the average annual growth rate, South Asia held the highest value of 7.83%, followed by Central-Eastern Europe (6.89%) as well as Mongolia-Russia (6.88%). While Central Asia was the lowest (3.07%). From the change of the total trade volume of the five regions, Southeast Asia, as an important part of the BRI, had a strengthened economic and trade link with China, which can be ascribed to two reasons. On the one hand, Southeast Asia and China are geographically adjacent, so the land, sea, and air transport between them is relatively convenient. On the other hand, China and Southeast Asia established their free trade areas (China-ASEAN Free Trade Area, CAFTA) in an early stage. After the completion of the free trade zone in 2010, most products of both sides are free of the tariff, greatly promoting trade liberalization. In addition, China’s total trade with West Asia-North Africa and its growth rate were both lower than that with Southeast Asia. And the main reason is that our country is in the rapid development stage of industrialization, and thus is largely dependent on the energy market of West Asia-North Africa. Under the background of the new normal, the structure of the economic industry of China is in urgent need of optimizing and adjusting, making the trade commodity structure, especially the export trade of China to West Asia and North Africa change. Zhang et al. [42] found that the proportion of China’s exports to West Asia of products with high technological content such as machinery, electrical equipment was increasing, while the proportion of exports of textiles, furniture, and other products with low technological content was decreasing. Though the total trade volume between South Asia, Central and Eastern Europe, Mongolia-Russia, and China was far lower than that of South Asia and West Asia-North Africa, the growth speed of the former was faster than that of the latter. The main reason is that China promoted the construction of the cross-border logistics network “hardware” and further deepened the development of the “software”. For example, in 2011, China launched the second stage negotiation of the China-Pakistan free trade agreement. In 2017, China signed a free trade agreement with the Maldives. In terms of the Central and Eastern European, China established a cooperation mechanism with the Central and Eastern European. And in 2017, China and the Central and Eastern European jointly issued the Budapest Outline of China-Central and Eastern European Countries Cooperation. Central Asia does not take any advantage of the total volume and the development speed of trade. But with the continuous improvement of the transportation efficiency and performance of China Railway Express, and the deepening of interconnection construction of infrastructure in Central Asia, the economy and trade of China and Central Asia will be injected into new impetus.
From the development of the two major regions of the BRI, it showed the characteristics that the total trade volume of the “Road” region was larger than that of the “Belt” region (Table 6). The total trade volume of the “Road” region showed a “W” type fluctuating upward trend, increasing from $426.38 billion in 2008 to $973.39 billion in 2018, with an average annual growth rate of 8.61%. And the trade of the “Belt” region presented a similar development trend, with a relatively low average annual growth rate of 5.78%. Therefore, the “Road” region is the main trading place of China’s foreign trade. The reason why the trade of the “Road” region and the “Belt” region existed huge differences was that the goods transportation way of China and the world is predominated by sea transportation. According to the China’s Ports-Of-Entry 2019 Yearbook, the import and export trade of China through water transportation accounted for 61.60% in 2018, while road and railway transportation accounted for 16.0% and 1.10%.

5. Empirical Analysis

5.1. Overall Regression

Investigating the impact of logistics development level on the provincial international trade of China by utilizing Stata.16 and adopting the mixed least square method (OLS) to analyze the panel data from 2008 to 2018. The results of the empirical model are shown in Table 7. Model 1 in Table 7 is the standard trade gravity equation. Model 2 adds logistics development level variables. Model 3 adds boundary effect variables. Model 4 adds variables of logistics development level based on Model 3. In model 5, all variables are incorporated into the equation. Based on Model 5, Model 6 and 7 conducts temporal heterogeneity investigation, respectively representing the period of 2008–2012 (before the proposal of BRI) and 2013–2018 (after the proposal of BRI). In Table 4, the fitting results of all variables are completely consistent with the expected ones, and all the regression coefficients can pass the significance test of 1%. Therefore, it is very suitable to use the gravity model to analyze the provincial international trade of China.
Models 1 to 7 show that the bilateral trade between China’s provinces and countries along the BRI was positively proportional to the economic scale of the two and inversely proportional to the geographical distance of the two, which was consistent with the theoretical analysis of the trade gravity equation. In Model 2, the provincial logistics development level had a significant positive influence on bilateral trade, with every 1% increase in provincial logistics development leading to a 4.053% rise in bilateral trade. The logistics development level of the partner country also had an obviously positive influence on bilateral trade, but its influence coefficient (1.546) was lower than that of the provincial logistics development level. It means that the improvement of logistics development level played a critical role in promoting the trade between China’s provinces and countries along the BRI. And the trade effect of the bilateral logistics had prominent differences, with notable “motherland directivity”. Thus, the strengthening of the logistics infrastructure construction and the logistics service level of China is of great importance, which is an example of the saying “It takes a good blacksmith to make steel”.
Model 3 showed that there was a significant border effect on the trade between China’s provinces and countries along the BRI, with a boundary effect value of 64.845. This value was higher than the estimated result of Liu and Hu [43], but far lower than the estimated result of Liang and Zhang [44] on the border effect of the export trade of China with its neighboring countries. Combined with the research results of Helliwell [45], the border effect between China’s provinces and countries along the BRI was close to its counterpart (around 70) between developing countries. This paper certainly differed from previous studies in some aspects such as the use of the data of bilateral trade between China’s provinces and countries along the BRI instead of the provincial level data of China’s partner countries, which may lead to a certain degree of deviation when estimating border effect. After the introduction of the variable of logistics development level in Model 4, the boundary effect value significantly decreased from 64.845 to 51.522, with a declining range of 20.547%, which fully indicated that the improvement of logistics development level is conducive to reducing the boundary effect and further expanding the geographical range of the provincial trade of China.
From Model 6 and 7, the impact of the logistics development level on the provincial international trade of China contained obvious temporal heterogeneity. Compared with the period of 2008 to 2012, the influence coefficients of the logistics development level of China’s provinces and partner countries increased by 9.406% and 35.994% between 2013 and 2018. The data demonstrated that after the proposal of BRI, China has strengthened the construction of domestic regional logistics infrastructure, and established a preliminary logistics network. As a result, the trading time and costs between China and countries along the BRI are further lowered, facilitating the exchange of economic and trade personnel and promoting the circulation of various elements of the trade.
In terms of variables controlling, Coastj and FTAij both had significant positive effects on the bilateral trade, with coefficients of 0.099 and 0.242 (Model 5).

5.2. Sub-Regional Regression

5.2.1. Domestic Sub-Regional Regression

Model 8 to 10 in Table 8 represented the empirical results of the eastern, central, and western regions respectively. The coefficients of the provincial logistics development level in the three regions were significantly different. The coefficient of the eastern region was positive and passed the significance test of 1%. The coefficient of the central region was positive as well but did not pass the significance test. While the coefficient of the western region was negative and did not pass the significance test either, indicating that the provincial logistics development level significantly promoted the trade between the eastern region and countries along the BRI. Probably because of the excellent geographical location and the developed transport infrastructure of the eastern region, transport cost can be reduced to a large extent and the logistics trade effect was thus more noticeable. In contrast, the geographic locations of the central and western regions had little advantages, and the poor logistics infrastructure called for further promotion, thus the overall logistics trade effects of the central and western regions cannot play their full roles. The logistics development level of the partner countries had a significant positive influence on the bilateral trade, and the descending order of the influence was the eastern, central, and western regions, showing that the logistics development of the countries along the BRI is conducive to the foreign trade growth of the regions of China. Meanwhile, as the eastern region is endowed with the advantage of the shipping conditions, the transport connection between it and the countries along the BRI is much more convenient.
In terms of controlled variables, there were significant boundary effects between the eastern, central and western regions, and countries along the BRI, with the boundary effect values of 9.708, 114.663, 156.179, indicating that boundary effect between the eastern region and countries along the BRI was rather close to the effect among developed countries, and the boundary effects of the central and western region even exceeded the average level of the effect among developing countries. FTAij had a significant positive influence on the three regions, while Coastj merely had an obvious impact on the eastern region.

5.2.2. International Sub-Regional Regression

Model 11 to 16 in Table 9 represented the empirical results of Mongolia-Russia, Southeast Asia, South Asia, Central Asia, West Asia-North Africa, and Central-Eastern Europe, while Model 17 and 18 showed the fitting results of the “Belt” region and the “Road” region. From the six regions, the provincial logistics development level had a significant positive impact on Southeast Asia, South Asia, West Asia-North Africa, and Central-Eastern Europe, with fitting coefficients of 4.286, 2.351, 4.068, and 4.073, while had no significant impact on Mongolia-Russia and Central Asia. In terms of the logistics development level of the partner countries, Southeast Asia, South Asia, Central Asia, West Asia-North Africa had a significant positive impact; Mongolia-Russia had no significant impact, and Central-Eastern Europe had a negative impact. From the “Belt” region and the “Road” region, the logistics development level had a significant positive impact on the trade development of the two regions, but the impact on the “Road” region was larger than that on the “Belt” region, which fully demonstrated that the construction of the logistics network of the inland countries along the BRI should be effectively strengthened.

6. Discussion

6.1. The Government Must Strengthen the Coordinated Development of Logistics among the Provinces of China

The results of the research show that the gap of the logistics development level among provinces of China tends to narrow, but the coefficient of variation always exceeds 0.3. The logistics development level of the eastern region is still far more than that of the central and western regions, and the trade effect of logistics of the central and western region is not been effectively reflected. Therefore, for the eastern region, the adjustment of the internal structure of the logistics should be strengthened, intelligent logistics should be developed to improve the quality of logistics development. In the central and western regions, the construction of logistics infrastructures such as highway, railway, waterway, and aviation should be strengthened; the layout of logistics hubs should be optimized; the comprehensive logistics transportation network should be built to transform the geographical conditions of the central and western regions from “remote edge” to “frontier zone”.

6.2. Countries along the BRI Should Strengthen Policy Communication and Coordination

The results show that the trade connection between China and Southeast Asian is the closest, and the trade effect of the logistics in Southeast Asian is much higher than that of other BRI regions, showing that the improvement of “software” conditions such as policy will greatly exert the trade effect of “hardware” logistics. For Central Asia and Mongolia-Russia, on the one hand, it is necessary to establish a sound policy communication mechanism, gradually reduce trade barriers, and promote trade liberalization and development. On the other hand, the backwardness of logistics infrastructure in Central Asia and Mongolia-Russia needs to be improved fundamentally by relying on the financial and technical support of the BRI investment institutions like the Asian Infrastructure Investment Bank (AIIB) and Silk Road Fund.

7. Conclusions

Under the background of the dual-circulation development, strengthening the construction of domestic logistics is not only conducive to realizing the free and orderly flow of domestic economic factors, but also promotes the balancing of the coordinated development of China’s three regions. Meanwhile, the strengthening is also beneficial to enhance China’s economic and trade ties with the countries along the BRI and to drive the building of a global community with a shared future for mankind. Taking the 65 countries as the research object, this paper firstly built the index system of the provincial logistics development level of China, secondly discussed the spatial-temporal evolution pattern of the trade between China provinces and countries along the BRI, then utilized the improved gravity model system to analyze the impact of the logistics development level on the bilateral trade. The main research conclusions are as follows:
(1)
The overall logistics development level of China had a steady upward trend from 2008 to 2018, with an increase of 47.07%. Besides, the logistics development level of the western region was significantly higher than that of the central and eastern regions, with an increase of 77.16%.
(2)
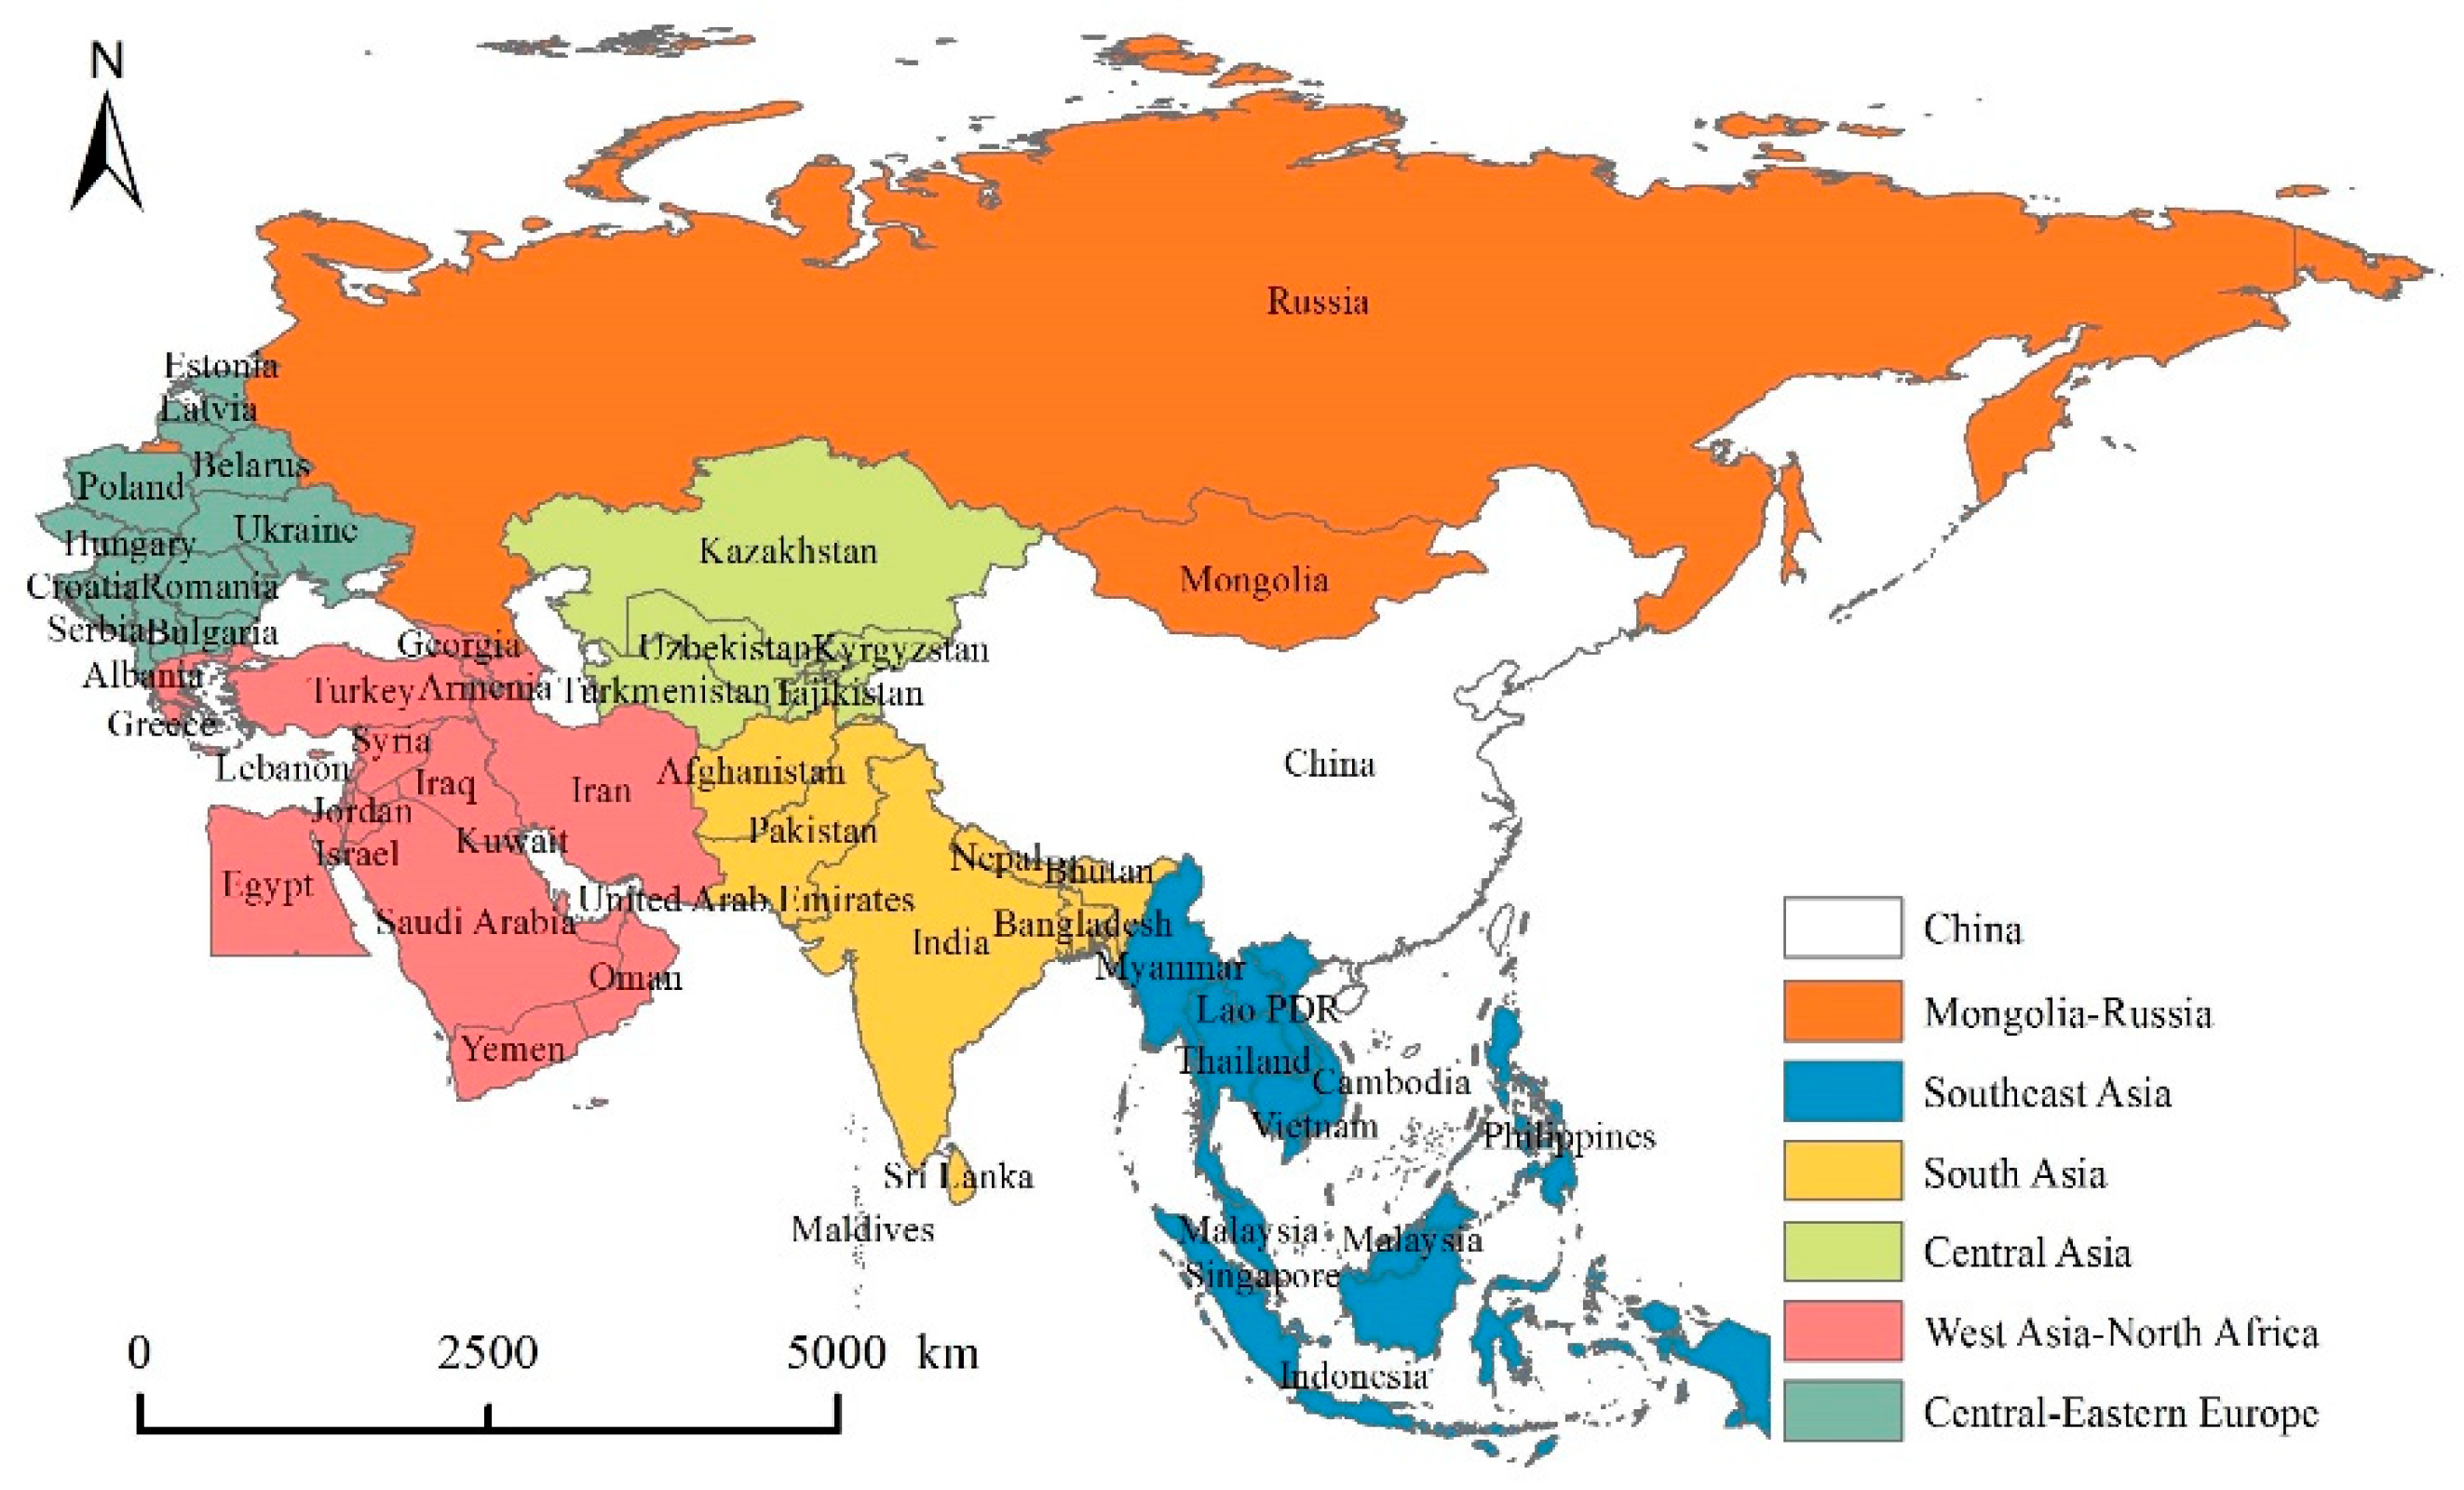
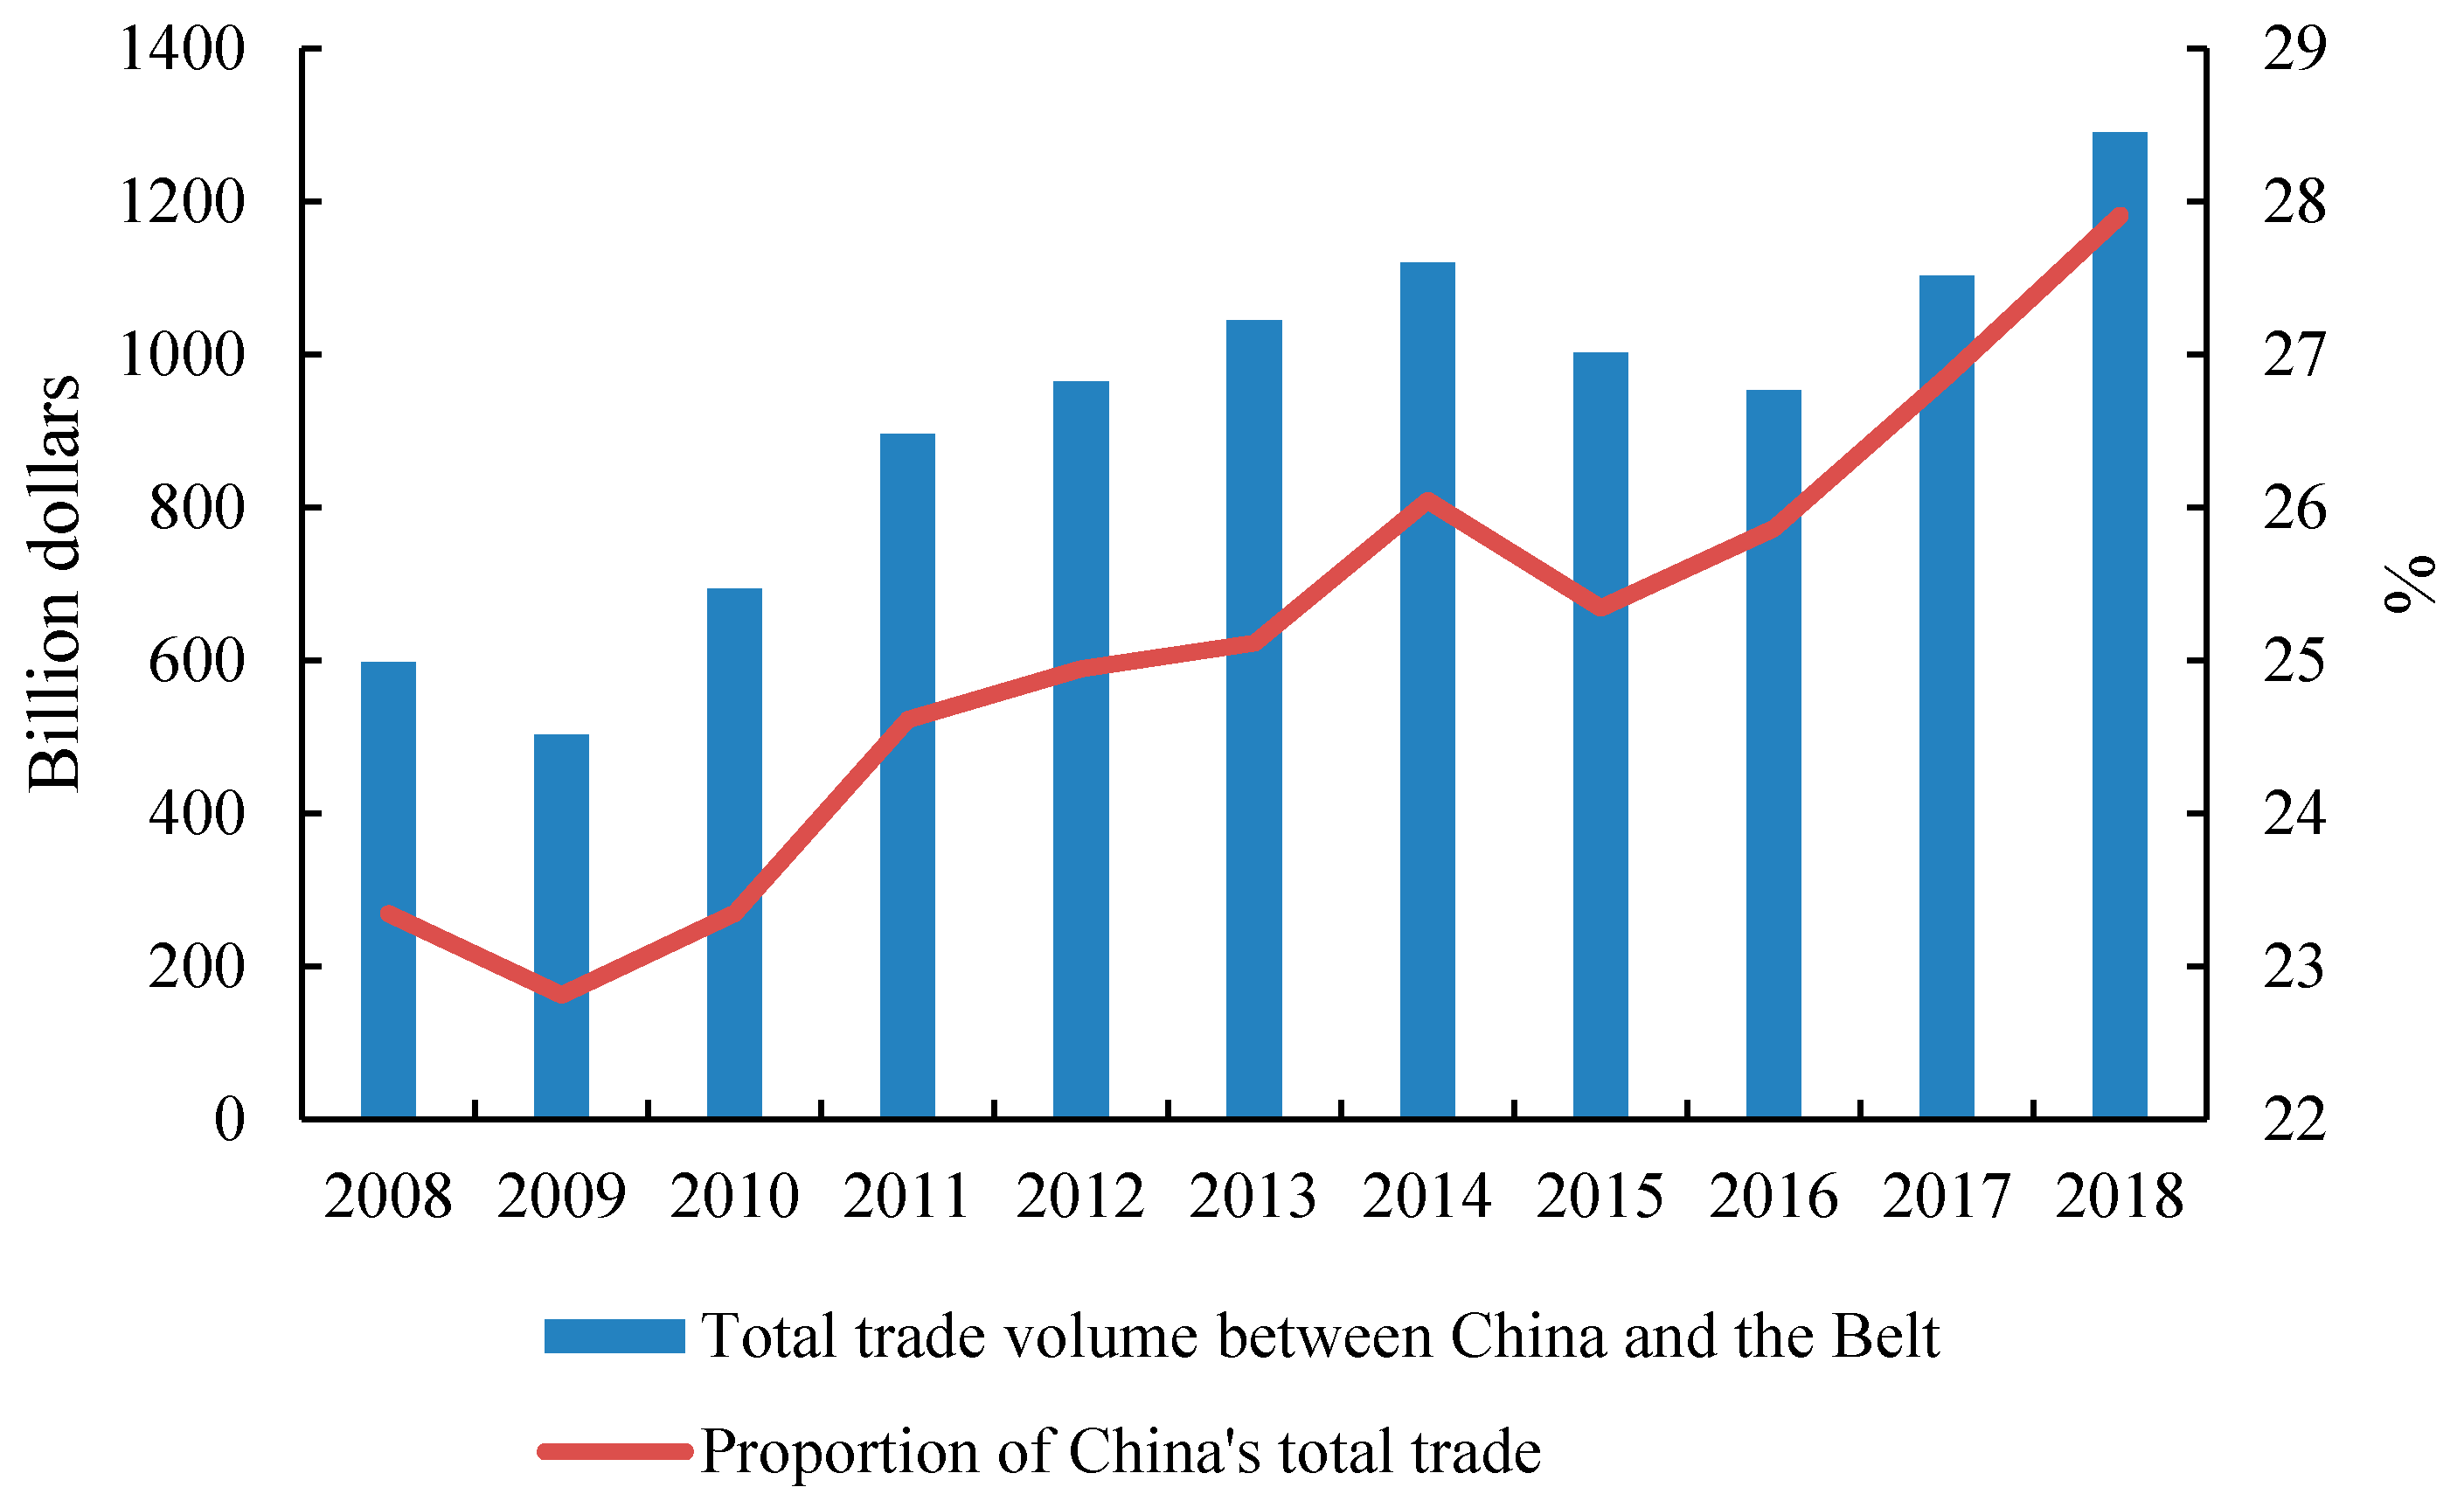
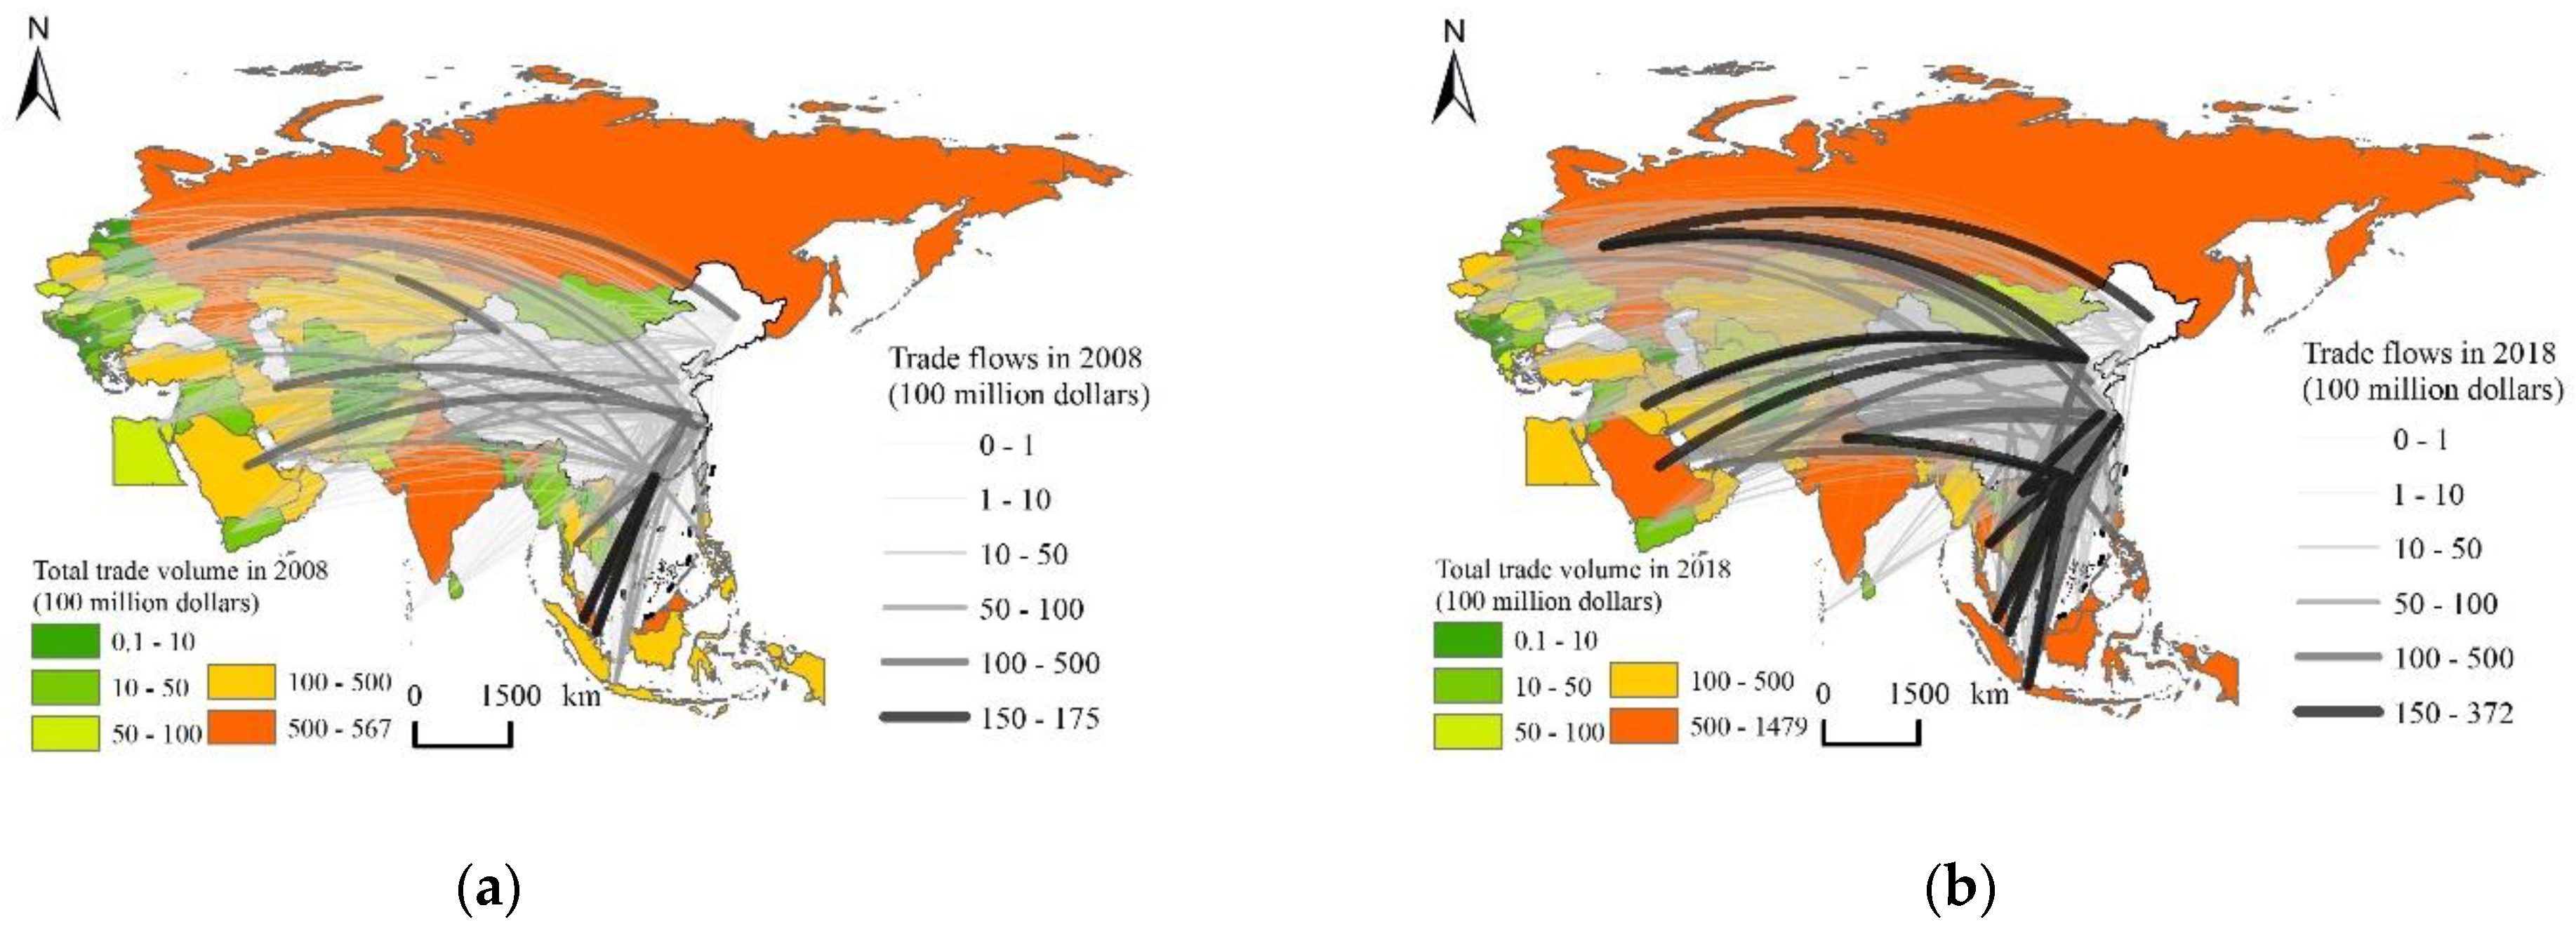
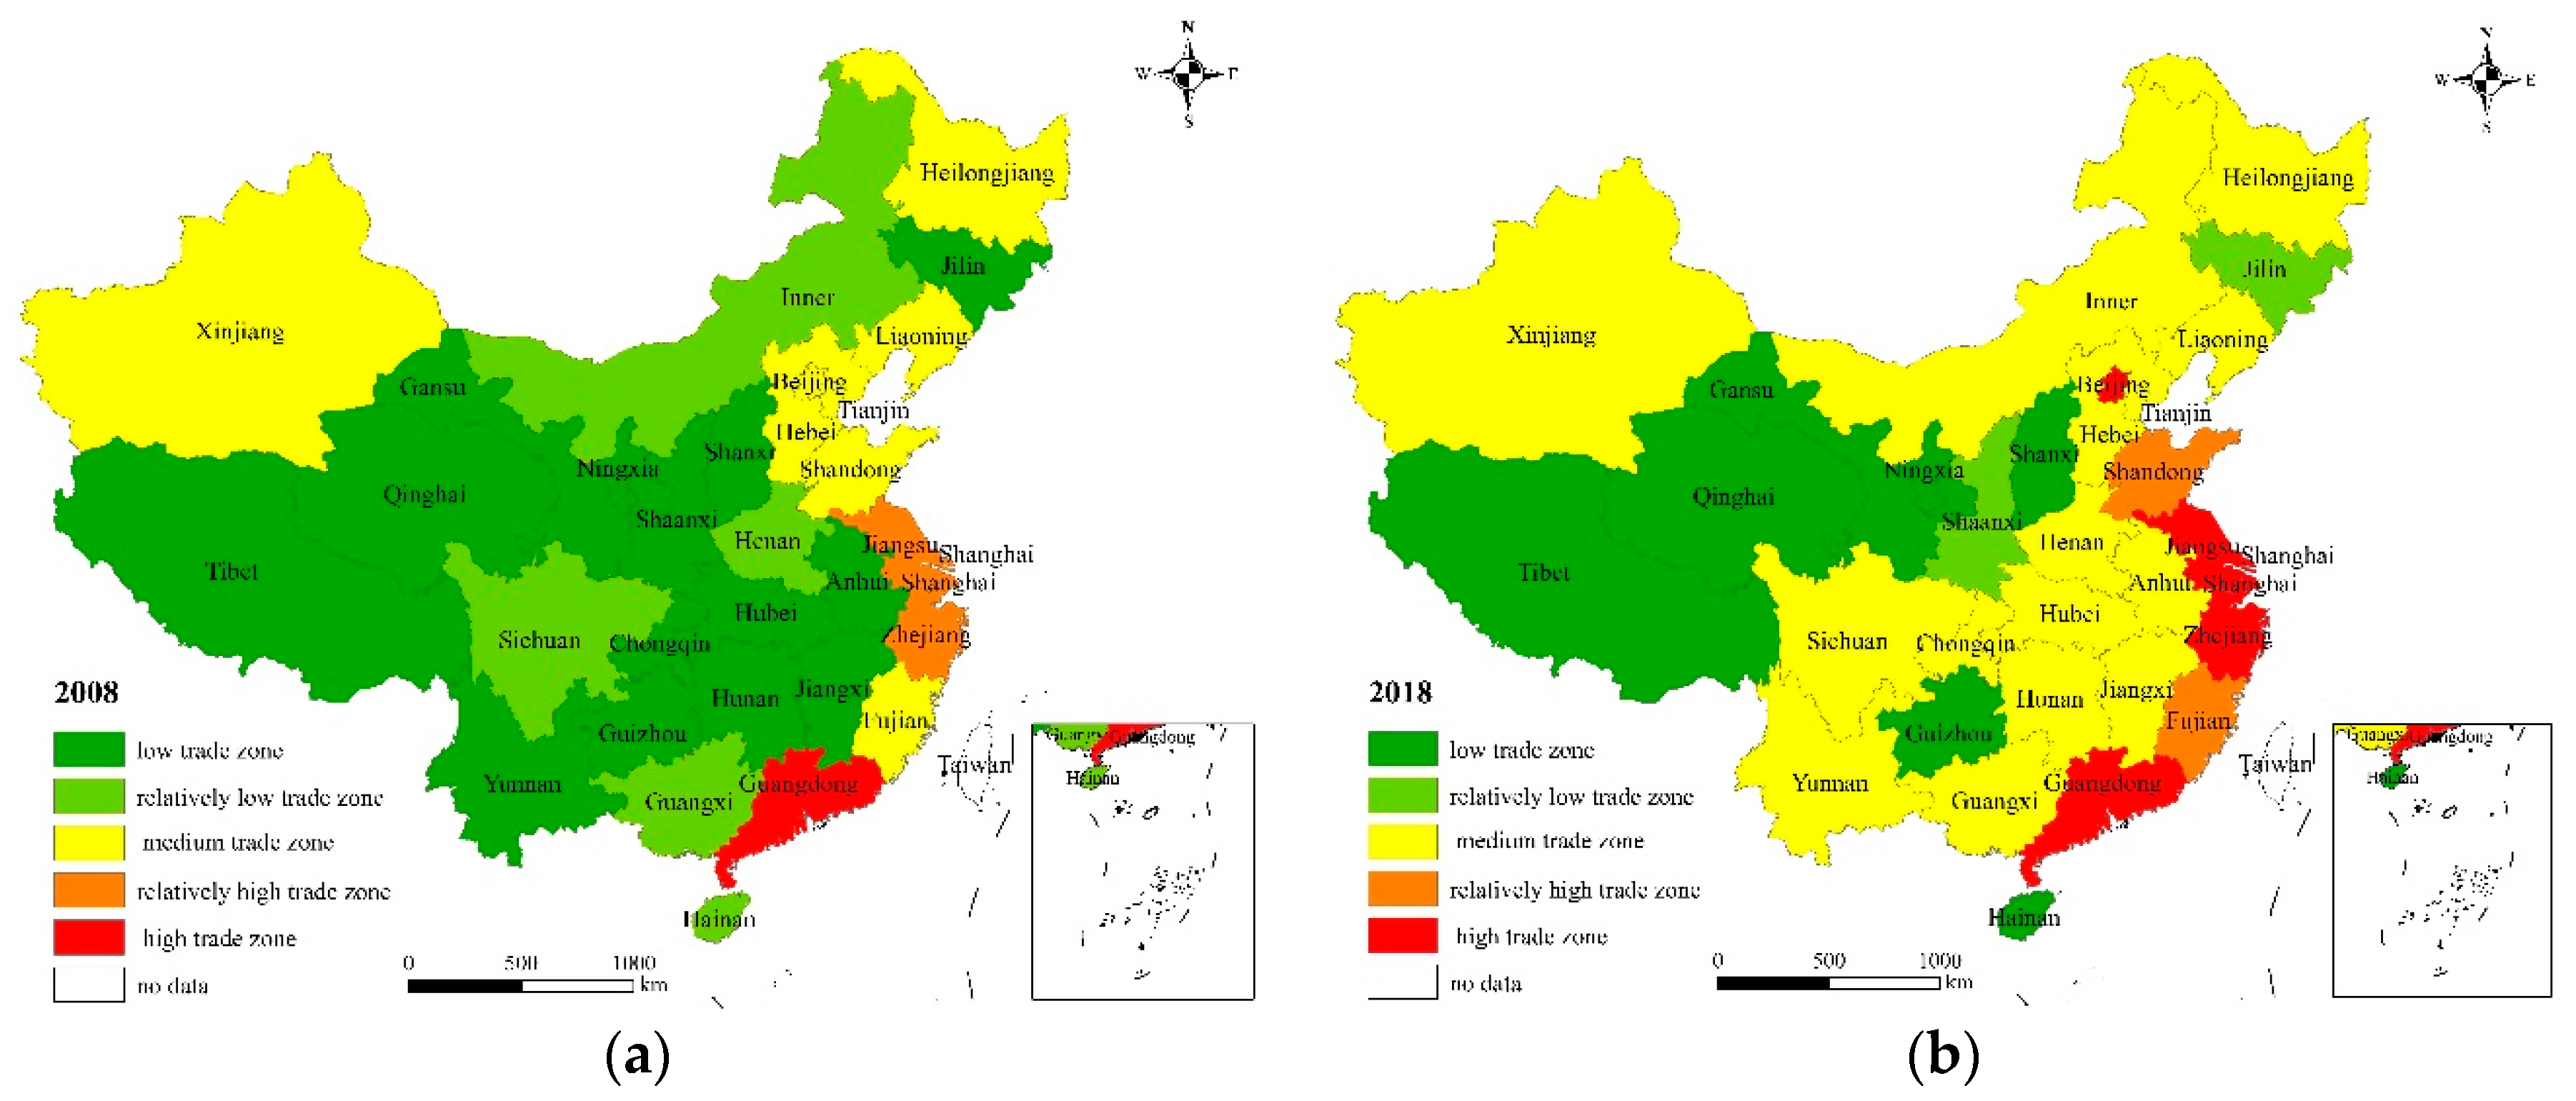
The trade between China and countries along the BRI generally showed a “W” type fluctuating upward trend, and the breadth and intensity of trade connections were significantly enhanced. Domestically, the total trade volume between China and countries along the BRI presented the trend of decreasing from the east to the west, with Beijing, Shanghai, Guangdong, and other provinces as the core. Internationally, the descending order of the total trade volume was Southeast Asia, West Asia-North Africa, South Asia, Mongolia-Russia, Central-Eastern Europe, and Central Asia.
(3)
The logistics development level significantly promoted the growth of the bilateral trade between China and countries along the BRI. However, compared with partner countries, the provincial logistics development level of China had a greater impact on trade.
(4)
The development level of logistics can significantly reduce the border effect, with a declining range of 20.547%.
(5)
The influence of logistics development level was different in different periods as well as international and domestic regions. The level was higher after the proposal of the BRI than that before the proposal of the BRI. Besides, the descending order of the level in the three regions was the eastern region, the central region, and the western region. And the descending order of the level in international regions was Southeast Asia, West Asia-North Africa, South Asia, Mongolia-Russia, Central-Eastern Europe, and Central Asia.
In this paper, the evaluation system of the provincial logistics development level is decomposed into three subsystems: regional economic support, logistics infrastructure, and logistics operation development, which is conductive to clarifying the key elements of provincial logistics development and highlighting the role of logistics organization and regional integrated service, and has a certain reference significance for relevant studies. However, the evaluation system of the provincial logistics development level involves many indicators, and there are some difficulties in data collection and unification. Therefore, the evaluation index system needs to be supplemented and improved in future research.
Different from the existing research results on a national scale, the provincial logistics development level has a more obvious impact on bilateral trade, and the effects of logistics trade in eastern, central and western regions shows huge differences. In the follow-up research, we should strengthen the research on the spatial effect of the provincial logistics development level, the interaction between the subsystems and its mechanism to bilateral trade, so as to further summarize the mechanism and law of spatial interaction in international trade research.
Finally, logistics development level is not significant in some models, especially for the eastern and central regions in China. Overall, in international logistics, transport costs is more important than physical distance, especially for inland areas. In this paper, we use the physical distance rather than transport costs which may cause the logistics trade effects are not significant in some inland areas.

Author Contributions

X.C. conceived and designed the research, W.M. wrote the paper, and J.L. provided some useful advice. All authors have read and agreed to the published version of the manuscript.

Funding

This research was funded by the National Science Foundation of China (No.41831284).

Institutional Review Board Statement

Not applicable.

Informed Consent Statement

Not applicable.

Data Availability Statement

The data presented in this study are available and can be found from statistical yearbooks and databases. The source of data are described in Section 3.3. In addition, some important data are contained within Table 2, Table 5 and Table 6.

Acknowledgments

Thanks to the hard-working editors and valuable comments from reviewers.

Conflicts of Interest

The authors declare no conflict of interest.

References

  1. Wang, M.L.; Qiu, Q.; Choi, C.H. How Will the Belt and Road Initiative Advance China’s Exports? Asia Pac. Bus. Rev. 2019, 25, 81–99. [Google Scholar] [CrossRef]
  2. Wen, Y.Z.; Lu, M.Q.; Li, X.J.; Che, B.Q.; Meng, D.Y.; Shi, Y.W. The Characteristics and Organizational Models of the West Circulation Network Based on the Western Corridor. Acta. Geogr. Sinica 2019, 74, 1205–1223. (In Chinese) [Google Scholar]
  3. Lian, F.; He, Y.Z.; Yang, Z.Z. Competitiveness of the China-Europe Railway Express and Linner Shipping under the Enforced Sulfur Emission Control Convention. Transport. Res. E-Log 2020, 135, 101861. [Google Scholar] [CrossRef]
  4. Chen, Y.; Lu, C.; Sheng, L.; Liu, Y. High-Quality Development of China Railway Express Based on Win-Win Co-construction. Chin. J. Eng. Sci. 2020, 22, 125–131. [Google Scholar] [CrossRef]
  5. Kundu, T.; Sheu, J.-B. Analyzing the Effect of Government Subsidy on Shippers’ Mode Switching Behavior in the Belt and Road Strategic Context. Transp. Res. Part E Logist. Transp. Rev. 2019, 129, 175–202. [Google Scholar] [CrossRef]
  6. Yang, Z.Z.; Sun, Y.; Lee, P.T.W. Impact of the Development of the China-Europe Railway Express-a Case on the Chonqing International Logistics Center. Transport. Res. A-Pol 2020, 136, 244–261. [Google Scholar]
  7. Wei, H.; Lee, P.T.-W. Designing a Coordinated Horizontal Alliance System for China’s Inland Ports with China Railway Express Platforms along the Silk Road Economic Belt. Transp. Res. Part E Logist. Transp. Rev. 2021, 147, 102238. [Google Scholar] [CrossRef]
  8. Wang, J.; Jiao, J.; Ma, L. An Organizational Model and Border Port Hinterlands for the China-Europe Railway Express. J. Geogr. Sci. 2018, 28, 1275–1287. [Google Scholar] [CrossRef] [Green Version]
  9. Xu, Y.M. Development Status, Challenges and Suggestions of CR Express in the Context of High-Quality Development. Inter-trade 2020, 5, 28–34. (In Chinese) [Google Scholar]
  10. Bensassi, S.; Márquez-Ramos, L.; Martinez-Zarzoso, I.; Suárez-Burguet, C. Relationship between Logistics Infrastructure and Trade: Evidence from Spanish Regional Exports. Transp. Res. Part A Policy Pr. 2015, 72, 47–61. [Google Scholar] [CrossRef]
  11. Limao, N.; Venables, A.J. Infrastructure, Geographical Disadvantage and Transport Costs. World Bank. Econ. Rev. 2001, 15, 451–479. [Google Scholar] [CrossRef]
  12. Martínez-Zarzoso, I.; García-Menéndez, L.; Suárez-Burguet, C. Impact of Transport Costs on International Trade: The Case of Spanish Ceramic Exports. Marit. Econ. Logist. 2003, 5, 179–198. [Google Scholar] [CrossRef]
  13. Baier, S.L.; Bergstrand, J.H. The Growth of World Trade: Tariffs, Transport Costs, and Income Similarity. J. Int. Econ. 2001, 53, 1–27. [Google Scholar] [CrossRef]
  14. Hummels, D.L.; Schaur, G. Time as a Trade Barrier. Am. Econ. Rev. 2013, 103, 2935–2959. [Google Scholar] [CrossRef] [Green Version]
  15. Nordas, H.K. Time as a Trade Barrier: Implications for Low-Income Countries. OECD. Econ. Stud. 2006, 42, 137–167. [Google Scholar] [CrossRef] [Green Version]
  16. Djankov, S.; Freund, C.; Pham, C.S. Trading on Time. Rev. Econ. Stat. 2010, 92, 166–173. [Google Scholar] [CrossRef]
  17. Longo, R.; Sekkat, K. Economic Obstacles to Expanding Intra-African Trade. World Dev. 2004, 32, 1309–1321. [Google Scholar] [CrossRef]
  18. Egger, P.; Larch, M. Interdependent Preferential Trade Agreement Memberships: An Empirical Analysis. J. Int. Econ. 2008, 76, 384–399. [Google Scholar] [CrossRef]
  19. Clark, X.; Dollar, D.; Micco, A. Port Efficiency, Maritime Transport Costs, and Bilateral Trade. J. Dev. Econ. 2004, 75, 417–450. [Google Scholar] [CrossRef] [Green Version]
  20. Alderighi, M.; Gaggero, A.A. Fly and Trade: Evidence from the Italian manufacturing Industry. Econ. Transp. 2017, 9, 51–60. [Google Scholar] [CrossRef]
  21. Behar, A.; Manner, P. Logistics and Exports. Department of Economics and CSAE Working Paper Series; University of Oxford: Oxford, UK, 2008. [Google Scholar]
  22. Puertas, R.; Martil Garcia, L. Logistics Performance and Export Competitiveness: European Experience. Empirica 2014, 41, 467–480. [Google Scholar] [CrossRef]
  23. Çelebi, D. The Role of Logistics Performance in Promoting Trade. Marit. Econ. Logist. 2019, 21, 307–323. [Google Scholar] [CrossRef]
  24. Huang, W.X.; Gong, X.S. Empirical Analysis on Impact of International Logistics Performance of Silk-Road Economic Belt on China’s Export of Machinery and Electronic Productions. J. Int. Trade 2014, 10, 56–66. (In Chinese) [Google Scholar]
  25. Feng, Z.Q.; Liu, W.J. The Impact of Logistics Performance on the China’s Export Ternary Margins of Machinery and Transport Equipment. J. Ind. Tech. Econ. 2019, 1, 49–57. (In Chinese) [Google Scholar]
  26. Zhao, S.S.; Li, H.S. Influence of Logistics Level of Countries along the “Silk Road Belt” to National Trade of Xinjiang. Arid. Land. Geogr. 2017, 40, 897–905. (In Chinese) [Google Scholar]
  27. Srisawat, P.; Kronprasert, N.; Arunotayanun, K. Development of Decision Support System for Evaluating Spatial Efficiency of Regional Transport Logistics. Transp. Res. Procedia 2017, 25, 4832–4851. [Google Scholar] [CrossRef]
  28. Zhang, H.; You, J.; Haiyirete, X.; Zhang, T. Measuring Logistics Efficiency in China Considering Technology Heterogeneity and Carbon Emission through a Meta-Frontier Model. Sustainability 2020, 12, 8157. [Google Scholar] [CrossRef]
  29. Zheng, W.; Xu, X.; Wang, H. Regional Logistics Efficiency and Performance in China along the Belt and Road Initiative: The Analysis of Integrated DEA and Hierarchical Regression with Carbon Constraint. J. Clean. Prod. 2020, 276, 123649. [Google Scholar] [CrossRef]
  30. Tinbergen, J. Shaping the World Economy: Suggestions for International Economic Policy; The Twentieth Century Incorporate: New York, NY, USA, 1962. [Google Scholar]
  31. Anderson, J.E. A Theoretical Foundation for the Gravity Equation. Am. Econ. Rev. 1979, 69, 106–116. [Google Scholar]
  32. Bergstrand, J.H. The Gravity Equation in International Trade: Some Microeconomic Foundations and Empirical Evidence. Rev. Econ. Stat. 1985, 67, 474. [Google Scholar] [CrossRef]
  33. Bergstrand, J.H. The Generalized Gravity Equation, Monopolistic Competition, and the Factor-Proportions Theory in International Trade. Rev. Econ. Stat. 1989, 71, 143. [Google Scholar] [CrossRef]
  34. The Development Research Center of the State Council Information Network. Available online: http://www.drcnet.com.cn/www/int/ (accessed on 5 October 2020).
  35. Wei, S.-J. Intra-National versus International Trade: How Stubborn are Nations in Global Integration; National Bureau of Economic Research: Cambridge, MA, USA, 1996. [Google Scholar]
  36. Novy, D. Gravity Redux: Measuring International Trade Costs with Panel Data. Econ. Inq. 2012, 51, 101–121. [Google Scholar] [CrossRef] [Green Version]
  37. Poncet, S. Measuring Chinese Domestic and International Integration. China Econ. Rev. 2003, 14, 1–21. [Google Scholar] [CrossRef]
  38. China Free Trade Area Service Network. Available online: http://fta.mofcom.gov.cn/ (accessed on 5 October 2020).
  39. The World Bank Group World Development Indicators, DataBank. Available online: http://databank.worldbank.org/data/reports.aspx?source=world-development-indicators (accessed on 8 October 2020).
  40. National Bureau of Statistics of China. China Statistical Yearbook (2009–2019); China Statistics Press: Beijing, China, 2008–2018. (In Chinese)
  41. China Communications and Transportation Association. China Transportation Yearbook (2009–2019); People’s Communication Press: Beijing, China, 2008–2018. (In Chinese) [Google Scholar]
  42. Zhang, Z.X.; Huang, H.R.; Lin, L. Analysis on Trade Relationship and Potential between China and West Asian Countries along “the Belt and Road”. East. China. Econ. Manag. 2019, 33, 13–19. (In Chinese) [Google Scholar]
  43. Liu, S.L.; Hu, A.G. Transportation Infrastructure and Regional Economic Integration in China. Econ. Res. J. 2011, 3, 73–83. (In Chinese) [Google Scholar]
  44. Liang, S.L.; Zhang, M. The Influence of Infrastructure Interconnectivity on the Border Effect of Trade between China and Its Neighboring Countries. Asia-Pacific. Econ. Rev. 2016, 1, 101–106. [Google Scholar]
  45. Helliwell, J.F. Do National Border Borders Matter for Quebec’s Trade? Can. J. Econ. 1996, 26, 507–522. [Google Scholar] [CrossRef]
Figure 1. Grouping of countries along the BRI.
Sustainability 13 02107 g001
Figure 2. Evolution trend of total trade volume between China with countries along the BRI.
Sustainability 13 02107 g002
Figure 3. Trade network between China’s provinces with countries along the BRI from 2008 to 2018. (a) 2008, (b) 2018.
Sustainability 13 02107 g003
Figure 4. Spatial distribution of total trade volume between China’s provinces with countries along the BRI from 2008 to 2018. (a) 2008, (b) 2018.
Sustainability 13 02107 g004
Table 1. Comprehensive evaluation index system of logistics development level.
SystemSubsystemIndexIndex InterpretationWeight
Comprehensive evaluation index system of logistics development levelRegional economic supportEconomic developmentGDP per capita0.0754
Industrial structureValue added by the secondary and tertiary industries/GDP0.0154
Investment levelTotal investment in fixed assets/GDP0.0435
Consumption levelTotal retail sales of consumer goods/GDP0.0386
OpennessTotal import and export/GDP0.1989
Logistics infrastructureTransport infrastructureMileage of highway, railway and waterway /Land area0.0768
Postal infrastructurePostal outlets/Population0.1147
Internet penetrationNumber of internet users/Population0.0437
Telephone penetrationMobile phone ownership/Population0.0457
Logistics operation and developmentLogistics freight scaleFreight volume of highway, railway, waterway and aviation/land area0.1889
Logistics output scaleValue added by transportation, storage and post/GDP0.0481
Logistics employment scaleEmployment in transportation, storage and post/Total employment0.0415
Logistics investment scaleInvestment in transportation, storage and post/ Total investment in fixed assets0.0687
Table 2. Evolution trend of the logistics development of China.
ProvinceArea20082009201020112012201320142015201620172018
BeijingEastern0.4540.4020.4420.4560.4570.4530.4460.4120.4080.4100.437
TianjinEastern0.3290.3410.3480.3410.3610.3590.3690.3670.3680.3740.377
HebeiEastern0.1540.1700.1890.1870.1950.2090.2190.2250.2310.2320.244
ShanxiCentral0.1650.1860.1910.1910.2010.2090.2210.2420.2480.2490.253
InnerWestern0.1320.1500.1600.1590.1710.1890.1970.1930.2090.2190.217
LiaoningEastern0.2000.1980.2130.2160.2280.2440.2540.2570.2700.2790.279
JilinCentral0.1340.1410.1510.1470.1570.1620.1710.1890.1970.2110.215
HeilongjiangCentral0.1290.1390.1470.1430.1440.1540.1660.1760.1880.2000.209
ShanghaiEastern0.6180.5470.6030.6130.5860.5730.5820.6150.6080.6940.628
JiangsuEastern0.2670.2570.2860.2920.2970.2910.3030.3020.3060.3240.332
ZhejiangEastern0.2390.2400.2600.2670.2760.2840.2980.3190.3230.3830.390
AnhuiCentral0.1580.1550.1660.1700.1880.2210.2360.2410.2520.2700.274
FujianEastern0.2090.2100.2280.2310.2420.2590.2640.2820.2860.3010.308
JiangxiCentral0.1310.1390.1480.1430.1520.1700.1800.1870.2010.2170.216
ShandongEastern0.2020.2080.2280.2350.2460.2430.2500.2570.2700.2990.312
HenanCentral0.1390.1430.1540.1630.1800.1880.2000.2120.2280.2370.255
HubeiCentral0.1620.1700.1880.1710.1810.2000.2140.2340.2500.2670.277
HunanCentral0.1390.1580.1600.1580.1640.1770.1850.1950.2030.2160.227
GuangdongEastern0.3190.3030.3270.3240.3370.3620.3560.3630.3560.3680.373
GuangxiWestern0.1210.1340.1440.1440.1540.1620.1740.1880.1980.2070.222
HainanEastern0.1520.1650.1690.1700.1790.1960.2150.2320.2350.2390.254
ChongqingWestern0.1940.2050.2180.2260.2350.2630.2850.2870.2940.3120.326
SichuanWestern0.1140.1310.1360.1390.1510.1640.1880.1950.2120.2230.235
GuizhouWestern0.1430.1580.1680.1700.1720.1900.1990.2120.2180.2290.242
YunnanWestern0.1000.1070.1280.1180.1160.1330.1480.1560.1720.1950.206
TibetWestern0.1340.1240.1490.1520.1590.1600.1660.2030.2260.2270.236
ShaanxiWestern0.1340.1460.1520.1530.1560.1680.1860.2040.2190.2360.245
GansuWestern0.1060.1120.1170.1220.1290.1340.1530.1680.1860.1890.194
QinghaiWestern0.1150.1190.1210.1090.1260.1620.1710.1830.1960.2080.214
NingxiaWestern0.1270.1400.1520.1530.1650.1780.1970.2020.2140.2100.209
XinjiangWestern0.1280.1210.1210.1210.1330.1540.1640.1770.1740.1950.197
average
CV
0.1890.1910.2050.2060.2140.2260.2370.2480.2560.2720.277
0.5790.4890.5000.5130.4730.4230.3910.3680.3360.3600.320
Eastern average0.2860.2770.2990.3030.3090.3160.3230.3300.3330.3550.358
Central average0.1450.1540.1630.1610.1710.1850.1970.2100.2210.2330.241
Western average0.1290.1370.1470.1470.1560.1710.1860.1970.2100.2210.229
Table 3. List of countries along the BRI.
RegionCountry
Mongolia-RussiaRussia(*), Mongolia(*);
Southeast AsiaSingapore(√), Malaysia(√), Indonesia(√), Myanmar(√), Thailand(√), Lao PDR(*), Cambodia(√), Vietnam(√), Brunei Darussalam(√), Philippines(√);
South AsiaIndia(√), Pakistan(√), Bangladesh(√), Afghanistan(*), Sri Lanka(√), Maldives(√), Nepal(*), Bhutan(*);
Central AsiaKazakhstan(*), Uzbekistan(*), Turkmenistan(*), Tajikistan(*), Kyrgyzstan(*);
West Asia-North AfricaIran(√), Iraq(√), Turkey(*), Syria(*), Jordan(*), Lebanon(*), Israel(*), Palestine(*), Saudi Arabia(√), Yemen(√), Oman(√), United Arab Emirates(√), Qatar(√), Kuwait(√); Bahrain(√), Greece(√), Cyprus(√), Egypt(√), Azerbaijan(*), Armenia(*), Georgia(*);
Central-Eastern EuropePoland(*), Lithuania(*), Estonia(*), Latvia(*), Czech(*), Slovakia(*), Hungary(*), Slovenia(*), Croatia(*), Bosnia and Herzegovina(*), Montenegro(*), Serbia(*), Romania(*), Bulgaria(*), North Macedonia(*), Albania(*), Ukraine(*), Belarus(*), Moldova(*);
Note: * indicates that the country belongs to the countries along the “Silk Road Economic Belt” and √ indicates that the country belongs to the countries along the “21st Century Maritime Silk Road”.
Table 4. Statistics of trade flows between China’s provinces with countries along the BRI from 2008 to 2018.
Type20082018
Trade FlowsProportionTrade FlowsProportion
<$100 million152175.48132265.6
$100 million–$1 billion 35917.8246222.93
$1 billion–$5 billion1065.261658.19
$5 billion–$10 billion200.99351.74
$10 billion–$15 billion70.35180.89
>$15 billion20.1130.65
Table 5. Evolution trend of total trade volume between China’s three regions with countries along the BRI from 2008 to 2018.
YearTotal Trade Volume ($1 Billion)CV
EasternCentralWesternEasternCentralWestern
2008504.4742.1251.820.820.661.41
2009432.7531.2939.560.840.631.15
2010594.9945.0954.270.810.561.12
2011760.2562.6773.450.790.641.11
2012801.9869.7992.950.790.631.09
2013863.2874.62106.630.830.551.09
2014911.3785.29123.670.890.541.02
2015828.8476.2796.660.900.360.94
2016797.8070.5084.920.930.360.95
2017902.8380.08120.140.900.380.95
20181030.27105.43154.380.780.400.96
Table 6. Evolution trend of total trade volume between sub-regions along the BRI and China from 2008 to 2018.
YearMongolia-RussiaSoutheast AsiaSouth AsiaCentral AsiaWest Asia-
North Africa
Central-Eastern Europe“Belt” Region“Road” Region
200859.17231.0765.4730.82163.7348.15172.00426.41
200941.10212.9356.8323.74128.9640.03127.96375.64
201058.92292.7980.4730.13179.0852.97173.70520.65
201185.53362.3996.9937.75249.0164.69228.24668.12
201294.01400.0692.9745.95267.6764.07245.64719.08
201395.10443.1293.2050.27268.3894.45290.41754.11
2014100.75480.08106.0342.95319.6870.84264.36855.98
201573.19466.58111.1632.60253.0165.23216.60785.16
201673.85447.65112.7330.15221.8866.96214.27738.95
201790.58518.66126.9336.27249.9780.64255.94847.11
2018115.07587.72139.1241.70297.8793.73301.42973.79
Table 7. Estimation of overall results.
VariableStandard Equation
(Model 1)
Add LDL
(Model 2)
Add Domestic
(Model 3)
Add LDL and Domestic
(Model 4)
2000–2018
(Model 5)
2000–2012
(Model 6)
2013–2018
(Model 7)
lnGDPi0.883 ***0.707 ***0.854 ***0.684 ***0.679 ***0.667 ***0.807 ***
lnGDPj0.662 ***0.590 ***0.637 ***0.599 ***0.587 ***0.554 ***0.620 ***
lnDij−1.254 ***−1.267 ***−0.807 ***−0.843 ***−0.743 ***−0.785 ***−0.777 ***
LDLi 4.053 *** 4.002 ***3.987 ***4.210 ***4.606 ***
LDLj 1.546 *** 0.831 ***0.619 ***0.714 ***0.971 ***
Domestici 4.172 ***3.942 ***4.441 ***4.180 ***4.293 ***
Coastj 0.099 ***0.078 ***0.086 ***
FTAij 0.242 ***0.114 ***0.282 ***
Cons−0.595 ***−0.294 ***−4.167***−3.590 ***−4.374 ***−3.498 ***−5.832 ***
R20.6390.6800.6810.7160.7170.7200.746
Note: *** indicates the significance at 1% level; Since logistics performance index published by the World Bank is between 1–5, LDLj is converted to between 0–1 through extreme value standardization to facilitate the comparison with the LDLi.
Table 8. Estimation of domestic division.
VariableEastern Region
(Model 8)
Central Region
(Model 9)
Western Region
(Model 10)
lnGDPi0.874 ***0.414 ***0.445 ***
lnGDPj0.836 ***0.578 ***0.384 ***
lnDij−0.827 ***−0.811 ***−0.859
LDLi1.190 ***0.207−0.222
LDLj1.254 ***0.641 ***0.433 ***
Domestici2.273 ***4.742 ***5.051 ***
Coastj0.305 ***0.003−0.026
FTAij0.199 ***1.179 ***0.110 ***
Cons−5.931 ***−1.089 ***0.275 ***
R20.8020.7870.687
Note: *** indicates the significance at 1% level.
Table 9. Estimation of international division.
VariableMongolia-Russia
(Model 11)
Southeast Asia
(Model 12)
South Asia
(Model 13)
Central Asia
(Model 14)
West Asia-North African
(Model 15)
Central-Eastern Europe
(Model 16)
“Belt” Region
(Model 17)
“Road” Region
(Model 18)
lnGDPi0.976 ***0.886 ***0.530 ***0.623 ***0.687 ***0.472 ***0.523 ***0.905 ***
lnGDPj−0.1120.650 ***0.467 ***0.321 ***0.583 ***0.545 ***0.548 ***0.667 ***
lnDij−0.306 ***−0.781 ***−0.269 ***−1.066 ***−0.0600.688 ***−0.715 ***−0.542 ***
LDLi0.4334.286 ***2.351 ***0.1624.068 ***4.073 ***3.089 ***5.049 ***
LDLj−0.2731.525 ***2.161 ***1.987 ***0.494 ***−0.554 ***0.325 ***0.736 ***
Domestici7.440 ***3.953 ***5.995 ***3.324 ***6.964 ***10.127 ***4.669 ***5.030 ***
Coastj3.586 ***0.163 **0.316 *** 0.174 ***0.115 ***0.147 ***
FTAij 0.197 *** −0.247 * −0.124 **0.499 ***
Cons−5.302−6.370 ***−7.046 ***0.970−10.581 ***−15.225 ***−2.865 ***−8.701 ***
R20.9030.8570.9050.8860.7720.8550.7380.778
Note: * indicates the significance at 10% level, ** indicates the significance at 5% level, *** indicates the significance at 1% level.
Publisher’s Note: MDPI stays neutral with regard to jurisdictional claims in published maps and institutional affiliations.

