Abstract
In this research, a study is carried out on the differences between tourism start-ups in relation to intangibles, economic and financial sustainability, by region and by sector of activity, in order to determine their sustainability both in a situation of economic crisis and growth, In the study carried out in this article, the tourist startups are identified, by branch of activity (hotels, restaurants, transport and travel agencies) with identification of intangibles in their balance sheet. Once identified, a descriptive analysis of the incorporation of intangibles, economic sustainability and financial sustainability, by branch of activity and community, is developed. This analysis is completed with an analysis of variance to determine if there is a relationship between intangible and branches of tourism and region; economic sustainability and branches of tourism and region; financial sustainability and branches of tourism and region. The conclusions of the work show that parameters such as investment in intangibles, economic sustainability and financial sustainability are key variables in crisis situations such as the current one.
1. Introduction
During the 21st century, the business sector has undergone and is still undergoing changes, both from an external and internal point of view, encouraged fundamentally by great technological shifts [1]. These changes have generated a wide range of opportunities [2,3] accompanied by no fewer risks, a situation that must be managed to maximize opportunities and minimize risks [4,5].
Therefore, for the company to be able to create wealth in this new environment (maximize opportunities–minimize risks), it must have a great capacity for adaptability and interdisciplinarity.
Opportunities arise as a consequence of the technological revolution—the change from traditional to renewable energies and globalization.
Among the technological changes, we can highlight: artificial intelligence, big data, blockchain, processes of creating new materials, cloud computing, etc. [6]. An important part of these technological changes have a high incidence in the tourism sector [7,8,9,10]. Technological changes together with globalization allow us to reach new markets and more global markets in a much more efficient way, allowing a high potential for wealth creation. These three elements: technology, energy and globalization are characterized by the importance of the intangible in them.
Among the new risks, the following stand out: information security (cybersecurity) and contagion (financial contagion and pandemics).
In the first months of 2020, the risks have been increased by the COVID-19 pandemic, which has attacked the health and economic system with a harshness that few could imagine. The fact is that this pandemic has led to the closure of many businesses and an unprecedented global crisis. In order for companies to withstand this strong attack, it is important that they are able to differentiate, adapt and have a greater capacity for economic and financial sustainability [11].
This has unequally affected the different economic sectors that make up a country’s economic activity. In this article, we will focus on one of the most heavily attacked sectors, such as the tourism sector in its earliest stages [12], in addition to being considered one of the most important sectors within the Spanish market [13,14]. In this study, special emphasis is placed on the tourism sector due to its importance in the Spanish market and, within this sector, on tourism start-ups, as it is one of the sectors most affected by the current crisis. Therefore, we analyze the differences between tourism start-ups in relation to intangibles, economic and financial sustainability, by region and by sub-sector of activity, in order to determine the position of these start-ups both to face a situation of crisis and to take advantage of opportunities in a situation of growth. In this way, the variables can be summarized in two large blocks: innovation and sustainability.
Innovation and intangibles have an important effect on the performance of companies in general [15,16,17,18], and in the tourism sector in particular—this effect is much greater in start-ups. This result can be verified with a brief reading of several of the reports published by the World Economic Forum referring to the competitiveness of the sector and intangibles and/or innovation as one of the key factors [19]; moreover, several publications confirm this [20]. There are several studies that demonstrate the positive effect of intangibles on the performance and value of the company [21,22]. In addition, other authors affirm that the intangible has a very positive effect on the hotel industry, and on the profitability and value of the tourism sector [23,24]. Therefore, it is important that intangibles are accounted for in the financial statements and, thus, are easier to identify by the different external agents related to the company [20].
Most of the studies are focused on companies in the tourism sector with a long history and dimension, but there are few studies that study the relationships between tourism start-ups and intangibles, and those where start-ups are related to intangibles do not focus in the tourism sector [25,26].
Sustainability is a very broad concept. We are going to focus on business sustainability [27,28] as measured by economic and financial sustainability. Financial sustainability determines the economic structure of the company and dependence on external resources; financial sustainability is evaluated through the relationship between external resources (ER) and own resources (OR). Economic sustainability represents the company’s ability to generate income and value through its ordinary activity; economic sustainability is measured through the relationship between Earning Before Interests, Taxes, Depreciations, Amortization (EBITDA)/Active.
Thus, in this paper, we intend to analyze tourism start-ups that incorporate intangible assets. We will focus on the relationship between the intangibles, economic and financial sustainability, and the tourism sector subsectors (hotels, restaurants, travel agencies and transport) in different Spanish regions, in order to see the capacity for flexibility and overcoming the crisis caused by the COVID-19 [29]. Sustainability from the point of view of the activity through EBITDA and financing through leverage are fundamental variables for the creation of wealth and survival of the company, fundamental elements to fight in a period of crisis such as the scenario that is posed to us by COVID-19. Therefore, after introducing our topic, we will present a literary review of the concept of intangible and sustainability, in order to continue with the methodology based on a descriptive analysis and analysis of variance of a factor and end up with the conclusions and future extensions of the work.
2. Literature Review
The studies carried out are classified into two types: intangible assets and intellectual capital. The term “intangible assets” is commonly used to refer “only to those investments of an intangible nature that, according to accounting standards, may be recognized as assets and, therefore, may be reflected in the company’s balance sheet” [30].
From the definition of intangible asset, two conditions associated with accounting recognition are evident: the identifiability characteristic and compliance with the conditions corresponding to all assets, and control by the company as a result of past events and expectation of future economic benefits [31].
Regardless of the foregoing, the International Accounting Standards Board’s (IASB) definition (International Accounting Standards Board), as for most of those provided by the accounting doctrine, goes beyond a conceptualization, since it also involves requirements for the intangible to be recognized as an asset, which limit the scope of the concept, leaving out of the definition a wide variety of elements which make up the intellectual capital of companies.
Furthermore, “intellectual capital” has general meanings. It can be stated that intellectual capital refers to the set of interrelated intangible elements, among which the most important is the available knowledge, both at the individual level and organizational level. These elements are, to a certain extent, hidden, because in the financial statements they are not prepared on the basis of the regulations in force [32,33,34].
In this paper, we will focus on the intangible. Thus, as various studies point out, intangible assets are key factors in the creation of knowledge, innovation and economic growth [17,35,36,37].
On the other hand, we are going to study the term sustainability. This concept is very broad and can be seen from different points of view. In general, the United Nations (UN) World Commission on Environment and Development (WCED) explains it as follows: a company with sustainable development is one “that meets the needs of the present without compromising the ability of future generations to meet their own needs”; the UN states, in the Guide to Corporate Sustainability of the UN Global Compact Programme that a company must ensure five aspects to be sustainable: to act responsibly, in accordance with universal principles; to encourage actions that support society; to commit to the sustainability of a company’s foundation at the highest level; to publish annual reports of its achievements and efforts; to encourage involvement with the local communities of which it is a part.
Talking about sustainability in business is talking about development based on three fundamental axes: economic, environmental and social [38,39]. A sustainable business model is one that allows innovation and sustainability to be coordinated. Lüdeke-Freund (2010) describes a sustainable business model as the one that creates value through its client portfolio, contributing to the sustainable development of the company and society [40]. Stubbs and Cocklin (2008) state that sustainable business models must seek to connect shareholders and the company’s effect on the environment and society [41].
There are a large number of works that study the relationship between economic and environmental/social sustainability [42,43,44], highlighting Moore, 2001 [45] McGuire, 1998 [46] and Mahajan, 2015 [47], which study a positive relationship between these variables. Among those who see a negative relationship is Preston, 1997 [48] and those who see a neutral relationship is Mc William, 2001 [49].
In this article, we will focus on the sustainability of the business using ratios that measure the profitability of the activity (EBITDA/Assets) and the financial situation (External Resources/Own Resources), which are within more than 600 indicators that are contemplated in the Dow Jones Sustainability Index [50] and in the Institute for the Support of Small and Medium-Sized Enterprises. These indicators allow us to see the degree of sustainability from the activity of the company and from its level of financing, which are two key variables for the company to create value and be more sustainable.
Finally, we will focus on start-ups and micro-enterprises in the tourism sector. After a literature review, we can see that there are few studies on sustainability in small and micro-enterprises, since most of the literature focuses on medium and large companies that produce social responsibility reports [51].
3. Study and Analysis
In this section, we will identify companies created since 2012 (the last official data we have is from 2018, so we work with a population from 2012 to 2018, in which the average life of this population is 2 years, the maximum life of a start-up), which incorporate intangibles in their balance sheet (the intangible is where innovation is recognized in accounting terms), and belong to the tourism sector in the communities where most companies have been created in recent years. To develop this section, we have used the Iberian Balance Sheet Analysis System (“SABI”) database (a database marketed by the company Informa, SA and developed by Bureau van Dijk, which records the financial statements of more than 2,700,000 companies that make up the Spanish business market).
In companies in general, and in the start-ups of the tourism sector in particular, the recognition of the intangible generates a series of tangible and intangible benefits [52,53] which help improve business sustainability, from the point of view of activity and financing.
3.1. Method of Analysis
In order to apply the method of analysis, a group of companies had to be selected in accordance with the following conditions:
- (a)
- Companies created since January 2012.
- (b)
- Companies in the tourism sector. National Classification of Economic Activities (“CNAE”) codes: 4932, 4939, 5030, 5510, 5520, 5530, 5590, 5610, 5621, 5629, 5630, 7911, 7912, 7990. These codes, within the tourism sector, correspond to the following subsectors: hotels, restaurants, travel agencies and transportation.
- (c)
- Communities where more companies have been created in recent years.
- (d)
- Independent and non-participating companies.
- (e)
- Active companies with sufficient information.
- (f)
- Micro-enterprises.
- (g)
- Companies with intangible assets recorded in, at least, one of the last five years.
Firstly, the variables must be defined: investment in intangible assets, sustainability of the activity and sustainability of the financing through a series of ratios, in order to be able to relate them to the factors region and activity through the selected method. Investment in intangible assets is identified through the ratio which measures the importance of intangible assets over non-current assets. The sustainability of the activity is related to a ratio that measures economic efficiency, a profitability ratio, EBITDA/Assets. We study the sustainability of financing through a ratio that represents the financial dependence of the company, the leverage ratio, and external resources and equity.
Secondly, once the factors and variables have been selected, we will define the procedure that we will develop in our study. The first step is to carry out a descriptive analysis that will allow us to check whether we can anticipate some differences between the intangible, economic sustainability and financial sustainability with respect to the region and sector factors.
Third, the analysis of variance method is used to check for significant differences between variables and factors, an ANOVA for the region and an ANOVA for the sector.
The application of the ANOVA requires the development of a series of tests that will justify, or not, the result of the ANOVA.
Once the analysis of the variance has been completed and assuming that the impact of the sector and regional factors on investment in intangible assets, the sustainability of the activity and the sustainability of the financing are contrasted, we must complete this statistical test with the multiple comparison test, in order to identify which group is different and with respect to which of the other groups there are significant differences.
3.2. Descriptive Analysis
In Spain, since 2012, in the selected regions, a total of 45,094 companies in the tourism sector have been created and are still active. Only 1652 of them (3.6%) incorporate intangibles in their balance sheet. The study has eliminated the start-ups that are born with a stake in other companies because they have a different economic and financial structure in volume and proportion to that of a normal start-up. Thus, the study addresses 1652 to 684 (those that meet all the requirements), which once again shows how the recognition of intangible assets in the balance sheet by companies in general, and in the tourism sector in particular, is very low, which means a loss of opportunities for the company, from the point of view of image and the capacity to obtain more financing.
The distribution of the number of companies by tourism subsectors and regions is shown in Figure 1.
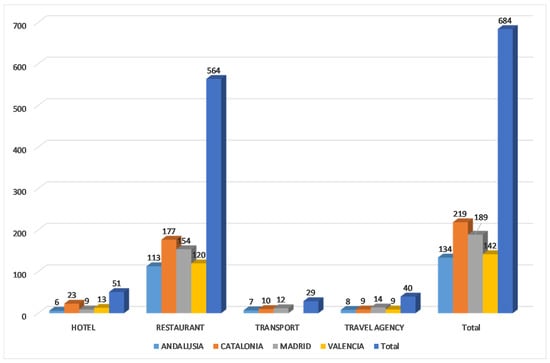
Figure 1.
Number of companies created in the tourism sector with intangibles according to activity and region. Source: Own elaboration.
In this case, we can see that the number of companies that incorporate intangible assets is highest in Madrid and Catalonia, with Valencia and Andalusia being very close. Within the tourism sector, restaurants and hotels have been the most created.
On the other hand, in the following tables, we analyze the incorporation of intangibles, the sustainability of the activity measured through the relationship between EBITDA/Assets and the financial sustainability represented in the leverage ratio.
In Table 1, we can see that within the tourism sector, transport and travel agencies are the most intangible in relation to investment in non-current assets and, by region, Catalonia and Madrid stand out.

Table 1.
Intangible Fixes Assets/Fixes Assets (average) in the tourism sector with intangibles according to activity and region.
In Table 2, we analyze the sustainability of the activity, through the profitability of the activity, with Andalusia and transport being the most profitable region and activity. It should be noted that the situation of the hotel sector is undermined by the situation in Catalonia with negative profitability of over 11%.
Table 2.
EBITDA/ASSET (average) in the tourism sector with intangibles according to activity and region.
Finally, Table 3 shows the sustainability of the financing, with Andalusia and the hotels being the region and activity with the least financial risk and a more balanced financial structure. Valencia and restaurants are the region and sector with the worst figures, with external financing being 15 and 4 times higher than own resources, respectively.
Table 3.
EXTERNAL RESOURSES/OWN RESOURSES (average) in the tourism sector with intangibles according to activity and region.
3.3. Analysis of Variance of Intangible Assets, Sustainability of the Activity and Sustainability of the Financing by Activity Region and Sector
Following the established method, it is verified that the descriptive study does not clearly confirm the existence of differences between investment in intangibles, sustainability of the activity and financing of start-ups in the tourism sector, depending on the sector and region to which they belong. Therefore, other, more robust statistical techniques should be used to check whether or not such differences exist.
In this way, it is checked if the selected variables have a different behavior in each region or sector by applying ANOVA.
This method is selected because it is more appropriate in the financial accounting area when it is desired to determine the relationship between accounting policies and external factors [54,55,56]. ANOVA allows determining the relationship between the variables under study and the selected factors.
This method has also been used in other studies applied to Spanish companies depending on the activity sector and size [57,58] and to the tourism sector [59].
In the study, we have two factors—sector and region—and three dependent variables—investment in intangible assets/non-current assets, the sustainability of the activity (EBITDA/Assets), and the sustainability of the financing (External Resources/Equity Resources). Thus, to contrast the possible differences, an ANOVA is developed for the region factor and an ANOVA for the sector factor.
3.3.1. Model Assumptions
The hypotheses tested are:
- Ha0: No changes in investment in intangible assets of tourism companies according to the region to which they belong.
- Ha1. With variations in the investment in intangible assets of tourism companies according to the region to which they belong.
- Hb0: No changes in the sustainability of the activity of tourism companies according to the region to which they belong.
- Hb1. With variations in the sustainability of the activity of tourism companies according to the region to which they belong.
- Hc0: No changes in the sustainability of the financing of tourism companies according to the region to which they belong.
- Hc1. With variations in the sustainability of the financing of tourism companies according to the region to which they belong.
In relation to the sector:
- Hd0: No changes in the investment in intangible assets of tourism companies according to the sector to which they belong.
- Hd1. With variations in investment in intangible assets of tourism companies according to the sector to which they belong.
- He0: No changes in the sustainability of the activity of tourism companies according to the sector to which they belong.
- He1. With variations in the sustainability of the activity of tourism companies according to the sector to which they belong.
- Hf0: No changes in the sustainability of the financing of tourism companies according to the sector to which they belong.
- Hf1. With variations in the sustainability of the financing of tourism companies according to the sector to which they belong.
Mateja studies the relationship between intangibles and the hotel sector in Croatia and Slovenia, and establishes results on the effect of intangibles following a series of hypotheses [22]. On the other hand, Francesco Capone studies the profitability of assets by applying ANOVA in the hotel sector [60]. Wagner also applies ANOVA to determine the relationship between intangibles and various financial indicators, including return on assets [61].
When analyzing the sustainability of financing, and more specifically the leverage ratio, several authors apply ANOVA and apply different hypotheses to this indicator. Rajan and Zingales [62], Palacín y Jiménez [57], Genç [63], among other authors, study the relationship between the debt ratio, size and sector, with Palacín’s study standing out in this study due to the importance of the relationships in small and medium-sized enterprises (SME).
3.3.2. ANOVA
As already mentioned in the section “procedure”, before applying the ANOVA, the necessary tests must be carried out to justify the application of the ANOVA. The analysis of variance ANOVA requires that the dependent variable presents normal distribution (normality) and homogeneity of variances (homoscedasticity), requirements that are not necessary in non-parametric contrasts.
- Normality. According to the Kolmogorov–Smirnov test, the hypothesis of normality is not accepted (Table 4 and Table 5), since its level of significance is less than 5%. It is only accepted in the investment of intangibles in the transport sector where the level of significance is 20%. Despite the fact that normality is not met, the Central Limit Theorem says that the results of parametric contracts when the sample is large enough, as in this case, are still robust.
Table 4.
Tests of Normality (sector).
Table 4.
Tests of Normality (sector).
| Sector | Kolmogorov–Smirnov a | Shapiro–Wilk | |||||
|---|---|---|---|---|---|---|---|
| Statistic | df | Next | Statistic | df | Next | ||
| Intangible assets/Fixed assets | Hotel | 0.289 | 51 | 0.000 | 0.691 | 51 | 0.000 |
| Restaurant | 0.168 | 564 | 0.000 | 0.849 | 564 | 0.000 | |
| Transport | 0.133 | 29 | 0.200 * | 0.915 | 29 | 0.023 | |
| Travel Agency | 0.153 | 40 | 0.019 | 0.882 | 40 | 0.001 | |
| Ebitda/Asset | Hotel | 0.324 | 51 | 0.000 | 0.401 | 51 | 0.000 |
| Restaurant | 0.191 | 564 | 0.000 | 0.723 | 564 | 0.000 | |
| Transport | 0.265 | 29 | 0.000 | 0.802 | 29 | 0.000 | |
| Travel Agency | 0.249 | 40 | 0.000 | 0.694 | 40 | 0.000 | |
| External resources/Own resources | Hotel | 0.330 | 51 | 0.000 | 0.706 | 51 | 0.000 |
| Restaurant | 0.410 | 564 | 0.000 | 0.107 | 564 | 0.000 | |
| Transport | 0.263 | 29 | 0.000 | 0.843 | 29 | 0.001 | |
| Travel Agency | 0.396 | 40 | 0.000 | 0.370 | 40 | 0.000 | |
* This is a lower bound of the true significance, a Lilliefors Significance Correction. Source: Own elaboration.
Table 5.
Tests of Normality (region).
Table 5.
Tests of Normality (region).
| Region | Kolmogorov–Smirnov a | Shapiro–Wilk | |||||
|---|---|---|---|---|---|---|---|
| Statistic | df | Next | Statistic | df | Next | ||
| Intangible assets/Fixed assets | Andalusia | 0.220 | 134 | 0.000 | 0.779 | 134 | 0.000 |
| Madrid | 0.156 | 189 | 0.000 | 0.873 | 189 | 0.000 | |
| Catalonia | 0.146 | 219 | 0.000 | 0.871 | 219 | 0.000 | |
| Valencia | 0.202 | 142 | 0.000 | 0.816 | 142 | 0.000 | |
| Ebitda/Asset | Andalusia | 0.189 | 134 | 0.000 | 0.749 | 134 | 0.000 |
| Madrid | 0.215 | 189 | 0.000 | 0.686 | 189 | 0.000 | |
| Catalonia | 0.212 | 219 | 0.000 | 0.610 | 219 | 0.000 | |
| Valencia | 0.215 | 142 | 0.000 | 0.759 | 142 | 0.000 | |
| External resources/Own resources | Andalusia | 0.231 | 134 | 0.000 | 0.718 | 134 | 0.000 |
| Madrid | 0.442 | 189 | 0.000 | 0.149 | 189 | 0.000 | |
| Catalonia | 0.309 | 219 | 0.000 | 0.484 | 219 | 0.000 | |
| Valencia | 0.437 | 142 | 0.000 | 0.103 | 142 | 0.000 | |
a Lilliefors Significance Correction. Source: Own elaboration.
- Homoscedasticity. It is the following test that performed and determines the equality of variances of the dependent variables, this test is performed using Leven’s statistic. In the study, this test is only fulfilled for some variables related to both the region and sector factor, and the variables that fulfill the test are those that have a significance level higher than 5% (Table 6 and Table 7).
Table 6.
Test of Homogeneity of Variances (sector). Compares variability < 5% robust tests.
Table 6.
Test of Homogeneity of Variances (sector). Compares variability < 5% robust tests.
| Levene Statistic | df1 | df2 | Next | ||
|---|---|---|---|---|---|
| Ebitda/Asset | Based on mean | 2.776 | 3 | 680 | 0.041 |
| Based on median | 1.868 | 3 | 680 | 0.134 | |
| Based on median and with adjusted df | 1.868 | 3 | 595.501 | 0.134 | |
| Based on trimmed mean | 2.157 | 3 | 680 | 0.092 | |
| External re-sources/Own resources | Based on mean | 0.532 | 3 | 680 | 0.661 |
| Based on median | 0.312 | 3 | 680 | 0.817 | |
| Based on median and with adjusted df | 0.312 | 3 | 564.626 | 0.817 | |
| Based on trimmed mean | 0.323 | 3 | 680 | 0.809 | |
| Intangible as-sets/Fixed assets | Based on mean | 2.720 | 3 | 680 | 0.044 |
| Based on median | 2.911 | 3 | 680 | 0.034 | |
| Based on median and with adjusted df | 2.911 | 3 | 667.897 | 0.034 | |
| Based on trimmed mean | 3.217 | 3 | 680 | 0.022 | |
Source: Own elaboration.
Table 7.
Test of Homogeneity of Variances (region).
Table 7.
Test of Homogeneity of Variances (region).
| Levene Statistic | df1 | df2 | Next | ||
|---|---|---|---|---|---|
| Ebitda/Asset | Based on mean | 1.999 | 3 | 680 | 0.113 |
| Based on median | 1.185 | 3 | 680 | 0.315 | |
| Based on median and with adjusted df | 1.185 | 3 | 637,084 | 0.315 | |
| Based on trimmed mean | 1.434 | 3 | 680 | 0.232 | |
| Shareholders fund/Liabilities | Based on mean | 3.967 | 3 | 680 | 0.008 |
| Based on median | 1.173 | 3 | 680 | 0.319 | |
| Based on median and with adjusted df | 1.173 | 3 | 207,927 | 0.321 | |
| Based on trimmed mean | 1.202 | 3 | 680 | 0.308 | |
| Intangible as-sets/Fixed assets | Based on mean | 1.570 | 3 | 680 | 0.195 |
| Based on median | 1.827 | 3 | 680 | 0.141 | |
| Based on median and with adjusted df | 1.827 | 3 | 634,022 | 0.141 | |
| Based on trimmed mean | 1.786 | 3 | 680 | 0.148 | |
Source: Own elaboration.
Thus, it is possible to observe that, for the sector factor only, the sustainability of the financing meets the Levene test with a level of significance above 5%, and for the region factor the sustainability of the activity and the investment in intangibles meets the Levene test with a level of significance above 5%. Therefore, we have to apply ANOVA to these variables (Table 8 and Table 9) and to the others we have to perform the robust Brown-Forsythe tests.
Table 8.
ANOVA (sector).
Table 9.
ANOVA (region).
Once the ANOVA has been applied, we can see that for the sector factor, the sustainability of the financing presents the same averages and there are no significant differences, so the Hf0 hypothesis is fulfilled: This means that in tourism start-ups the sustainability of financing does not differ significantly depending on the sector.
For the region factor, the sustainability of the activity presents equality of averages and there are no significant differences, so the Hb0 hypothesis is fulfilled: No changes in the sustainability of the activity of tourism companies according to the region to which they belong, since the level of significance is higher than 5%. Regarding investment in intangibles by region if differences are observed, so the Ha1 hypothesis is fulfilled: With variations in the investment in intangible assets of tourism companies according to the region to which they belong.
Once we have seen the ANOVA, as we have already pointed out, we have to apply Brown–Forsythe robust tests to those variables that have not passed the Levene test (Table 10 and Table 11).
Table 10.
Robust Tests of Equality of Means (sector).
Table 11.
Robust Tests of Equality of Means (region).
The application of Brown–Forsythe robust tests shows us that, according to the sector factor, the sustainability of the activity has a level of significance higher than 5% (Table 10), there is equality of averages and there are no significant differences between the sustainability of the activity and the sector, so the He0 hypothesis is fulfilled: No changes in the sustainability of the activity of tourism companies according to the sector to which they belong. Regarding the investment in intangible assets, there are significant differences (significance level less than 5%) and the Hd1 hypothesis is fulfilled: With variations in the investment in intangible assets of tourism companies according to the sector to which they belong.
When it comes to the region factor, the robust Brown–Forsythe evidence applied to the sustainability of the financing gives us a level of significance above 5% (Table 11), there is equality of averages and no significant differences between the sustainability of the financing and the sector, so the Hf0 hypothesis is fulfilled: No changes in the sustainability of the financing of tourism companies according to the sector to which they belong.
Finally, in those variables where we do not assume equality of variances, we have to apply multiple comparisons and, in particular, the Games–Howell test. Thus, after our analysis, we can say that there is no equality of variances in the investment in intangible assets, so there are significant differences between it both in the region and in the sector.
Thus, the results of the multiple comparisons of the investment in intangibles variable in relation to the sector and region factors are shown in Table 12, Table 13 and Table 14.
Table 12.
Multiple Comparisons (sector).
Table 13.
Differences for the sector factor (Games-Howell).
Table 14.
Multiple Comparisons (region).
From the results obtained in Table 12 and Table 13, it can be concluded that the sector factor influences the investment in intangibles of tourist start-ups.
Next, the groups of companies where the differences in variances are significant are identified. This is done by applying multiple comparison tests, also called post hoc tests, and the Games–Howell method is used for this purpose.
After applying the Games–Howell method it can be said that, in relation to the sector factor, that tourism start-ups act significantly differently in the hotel sector with respect to restaurants, transport and travel agencies (with a lower investment in intangible assets of 11.37%, 36.6% and 20.5%, respectively). Restaurants show a higher investment in intangible assets than hotels by 11.3% and a lower investment than transport by 25%. The transport sector shows significant differences with hotels and restaurants with a higher intangible investment of 36.6% and 25.3%, respectively. Finally, travel agencies present significant differences only with hotels, with a higher volume of investment in intangible assets of 20.5%.
Just as Table 12 and Table 13 showed us the multiple differences between the sector factor and the intangible investment variable of the tourism start-ups, Table 14 and Table 15 show us the multiple differences between the region factor and the intangible investment variable of the tourism start-ups. In this case, the differences between investment in intangible assets and regions are less significant than in the sectors, with the greatest difference between Andalusia and Catalonia, being an investment in intangible assets in Catalonia 10.8% higher.
Table 15.
Differences according to the region factor (Games-Howell).
4. Conclusions
In a crisis situation, we are going through the investment in intangible assets (which translates into innovation), the sustainability of the activity and the sustainability of the financing become key pieces for survival and achieving an increase in value [64,65,66,67]. Within this framework, the tourism sector is one of the most affected by COVID-19 and within it, start-ups. Thus, in this article, we have identified situations that can make companies in this sector more capable of fighting in this scenario [68,69].
In general, and according to the study, we can see that the number of tourism start-ups that incorporate intangible assets is very low [70,71] and, within this sector, transport companies and travel agencies are those who recognize the most intangible assets, with an investment of 55% and 39%, respectively, in non-current assets. Catalonia is the region where most intangible assets are recognized.
From the point of view of the sustainability of the activity, transport and hotels are the sectors with the best figures and, as far as regions are concerned, Andalusia is the one with the best indicator, with the rest offering negative returns.
In various reports of the World Economic Forum [21] it is possible to find a positive relationship between intangibles and competitiveness. Likewise, Mateja [22] in his work reaches several conclusions regarding intangibles in the hotel sector:
- -
- There is a relationship between intangibles and profitability.
- -
- The best hotels do not always incorporate intangibles in their balance sheets.
- -
- When intangible assets are incorporated, the company’s profit and equity are improved.
From the point of view of the sustainability of the financing, the hotel sector and the Andalusian region offer the best figures, with lower financial risk and greater financing capacity, in the same way they are observed in works developed in general by authors such as Mazagatos and Haro [72,73] and, in particular, in relation to the tourism and hotel sector by authors such as Blasco and Moya and Pacheco and Tavares [74,75].
On the other hand, Palacín and Jiménez conclude that there is a dependence between indebtedness and company size for each sector of activity [67]. However, other authors such as Rajan and Zingales are not clear about this conclusion [72].
In particular, through an analysis of variance we can obtain the following results by comparing factors and variables.
According to the investment in intangible assets, there are significant differences both in terms of the sector and the region to which they belong. Regarding the sector, hotels recognize the least amount of intangible assets, while transport, travel agencies and restaurants recognize 36%, 20% and 11% more than hotels, respectively. Regarding the regions, only Andalusia and Catalonia show significant differences, with Catalonia recognizing 10% more than Andalusia.
According to the sustainability of the activity and the sustainability of the financing, once the corresponding tests have been applied, we conclude that there are no significant differences either by sector or by region.
When it comes to the future lines of research, we can see the effect that these variables have on the value of each of the sectors and perform a sensitivity analysis of these variables. On the other hand, when companies update their data, we will see what the effect of the COVID-19 has been and how these indicators have behaved.
Author Contributions
Conceptualization, M.T.-G.; Funding acquisition, J.G.-M.; Investigation, M.D.G.-G.; F.J.-N.; M.T.-G. and S.L.G.; Supervision, F.J.-N. These authors contributed equally to this work. All authors have read and agreed to the published version of the manuscript.
Funding
This research received no external funding.
Institutional Review Board Statement
Not applicable.
Informed Consent Statement
Not applicable.
Data Availability Statement
To develop this paper, we have used the Iberian Balance Sheet Analysis System (“SABI”) database (a database marketed by the company Informa, SA (https://www.informa.es/riesgo-empresarial/sabi, accessed on 14 January 2021) and developed by Bureau van Dijk, which records the financial statements of more than 2,700,000 companies that make up the Spanish business market). Source: Seville University Library
Acknowledgments
The authors appreciate the support provided by colleagues from the University of California Berkeley through a collaboration agreement signed by the University of Seville with the Sutardja Center for Entrepreneurship and Technology (SCET) (1 July 2019).
Conflicts of Interest
The authors declare no conflict of interest.
References
- Darcy, C.; Hill, J.; McCabe, T.J.; McGovern, P. A consideration of organisational sustainability in the SME context: A resource-based view and composite model. Eur. J. Train. Dev. 2014, 38, 398–414. [Google Scholar] [CrossRef]
- Knowles, J.; Ettenson, R.; Lynch, P.; Dollens, J. Growth Opportunities for Brands during the COVID-19 Crisis. MIT Sloan Manag. Rev. 2020, 61, 2–6. [Google Scholar]
- Qazi, A.; Dikmen, I.; Birgonul, M. Mapping Uncertainty for Risk and Opportunity Assessment in Projects. Eng. Manag. J. EMJ 2020, 32, 86–97. [Google Scholar] [CrossRef]
- Moeuf, A.; Lamouri, S.; Pellerin, R.; Tamayo-Giraldo, S.; Tobon-Valencia, E. Identification of critical success factors, risks and opportunities of Industry 4.0 in SMEs. Int. J. Prod. Res. 2020, 58, 1384–1400. [Google Scholar] [CrossRef]
- Cardoso, C. The contribution of tourism towards a more sustainable and inclusive society: Key guiding principles in times of crisis. Worldw. Hosp. Tour. Themes 2020, 12, 679–689. [Google Scholar] [CrossRef]
- Fundación Innovación Bankinter. Modelos de Negocios Disruptivos. Fundación Bankinter. 2018. Available online: https://www.fundacionbankinter.org/documents/20183/156075/Modelos+de+negocio+disruptivos_Resumen/ (accessed on 18 December 2020).
- Migliaccio, M.; Rivetti, F. Big Data in Tourism: A Look at the Literature. Int. Conf. Tour. Res. 2020. [Google Scholar] [CrossRef]
- Ardito, L.; Cerchione, R.; Del Vecchio, P.; Raguseo, E. Big data in smart tourism: Challenges, issues and opportunities. Curr. Issues Tour. 2019, 22, 1805–1809. [Google Scholar] [CrossRef]
- Önder, I.; Treiblmaier, H. Blockchain and tourism: Three research propositions. Ann. Tour. Res. 2018, 72, 180–182. [Google Scholar] [CrossRef]
- Samara, D.; Magnisalis, I.; Peristeras, V. Artificial intelligence and big data in tourism: A systematic literature review. J. Hosp. Tour. Technol. 2020, 11, 343–367. [Google Scholar] [CrossRef]
- Baikeli, X.; Mustafa Emre, C. Effects of COVID-19 on China and the World Economy: Birth Pains of the Post-Digital Ecosystem. J. Int. Trade Logist. Law 2020, 6, 147–157. [Google Scholar]
- Chang, C.; McAleer, M.; Ramos, V. A Charter for Sustainable Tourism after COVID-19. Sustainability 2020, 12, 3671. [Google Scholar] [CrossRef]
- Jon, S.; Francina, O.; Flemming, S. The innovative behaviour of tourism firms-Comparativestudies of Denmark and Spain. Res. Policy 2007, 36, 88–106. [Google Scholar]
- Rodríguez, X.; Rivadulla, R. Tourism in Spain: Disaggregated analysis of the international demand. Reg. Sect. Econ. Stud. 2012, 12, 77–82. [Google Scholar]
- Lev, B. Intangibles: Management, Measurement and Reporting; Brookings Institution Press: Washington, DC, USA, 2001. [Google Scholar]
- Lev, B.; Daum, J.H. The dominance of intangible assets: Consequences for enterprise management and corporate reporting. Meas. Bus. Excell. 2004, 8, 6–17. [Google Scholar] [CrossRef]
- Kramer, J.; Marinelli, E.; Iammarino, S.; Diez, J. Intangible assets as drivers of innovation: Empirical evidence on multinational enterprises in German and UK regional systems of innovation. Technovation 2020, 31, 447–458. [Google Scholar] [CrossRef]
- Torres, G.; Miguel, G.; Martín, J.; Jimenez, N.; Felix, G.; María, D.; Giesecke, S. Incorporation of the Intangibles into the Spanish Start-Ups by Activity Sector and Region. Improving Their Economic Sustainability. Sustainability 2020, 12, 4268. [Google Scholar] [CrossRef]
- World Economic Forum. The Travel & Tourism Competitiveness Report 2017; World Economic Forum: Geneva, Switzerland, 2017. [Google Scholar]
- Jerman, M.; Slavka, K. The significance of intangible assets: A comparative analysis of croatian and slovenian hotel industry. Tour. Hosp. Manag. 2010, 51–71. [Google Scholar]
- Gray, B.J.; Matear, S.M.; Matheson, P.K. Improving the performance of hospitality firms. Int. J. Hosp. Manag. 2000, 12, 149–155. [Google Scholar] [CrossRef]
- Hanran, L.; Wang, W. Impact of Intangible Assets on Profitability of Hong Kong Listed Information Technology Companies. Bus. Econ. Rev. 2014, 4, 98–113. [Google Scholar]
- Nemec Rudež, H.; Mihalič, T. Intellectual capital in the hotel industry: A case study from Slovenia. Hosp. Manag. 2007, 26, 188–199. [Google Scholar] [CrossRef]
- Mateja, J.; Sandra, J. The Importance of Intangible Assets in the Hotel Industry: The Case of Croatia and Slovenia. Sci. Ann. Econ. Bus. 2018, 65, 333–346. [Google Scholar] [CrossRef]
- Hochberg, Y.V.; Serrano, C.; Ziedonis, R. Entrepreneurship: Intangible but bankable. Science 2015, 348, 1202. [Google Scholar] [CrossRef]
- Steenkamp, N.; Kashyap, V. Importance and contribution of intangible assets: SME managers’ Perceptions. J. Intellect. Cap. Bradf. 2010, 11. [Google Scholar] [CrossRef]
- Guych, N.; Yu-Ping, W.; Jennet, A.; Bih-Shiaw, J.; Yi-Shien, Y.; Hsien-Tang, L.; Li-Fan, W. Blockchain Technology Adoption Behavior and Sustainability of the Business in Tourism and Hospitality SMEs: An Empirical Study. Sustainibility 2020, 12, 1256. [Google Scholar] [CrossRef]
- Grazia Chiara, E.; Gabriella, A.; Marco, V.; Stefano, P.; Francesco, P. Sustainability in Tourism as an Innovation Driver: An Analysis of Family Business Reality. Sustainability 2020, 12, 6149. [Google Scholar] [CrossRef]
- Calabuig, P.; Carrasco, J.M. Crisis económica, flexibilidad empresarial y nuevos modelos de negocio. Boletín Estud. Econ. 2012, 67, 443–462. [Google Scholar]
- Cañibano, L.; Sánchez, M.; García, M.; Chaminade, C. Directrices Para la Gestión y Difusión de Información Sobre Intangibles (Informe de Capital Intelectual); Proyecto Meritum; Fundación Airtel Móvil: Madrid, Spain, 2002. [Google Scholar]
- International Accounting Standards Board. Norma Internacional de Contabilidad N° 38: Activos Intangibles; IASB: London, UK, 2018. [Google Scholar]
- Edvinsson, L.; Malone, M. Intellectual Capital. Realizing Your Company’s True Value by Findings Its Hidden Brainpower; Harper Collins Publishers: New York, NY, USA, 1997. [Google Scholar]
- Carlucci, D.; Schiuma, G. Exploring intellectual capital concept in strategic management research. In Strategies for Information Technology and Intellectual Capital: Challenges and Opportunities; Joia, L., Ed.; Idea Group: London, UK, 2007; pp. 10–28. [Google Scholar]
- Dumay, J. A critical reflection on the future of intellectual capital: From reporting to disclosure. J. Intellect. Cap. 2016, 17, 168–184. [Google Scholar] [CrossRef]
- Eustace, C. The Intangible Economy: Impact and Policy Issues. In Report for the European High Level Expert Group on the Intangible Economy; European Commission: Luxembourg, 2000. [Google Scholar]
- Di Tommaso, M.; Paci, D.; Schweitzer, S. Clustering of intangibles. In The Economic Importance of Intangible Assets; Bianchi, P., Labory, S., Eds.; Ashgate: Aldershot, UK, 2004; pp. 73–102. [Google Scholar]
- Sandro, M.; Antonio, V. Intangible investments and innovation propensity: Evidence from the Innobarometer 2013. Ind. Innov. 2016, 23, 331–352. [Google Scholar] [CrossRef]
- Martens, M.; Carvalho, M. Key factors of sustainability in project management context: A survey exploring the project managers’ perspective. Int. J. Proj. Manag. 2017, 35, 1084–1102. [Google Scholar] [CrossRef]
- Francisca, C.-P.; Isabel Sánchez-Hernández, M. Cooperatives and Sustainable Development: A Multilevel Approach Based on Intangible Assets. Sustainability 2020, 12, 4099. [Google Scholar] [CrossRef]
- Lüdeke-Freund, F. Towards a conceptual framework of business models for sustainability. In Proceedings of the ERSCP-EMSU Conference, Delft, The Netherlands, 25–29 October 2010; pp. 1–28. Available online: https://papers.ssrn.com/sol3/papers.cfm?abstract_id=2189922 (accessed on 13 February 2021).
- Stubbs, W.; Cocklin, C. Conceptualizing a “Sustainability business model”. Organ. Environ. 2008, 21, 103–127. [Google Scholar] [CrossRef]
- Oliver Salzmann, O.; Ionescu-Somers, A.; Steger, U. The Business Case for Corporate Sustainability: Literature Review and Research Options. Eur. Manag. J. 2005, 23, 27–36. [Google Scholar] [CrossRef]
- Geissdoerfer, M.; Morioka, S.N. Business models and supply chains for the circular economy. J. Clean. Prod. 2018, 190, 712–721. [Google Scholar] [CrossRef]
- Gnanaweera, K.; Kunori, N. Corporate sustainability reporting: Linkage of corporate disclosure information and performance indicators. Cogent Bus. Manag. 2018, 5, 1423872. [Google Scholar] [CrossRef]
- Moore. Corporate social and financial performance: An investigation into the UK supermarket industry. J. Bus. Ethics 2001, 34, 299–315. [Google Scholar] [CrossRef]
- McGuire, J.B.; Sundgren, A.; Schneeweis, T. Corporate social responsibility and firm financial performance. Acad. Manag. J. 1988, 31, 854–872. [Google Scholar]
- Mahajan, P. Corporate social responsibility: A new wave in corporate governance. SSRN Electron. J. 2015. [Google Scholar] [CrossRef]
- Preston, L.E.; O’Bannon, D.P. The corporate social-financial performance relationship: A typology and analysis. Bus. Soc. 1997, 36, 419–429. [Google Scholar] [CrossRef]
- McWilliams, A.; Siegel, D. Corporate social responsibility: A theory of the firm perspective. Acad. Manag. Rev. 2001, 26, 117–127. [Google Scholar] [CrossRef]
- S&P Dow Jones Index. Dow Jones Sustainability Index Methodology; S&P Global: New York, NY, USA, 2019. [Google Scholar]
- Maitreyee, D.; Rangarajan, K.; Gautam, D. Corporate sustainability in small and medium-sized enterprises: A literature analysis and road ahead. J. Indian Bus. Res. 2020, 12, 271–300. [Google Scholar] [CrossRef]
- Berns, M.; Townend, A.; Khayat, Z.; Balagopal, B.; Reeves, M.; Hopkins, M.; Kruschwitz, N. The Business of Sustainability: Imperatives, Advantages, and Actions. 2009. Available online: http://www.bcg.com/documents/file29480.pdf (accessed on 2 December 2020).
- Kashmanian, R.; Keenan, C.; Wells, R. Corporate environmental leadership: Drivers, characteristics, and examples. Environ. Qual. Manag. 2010, 19, 1–20. [Google Scholar] [CrossRef]
- Raisová, M.; Regásková, M.; Lazányi, K. The financial transaction tax: An ANOVA assessment of selected EU countries. Equilibrium. Q. J. Econ. Econ. Policy 2020, 15, 29–48. [Google Scholar] [CrossRef]
- Libby, R.; Bloomfield, R.; Nelson, M.W. Experimental research in financial accounting. Account. Organ. Soc. 2002, 27, 775–810. [Google Scholar] [CrossRef]
- Rennekamp, K.; Rupar, K.K.; Seybert, N. Impaired judgment: The effects of asset impairment reversibility and cognitive dissonance on future investment. Account. Rev. 2014, 90, 739–759. [Google Scholar] [CrossRef]
- Jiménez Naharro, F.; Palacín Sánchez, M.J. Determinantes de la estructura financiera de la empresa. Rev. Eur. Dir. Econ. Empresa 2007, 16, 9–23. [Google Scholar]
- Palacín Sánchez, M.J.; Ramírez Herrera, L. Determinants of capital structure in Andalusian SMEs. Rev. Estud. Reg. 2011, 45–69. Available online: https://www.redalyc.org/articulo.oa?id=75522233002 (accessed on 6 November 2020).
- Truong, Q.H.; Nguyen, A.T.; Trinh, Q.A.; Thi, N.L.; Hens, L. Hierarchical Variance Analysis: A Quantitative Approach for Relevant Factor Exploration and Confirmation of Perceived Tourism Impacts. Int. J. Environ. Res. Public Health 2020, 17, 2786. [Google Scholar] [CrossRef] [PubMed]
- Capone, F. Tourist Clusters, Destinations and Competitiveness: Theoretical Issues and Empirical Evidences; Routledge: London, UK, 2015. [Google Scholar]
- Da Silva, I.D.; Corrêa, I.; Deisy, C.; Igarashi, W.; da Valter, S.F. Ativos intangíveis: Relação com ativos tangíveis e índices financeiros. Rev. Gestão Organ. 2015, 8, 23–38. [Google Scholar]
- Rajan, R.; Zingales, L. What do we know about capital structure? Some evidence from international data. J. Financ. 1995, 5, 1421–1460. [Google Scholar] [CrossRef]
- Genç, E. Testing the Pecking Order Theory and Static Trade-Off Theory of Capital Structure: Evidence from French Listed Firms; University of Twente: Enschede, The Netherland, 2018. [Google Scholar]
- Gonzalo Ramirez, P.; Hachiya, T. Intangible assets and market value of Japanese industries and firms. Int. J. Technol. Manag. 2012, 59. [Google Scholar] [CrossRef]
- Julie Yazici, H. An exploratory analysis of the project management and corporate sustainability capabilities for organizational success. Int. J. Manag. Proj. Bus. 2020, 13, 793–817. [Google Scholar] [CrossRef]
- Sotelo, J.A.; Tolón, A.; Lastra, X. Indicadores por y para el desarrollo sostenible, un estudio de caso. Estud. Geográficos 2011, 271, 611–654. [Google Scholar] [CrossRef]
- Durst, S.; Gueldenberg, S. The Meaning of Intangible Assets: New Insights into External Company Succession in SMEs. Electron. J. Knowl. Manag. 2020, 7, 437–446. [Google Scholar]
- Sanches, A.; Sauer, L.; Binotto, E. Análise dos Estudos sobre Indicadores de Sustentabilidade no Turismo: Uma revisão integrativa. Rev. Tur. Análise RTA 2018, 29, 292–311. [Google Scholar] [CrossRef]
- Beata, Z.F.; Marek, D.; Marcin, K. Economic development trends in the EU tourism industry. Towards the digitalization process and sustainability. Qual. Quant. 2020, 12, 3762. [Google Scholar]
- Paz, R.; Bernardí, C.-B.; del Mar Benavides-Espinosa, M. Intangible capital and business productivity in the hotel industry. Int. Entrep. Manag. J. 2020, 16, 691–707. [Google Scholar]
- Bing, X.; Suocheng, D.; Duoxun, B.; Yu, L.; Fujia, L.; Haimeng, L.; Zehong, L.; Minyan, Z. Research on the Spatial Differentiation and Driving Factors of Tourism Enterprises’ Efficiency: Chinese Scenic Spots, Travel Agencies, and Hotels. Sustainability 2018, 10, 901. [Google Scholar] [CrossRef]
- Mazagatos, V.B.; Puente, E.D.Q.; García, J.B.D. La estructura financiera de la empresa familiar y el cambio generacional. Span. J. Financ. Account. 2009, 38, 57–73. [Google Scholar] [CrossRef]
- Haro, A.; Caba, C.; Cazorla, L. El impacto de la inversión de capital riesgo sobre la estructura financiera de las pymes participadas. Un estudio empírico regional. Rev. Int. Pequeña Median. Empresa 2011, 1, 28–48. [Google Scholar]
- Blasco Ruiz, A.; Moya Clemente, I. Estructura financiera y eficiencia en las empresas del sector turístico español. Rev. Eur. Dir. Econ. Empresa 2003, 12, 99–112. [Google Scholar]
- Pacheco, L.; Tavares, F. Capital structure determinants of hospitality sector SMEs. Tour. Econ. 2017, 23, 113–132. [Google Scholar] [CrossRef]

Publisher’s Note: MDPI stays neutral with regard to jurisdictional claims in published maps and institutional affiliations. |
© 2021 by the authors. Licensee MDPI, Basel, Switzerland. This article is an open access article distributed under the terms and conditions of the Creative Commons Attribution (CC BY) license (http://creativecommons.org/licenses/by/4.0/).