Abstract
The fourth industrial revolution (“Industry 4.0”) has caused an escalating need for smart technologies in manufacturing industries. Companies are examining various cutting-edge technologies to realize smart manufacturing and construct smart factories and are devoting efforts to improve their maturity level. However, productivity improvement is rarely achieved because of the large variety of new technologies and their wide range of applications; thus, elaborately setting improvement goals and plans are seldom accomplished. Fortunately, many researchers have presented guidelines for diagnosing the smartness maturity level and systematic directions to improve it, for the eventual improvement of productivity. However, most research has focused on mass production industries wherein the overall smartness maturity level is already high (e.g., high-level automation). These studies thus have limited applicability to the shipbuilding industry, which is basically a built-to-order industry. In this study, through a technical demand survey of the shipbuilding industry and an investigation of existing smart manufacturing and smart factories, the keywords of connectivity, automation, and intelligence were derived and based on these keywords, we developed a new diagnostic framework for smart shipyard maturity level assessment. The framework was applied to eight shipyards in South Korea to diagnose their smartness maturity level, and a data envelopment analysis (DEA) was performed to confirm the usefulness of the diagnosis results. By comparing the DEA models, the results with the smart level as an input represents the actual efficiency of shipyards better than the results of conventional models.
1. Introduction
Owing to changes in the global manufacturing environment, the shipbuilding industry currently faces challenges of survival and sustainability [1]. The global economic recession has induced shrinking international trade, while marine resource development projects are also decreasing or being canceled owing to declining oil prices, which are definitely unfavorable conditions for the shipbuilding and marine industry [2]. Analysts predict that it will be difficult to return to the early boom period of orders for ships and offshore plants, such as around 2010, which is referred to as the “super cycle” in the shipbuilding industry. Under these circumstances, shipyards worldwide are devoting various efforts to establish corporate strategies for the future. One such strategy is the active adoption of smart manufacturing technology, which numerous shipbuilding companies are considering [3,4].
Global manufacturing companies are expressing great interest in smart manufacturing and smart factories, with the goal of unmanned production through automation and connectivity among enterprise resources with the help of the IoT. The application of the smart factory concept is also accelerating with the adoption of Industry 4.0 in Germany. This concept is expanding with the combination of information and communications technology and automation solutions throughout the entire production process [5,6,7].
Although manufacturing companies seek to enhance the level of smart manufacturing through surveys on the latest technologies related to smart factories, adopting smart technologies often does not lead to practical effects (e.g., improved productivity). In fact, inelegantly applying smart technologies without sufficient accurate and practical analysis may adversely affect the existing production system. To solve this problem, a multidimensional and quantitative assessment of the smartness maturity level of manufacturing companies should be performed beforehand [8,9]. However, beyond simple products, it is necessary to consider both quantitative and qualitative criteria and interdependence in a complex manufacturing environment. Therefore, appropriate assessment of the manufacturing level of companies has long been an important issue. With rising interest in smart factories, researchers have proposed various definitions and criteria related to smart factories depending on the scale and type of the manufacturing company. Nevertheless, research on the assessment of smart factories is limited.
This growing emphasis on the importance of smart factories has led scholars to re-examine prior literature on the development of production systems and continuously publish new studies on the definition of a smart factory and the assessment of manufacturing systems. However, since most research has been focused on the general manufacturing industry, it has limited direct applicability to shipyards, which possess different industry characteristics. Basically, shipbuilding is a built-to-order industry. The products of the shipbuilding industry, i.e., ships—consists of several millions of similar but mostly unique intermediate products. At the early stages of production, the similarity among intermediate products is high enough to automate the processes, but the similarity plummets as the production progresses. Therefore, mostly, the automation level of shipyards are relatively low and disproportionally biased to earlier stages [10].
To evaluate smart shipyard and maturity level (SSML) assessment methods, the literature has been extensively surveyed. First, several studies examined smart factories in the manufacturing industry [6,7,11] Furthermore, studies on maturity level assessment of the manufacturing system can be largely divided into studies on evaluation of the manufacturing system in its current state and those on the evaluation of future manufacturing systems aimed at smart factories. In this regard, there have been several case studies on the evaluation of the manufacturing system in its current state [12,13,14,15,16]. In addition, since the advent of smart manufacturing owing to the fourth industrial revolution (4IR), maturity level assessment models for evaluating future manufacturing systems have been studied since 2013 [17,18,19,20]. Detailed descriptions of the literature on the definition of smart factories and on manufacturing system assessment are shown in Appendix A.
In South Korea, the Korea Production System (KPS) was developed, which is suitable for the South Korean manufacturing environment across representative manufacturing sectors such as automotive and consumer goods. [21]. Furthermore, following the development of KPS, to successfully promote the spread of smart factories, the Smart Manufacturing Innovation Planning Division of the Bureau of small and medium-sized enterprises (SMEs) developed a diagnostic tool that can represent plans for smart factory construction, with the goal of objectively diagnosing and assessing the smart maturity level of the manufacturing industry [22]. In this study, they derived the criteria and modules for smart factory assessment from the framework for the smart factory operation system (vision, goal, enterprise, factory, machine, and control). In addition, a questionnaire for the assessment items comprising each module was defined according to the maturity level definitions. Detailed configurations of KPS and smart factory assessment modules are shown in Appendix B.
The smart factory assessment module is a diagnostic tool suitable for the general machinery sector and is actively used by South Korean manufacturing companies [22]. Accordingly, this study also attempted to assess South Korea’s large and medium-sized shipbuilding companies using this smart factory assessment tool in the initial stage. However, the composition and contents of the assessment items defined in the existing model did not reflect the characteristics of the shipbuilding industry and differed from the shipbuilding production system, thus, degrading the reliability of the assessment results.
Concerning multivariate analysis, mathematical analysis techniques such as analytic hierarchy process (AHP), data envelopment analysis (DEA), and multivariate regression analysis are widely used for the assessment of multiple targets derived from various input variables. A meaningful productivity predictor was proposed based on a regression analysis of various indicators related to shipyard productivity [23]. The competitiveness of shipyards was analyzed through DEA, using capacity, technology level, and the industrial environment of various shipyards as input and productivity and building times as output [24]. Their studies extended beyond a qualitative analysis; through DEA, they expressed the relative levels of the most advanced shipyards and those lagging behind them, thereby presenting directions for improvement and quantitative improvement levels. A shipyard efficiency analysis using DEA was also introduced [25]. Turnover/cost values were derived by combining various shipyard production indicators to compare the actual competitiveness of shipyards [26]. Moreover, an assessment methodology for the shipyard block assembly process was developed using process mining and DEA, and they described a practical case applying the methodology to shipyards [27]. In addition, shipyard production plans were assessed using the AHP method considering sales, dock turnover, and quay load [28]. Most recently, a comparative analysis was performed for assessing the productivity of 21 shipyards in South Korea, China, and Japan using DEA and the metafrontier framework [29]. As such, researchers have performed a variety of studies on shipyard competitiveness and productivity, with DEA being applied the most.
In this study, we propose a SSML assessment framework that considers ship production characteristics and diverse production environments. To this end, we devised a modified assessment framework appropriate for the SSML assessment based on the categories of the smart factory assessment framework proposed by Lee et al. [22]. For this purpose, the SSML assessment framework was defined through expert surveys on South Korean shipbuilders of various sizes and technology levels and reflected in the composition of the detailed assessment items. Furthermore, we applied the developed SSML assessment framework to real shipyards and their subcontractors. To apply the proposed framework, this study adopted DEA techniques [24,30] to analyze productivity in the shipyard industry. Using DEA, we built a model that set the maturity level of the shipyard and its subcontractors as input, and sales and order quantity as output. The model confirmed that the smartness maturity level can serve as useful information for assessing the capabilities of companies and deriving quantitative improvement indicators.
The remainder of this study is structured as follows. In Section 2, we present how to develop the SSML and, in Section 3, we provide the results and analysis of the assessment from the interview. In Section 4, we introduce DEA and describe the method of quantitative analysis using DEA. In Section 5, we present the results and discuss the practical contributions of this study. In Section 6, we draw conclusions and suggest future research.
2. Development of Smart Shipyard Maturity Levels
While these previous maturity models present meaningful diagnostic criteria, they either lack specificity or are difficult to apply to diagnosing the SSML. As incorrect assessment criteria lead to incorrect assessment results, smartness maturity levels that reflect the characteristics of shipbuilding production systems must be defined.
With few studies on the assessment of shipyards, this study is the first step for developing a smart maturity level assessment system for shipyards. Technical demand surveys were conducted with large and medium-sized shipyards in South Korea, module manufacturing subcontractors, and related research institutes. The surveys were conducted by e-mail on May 2018, with the shipbuilding industry partners in South Korea including large shipyards, subcontractors, and research institutes. Through these online and offline demand surveys, we identified approximately 450 technology demand surveys from smart shipyards, which were categorized into five areas, as shown in Figure 1. Next, an industry-academia-research expert group was formed to devise a technical roadmap for realizing smart shipyards, see Figure 2, based on the technical demand survey results. This roadmap comprised a bottom-up process for selecting four major fields from the technology demands of the 450 candidates, and a top-down process for classifying the detailed tasks through the expert group. The technical roadmap was largely classified into infrastructure technology, including IoT, big data, process automation for unmanned production and logistics activities, intelligent technology for an array of production management tasks, and production design automation technology.
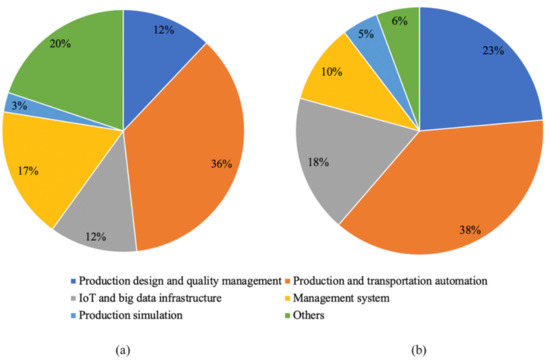
Figure 1.
Technology demand survey for the smart shipyard realization. (a) Online survey; (b) Offline survey.
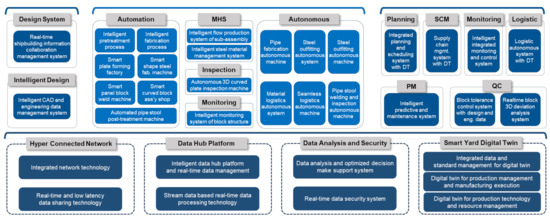
Figure 2.
Technical roadmap for smart shipyard realization.
Next, to prepare the standard for the SSML from the technical roadmap, we used the concept revealed from the existing research focusing on the automation concept It is difficult to define the levels for complex production systems such as shipyards because existing level definitions for smart factories are defined on a single-level scale. The concept of automation was examined from a human-centered perspective rather than a physical device [31]. Accordingly, we defined the types of automation as follows:
- Control automation assists humans in the guiding process of executing the task and the machine movement through dangerous tasks. Control automation plays the role of an observer of the whole subsystem.
- Management automation allows humans to exercise demands oriented to technological actions and activities, and also a strategic point of the automation process.
- Information automation, a type of system that is changing very rapidly, provides the system with information about the progress and the execution of certain tasks.
We used these three types of automation, i.e., physical, intellectual, and information transaction, as keywords for smart shipyards (see Table 1). First, physical automation corresponds to control automation and automation of human physical labor. Next, intellectual automation refers to automation of human knowledge labor and corresponds to the management automation. Finally, connectivity refers to automation of information transfer, and corresponds to information automation [31]. Additionally, the assessment criteria for each maturity factor and level, together with the specific integrated form of smart shipyard concerning each level, are shown in Appendix C.

Table 1.
Definition of smart shipyard maturity level.
On the basis of this definition of SSML and on the smart factory assessment framework [22], an assessment framework for SSML was developed. In this process, the number of inquiry items in the existing model increased from 46 (from [22]) to 61 (assessment framework for SSML) to reflect the characteristics of the shipbuilding industry. In particular, assessment items for the logistics operation and information system modules were added and modified (Table 2). Furthermore, Figure 3 shows the structure of the criteria, modules, and assessment items of the proposed assessment framework. This diagnosis framework was divided into the following four criteria groups: leadership and strategy, process, system and automation, and performance. In addition, each criteria group consisted of submodules; in particular, the process criteria group included product development, production planning, process management, quality management, facility management, and logistics operation modules in consideration of the shipbuilding process. Each module included assessment items, and based on those, the smart shipyard maturity level was diagnosed.
Table 2.
Example of changed assessment items (partially selected).
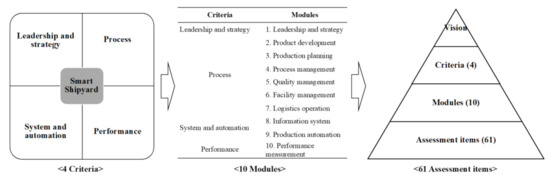
Figure 3.
Diagnosis framework for the assessment of smart shipyard maturity level.
3. Assessment of Smart Shipyard Maturity Level
3.1. Methodology for Assessment of SSML
We conducted an assessment of shipyards to verify the developed assessment framework. Regarding the assessment procedure, first, the assessment material was delivered to 15 companies, including large (L1~L5), mid-sized shipyards (M1~M3), as well as subcontractors such as hull block assembly (B1 and B2), outfitting material manufacturers (O1 and O2), and steel fabrication companies (P1 and P2), and the person-in-charge of the respective module at each company completed the assessment material through a self-assessment. As shown in Figure 3, since there were 10 evaluation modules, 10 employees of each company participated in the assessment. In order to eliminate personal bias, two or three consulting experts who had over 10 years of experience in shipbuilding production area visited each company afterwards and corrected those self-assessment scores through in-depth interviews with the person-in-charge of the respective module and site inspections. Then, reports were written on the interview, site inspection results, and corrected diagnoses and delivered to each company, after which feedback was received. The assessment results were converted into a score of 5 points and Table 3 shows the results of SSML of each assessment module.
Table 3.
Results of the SSML of each assessment module.
3.2. SSML Assessment Results and Discussion
In contrast to general business consulting, the assessment results were expressed as scores from a sophisticated assessment that reflects the widely known scale and qualitative level of companies. Furthermore, they are meaningful as much as this is the first assessment of detailed production factors in the field of shipbuilding production.
Figure 4 shows the average score for each module of the companies investigated. Production automation, the most noteworthy module, showed the lowest assessment at 1.9 (approximately 40 points based on 100 points) owing to the high dependence on workforce in the shipbuilding industry. Most shipyard and subcontractor processes are manual processes. All construction can be performed manually, excluding processing and some assembly processes in large and mid-sized shipyards. Considering the weight of the number of hours by process, large shipyards also have very low automation rates, at approximately 30% for processing and 10% for assembly.
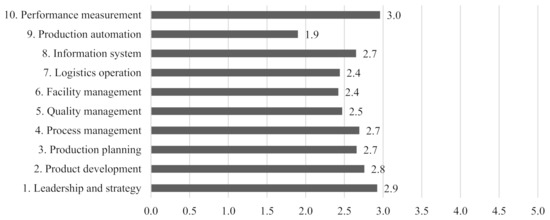
Figure 4.
Average maturity level of each assessment module.
Next, the levels of quality management, facility management, and logistics operations were diagnosed as low. Concerning quality management, although domestic shipyards are somewhat competitive internationally [32], this module was assessed to be low because the assessment focused on the computerization aspect of data collection, processing, and sharing, rather than the level of quality itself. However, the numerous complaints in the on-site interviews from quality management employees about the inadequate data management systems suggests that, in addition to the quality management capabilities of domestic shipyards, the informatization systems that support quality management must be improved. The facility management assessment signifies inadequate management concerning smart maturity of large transport equipment (gantry cranes, transporters, etc.) and production equipment (cutting, welding, painting equipment, etc.). Advanced technologies such as connectivity and predictive maintenance, which are pursued in smart production, were not adopted, and most maintenance procedures consisted of responding to problems after they occurred. Hence, there is a need for advanced facility management by applying predictive maintenance and IoT connectivity technologies, which automatically collect equipment information in real time. As one of the main targets of shipyard management, logistics was recognized as a component of production that enables the smooth flow of production activities by connecting processes, rather than as a simple transport activity. Nevertheless, shipyards remain in the process of adopting logistics technology for tracking work in process (steel plate, hull block, outfitting module, etc.) items; therefore, from the perspective of smart production that pursues connectivity and automation in transport, the low score for this module is reasonable. Aside from these modules, the scores for product planning, production planning, process management, and the information system (approximately 2.7–2.8) were higher than the overall average smart maturity level.
Management’s proactiveness concerning smart technology, in terms of leadership and strategy and performance measurement, was scored relatively high at 2.9 and 3.0, respectively. However, as these two modules are considerably closer to qualitative assessment than other modules that can be quantitatively diagnosed (systems, facilities, informatization, etc.), they can be regarded as assessment items not supported by concrete evidence. Therefore, since the weights among the modules must be considered, future studies must apply the AHP technique to derive more reliable assessment results.
Next, we conducted a clustering analysis of each company based on the maturity level scores. Excluding leadership and strategy and performance measurement, which directly impact the production level, the average scores of the “process” and “system and automation” groups based on the criteria were set as the x- and y-axes, respectively, and the position of each company is shown in Figure 5. In Figure 5, the size of each circle indicates a company’s relative sales in 2019. As the low tide of the international shipbuilding market continued in 2019, the relative sales of each company indicated in the graph are not proportional to their production capacity. Therefore, although M2/M3 and M1/M4 are classified as mid-sized shipyards, the difference in actual production capacity is very large. Nevertheless, the scale of sales shown in Figure 5 are similar owing to the influence of market conditions; therefore, they should be considered only for the purpose of classifying company type. This is shown to classify large and mid-sized enterprises/SMEs.

Figure 5.
Bubble chart for the comparison of smart shipyard maturity level concerning process and system and automation.
The large L1–L5 enterprises formed a relatively higher cluster, while the level of M2 and M3 companies among the mid-sized enterprises was similar to that of large shipyards. Although M1 and M4 are also classified as mid-sized shipyards along with M2 and M3 because the sizes of M2 and M3 are close to large, the difference in size is also reflected in the production level. The outfitting manufacturers (O1, O2) and block manufacturers (B1, B2), as well as mid-sized shipyards M1 and M4, formed a cluster separate from the large enterprise cluster. P1 and P2 located between these two clusters reflect the characteristics of companies that form curved hull plates, which showed rather exceptional results. These results suggest that, as basic research on the automation of curved hull plate forming has recently matured to some degree, curved hull plate forming companies have also attempted to replace operator-dependent tasks with automated machines, thus, resulting in a movement toward automation reflected in the smart maturity level.
By analyzing the company type and SSML score as above, we could quantitatively analyze the smart maturity level of large- and mid-sized companies in the South Korean shipbuilding industry. We confirmed that the developed assessment framework for the SSML can reasonably quantify the types and levels of shipbuilding companies.
4. Data Envelopment Analysis
4.1. DEA Method
The proposed DEA method measures efficiency based on linear programming in the decision-making process [33]. This method is mainly applied when it is difficult to identify and compare direct relationships among multiple inputs and outputs and can be used to develop a more suitable decision-making model than AHP in environments with insufficient information. AHP and DEA methods have been applied to manufacturing supply chain companies and their performances have been compared to verify the practical effectiveness of each technique [34]. According to the findings, the AHP technique can provide detailed and gradual decision-making results through pairwise comparison in cases with large amounts of information, whereas the DEA method can provide effective decision-making strategies for situations with insufficient decision-making factors in a new environment. Accordingly, this study focused on a situation with a lack of specific grounds and information for smart shipyard technology and directions and noted very fast and uncertain technological change in the shipyard industry, unlike existing manufacturing technologies. Therefore, rather than AHP, which is time-consuming in the development process, DEA was applied using the assessment results of the SSML as input, with the goal of verifying whether it could be useful for calculating the efficiency of shipyards and deriving quantitative improvement indicators.
This method calculates the relative efficiency of assessment targets, where multiple inputs and outputs are considered. It derives the most efficient decision-making units (DMUs) from all DMUs to be assessed; consequently, the relative efficiency of each DMU is calculated using linear programming. DEA models are largely categorized into models that assume constant returns to scale (CRS) and those that assume variable returns to scale (VRS). The CRS model assumes that the relationship between input and output is the same at a constant rate, regardless of scale, and was used when the DEA methodology was first proposed. The CRS model is also referred to as the Charnes–Cooper–Rhodes (CCR) model, after the first proposed model. The VRS model [30] relaxes the assumption of CRS in the CCR model and is also referred to as the Banker–Charnes–Cooper (BCC) model.
DEA models can also be categorized into input-oriented and output-oriented models according to their orientation to input or output. The input-oriented model seeks to minimize input with a fixed output, whereas the output-oriented model seeks to maximize output with a fixed input.
DEA models are based on linear programming and can be explained by the following equations: First, assume that n DMUs exist. If (k = 1, …, n) means that m inputs (i = 1, …, m; j = 1, …, n) are input to output s outputs (r = 1, …, s; j = 1, …, n), then, the efficiency of the th observation is obtained through the linear programming solution of Equations (1) and (2) assuming an output-oriented CCR model. In the equation, is the efficiency value, and and are slack variables for the input and output, respectively. If the value of obtained as the solution to this equation is 1 and both slack variables are 0, then the DMU is an efficient (efficiency 100%) DMU. Equations (1) and (2) are as follows:
As the BCC model assumes VRS, a constraint is added such that the sum of is 1. Accordingly, the output-oriented BCC model can be expressed as in Equations (3) and (4) as follows:
If the efficiency value of the CCR model is and that of the BCC model is , then, the constant relationship ≤ is established, and the difference in efficiency between the two models originates from whether the scale is optimal. This difference is the scale efficiency (SE), and the following relationship is established in Equation (5):
If SE is 1, then, it is in a CRS state and there is no inefficiency owing to scale; if SE is less than 1, then, it is in an increasing or decreasing returns to scale state, signifying that there is inefficiency owing to scale. The efficiency of the CCR model () is referred to as the technical efficiency, while the efficiency of the BCC model () is referred to as pure technical efficiency to emphasize that inefficiency owing to scale is excluded.
4.2. Quantitative Analysis Using DEA
Next, using the DEA method, we conducted a quantitative analysis, compared the companies, and presented target levels of quantitative improvement for relatively low-level companies. DEA is an analysis method that measures the relative efficiency of companies with multiple input and output factors. It measures the relative efficiency between the same groups and provides information on benchmarking targets to improve efficiency for those that appear inefficient. The DEA technique is useful for the following problems.
- It is useful when there are many inputs and outputs, but it is difficult to integrate them into the single index in an appropriate way.
- DEA provides a basis for benchmarking target that should be investigated to improve efficiency.
- DEA can simultaneously consider various input and output factors with different units of measurement.
To measure efficiency using DEA, DMUs must be set. DEA presupposes the homogeneity of the analysis target, requiring individual DMUs to perform similar activities to produce products that can be compared [35]. Furthermore, similar resources or capital must be input in all DMUs, and performance must not be influenced by external factors. Accordingly, the DMUs in this study, consisted of shipyards focusing on new shipbuilding. However, shipyards for which output variable data (new ship construction) could not be secured were excluded from the analysis.
The selection of the input and output variables is important for ensuring the reliability of the DEA results. That is, it is necessary to select input and output variables that can accurately reflect the objectives, targets, and production environment of the shipyard. Our objective was to verify whether the SSML assessment result is an indicator of shipyard efficiency. As such, a DEA model was built using the number of employees and docks as inputs and the new ship construction as the output.
Furthermore, as described above, the DEA model was categorized into a CCR model (for Charnes, Cooper, and Rhodes [33]) and BCC model (for Banker, Charnes, and Cooper [30]) based on the assumption of the effect of scale, and also categorized into an input-oriented (minimum input) model and output-oriented (maximum output) model, depending on the purpose of measuring efficiency. Regarding the selection of the model, since new ship construction is greatly affected by external factors, the input-oriented (minimum input) model was selected, which minimizes the input for a fixed output. The commercial software Frontier Analyst was used for the DEA.
Next, two models were defined as shown in Table 4, to perform the DEA. However, as the input and output of the DEA model are proportionally correlated, for the SSML score (the input variable), the proposed model uses the value of the perfect score (5.0) minus the score of each factor. This was a given correlation as an input factor of the DEA model, in which the lower the maturity level score, the closer it is to the advanced level. That is, a high maturity level indicates a relatively small input factor value, meaning that the output can be achieved with less effort. Thus, the maturity level was analyzed by subtracting the projection value derived via DEA from the perfect score (5.0).
Table 4.
Input and output variables definition of each target data envelopment analysis (DEA) model.
Owing to insufficient data, DMUs could not be performed for all companies in Table 3. However, a DEA was conducted for shipyards with available data on output Y1 (L1–L5, M2, M3, and M4) common to the two models and X1 and X2 of the traditional model in Table 4.
There are considerations concerning the timing of the input and output data. As shipyard construction volume greatly varies with the time period, large gaps in the potential production volume of a shipyard may arise when using the proposed model’s input data X1–X2 and Y1 of when the maturity level assessment was performed in 2009. Moreover, data on the shipyard’s production capacity are not explicitly disclosed or available. Accordingly, for the data of X1–X2 and Y1, we considered the largest volume of new ship construction during the last 10 years and the number of employees and docks/berths in that year. Consequently, the 2019 data were selected. Although applying these conditions will lead to mismatched timing in the output and input data, we ignored it because our objective was to compare the results of DEA, which uses physical conditions (workforce, resources, etc.) as input, with the results of the proposed method, which uses the maturity level as input, rather than present quantitative information on each shipyard through precise assessment results. Furthermore, as the speed of change in shipyards is slow, it was judged that the level assessed in 2019 had not dramatically changed over the last 10 years.
Before describing the analysis, the following assumptions were made: If the objective reliability of the relationship between the input and outputs considered in Table 4 and the DEA method is secured, then the level (or efficiency) of each shipyard will be determined by the DEA results. However, we aimed to identify which input/output and DEA model best expressed the phenomenon (shipyard level); the judgment criteria for the suitability of the analysis results were defined as the shipyard level, which were generally known as follows. For the assumptions of the relative levels of L1–L5 and M2–M4, they are classified based on the global ranking of each shipyard. First, L1–L3 are within the top five shipyards worldwide, with little change in ranking over the past 20 years. Thus, their scale, as indicated by sales and orders, and also their overall production level is among the best worldwide. Next, L4 and L5 are within the top 10 shipyards worldwide; although, the scale is somewhat smaller than L1–L3, this does not necessarily indicate a larger difference in production level. Next, M2 and M3 are shipyards in the top 10–50 worldwide, with relatively high-ranking volatility. Finally, M4 corresponds to shipyards ranked 50–100. However, as the difference in order and construction volume decreases at lower ranks, the difference in SSML does not increase as much as the difference in rank. Accordingly, L1–L3 is defined as the large group, L4 and L5 as the mid-sized-large group, M2 and M3 as the mid-sized group, and M4 as the small group, which are assumed to be the guidelines for analyzing the DEA results. According to the previous study, if the skill level of a large shipyard is set to 100, the level of a medium-sized shipyard is 75–85, and that of a small shipyard is approximately 50 [36]. Therefore, this quantitative guideline is used as comparative data to examine the efficiency feasibility of each shipyard through DEA analysis.
5. Results of the Data Envelopment Analysis
DEA was performed for Case 1 of a single model consisting of L1–L5 and M2–M4 as DMUs and Case 2 of split models with L1–L5 and M2–M4 separated.
5.1. Case 1
In Case 1, L1–L5 and M2–M4 were configured as one model. Figure 6 shows the efficiency and the (SE) results derived by applying the CCR and BCC analysis methods concerning the traditional model and proposed model. In Figure 6 (raw data is Table A8), SE values below 1 were derived. If the SE is less than 1, the DMUs are in a state of increasing or decreasing returns to scale states, signifying that there is inefficiency owing to scale. Next, the results were derived from the CCR and BCC methods using the traditional and proposed models.
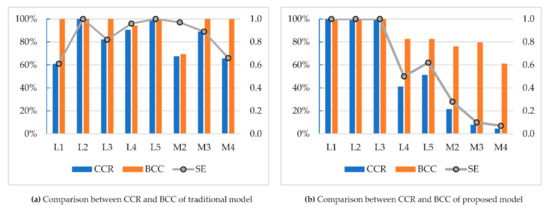
Figure 6.
Efficiency and scaled efficiency of (a) traditional model and (b) proposed model (Case 1).
Figure 6 shows the analysis results of the BCC and CCR methods, under traditional analysis conditions using the number of employees and docks as input variables. First, concerning the BCC method, the efficiencies of all shipyards, excluding M2 in BCC and M2 and M4 in CCR, were 100% or close to 100%, confirming that there was no discriminatory power between the shipyards. Furthermore, concerning both BCC and CCR, L1 and M2 was lower than M3 and M4, although it ranked higher than both in reality; hence, they did not meet the guidelines assumed in Section 4.
Next, Figure 6b shows the analysis results from BCC and CCR, under the analysis condition using two previously analyzed SSML categories as the input variables; specifically, the average of the perfect score (5.0) of each module minus the score of each factor.
In Figure 6b, the CCR analysis results under the proposed model show efficiencies of 21.56%, 7.95%, and 4.57% for M2–M4, respectively, thus exhibiting differentiation with L1–L5. However, the difference became excessively large, resulting in practically impossible values for the projections of process and system and automation, which are inputs. Therefore, the analysis results are unreasonable. On the contrary, the BCC results, in Figure 6b, show the analysis results from the BCC method under the proposed model. All shipyard efficiency results using the BCC method under the proposed model satisfied the assumed guidelines in Section 4. L1–L3 was at 100% and was located in the best practice line, followed by L4 and L5 at approximately 80%, showing a difference of approximately 20% with the large group. Next, M2 and M3 showed values in the upper 70%, slightly less than the mid-sized and large groups; and M4, belonging to the small group, was approximately 60%. Thus, in the proposed model, the BCC analysis presents appropriate efficiency and projection values considering the qualitative level of each shipyard. Concerning the construction volume projections (as marked in red in Table A11), however, the values of M3 and M4 were unrealistically overestimated. This problem likely occurred because the difference in construction values from other shipyards was too large, despite being an input-oriented model. Accordingly, in the DEA analysis of Case 2, L1–L5 (large group) and M2–M4 (small and mid-sized group) were divided into separate models.
5.2. Case 2
Owing to the large difference in scale between the large-, small-, and mid-sized groups, the construction volume projections calculated for the small- and mid-sized shipyards were overestimated. Hence, in Case 2, L1–L5 (large group) and M2–M4 (small and mid-sized groups) were divided into separate models for the analysis. Since BCC showed more reasonable results than CCR in the analysis of Case 1, only the results under the proposed model were addressed in Case 2. For reference, Table A14 and Table A15 in Appendix D show the detailed results under the traditional model for Case 2.
Figure 7 summarizes the efficiency and SE results. According to the results under the proposed model of Figure 7b,d, there was no change in L1–L5, which belongs to the large group, with only a change in M2–M4. That is, since the model for the small group was separated considering the difference in construction size, the large group showed no change from the existing results; and M2–M4, which were separated from the construction of large shipyards into a group of small shipyards, were calculated independently, thus adjusting the efficiency.
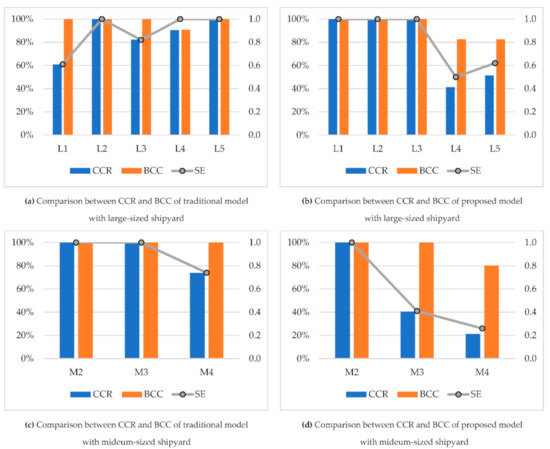
Figure 7.
Efficiency and scaled efficiency of traditional model and proposed model (Case 2).
Comparing the efficiency of CCR and BCC using the proposed model in the M2–M4 analysis, BCC (100%, 100%, and 80.22%) better reflects the shipyard guidelines than CCR (100%, 40.55%, and 21.20%). In other words, since M2 and M3 correspond to mid-sized shipyards with similar scale and technology level and M4 corresponds to small shipyards, BCC exhibited more reasonable results than CCR.
Additionally, Table A16 in Appendix D shows the DEA results of proposed approach and explains the detailed analysis results from the BCC methods. As shown in Table A16, the process and system and automation levels of L4 and L5 (large shipyards) must be improved by approximately 11–16% to reach the levels of L1–L3. As for M2–M4, whereas M2 and M3 are at 100% efficiency within that group, M4 shipyards must improve their process level by 20% and system and automation by 27%.
As a result of DEA analysis with respect to various factors and cases as compared with the existing DEA technique which uses physical elements such as the number of employees and docks as input, the proposed method, which uses the SSML as input, derived more reasonable results for the efficiency and projection of actual shipyards.
6. Conclusions
To develop a framework for diagnosing the smart maturity level of the shipbuilding industry, this study analyzed existing research on smart manufacturing, smart factories, and maturity models. Technology demand surveys were also performed to reflect the characteristics of the shipbuilding industry, and a technical roadmap for realizing smart shipyards that reflected the opinions of an expert group was proposed. The SSML assessment framework developed through this process defined five maturity levels for each of the following keywords: connectivity, automation, and intelligence. Furthermore, based on the defined levels, a diagnostic tool comprising 61 items for four criteria and 10 modules was developed. While the structure presented in prior research was used for the criteria and modules of the diagnostic tool, the 61 detailed inquiry items were reconfigured reflecting the characteristics of shipyards. This developed framework was used to diagnose large- and medium-sized shipyards and subcontractors in South Korea, after which the results were analyzed. Automation was assessed the lowest in the maturity level of shipbuilding-related companies, and it was confirmed that those companies could be divided into groups through a bubble chart analysis using process and system/automation criteria as the two axes.
Next, the assessment of SSML was used to conduct a DEA, which was capable of quantitative analysis. Using the SSML as the input variable, DEA can derive the efficiency levels of the subject companies and confirm the level of improvement required to reach 100% efficiency for each module through quantitative indicators. In addition, for the same companies, we performed a comparative analysis between the traditional DEA model, which used the number of employees, scale of facilities, etc. as input variables; and the other DEA model, which used the SSML as the input variable. The results demonstrated that the model using the maturity level as the input variable derived more reliable results that were well matched with a previous survey [36].
However, for DEA to be more pertinent, the number of DMUs must be at least two to three times greater than the sum of the number of input and output variables [37]. As the assessment was based on a rather insufficient number of DMUs (companies to be diagnosed), further investigations with more DMUs are strongly recommended, including not only South Korean shipyards but also shipyards of similar scales in China, Japan, and Europe.
Author Contributions
Conceptualization, J.H.W.; Methodology, J.H.W.; Software, H.Z.; Validation, H.C., D.K.L., and Y.J.; Formal Analysis, H.C. and Y.J.; Investigation, H.C., D.K.L., and Y.J.; Data curation, H.Z.; Writing—original draft preparation, J.H.W., H.C., D.K.L., and Y.J.; Writing—review and editing, H.C., Y.J., and D.K.L.; Supervision, J.H.W.; Project administration, J.H.W. All authors have read and agreed to the published version of the manuscript.
Funding
This work was supported by the IoT- and AI-based development of Digital Twin for Block Assembly Process (grant number 20006978) of the Korean Ministry of Trade, Industry and Energy, and the mid-sized shipyard dock and quay planning integrated management system (grant number 20007834) of the Korean Ministry of Trade, Industry and Energy.
Institutional Review Board Statement
Not applicable.
Informed Consent Statement
Not applicable.
Data Availability Statement
The data presented in this study is in Table 3 and Appendix A, Appendix B, Appendix C and Appendix D.
Conflicts of Interest
The funders had no role in the design of the study; in the collection, analyses, or interpretation of data; in the writing of the manuscript, or in the decision to publish the results.
Abbreviations
| 4IR | Fourth industrial revolution |
| BCC | Model based on its authors (Banker, Charnes, and Cooper [30]) |
| CCR | Model based on its authors (Charnes, Cooper, and Rhodes [33]) |
| CEMM | Connected enterprise maturity model |
| CGT | Compensated gross tonnage |
| DEA | Data envelopment analysis |
| IoT | Internet of Things |
| MES | Manufacturing execution systems |
| NIST | National Institute of Standards and Technology |
| OA | Office automation |
| RI4 | Reifegradmodell Industrie 4.0 |
| SMEs | Small- and medium-sized enterprises |
| SSML | Smart shipyard maturity level |
| SMSRL | Smart manufacturing system readiness level |
| VRS | Variable returns to scale |
| AHP | Analytic hierarchy process |
| CRS | Constant returns to scale |
| DMU | Decision-making units |
| KPS | Korea Production System |
| PwC | Price Waterhouse Coopers |
| SE | Scale efficiency |
Appendix A. Smart Factory Definition and Research on Manufacturing System Assessment
To evaluate SSML assessment methods for the smart level definition, the literature on the smart factory definition required was extensively surveyed. First, for a smart factory, one of the biggest topics in the manufacturing industry, similar concepts were defined in the following research cases: A smart factory was defined as a context-aware manufacturing environment that can respond to disruptions in real-time production using distributed information and communication structures to optimally manage production processes, and as the model of next-generation factories in an era of ubiquitous computing technology [6]. It was defined as a factory of the future and factory-of-things “composed of smart objects which interact based on semantic services,” and emphasized that, rather than a hierarchy in the traditional sense, the objects will self-organize to fulfill certain tasks [7]. SmartFactoryKL which is a demonstration and research test bed for smart factories was introduced in that study conducted by. The German Research Center for Artificial Intelligence (Deutsches Forschungszentrum für Künstliche Intelligenz, DFKI). The United States National Institute of Standards and Technology (NIST) defines smart manufacturing as a fully integrated cooperative manufacturing system that responds in real time to the changing demands and conditions of factories, supply chains, and customer needs, and emphasizes integration not only within the factory but also with supply chains and customers [11].
Studies on maturity level assessment of the manufacturing system can be largely divided into studies on evaluation of the manufacturing system in the current state and those on the evaluation of future manufacturing systems aimed at smart factories. First, several case studies evaluated the manufacturing system in its current state. Existing manufacturing system maturity level methodologies related to manufacturing SMEs was examined and an improved assessment tool was proposed [12]. In a project with the Mechanical Engineering Industry Association in Germany (Verband Deutscher Maschinen-und Anlagenbau), the “Industry 4.0 Readiness” model was proposed [13]. This assessment model comprised six dimensions and 18 fields; the six dimensions consist of four dimensions (smart factory, smart product, smart operation, and data-driven services) in addition to “strategy and organization” and “employees.”
Maturity level assessment models provided by accredited institutions include the following: The Capability Maturity Model Integration (CMMI) model developed by the Software Engineering Institute (SEI) starts from a five level maturity model of software development and serves as the basis for various process maturity models, such as purchasing, products, and human resources [14]. Concerning manufacturing competitiveness, the Manufacturing Enterprise Systems (MES) Maturity Profile, developed by the MES Association, presents the maturity levels for MES, a system for optimizing production from product order to delivery [15]. The Business Process Maturity Model (BPMM) of the Object Management Group (OMG) presents an organization’s processes as a five-level maturity model. The BPMM was developed as a diagnostic tool that substitutes critical success factors (information technology and systems, culture, responsibility, methodology, performance, etc.) and the perspectives of connection, design, execution, control, and improvement in CMMI [16]. Table A1 shows the maturity levels of SEI, MES Association, and OMG.
Table A1.
Maturity levels of several organizations/developers.
Table A1.
Maturity levels of several organizations/developers.
| Organization/Developer | Maturity Model | Level 1 | Level 2 | Level 3 | Level 4 | Level 5 |
|---|---|---|---|---|---|---|
| SEI [14] | CMMI model | Initial | Managed | Defined | Quantitatively managed | Optimizing |
| MES Association [15] | MES maturity profile | Poor | Basic | Effective | Best Practice | Emerging |
| OMG [16] | BPMM model | Initial inconsistent mgmt. | Managed work unit mgmt. | Standardized process mgmt. | Predictable capability mgmt. | Innovating change mgmt. |
Since the advent of smart manufacturing owing to 4IR, maturity level assessment models related to 4IR have been studied since 2013, as shown in Table A2.
Table A2.
Maturity evaluation models.
Table A2.
Maturity evaluation models.
| Model | Organization/Developer | Year | Maturity or Readiness Level |
|---|---|---|---|
| CEMM [17] | Rockwell Automation | 2014 |
|
| RI4 [18] | FH-Oberosterreich/Manuel Brunner et al. | 2015 | • 10-step evaluation criteria |
| The Industry 4.0 Self Assessment [19] | pwc | 2016 |
|
| SMSRL [20] | NIST/Jung et al. | 2016 |
|
The Connected Enterprise Maturity Model developed by Rockwell Automation [17] presents enterprise maturity at five levels (assessment, secure and upgraded network and controls, defined and organized working data capital, analytics, and collaboration), but does not present detailed assessment items and a development process. The Reifegradmodell Industrie 4.0 (4IR), jointly developed by Mechatronics Cluster and Upper Austria University of Applied Sciences [18], presents three areas of data, intelligence, and digital transformation, 13 assessment items, and uses a 10-point-scale maturity level assessment method. However, the maturity model and detailed assessment content are inadequate. The Industry 4.0 Self Assessment model developed by pwc [19] derived six areas related to 4IR competencies (digital business models and customer access; digitization of product and service offerings; digitization and integration of vertical and horizontal value chains; data and analytics as core capability; agile IT architecture, compliance, security, legal, and tax; and organization, employees, and digital culture) and presented a four-level maturity model; however, only some evaluation items and no detailed development process were presented. The smart manufacturing system readiness level model under development by researchers at NIST diagnoses the maturity level for four areas, i.e., organizational maturity, IT maturity, performance management maturity, and information connectivity maturity [20]. However, based on an improvement activity model and factory design using IDEF0 (Integration Definition 0 [38]), it assesses the readiness level and focuses on improvements in the information system sector, making it somewhat inadequate for comprehensive production system diagnoses.
Appendix B. Korea Production System and Smart Factory Assessment Modules
KPS, a part of the Korean government’s strategy for enhancing the productivity of manufacturing companies, is a tool that integrates various manufacturing innovation methodologies to establish a standard production system appropriate for the manufacturing capabilities and industrial culture of Korean manufacturing companies and to improve productivity.
Following the development of KPS, to successfully promote the spread of smart factories, the Smart Manufacturing Innovation Planning Division of the Bureau of SMEs developed a diagnostic tool that can present plans for smart factory construction, with the goal of objectively diagnosing and assessing the manufacturing industry’s smart maturity level [25] (see Table A3). This diagnostic tool follows ISO 9001:2015 (management system), IEC 62264 (manufacturing operation system), ISO 22400, and SCOR (KPI); and was developed for certifying factory operation systems and designed to be linked with in-house enterprise certification systems, reflecting the culture and characteristics of the Korean manufacturing industry (Samsung Electronics, Hyundai Motor Company, POSCO, etc.). Moreover, as shown in Figure A1, a framework for smart factory operation was constructed, and smart factory assessment modules were derived.
Table A3.
Assessment configuration of the Korea Production System.
Table A3.
Assessment configuration of the Korea Production System.
| Principles. | Core Activities | No. of Inquiries |
|---|---|---|
| 1. Participation of stakeholders | 1.1. Healthy organization culture | 5 |
| 1.2. Human resource and competency development | 4 | |
| 1.3. Safe working environment | 4 | |
| 2. Standardization | 2.1. Prepared working place | 5 |
| 2.2. Visual management | 3 | |
| 2.3. Work standard management | 4 | |
| 2.4. Project management | 5 | |
| 3. Continuous improvement | 3.1. Goal setting and deployment | 5 |
| 3.2. On-site abnormality detection and action | 5 | |
| 3.3. Problem solving and team improvement activities | 5 | |
| 4. Optimization of production system | 4.1. Logistic management | 5 |
| 4.2. Optimization of production set-up | 5 | |
| 4.3. Multifunctional skill management | 5 | |
| 5. Practicality of production information | 5.1. Master data management | 5 |
| 5.2. Business process information and integration | 5 | |
| 5.3. Production informatization strategy | 5 | |
| 6-1. Quotation/contract/design process | 6-1.1. Quotation and product design | 5 |
| 6-1.2. Process and work design | 5 | |
| 6-2. Production operation and logistic process | 6-2.1. Order production plan management | 5 |
| 6-2.2. Procurement (purchase/outsourcing/material) management | 5 | |
| 6-2.3. Production input and progress management | 5 | |
| 6-2.4. Shipping and logistics management | 5 | |
| 6-3. Facility/equipment management process | 6-3.1. Facility operation and maintenance | 5 |
| 6-3.2. Energy efficiency in manufacturing sites | 5 | |
| 6-4. Quality and A/S process | 6-4.1. Inspection and quality management system | 5 |
| 6-4.2. Operation of quality assurance system | 5 | |
| 6-4.3. Quality improvement and failure cost management | 5 | |
| 6-5. Cost calculation and management process | 6-5.1. Estimated cost calculation and budget management | 4 |
| 6-5.2. Analysis and utilization of cost information | 4 | |
| 6-5.3. Cost improvement and performance management system | 5 |

Figure A1.
Framework for smart factory operation system (courtesy of Korea Smart Manufacturing Office; https://www.smart-factory.kr/eng/index (accessed on 17 February 2021)).
Figure A1.
Framework for smart factory operation system (courtesy of Korea Smart Manufacturing Office; https://www.smart-factory.kr/eng/index (accessed on 17 February 2021)).

The criteria and modules for smart factory assessment (Table A4) from the framework for the smart factory operation system was derived, as shown in Figure A1 (vision, goal, enterprise, factory, and machine/control) [22]. In addition, a questionnaire for the assessment items comprising each module was defined according to the maturity level definitions in Table A5.
Table A4.
Modules for smart factory assessment from smart factory framework.
Table A4.
Modules for smart factory assessment from smart factory framework.
| Criteria | Framework | Modules | Assessment Contents |
|---|---|---|---|
| Leadership and strategy | Vision & Strategy | 1. Leadership and strategy |
|
| Process | Factory level | 2. Product development |
|
| Factory level | 3. Production planning |
| |
| Factory level | 4. Process management |
| |
| Factory level | 5. Quality management |
| |
| Factory level | 6. Facility management |
| |
| Factory level | 7. Logistics operation |
| |
| System and automation | Factory level | 8. Information system |
|
| Machine/Control level | 9. Production automation |
| |
| Performance | Goal & KPI | 10. Performance measurement |
|
Table A5.
Definition of smart factory maturity level.
Table A5.
Definition of smart factory maturity level.
| Level | Description |
|---|---|
| Checking |
|
| Monitoring |
|
| Control |
|
| Optimization |
|
| Autonomy |
|
Appendix C. Smart Shipyard Maturity Assessment Levels
Table A6.
Definition of level of each maturity factor.
Table A6.
Definition of level of each maturity factor.
| Level | Connectivity | Automation | Intelligence |
|---|---|---|---|
| Level 5 |
|
|
|
| Level 4 |
|
|
|
| Level 3 |
|
|
|
| Level 2 |
|
|
|
| Level 1 |
|
|
|
Table A7.
Description of each level of shipyard.
Table A7.
Description of each level of shipyard.
| Level | Description |
|---|---|
| Level 5 shipyard |
|
| Level 4 shipyard |
|
| Level 3 shipyard |
|
| Level 2 shipyard |
|
| Level 1 shipyard |
|
Appendix D. DEA Results
Table A8.
Efficiency and scale efficiency of traditional model and new model (Case 1).
Table A8.
Efficiency and scale efficiency of traditional model and new model (Case 1).
| Traditional Model | Proposed Model | |||||
|---|---|---|---|---|---|---|
| Efficiency | SE (CCR/BCC) | Efficiency | SE (CCR/BCC) | |||
| CCR | BCC | CCR | BCC | |||
| L1 | 60.82% | 100.00% | 0.61 | 100.00% | 100.00% | 1.00 |
| L2 | 100.00% | 100.00% | 1.00 | 100.00% | 100.00% | 1.00 |
| L3 | 82.22% | 100.00% | 0.82 | 100.00% | 100.00% | 1.00 |
| L4 | 90.56% | 94.21% | 0.96 | 41.32% | 82.52% | 0.50 |
| L5 | 100.00% | 100.00% | 1.00 | 51.28% | 82.52% | 0.62 |
| M2 | 67.51% | 69.44% | 0.97 | 21.56% | 76.23% | 0.28 |
| M3 | 88.96% | 100.00% | 0.89 | 7.95% | 79.42% | 0.10 |
| M4 | 65.62% | 100.00% | 0.66 | 4.57% | 61.15% | 0.07 |
Table A9.
DEA results with the Banker–Charnes–Cooper (BCC) of traditional model (Case 1).
Table A9.
DEA results with the Banker–Charnes–Cooper (BCC) of traditional model (Case 1).
| DMU | L1 | L2 | L3 | L4 | L5 | M2 | M3 | M4 | |
|---|---|---|---|---|---|---|---|---|---|
| Efficiency | 100.00% | 100.00% | 100.00% | 94.21% | 100.00% | 69.44% | 100.00% | 100.00% | |
| Employee | Data | 54,808 | 34,353 | 30,181 | 10,479 | 11,777 | 7941 | 2142 | 2159 |
| Projection | 54,808 | 34,353 | 30,181 | 9545 | 11,777 | 5514 | 2142 | 2142 | |
| Diff. | 0.00% | 0.00% | 0.00% | −8.90% | 0.0% | −30.60% | 0.00% | −0.80% | |
| Dock | Data | 11 | 5 | 7 | 4 | 4 | 5 | 3 | 3 |
| Projection | 11 | 5 | 7 | 3.77 | 4 | 3.35 | 3 | 3 | |
| Diff. | 0.00% | 0.00% | 0.00% | −5.80% | 0.00% | −33.00% | 0.00% | 0.00% | |
| Construction | Data | 2,906,250 | 2,433,277 | 2,393,300 | 1,218,287 | 1,511,919 | 688,199 | 244,624 | 181,877 |
| Projection | 2,906,250 | 2,433,277 | 2,393,300 | 1,218,287 | 1,511,919 | 688,199 | 244,624 | 244,624 | |
| Diff. | 0.00% | 0.00% | 0.00% | 0.00% | 0.00% | 0.00% | 0.00% | 34.50% |
Table A10.
DEA results with the Charnes–Cooper–Rhodes (CCR) of traditional model (Case 1).
Table A10.
DEA results with the Charnes–Cooper–Rhodes (CCR) of traditional model (Case 1).
| DMU | L1 | L2 | L3 | L4 | L5 | M2 | M3 | M4 | |
|---|---|---|---|---|---|---|---|---|---|
| Efficiency | 100.00% | 100.00% | 100.00 | 90.84% | 100.00% | 68.32% | 100% | 74.35% | |
| Employee | Data | 54,808 | 34,353 | 30,181 | 10,479 | 11,777 | 7941 | 2142 | 2159 |
| Projection | 54,808 | 34,353 | 30,181 | 10,479 | 11,777 | 7941 | 2142 | 2142 | |
| Diff. | 0.00% | 0.00% | 0.00% | 0.00% | 0.00% | 0.00% | 0.00% | −0.80% | |
| Dock | Data | 11 | 5 | 7 | 4 | 4 | 5 | 3 | 3 |
| Projection | 11 | 5 | 7 | 3.87 | 4 | 3.6 | 3 | 3 | |
| Diff. | 0.00% | 0.00% | 0.00% | −3.40% | 0.00% | −28.00% | 0.00% | 0.00% | |
| Construction | Data | 2,906,250 | 2,433,277 | 2,393,300 | 1,218,287 | 1,511,919 | 688,199 | 244,624 | 181,877 |
| Projection | 2,906,250 | 2,433,277 | 2,393,300 | 1,341,193 | 1,511,919 | 1,007,369 | 244,624 | 244,624 | |
| Diff. | 0.00% | 0.00% | 0.00% | 10.10% | 0.00% | 46.40% | 0.00% | 34.50% |
In Table A11 and Table A12, the “data,” “projection,” and difference rows for “process” and “system and automation” indicate the input data, quantitative value to reach 100% efficiency, and ratio of the projection and data, respectively. Two values are shown for each data, projection, and difference by the DMU in the proposed model. The value on the left is the perfect SSML score of the perfect score, which is 5.0 minus assessment value and the projected value, and the value on the right is converted from the perfect score again.
Table A11.
DEA results with BCC of proposed model (Case 1).
Table A11.
DEA results with BCC of proposed model (Case 1).
| DMU | L1 | L2 | L3 | L4 | L5 | M2 | M3 | M4 | |||||||||
|---|---|---|---|---|---|---|---|---|---|---|---|---|---|---|---|---|---|
| Efficiency | 100% | 100% | 100% | 82.52% | 82.52% | 76.23% | 79.42% | 61.15% | |||||||||
| Process | Data | 2.15 | 2.85 | 1.70 | 3.30 | 2.01 | 2.99 | 2.06 | 2.94 | 2.06 | 2.94 | 2.23 | 2.77 | 2.26 | 2.74 | 2.78 | 2.22 |
| Projection | 2.15 | 2.85 | 1.70 | 3.30 | 2.01 | 2.99 | 1.70 | 3.30 | 1.70 | 3.30 | 1.70 | 3.30 | 1.79 | 3.21 | 1.70 | 3.3 | |
| Diff. | 0% | 0% | 0% | 0% | 0% | 0% | −17.5% | 11% | −17.5% | 11% | −23.8% | 16% | −20.6% | 15% | −38.8% | 33% | |
| System and automation | Data | 2.07 | 2.93 | 1.79 | 3.21 | 1.65 | 3.35 | 2.29 | 2.71 | 2.21 | 2.79 | 2.51 | 2.49 | 2.2 | 2.8 | 3.17 | 1.83 |
| Projection | 2.07 | 2.93 | 1.79 | 3.21 | 1.65 | 3.35 | 1.79 | 3.21 | 1.79 | 3.21 | 1.79 | 3.21 | 1.75 | 3.25 | 1.79 | 3.21 | |
| Diff. | 0% | 0% | 0% | 0% | 0% | 0% | −21.8% | 16% | −19% | 13% | −28.7% | 22% | −20.6% | 14% | −43.5% | 43% | |
| Construction | Data | 2,906,250 | 2,433,277 | 2,393,300 | 1,218,287 | 1,511,919 | 688,199 | 244,624 | 181,877 | ||||||||
| Projection | 2,906,250 | 2,433,277 | 2,393,300 | 2,433,277 | 2,433,277 | 2,433,277 | 2,421,048 | 2,433,277 | |||||||||
| Diff. | 0% | 0% | 0% | 99.7% | 60.9% | 253.6% | 889.7% | 1237.9% | |||||||||
Table A12.
DEA results with CCR of proposed model (Case 1).
Table A12.
DEA results with CCR of proposed model (Case 1).
| CCR (min Input) | DMU | L1 | L2 | L3 | L4 | L5 | M2 | M3 | M4 | ||||||||
|---|---|---|---|---|---|---|---|---|---|---|---|---|---|---|---|---|---|
| Efficiency | 100% | 100% | 100% | 41.32% | 51.28% | 21.56% | 7.95% | 4.57% | |||||||||
| Process | Data | 2.15 | 2.85 | 1.70 | 3.30 | 2.01 | 2.99 | 2.06 | 2.94 | 2.06 | 2.94 | 2.23 | 2.77 | 2.26 | 2.74 | 2.78 | 2.22 |
| Projection | 2.15 | 2.85 | 1.70 | 3.30 | 2.01 | 2.99 | 0.85 | 4.15 | 1.06 | 3.94 | 0.48 | 4.52 | 0.18 | 4.82 | 0.13 | 4.87 | |
| Diff. | 0% | 0% | 0% | 0% | 0% | 0% | −58.7% | 29% | −48.7% | 25% | −78.4% | 39% | −92% | 43% | −95.4% | 54% | |
| System and automation | Data | 2.07 | 2.93 | 1.79 | 3.21 | 1.65 | 3.35 | 2.29 | 2.71 | 2.21 | 2.79 | 2.51 | 2.49 | 2.20 | 2.8 | 3.17 | 1.83 |
| Projection | 2.07 | 2.93 | 1.79 | 3.21 | 1.65 | 3.35 | 0.90 | 4.10 | 1.11 | 3.89 | 0.51 | 4.49 | 0.17 | 4.83 | 0.13 | 4.87 | |
| Diff. | 0% | 0% | 0% | 0% | 0% | 0% | −60.9% | 34% | −49.7% | 28% | −79.8% | 45% | −92% | 42% | −95.8% | 62% | |
| Construction | Data | 2,906,250 | 2,433,277 | 2,393,300 | 1,218,287 | 1,511,919 | 688,199 | 244,624 | 181,877 | ||||||||
| Projection | 2,906,250 | 2,433,277 | 2,393,300 | 1,218,287 | 1,511,919 | 688,199 | 244,624 | 181,877 | |||||||||
| Diff. | 0% | 0% | 0% | 0% | 0% | 0% | 0% | 0% | |||||||||
Table A13.
Efficiency and scale efficiency of traditional and proposed model (Case 2).
Table A13.
Efficiency and scale efficiency of traditional and proposed model (Case 2).
| Traditional Model | Proposed Model | |||||
|---|---|---|---|---|---|---|
| CCR | BCC | SE | CCR | BCC | SE | |
| L1 | 60.82% | 100.00% | 0.61 | 100.00% | 100.00% | 1.00 |
| L2 | 100.00% | 100.00% | 1 | 100.00% | 100.00% | 1.00 |
| L3 | 82.22% | 100.00% | 0.82 | 100.00% | 100.00% | 1.00 |
| L4 | 90.56% | 90.84% | 1 | 41.32% | 82.52% | 0.50 |
| L5 | 100.00% | 100.00% | 1 | 51.28% | 82.52% | 0.62 |
| M2 | 100.00% | 100.00% | 1.00 | 100.00% | 100.00% | 1.00 |
| M3 | 100.00% | 100.00% | 1.00 | 40.55% | 100.00% | 0.41 |
| M4 | 74.02% | 100.00% | 0.74 | 21.20% | 80.22% | 0.26 |
Table A14.
DEA result with BCC of traditional model (Case 2).
Table A14.
DEA result with BCC of traditional model (Case 2).
| DMU | L1 | L2 | L3 | L4 | L5 | |
| Efficiency | 100% | 100% | 100% | 100% | 100% | |
| Employee | Data | 54,808 | 34,353 | 30,181 | 10,479 | 11,777 |
| Projection | 54,808 | 34,353 | 30,181 | 10,479 | 11,777 | |
| Diff. | 0.0% | 0.0% | 0.0% | 0.0% | 0.0% | |
| Dock and berth | Data | 11 | 5 | 7 | 4 | 4 |
| Projection | 11 | 5 | 7 | 4 | 4 | |
| Diff. | 0.0% | 0.0% | 0.0% | 0.0% | 0.0% | |
| Construction | Data | 2,906,250 | 2,433,277 | 2,393,300 | 1,218,287 | 1,511,919 |
| Projection | 2,906,250 | 2,433,277 | 2,393,300 | 1,218,287 | 1,511,919 | |
| Diff. | 0.00% | 0.00% | 0.00% | 0.00% | 0.00% | |
| DMU | M2 | M3 | M4 | |||
| Efficiency | 100% | 100% | 100% | |||
| Employee | Data | 7941 | 2142 | 2159 | ||
| Projection | 7941 | 2142 | 2142 | |||
| Diff. | 0% | 0% | −0.8% | |||
| Dock and berth | Data | 5 | 3 | 3 | ||
| Projection | 5 | 3 | 3 | |||
| Diff. | 0% | 0% | 0% | |||
| Construction | Data | 688,199 | 244,624 | 181,877 | ||
| Projection | 688,199 | 244,624 | 244,624 | |||
| Diff. | 0% | 0% | 34.5% |
Table A15.
DEA result with CCR of traditional model (Case 2).
Table A15.
DEA result with CCR of traditional model (Case 2).
| DMU | L1 | L2 | L3 | L4 | L5 | |
| Efficiency | 60.82% | 100% | 82.22% | 90.56% | 100% | |
| Employee | Data | 54,808 | 34,353 | 30,181 | 10,479 | 11,777 |
| Projection | 33,334.78 | 34,353 | 24,815.44 | 9489.77 | 11,777 | |
| Diff. | −39.2% | 0% | −17.8% | −9.4% | 0% | |
| Dock and berth | Data | 11 | 5 | 7 | 4 | 4 |
| Projection | 6.69 | 5 | 5.76 | 3.22 | 4 | |
| Diff. | −39.2% | 0% | −17.8% | −19.4% | 0% | |
| Construction | Data | 2,906,250 | 2,433,277 | 2,393,300 | 1,218,287 | 1,511,919 |
| Projection | 2,906,250 | 2,433,277 | 2,393,300 | 1,218,287 | 1,511,919 | |
| Diff. | 0% | 0% | 0% | 0% | 0% | |
| DMU | M2 | M3 | M4 | |||
| Efficiency | 100% | 100% | 74.02% | |||
| Employee | Data | 7941 | 2142 | 2159 | ||
| Projection | 7941 | 2142 | 1598.08 | |||
| Diff. | 0% | 0% | −26% | |||
| Dock and berth | Data | 5 | 3 | 3 | ||
| Projection | 5 | 3 | 2.22 | |||
| Diff. | 0% | 0% | −26% | |||
| Construction | Data | 688,199 | 244,624 | 181,877 | ||
| Projection | 688,199 | 244,624 | 181,877 | |||
| Diff. | 0% | 0% | 0% |
Table A16.
DEA results with BCC of proposed model (Case 2).
Table A16.
DEA results with BCC of proposed model (Case 2).
| DMU | L1 | L2 | L3 | L4 | L5 | ||||||
| Efficiency | 100% | 100% | 100% | 82.52% | 82.52% | ||||||
| Process | Data | 2.15 | 2.85 | 1.70 | 3.30 | 2.01 | 2.99 | 2.06 | 2.94 | 2.06 | 2.94 |
| Projection | 2.15 | 2.85 | 1.70 | 3.30 | 2.01 | 2.99 | 1.70 | 3.3 | 1.70 | 3.3 | |
| Diff. | 0% | 0% | 0% | 0% | 0% | 0% | −17.5% | 11% | −17.5% | 11% | |
| System and automation | Data | 2.07 | 2.93 | 1.79 | 3.21 | 1.65 | 3.35 | 2.29 | 2.71 | 2.21 | 2.79 |
| Projection | 2.07 | 2.93 | 1.79 | 3.21 | 1.65 | 3.35 | 1.79 | 3.21 | 1.79 | 3.21 | |
| Diff. | 0% | 0% | 0% | 0% | 0% | 0% | −21.8% | 16% | −19% | 13% | |
| Construction | Data | 2,906,250 | 2,433,277 | 2,393,300 | 1,218,287 | 1,511,919 | |||||
| Projection | 2,906,250 | 2,433,277 | 2,393,300 | 2,433,277 | 2,433,277 | ||||||
| Diff. | 0% | 0% | 0% | 99.7% | 60.9% | ||||||
| DMU | M2 | M3 | M4 | ||||||||
| Efficiency | 100% | 100% | 80.22% | ||||||||
| Process | Data | 2.23 | 2.77 | 2.26 | 2.74 | 2.78 | 2.22 | ||||
| Projection | 2.23 | 2.77 | 2.26 | 2.74 | 2.23 | 2.77 | |||||
| Diff. | 0% | 0% | 0% | 0% | −19.8% | 20% | |||||
| System and automation | Data | 2.51 | 2.49 | 2.2 | 2.8 | 3.17 | 1.83 | ||||
| Projection | 2.51 | 2.49 | 2.2 | 2.8 | 2.51 | 2.49 | |||||
| Diff. | 0% | 0% | 0% | 0% | −20.8% | 27% | |||||
| Construction | Data | 688,199 | 244,624 | 181,877 | |||||||
| Projection | 688,199 | 244,624 | 688,199 | ||||||||
| Diff. | 0% | 0% | 278.4% | ||||||||
Table A17.
DEA results with CCR of proposed model (Case 2).
Table A17.
DEA results with CCR of proposed model (Case 2).
| DMU | L1 | L2 | L3 | L4 | L5 | ||||||
| Efficiency | 100% | 100% | 100% | 41.32% | 51.28% | ||||||
| Process | Data | 2.15 | 2.85 | 1.7 | 3.3 | 2.01 | 2.99 | 2.06 | 2.94 | 2.06 | 2.94 |
| Projection | 2.15 | 2.85 | 1.7 | 3.3 | 2.01 | 2.99 | 0.85 | 4.15 | 1.06 | 3.94 | |
| Diff. | 0% | 0% | 0% | 0% | 0% | 0% | −58.7% | 29% | −48.7% | 25% | |
| System and automation | Data | 2.07 | 2.93 | 1.79 | 3.21 | 1.65 | 3.35 | 2.29 | 2.71 | 2.21 | 2.79 |
| Projection | 2.07 | 2.93 | 1.79 | 3.21 | 1.65 | 3.35 | 0.90 | 4.10 | 1.11 | 3.89 | |
| Diff. | 0% | 0% | 0% | 0% | 0% | 0% | −60.9% | 34% | −49.7% | 28% | |
| Construction | Data | 2,906,250 | 2,433,277 | 2,393,300 | 1,218,287 | 1,511,919 | |||||
| Projection | 2,906,250 | 2,433,277 | 2,393,300 | 1,218,287 | 1,511,919 | ||||||
| Diff. | 0% | 0% | 0% | 0% | 0% | ||||||
| DMU | M2 | M3 | M4 | ||||||||
| Efficiency | 100% | 40.55% | 21.2% | ||||||||
| Process | Data | 2.23 | 2.77 | 2.26 | 2.74 | 2.78 | 2.22 | ||||
| Projection | 2.23 | 2.77 | 0.79 | 4.21 | 0.59 | 4.41 | |||||
| Diff. | 0% | 0% | −64.9% | 35% | −78.8% | 50% | |||||
| System and automation | Data | 2.51 | 2.49 | 2.20 | 2.8 | 3.17 | 1.83 | ||||
| Projection | 2.51 | 2.49 | 0.89 | 4.11 | 0.66 | 4.34 | |||||
| Diff. | 0% | 0% | −59.4% | 32% | −79.1% | 58% | |||||
| Construction | Data | 688,199 | 244,624 | 181,877 | |||||||
| Projection | 688,199 | 244,624 | 181,877 | ||||||||
| Diff. | 0% | 0% | 0% | ||||||||
References
- Tan, S.K. Race in the Shipbuilding Industry: Cases of South Korea, Japan and China. IJEAS Int. J. East Asian Stud. 2017, 6, 65–81. [Google Scholar]
- Back, M.G.; Woo, J.H.; Lee, P.; Shin, J.G. Productivity improvement strategies using simulation in offshore plant construction. J. Ship Prod. Des. 2017, 33, 144–155. [Google Scholar] [CrossRef]
- Kwon, Y.; Jeong, Y.; Woo, J.; Oh, D.; Kim, H.; Shin, I.-S.; Jung, S.; Im, S.; Jung, C. Korean Technical Innovation: Toward Autonomous Ship and Smart Shipbuilding to Ensure Safety. In Proceedings of the International Seminar on Safety and Security of Autonomous Vessels (ISSAV) and European STAMP Workshop and Conference (ESWC) 2019, Helsinki, Finland, 17–20 September 2020; pp. 83–94. [Google Scholar]
- Stanić, V.; Hadjina, M.; Fafandjel, N.; Matulja, T. Toward Shipbuilding 4.0-An Industry 4.0 Changing the Face of the Shipbuilding Industry. Brodogr. Teor. Praksa Brodogr. Pomor. Teh. 2018, 69, 111–128. [Google Scholar]
- Wang, S.; Wan, J.; Li, D.; Zhang, C. Implementing Smart Factory of Industrie 4.0: An Outlook. Int. J. Distrib. Sens. Netw. 2016, 12. [Google Scholar] [CrossRef]
- Lucke, D.; Constantinescu, C.; Westkämper, E. Smart Factory-A Step towards the Next Generation of Manufacturing. In Manufacturing Systems and Technologies for the New Frontier; Springer: London, UK, 2008. [Google Scholar]
- Zuehlke, D. SmartFactory—Towards a factory-of-things. Proc. Annu. Rev. Control 2010, 34, 129–138. [Google Scholar] [CrossRef]
- Machado, C.G.; Winroth, M.; Carlsson, D.; Almström, P.; Centerholt, V.; Hallin, M. Industry 4.0 readiness in manufacturing companies: Challenges and enablers towards increased digitalization. Procedia CIRP 2019, 81, 1113–1118. [Google Scholar] [CrossRef]
- Machado, C.G.; Winroth, M.; Carlsson, D.; Centerholt, V. Digitalization for sustainable production: Exploring the use of digital maturity models. In Proceedings of the 6th EurOMA Sustainable Operations and Supply Chains Forum, Gothenburg, Sweden, 18–19 March 2019. [Google Scholar]
- Lamb, T. Ship Design and Construction; SNAME: New York, NY, USA, 2003. [Google Scholar]
- Thompson, K. Smart Manufacturing Operations Planning and Control Program; National Institute of Standards and Technology: Gaithersburg, MD, USA, 2014.
- Chen, D.; Thiede, S.; Schudeleit, T.; Herrmann, C. A holistic and rapid sustainability assessment tool for manufacturing SMEs. Cirp Ann. Manuf. Technol. 2014, 63, 437–440. [Google Scholar] [CrossRef]
- IMPULS. Foundation of the German Engineering Federation (VDMA) Industry 4.0 Readiness Online Self-Check for Businesses. Available online: https://www.industrie40-readiness.de/?lang=en (accessed on 9 February 2021).
- CMMI Product Team. CMMI for Development, Version 1.3; Carnegie Mellon University: Pittsburgh, PA, USA, 2010. [Google Scholar]
- Castor, N.; Damberg, D.; Sjöborg, E. MESA MOM Capability Maturity Level. Available online: http://www.control.lth.se/fileadmin/control/Education/EngineeringProgram/FRTN20/2016/Report-mesa-mom-capability__1_.pdf (accessed on 9 February 2021).
- Object Management Group. Business Process Maturity Model; Object Management Group, Inc.: Needham, MA, USA, 2008. [Google Scholar]
- Rockwell Automation. The Connected Enterprise Maturity Model. Available online: https://literature.rockwellautomation.com/idc/groups/literature/documents/wp/cie-wp002_-en-p.pdf (accessed on 9 February 2021).
- Brunner, M.; Jodlbauer, H.; Schagerl, M. Reifegradmodell Industrie 4.0-Unternehmen durch Industrie 4.0 stärken. Ind. Manag. 2016, 32, 49–52. [Google Scholar]
- Pwc. The Industry 4.0/Digital Operations Self Assessment. Available online: https://i40-self-assessment.pwc.de/ (accessed on 9 February 2021).
- Jung, K.; Kulvatunyou, B.; Choi, S.; Brundage, M.P. An overview of a smart manufacturing system readiness assessment. In Proceedings of the IFIP Advances in Information and Communication Technology, Arlington, VA, USA, 17 March 2017. [Google Scholar]
- Kim, C.M.; Lee, J.C.; Choi, S.W. Study for Development Directions and Real Application Cases of Korea Production System (KPS). Appl. Mech. Mater. 2015, 752, 1320–1332. [Google Scholar] [CrossRef]
- Lee, J.; Jun, S.; Chang, T.W.; Park, J. A smartness assessment framework for smart factories using analytic network process. Sustainability 2017, 9, 794. [Google Scholar] [CrossRef]
- Lamb, T.; Chung, H.; Spicknall, M.; Shin, J.G.; Woo, J.H.; Koenig, P. Simulation-based performance improvement for shipbuilding processes. J. Ship Prod. 2006, 22, 49–65. [Google Scholar] [CrossRef]
- Floriano, P.; Lamb, T.; Souza, C. Shipbuilding performance benchmarking. Int. J. Bus. Perform. Manag. 2009, 11, 216–235. [Google Scholar]
- Mayo, G.; Shoghli, O.; Morgan, T. Investigating Efficiency Utilizing Data Envelopment Analysis: Case Study of Shipyards. J. Infrastruct. Syst. 2020, 26, 04020013. [Google Scholar] [CrossRef]
- Bertram, V. Strategic control of productivity and other competitiveness parameters. Proc. Inst. Mech. Eng. Part M J. Eng. Marit. Environ. 2003, 217, 61–70. [Google Scholar] [CrossRef]
- Park, J.; Lee, D.; Zhu, J. An integrated approach for ship block manufacturing process performance evaluation: Case from a Korean shipbuilding company. Int. J. Prod. Econ. 2014, 156, 214–222. [Google Scholar] [CrossRef]
- Nam, S.H.; Back, M.G.; Lee, S.M.; Hwang, I.H.; Shin, J.G. Development of production plan assessment system for productivity improvement using AHP method. In Proceedings of the International Offshore and Polar Engineering Conference, Kona, HW, USA, 21 June 2015. [Google Scholar]
- Chao, S.-L.; Yeh, Y.-H. Comparing the productivity of major shipyards in China, South Korea, and Japan—An application of a metafrontier framework. Marit. Bus. Rev. 2020, 5, 193–210. [Google Scholar] [CrossRef]
- Banker, R.D.; Charnes, A.; Cooper, W.W. Some Models for Estimating Technical and Scale Inefficiencies in Data Envelopment Analysis. Manag. Sci. 1984, 30, 1078–1092. [Google Scholar] [CrossRef]
- Satchell, P. Innovation and Automation; Routledge: London, UK, 2018; ISBN 978-0-429-83202-4. [Google Scholar]
- Shin, K.-H.; Ciccantell, P.S. The Steel and Shipbuilding Industries of South Korea: Rising East Asia and Globalization. J. World Syst. Res. 2009, 15, 167–192. [Google Scholar] [CrossRef]
- Charnes, A.; Cooper, W.W.; Rhodes, E. Measuring the efficiency of decision making units. Eur. J. Oper. Res. 1978, 2, 429–444. [Google Scholar] [CrossRef]
- Rashidi, K. AHP versus DEA: A comparative analysis for the gradual improvement of unsustainable suppliers. Benchmarking Int. J. 2020, 27, 2283–2321. [Google Scholar] [CrossRef]
- Dyson, R.; Allen, R.; Camanho, A.; Podinovski, V.; Sarrico, C.; Shale, E. Pitfalls and protocols in DEA. Eur. J. Oper. Res. 2001, 132, 245–259. [Google Scholar] [CrossRef]
- Hong, S. Current status and tasks of small and medium-sized shipbuilding industry in Korea. Kiet Ind. Econ. 2005, 10, 60–69. [Google Scholar]
- Barros, C.P.; Alves, C.A. Hypermarket retail store efficiency in Portugal. Int. J. Retail. Distrib. Manag. 2003, 31, 549–560. [Google Scholar] [CrossRef]
- IEEE Standard for Functional Modeling Language—Syntax and Semantics for IDEF0; Software Engineering Standards Committee of the IEEE Computer Society, IEEE-SA Standards Board, The Institute of Electrical and Electronics Engineers, Inc.: New York, NY, USA, 1998; pp. 1017–2394.


Publisher’s Note: MDPI stays neutral with regard to jurisdictional claims in published maps and institutional affiliations. |
© 2021 by the authors. Licensee MDPI, Basel, Switzerland. This article is an open access article distributed under the terms and conditions of the Creative Commons Attribution (CC BY) license (http://creativecommons.org/licenses/by/4.0/).