Article

Analysis of Developmental Chronology of South Korean Compressed Growth as a Reference from Sustainable Development Perspectives

1
Department of Environmental Science and Ecological Engineering, Korea University, Seoul 02841, Korea
2
Risk Advisory, Deloitte Anjin LLC, Seoul 07326, Korea
3
Research & Development Division, Hyundai Motor Group, Hwaseong-si, Gyeonggi-do 18280, Korea
4
Center for Climate Technology Cooperation, Green Technology Center Korea (GTC), Seoul 04554, Korea
5
GHG Mitigation Research Team, Greenhouse Gas Inventory and Research Center of Korea, Seoul 03186, Korea
*
Author to whom correspondence should be addressed.
Sustainability 2021, 13(4), 1905; https://doi.org/10.3390/su13041905
Submission received: 3 August 2020 / Revised: 15 January 2021 / Accepted: 3 February 2021 / Published: 10 February 2021

Abstract

:
Global challenges including overpopulation, climate change, and income inequality have increased, and a demand for sustainability has emerged. Decision-making for sustainable development is multifaceted and interlinked, owing to the diverse interests of different stakeholders and political conflicts. Analysing a situation from all social, political, environmental, and economic perspectives is necessary to achieve balanced growth and facilitate sustainable development. South Korea was among the poorest countries following the Korean War; however, it has developed rapidly since 1955. This growth was not limited to economic development alone, and the chronology of South Korean development may serve as a reference for development in other countries. Here, we explore the compressed growth of South Korea using a narrative approach and time-series, comparative, and spatial analyses. Developmental indicators, along with the modern history of South Korea, are introduced to explain the reasons for compressed growth. The development of the mid-latitude region comprising 46 countries in this study, where nearly half of Earth’s population resides, was compared with that of South Korea; results show that the developmental chronology of South Korea can serve as a reference for national development in this region.

1. Introduction

Global challenges have become increasingly prevalent. Earth’s population is predicted to reach 10 billion by the end of the century; climate change threatens the world with water, food, and energy shortages, among other disasters; and income inequality has placed great pressures upon society. All of these factors have the potential to create social and political conflict in both developing and developed countries [1,2]. Additionally, the decision making involved in sustainable development can be vague, complicated, open-ended, and interlinked due to the various synergies, trade-offs, and uncertainties among economic, social, environmental, and political facets [3,4,5].
To improve upon the current situation of the world, immediate and collective action facilitating the creation of a sustainable future is needed. However, fundamental transformations are necessary to progress toward this goal, and we have only a few decades to enact these changes. Considering the urgency associated with sustainable development, the United Nations (UN) adopted the 2030 Agenda for Sustainable Development in 2015 and called upon all nations to take immediate action [2]. The 17 Sustainable Development Goals (SDGs) included in the UN agenda offer an opportunity to balance the different aspects of sustainable development.
To ensure that issues of the past are not repeated, it is desirable to have a point of reference for national development. Although developed Western countries can serve as models for developing nations, many developed countries have long histories of development exceeding two centuries. For instance, development of the United States, Germany, France, and other Western European countries can be used as a good model, but since their prosperity has been lasting for centuries there is centuries-wide, experience gap to which developing countries cannot apply the model directly. Considering that urgent development is required, such models are not applicable in the modern context of developing countries. In contrast, South Korea, which is a developing country, is often cited as one of the best models of compressed economic development because it has experienced rapid changes within the last half century, despite some limitations including the development by an authoritarian state and the polarisation of society [6,7]. Therefore, developing nations can refer to the relatively recent development of South Korea.
After the Korean War ended in 1953, the entire Korean Peninsula was devastated, and the Korean people had to rebuild the shattered post-war economy. South Korea was among the poorest of ~120 nations in the UN at that time [8]. However, over 50 years, South Korea experienced a significant increase in the gross domestic product (GDP), rapid industrialisation, and rising urban populations [9,10,11]. There have also been great improvements in literacy and higher education, as well as a significant increase in life expectancy [12,13].
Most global citizens expect the world to develop sustainably and believe that a more sustainable future is our final destination. The UN SDGs incorporate many issues of social, economic, and environmental development. These goals consider nearly every aspect of our lives and can be systematically categorised into several components, such as the biosphere, society, and economy, as suggested by Rockström and Sukhdev [14]. To understand sustainable development from various angles, an integrated and holistic approach is required. This study introduces the development of South Korea from economic, environmental, social, and political perspectives; the development status of countries in the mid-latitude region (MLR) is then comparatively analysed from these perspectives.

2. Materials and Methods
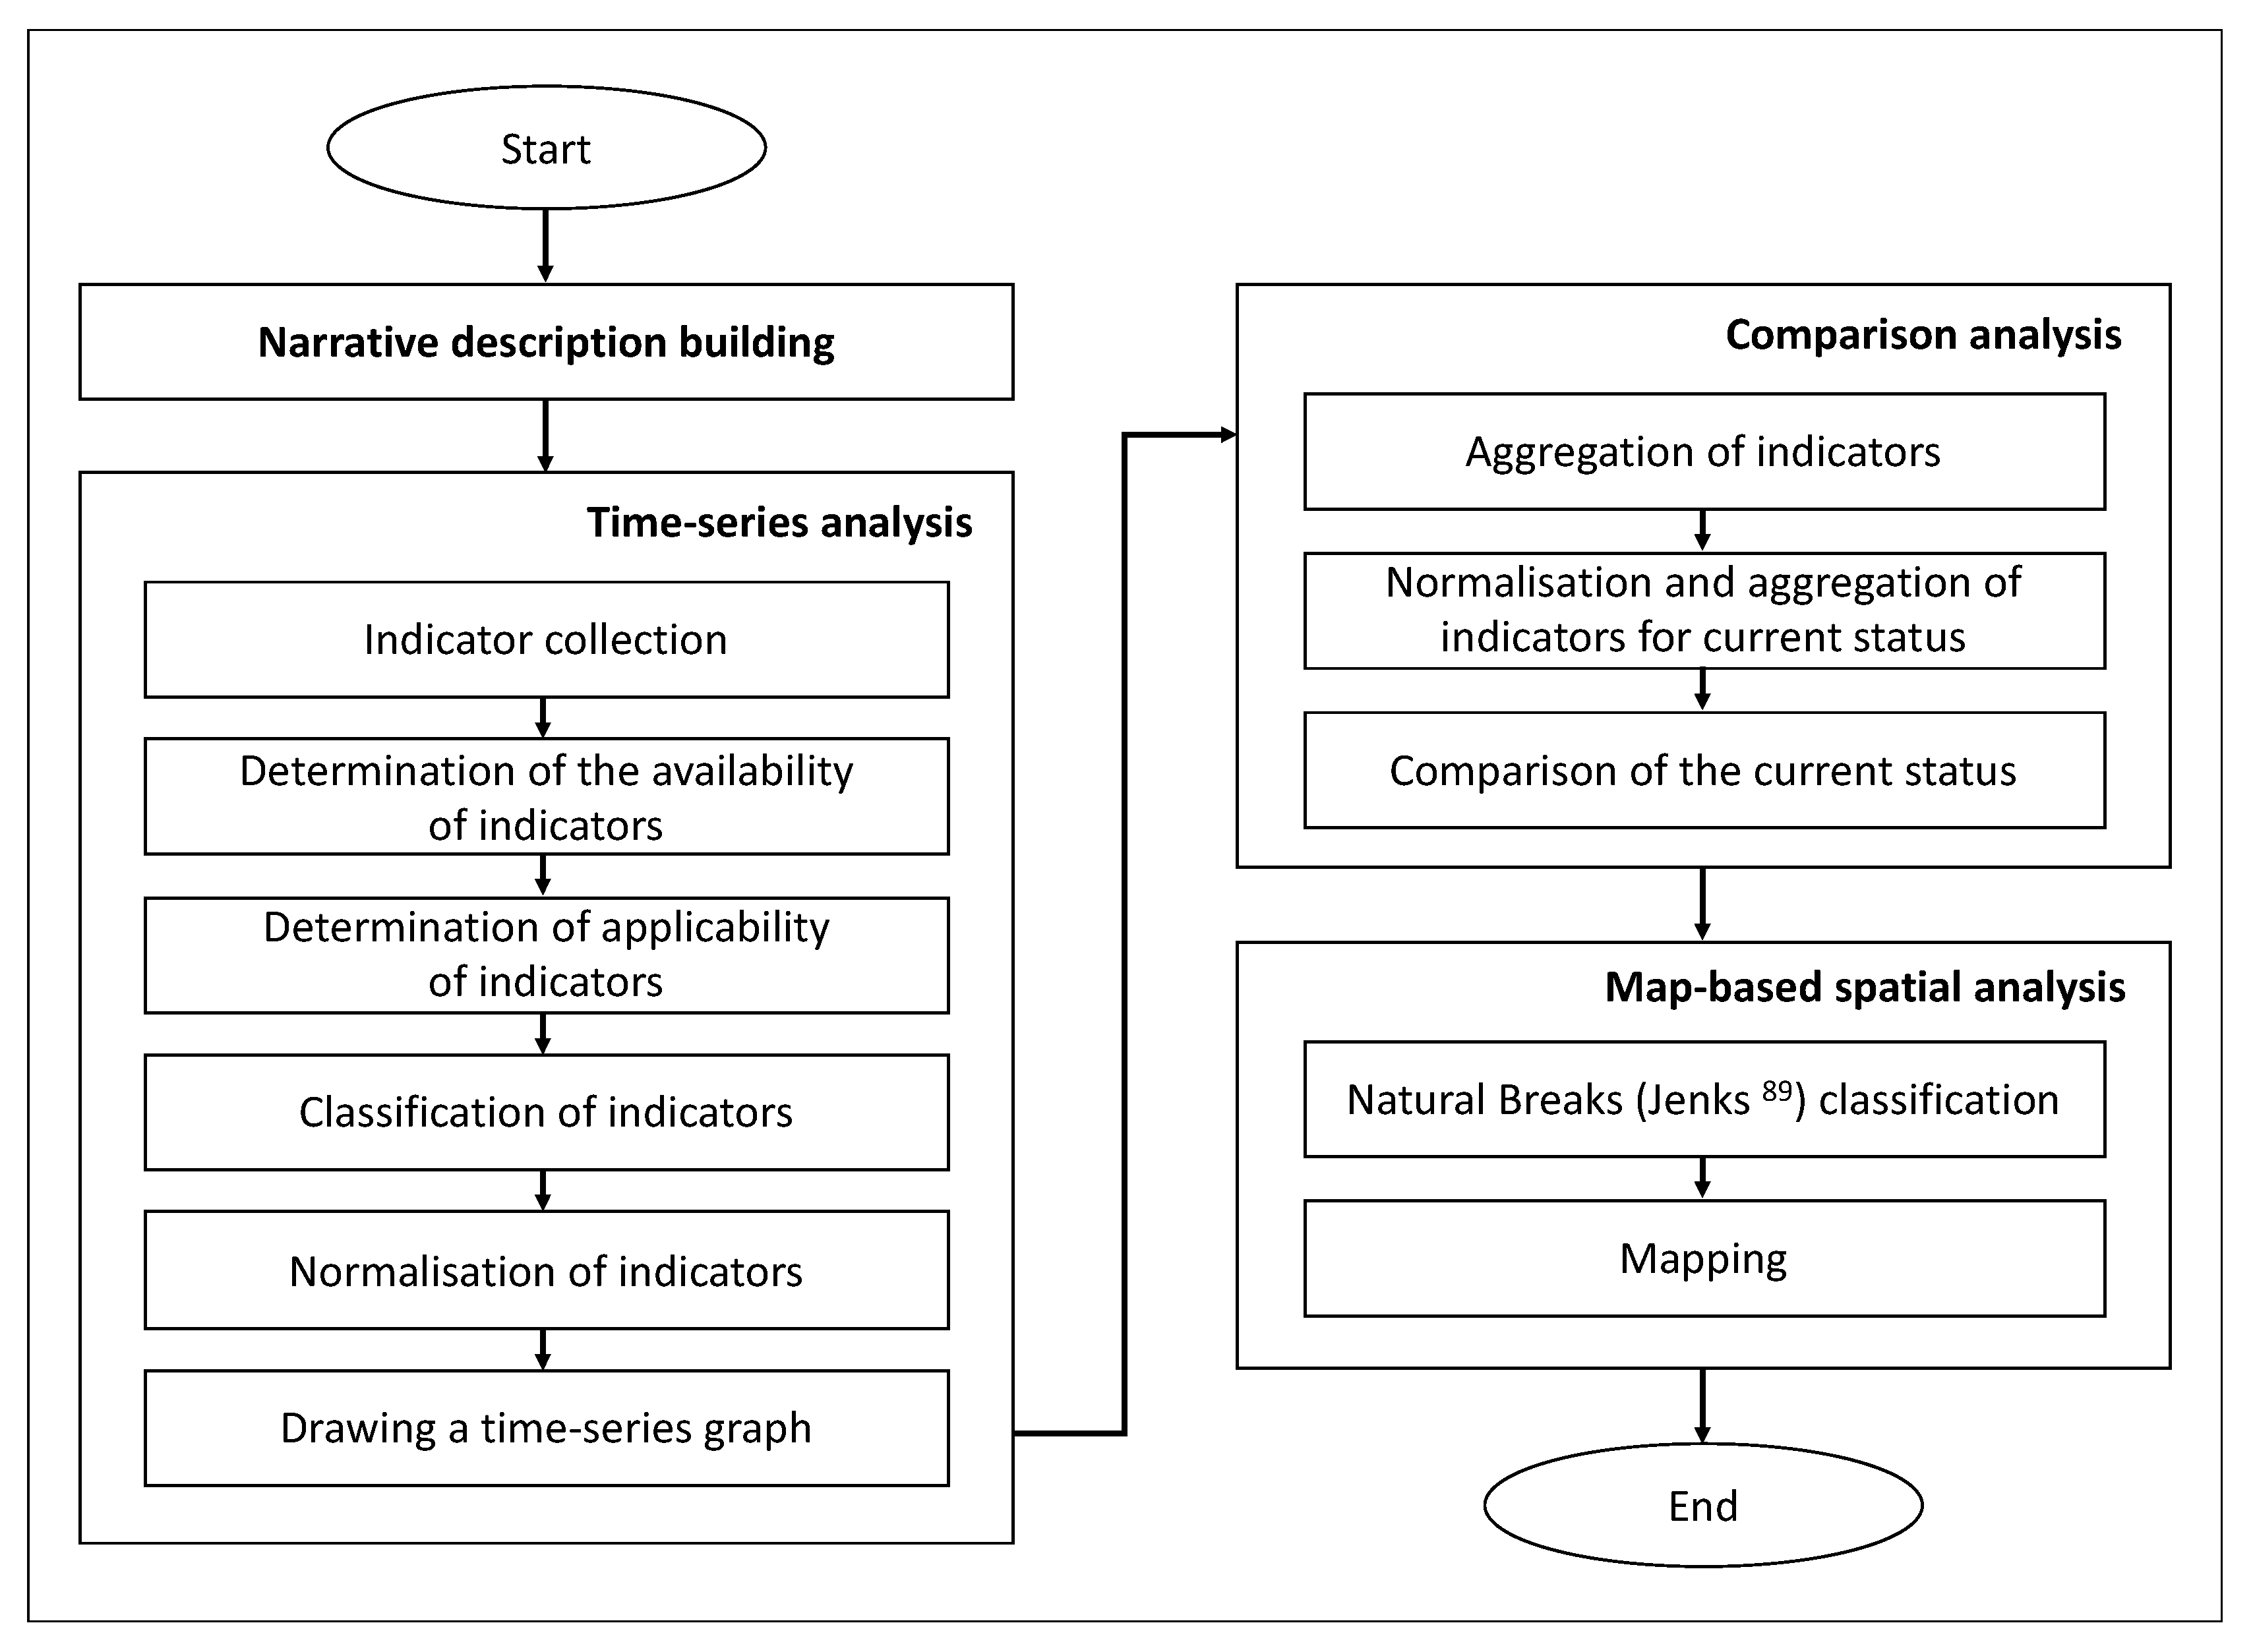
2.1. Methodology

To analyse the current developmental status of MLR countries from economic, environmental, social, and political perspectives, we developed a method that mainly consisted of four components (Figure 1): narrative building, and time-series, comparative, and map-based spatial analyses.

2.1.1. Narrative Description and Time-Series Analysis of the Developmental History of South Korea

South Korea has a unique developmental history that may be used as a model for developing countries where rapid and sustainable development is necessary. Moreover, countries who seek such development face global externalities, complexity and interdependence such as climate change impacts and technological transformation, which require a development in transition [15]. Systems transition seeks long-term transition goals to create a new system for sustainable development [16]. In the case of socio-technical transition, it takes a multi-level perspective considering the socio and cultural dynamics between different stakeholders such as market, technology, policy and culture, which govern the activities related to innovation and systems transition [17]. With this backdrop, to build a narrative description, sustainable development could be referred to four sectors: economy, environment, society, and politics [3,4,5]. Therefore, the scope of the history could be narrowed down into these sectors. Also, the chronology of the development of South Korea was analysed with its history classified into several phases by decade.
The developmental history of South Korea was not only narratively described but was also analysed using relevant indicators. As a system boundary for time-series analysis is defined from building narrative description phase, indicators were collected based on the narrative history and on a five-year basis. After, the availability and applicability of the indicators were assessed for each time period to determine if they were suitable. The indicators that were considered suitable were then classified into the four sectors. To view the developmental trends in a time series, the indicators collected on a five-year basis were rescaled via normalisation over the period from 1950 to 2015. For normalisation, min–max normalisation was selected. The results were plotted on a time-series graph and the actual minimum and maximum values of each indicator were indicated on the graph.

2.1.2. Comparative Analysis via Referencing South Korean Development in 2015

To estimate the current development status in terms of the economies, societies, environments, and politics of 46 MLR countries, the South Korean indicators were aggregated by averaging the normalised indicators for each sector, thereby providing a reference for the MLR countries. Next, the indicator values in the year 2015 for the MLR countries were normalised using the maximum and minimum values of the South Korean indicators and were then averaged for each sector. The year 2015 was used as the most recently analysed year because the developmental history of South Korea was analysed on a five-year basis. For indicators with negative connotations, their values were shown to be negative. The averaged values were then displayed as points in a radial graph of each sector for numerical analysis. If a value was >1.5 or less than −1.5, it was considered to 1.5 or −1.5, respectively. Based on the points that represent the past status of South Korea, the current status of the MLR countries could be estimated.

2.1.3. Latitudinal Map Comparison

For spatial analysis, MLR countries were classified into five levels using natural breaks [18]. This method minimises the sum of the variance within a class and maximises the variance among different classes, such that the values will be naturally placed into meaningful groups. The five levels were classified into the categories of role model, good, moderate, low, and alarming. The countries at the role-model level were those that had the ability to assist countries at lower levels, while the countries at the alarming level were those that need technological and financial support from other countries.

2.2. Materials

For our analyses, a total of 18 indicators were used in this study (Table 1). They were collected to represent four sectors of development, specifically: economic, environmental, social, and political development.

2.2.1. Economic Indicators

To analyse economic development, four indicators were used: airport transport (registered), electric power consumption, employment-to-population ratio, and GDP. Registered airport transport indicates the worldwide departures of registered carriers. These include domestic take-offs and take-offs abroad for an air carrier that is registered in the specified country [19]. Expansion of air transportation ensures improved access towards the market, enhancing national and international trade and exchange, which is critical in the open global economy [20,21]. Electric power consumption measures the productions of power plants, as well as that of combined heat and power plants, minus transmission, distribution, and transformation losses, in addition to the electric power consumed by heat and power plants [22]. Solid connection of economic prosperity and electricity consumption is axiomatic [23,24]. Even though decoupling of economic growth and electricity consumption is desired under the sustainable development regime and already occurs in a few developed countries [25], the relation of the two is still in effect to use consumption of electricity as a measure of economic growth in most counties of this study [23]. The employment-to-population ratio is the proportion of a country’s working-age population that is employed [26]. A high percentage indicates that a large proportion of a country is employed, while a low percentage indicates that a large portion of population is not directly involved in market-related activities because they are either unemployed or out of the labour force. The GDP at the purchaser’s prices is the sum of the gross value contributed by all residential producers to the economy plus any product taxes and minus any subsidies that are not included in the values of the products [27]. Despite the referred limitations of GDP as a sustainable development indicator [28], it was considered that it could represent the economic growth of the countries when it is complemented with other environmental, social and political indicators in this study. In this study, the data are presented in current US dollars (USD), wherein the dollar amounts for GDP are converted from domestic currencies using single-year official exchange rates.

2.2.2. Environmental Indicators

To analyse environmental development, five indicators were used: PM2.5 air pollution (mean annual exposure), biodiversity, CO2 emissions, electricity production from renewable sources (excluding hydroelectricity), and forest area. The mean annual exposure of PM2.5 air pollution is the average level of exposure of a nation’s population to concentrations of suspended particles measuring less than 2.5 µm in aerodynamic diameter. These particles are capable of penetrating deep into the respiratory tract and may cause severe health issues [29]. Exposure is calculated by weighing the mean annual concentrations of PM2.5 by the population in both urban and rural areas. The biodiversity indicator that was developed by Klein Goldewijk et al. [30] represents an estimation of the remaining biodiversity or naturalness within a country. It is based on the GLOBIO3 approach and is represented by the mean species abundance (MSA) indicator, which can be used to demonstrate the integrity and intactness of biodiversity. It can be considered a proxy for the United Nations Convention on Biological Diversity (UNCBD) indicator for trends in the abundance of species [31,32]. CO2 emissions are those stemming from the burning of fossil fuels and industrial processes. In this study, the dataset from the World Bank, based on the concept that anthropogenic carbon dioxide emissions result primarily from fossil fuel combustion and cement manufacturing, is used [33]. The data Electricity production from renewable sources (excluding hydroelectricity) is the percentage of electricity produced from renewables, including geothermal, solar, tidal, wind, biomass, and biofuel resources [34]. As rapid climate change is highly attributed to conventional fossil fuel combustion, energy transition to renewable sources is a key component in cutting anthropogenic emission. The forest area is the percentage of land under natural or planted stands of trees that are at least 5 m in situ, whether productive or not. It excludes tree stands in agricultural production systems and trees in urban parks and gardens [35].

2.2.3. Social Indicators

To analyse social development, six indicators were used: the average number of years of education, the Human Development Index (HDI), percentage of assemblywomen, educational inequality Gini coefficient, life expectancy, and urban population. The average years of education is the average number of years of education for people aged 15 years and older. Most of these data was derived from census data or previous studies by van Leeuwen and van Leeuwen-Li (2013) [36]. The HDI is a statistical measurement of achievements across three dimensions of human development: a long and healthy life, access to knowledge, and a decent standard of living [37]. The percentage of assemblywomen depicts the percentage of parliamentary seats in a single or lower chamber that are held by women [38,39]. It is calculated by dividing the current number of women by the current number of parliamentary members. The educational inequality Gini coefficient is the inequality of the distribution of education for the total population aged 15 years and older and was developed by van Leeuwen and van Leeuwen-Li (2013) [40]. Life expectancy at birth indicates the number of years a new-born infant would live if prevailing patterns of mortality at the time of its birth were to remain the same throughout its lifetime. Concentration of social, economic, and political resources in cities with urbanization brings innovative outputs, as economies of scale for urban infrastructure is enacted [41]. Urban population is the percentage of the total population living in urban area [42]. The definition of “urban” differed for each country; therefore, the definitions provided by the national statistical offices for carrying out the latest available census were used for UNDESA of which we used the data.

2.2.4. Political Indicators

To analyse political development, three indicators were used: Corruption Perceptions Index (CPI), Liberal Democracy Index (LDI), and military expenditures. The CPI measures the perceived levels of public sector corruption according to experts and businesspeople. It uses a scale from 0–100, where 0 is highly corrupt and 100 is very incorrupt [43]. The CPI draws upon 13 types of data, including bribery, diversion of public funds, use of public office for private gain, nepotism in civil service, and state capture. The LDI that was developed by Varieties of Democracy (V-Dem) is measured as the existence of electoral democracy in combination with three additional components: the rule of law ensuring respect for civil liberties, as well as constraints on the executive power by the judiciary and the legislature [44,45]. The military expenditure indicator was developed by the Stockholm International Peace Research Institute (SIPRI), and is the percentage of military expenditures that includes all current and capital expenditures on the armed forces with respect to the GDP [46]. From massive empirical studies, democratic society pursues peace, freedom, and prosperity, which appears to have a negative effect on military spending [47,48]. Level of democracy as a metric of political development could be gauged from the amount of military expenditures.

2.3. Study Area

The MLR, broadly defined as the region between the 30° and 60° parallels, is approximately 6700 km wide and is of critical concern with respect to many socioeconomic and environmental issues. This region contains approximately half of the global population and accounts for a large fraction of global economic activities [49,50,51,52,53,54,55,56,57]. In this study, 46 countries (Afghanistan, Albania, Algeria, Armenia, Azerbaijan, Bhutan, Bosnia and Herzegovina, Bulgaria, China, Croatia, Cyprus, Egypt, France, Georgia, Greece, Iran, Iraq, Israel, Italy, Japan, Jordan, Kazakhstan, Kuwait, Kyrgyzstan, Lebanon, Macedonia, Malta, Mongolia, Montenegro, Morocco, Nepal, North Korea, Pakistan, Portugal, Romania, Saudi Arabia, Serbia, South Korea, Spain, Syria, Tajikistan, Tunisia, Turkey, Turkmenistan, the United States, and Uzbekistan) were designated as MLRs by limiting the scope between the 28° and 48° parallels, wherein most of the world’s development, environmental issues, and poverty-related problems occur (Figure 2). Notably, there are two MLRs—one located in the Northern Hemisphere and the other in the Southern Hemisphere. However, we limited the definition of the MLR to the Northern Hemisphere in this study.

3. Results

3.1. Developmental History of South Korea

3.1.1. Economic Development of South Korea

The Korean War spanning 1950–1953 left both Koreas devastated and poor. Millions of people within these countries were jobless and homeless. To recover from the war, North Korea and South Korea embarked upon completely different development paths. Although both countries had to begin anew, a tremendous difference can be observed after ~50 years between the economies of these two countries. Less development and greater food shortages can be seen in North Korea, while South Korea developed rapidly.
Following the Korean War, South Korea was among the poorest countries in the world, as the GDP per capita was only 64 USD in 1955 [58]. Although the South Korean government began to plan for economic development, the government alone was not capable of funding this development. A considerable amount of aid was provided by developed countries and the UN [59,60]. In particular, South Korea received economic funding in exchange for sending nurses and miners as economic migrants to West Germany; these people were then known as ‘Gastarbeiter’ (guest workers) [61,62]. Their contributions aided in the modernisation of South Korea’s economy, as they contributed to the foundations of industrial development.
In the 1960s, light industries, such as textiles, cement, and fertilisers, were formed via the economic support from donor countries. Following this, South Korea began a community-based movement called the ‘New Village Movement’ (Saemaul Undong) to revitalise South Korea’s rural communities in the 1970s. Government funding was used to clear the debts of thousands of farmers and fishermen, to instill new and improved attitudes among the populace, and to develop the skills needed for economic growth. The living conditions in villages were improved by modernising rural areas with new houses and machinery that replaced a large amount of strenuous manual labour. This not only greatly increased the economic productivity and standards of living for people living in these rural areas, but also reduced the socio-economic differences between urban and rural communities [63]. Additionally, in the 1970s, South Korea investigated the use of heavy and chemical industries, including the steel, shipbuilding, automobile, semiconductor, and high-tech industries [64,65]. Subsequently, South Korea began to shift from a predominantly agricultural nation to possessing a more diverse and industrialised economy. Based on such rapid economic growth and governmental efforts, South Korea succeeded in joining the Organisation for Economic Co-operation and Development (OECD) in 1996. However, the nation faced challenges during the Korean Financial Crisis of 1997, and a credit-freeze was triggered by heavy foreign borrowing from South Korean banks. South Korea declared a moratorium on loan payments to its external creditors and requested assistance from the International Monetary Fund (IMF). To support South Korea, the IMF promised to help it reach greater financial liquidity. The government, companies, and citizens fully cooperated, even though some of the imposed conditions were difficult to accept and implement. The entire nation shared the burden of this crisis. The South Korean people united together and overcame these challenges through the Gold Collection Movement, which was a public campaign wherein South Koreans donated billions of dollars’ worth of gold jewelry to decrease the debt of the nation to the IMF [66]. Overall, the sacrifices made by the citizens of South Korea saved the economy when it was in jeopardy.
Based on a stepwise developmental scheme, the service and information industries of South Korea have become globally competitive. From the light, heavy, and manufacturing industries, to the service and information industries, the GDP per capita of South Korea grew from only 64 USD in 1955 to 31,370 USD in 2018 [58]. Additionally, the GDP was 3958 million USD in 1960, which increased to 1,530,751 million USD in 2017, thereby making it the 12th largest economy in the world after Russia and ahead of Australia [27]. South Korea has achieved phenomenal economic modernisation through stepwise developmental phases, and it is the only country that has transformed from an aid recipient into a donor country [67]. In 2018, South Korea was the 15th largest official development assistance (ODA) contributor among 35 OECD countries [68].
To view the trends of the economic development of South Korea in this study, the GDP, electric power consumption, air transportation, and employment rate were used as indicators (Figure 3). Most of these indicators showed substantially increasing trends.

3.1.2. Environmental Development of South Korea

The excess cutting and exploitation of trees during and after Japanese occupation (1910–1945), as well as during the Korean War (1950–1953), depleted the forests of South Korea [69,70]. Despite these deteriorated conditions, the government planned and implemented the National Reforestation Programme, in which the entire nation actively participated to rehabilitate degraded forests from the early 1970s to the late 1990s. The success of this programme was attributed to the well-planned, government-initiated policies, as well as the voluntary participation of the public [63]. Over 30 years, more than 10 billion trees were planted to increase the green area of South Korea and restore forest ecosystems [71]. As a result, stocked forest-lands increased from 73,000,000 m3 to 925,000,000 m3 between 1972 and 2015; currently, ~64% of the country’s landscape is covered by forests [72,73,74,75]. This is regarded as an unprecedented reforestation programme for a developing country, and in many ways, it provides a model for countries seeking rapid reforestation [69,70,76,77].
Along with increasing forests in the country, public interest in environment also improved. According to a national survey on public attitudes on environmental preservation, public interest in environmental issues was 82.4% in 1995, 88.8% in 2000, 82.3% in 2003, and 79.0% in 2008, which then increased to 91.8% in 2013 [78]. A survey by Lodge and Vogel (1987), along with national environmental awareness surveys, have shown that the South Korean people take environmental problems very seriously [79]. However, it is generally not thought that these are the most important issues currently facing the nation, and there is still a lack of will to pay more toward environmental protection [80,81]. According to a survey from the Korea Environment Institute (KEI) conducted in 2017, the population of South Korea responded that unemployment (37.9%) should be the top priority of the government, followed by commodity prices (24.1%), welfare and health (9.4%), and the environment and pollution (7.7%) [80].
However, the development of energy-intensive heavy and chemical industries has resulted in significant energy consumption and greenhouse gas (GHG) emissions. Since the 1960s, South Korea’s GHG emissions and economic growth have increased proportionally. South Korea emitted approximately 587,156.373 kilotons of CO2 in 2014, thereby making it the 9th largest CO2 emitter among 217 countries [82]. This also resulted in other negative externalities, including air and water pollution. The government expanded its environmental policies and facilities, and national environmental policies from the 1990s improved the air quality of South Korea by substantially decreasing the sulfur dioxide (SO2) and carbon monoxide (CO) contents [83]. The SO2 and the CO concentration of Seoul decreased significantly. The SO2 concentration of Seoul was 0.084 ppm in 1978, 0.094 in 1981, 0.056 ppm in 1989, which had decreased to 0.005 ppm by 2017. The CO concentration of Seoul was 3.2 ppm in 1989, and had decreased to 0.5 ppm by 2017 [83,84,85]. However, further improvements in air quality must still be attained.
Not only did GHG emissions increase, but so too did the exposure to particulate matter (PM). The South Korean people are at high risk for PM exposure, which can cause the premature deaths of millions of people per year via inhalation, as it penetrates deep into the lungs and cardiovascular system [86,87]. The emissions of PM2.5 (data available from 2011) and PM10 (data available from 1999) showed increasing trends from 2011–2016 and 1999–2016, respectively [85]. While the PM10 concentration in 2017 (45 µg/m3) had decreased dramatically compared to that in 1997 (62 µg/m3) and air pollution may also originate from surrounding countries, South Korea ranked 108th in terms of annual mean ambient PM2.5.
Considering the developmental standards obtained from the KEI survey, 37% of participants stated that the government should assign the same weights to the economic, environmental, and social sectors in terms of development, rather than focus on only one sector (economy: 25.5%, environment: 20.0%, society: 14.8%). These responses demonstrated the willingness of the South Korean people to support sustainable development [84].
To analyse trends in the environmental development of South Korea, the CO2 emissions, percentage of forested area, biodiversity, PM2.5 concentrations, and electricity production from renewable sources were selected as indicators (Figure 4). Most of these indicators displayed increasing trends; although the percentage of forested area decreased, there was not a large difference between the overall minimum and maximum values.

3.1.3. Social Development of South Korea

From the 1960s to the 1990s, South Korea underwent a period of rapid urbanisation that occurred simultaneously with industrialisation [88,89]. In 1990, the suburbs began to grow as the extent of the transportation infrastructure increased and the use of automobiles increased substantially. The proportion of the total population in urban regions in 1960 was 27.71%, which had increased to 81.50% by 2017 [42]. Urbanisation may lead to a high literacy rate as there are more opportunities for education in urban areas than in rural areas.
A high literacy rate is a key element of social development because it can help reduce poverty, raise the standard of living, and increase self-efficacy and social participation [90,91]. The South Korean government states in its Constitution that primary education is compulsory, but due to the Korean War, this stipulation was postponed during that time. However, as soon as the war ended, the government enforced compulsory education with the Six-Year Plan for Completion of Compulsory Education from 1954–1959 to raise the primary school enrolment rate from 70% to 96%. Owing to strong law enforcement from the government and a belief that only education could provide the means necessary for overcoming poverty, compulsory education was made universal and the enrolment rate had reached 96.4% by 1959 [92].
Also, the post-war government understood that a skilled workforce can adapt to changing market demands, thereby allowing the nation to benefit from innovation and investments in new technologies, clean energy, the environment, public health, and infrastructure [93]. The education sector expanded sequentially from primary to secondary, to vocational, and then to tertiary. Owing to the expansion of the economy and the spread of modern education, an increasingly educated middle class has emerged. Additionally, there was increase in the demand for tertiary education in response to increasing industrial demands for advanced and competitive technicians and engineers in the late 1970s. This resulted in a significant contribution toward supplying educated and skilled workers to the labour market, and thereby contributed to South Korea’s economic growth and social mobility [94]. Moreover, higher education enabled the population to become more politically involved and encouraged democratic participation, which contributed to the transition from an autocracy to a democracy [95]. South Korea ranked third in terms of the gross enrolment ratio for tertiary school in 2015 [96].
However, socio-economic inequality has consistently increased since the 1960s because the economic growth has often been led by a small group of elites and conglomerates through governmental assistance [97]. Additionally, the economic structure and patriarchal culture reduced the educational and career opportunities of South Korean women in various fields [98]. The low education rate of women paralleled their low economic participation and average wages. In 1963, the participation rate of women was approximately half that of men (37%), and in 1975, women received only ~42.2% of the average wage that men received [99,100]. During the 1960s and 1980s, the government implemented a female-targeted family planning policy to control population growth and increase the female labour supply [101]. This policy was successful in terms of reaching its goals. In 2018, the economic participation rate of women was 52.9% and women received 66.6% of the average wage of men [102,103]. However, even with the enactment of the Equal Employment Act in 1987 and the revision of the Act into the Equal Employment Opportunity and Work-Family Balance Assistance Act in 2007, which prohibited discrimination against female workers, pronounced gender inequality in South Korea continues. South Korea had the largest gender wage gap of all OECD countries from 1992 to 2017, and the female labour force was below the OECD average from 1990 to 2015 [104,105].
Women have consistently campaigned for complete legal and social equality and have actively participated in both the economy and politics. The hoju system, introduced in 1953, was a family register system wherein a male head-of-the-family was required and all family members were registered under this male. Women fought against this system and it was finally abolished in 2008 [106]. Additionally, an improvement in the political representation of women was achieved through the adoption of a gender quota system in politics in 2000. Under this quota system, at least 30% of all candidates must be female, allowing for proportional representation in general elections [107]. Since 2004, women candidates must be nominated for over 50% of the proportional representation at the National Assembly. As a result, the percentage of assemblywomen has increased from 5.9% in 2000 to 17% in 2016 [108]. This has also led to policy changes and improvements in gender equality at the political level.
Also, the rapid economic growth of the 1970s and the 1980s contributed to the extension of public health insurance coverage in South Korea. After the Medical Insurance Act was established in 1963, South Korea introduced public medical insurance, Medical Aid Program (MAP), for the low-income population and those working in companies with 500 employees or more [109,110]. In 1981, a pilot project for self-employed medical insurance was implemented in three rural areas, and it was gradually expanded until it covered employees working in companies with as few as 5 employees in 1988. Medical insurance was expanded to cover the self-employed in urban areas in 1989, except for beneficiaries of MAP, thereby covering the entire nation and achieving universal healthcare coverage. Since 2000, medical insurance has been integrated into the National Health Insurance (NHI). The NHI covered 97% of the population in 2015, while the remaining 3% were covered by MAP [110]. Although South Korea has achieved universal healthcare coverage for its total population, it still falls short in terms of health expenditures as a percentage of GDP, which is lower than the OECD average. However, its rate of increase in this respect is one of the highest among OECD countries [111]. In accordance with the expansion of medical insurance, life expectancy has increased and birth rates have decreased. In 1960, the life expectancy of a South Korean citizen was 53.00, while it was 62.16 in 1970, 75.91 in 2000, and 82.63 in 2017 [112].
There are various methods and perspectives that may be used to analyse the social development of a country. The available dataset was used to evaluate the trends of South Korea’s social development. We found increases in the urban population (as a percentage of the total population), life expectancy, average number of years of education, percentage of assemblywomen, and the Human Development Index (HDI), and a decrease in the educational inequality Gini coefficient (Figure 5). All indicators showed a positive trend over the decades.

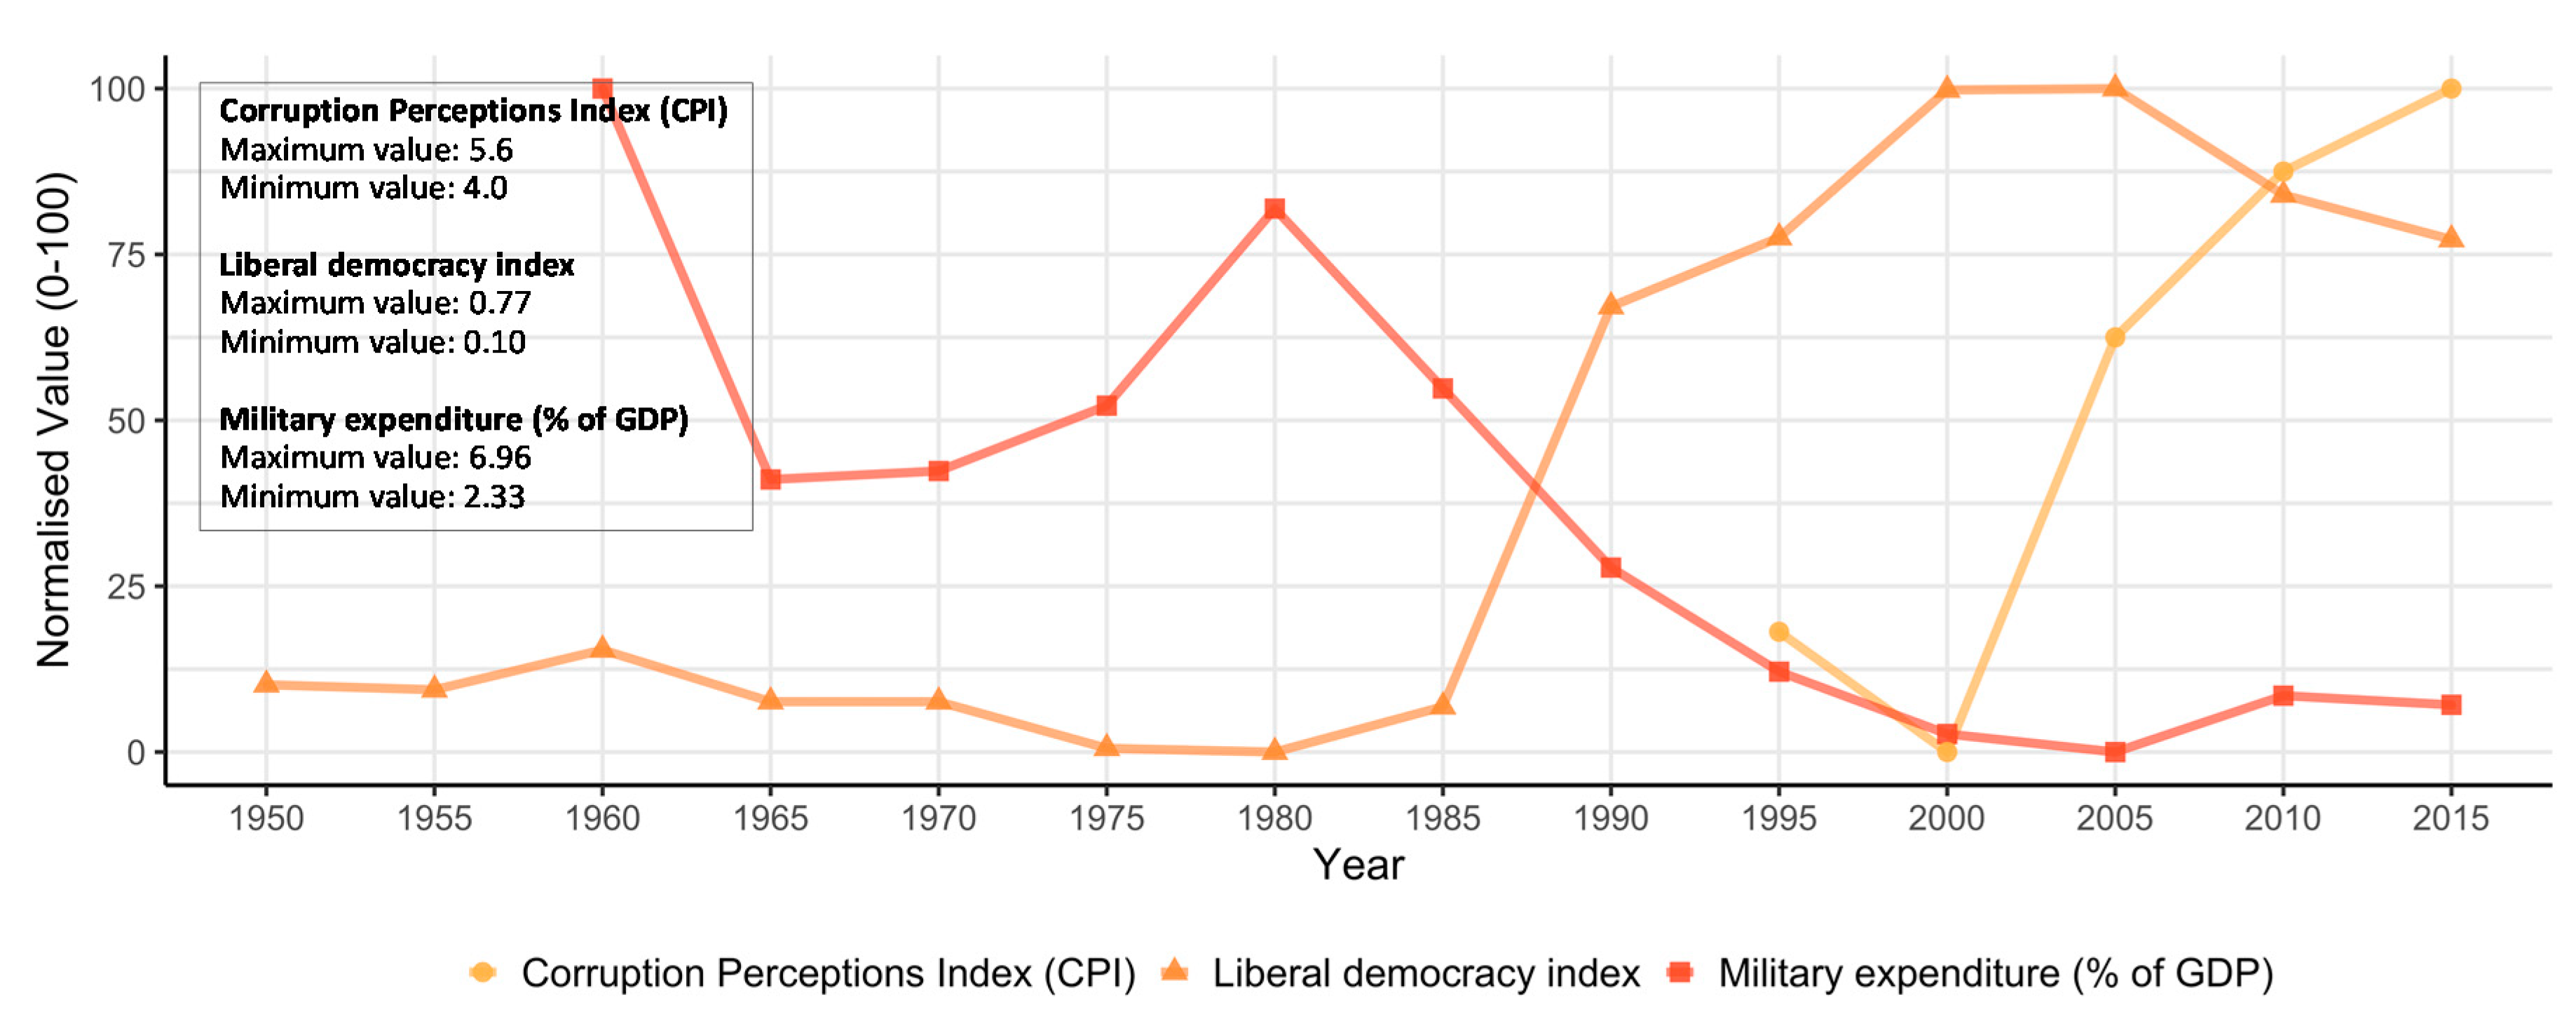
3.1.4. Political Development of South Korea

Development cannot be discussed without considering politics because they determine the social atmosphere and economic foundations of a country. Since the establishment of the First Republic in 1948, presidential elections have taken place ~20 times in South Korea. Prior to the Presidential Election Act of 1987, elections were indirect [113]. The political administrations following the Korean War were often unproductive, incompetent, and corrupt [114,115]. Moreover, military and authoritarian governments have also existed [116]. Riots and protests formed to overturn the despotic regime and assert civilian rule in 1987. The South Korean people yearned for real democracy and requested direct elections, democratic reforms, and the resignation of the authoritarian government. Wary of the international reputation that South Korea may have before the start of the 1988 Olympic Games, the protesters’ requests were accepted. The constitution was amended to include further democratic reforms, and direct elections have since taken place in five-year terms [117,118]. However, South Koreans have still struggled with corrupt governments since these reforms. For example, a series of protests, known as the “Candlelight Struggle”, occurred from November of 2016 to March of 2017 in response to government corruption and the protesters called for the resignation of the president. Triggered by this grassroots movement, the president was subsequently impeached [119,120].
Korea remains a divided country that is still at war, having only signed an armistice and not a peace treaty such that hostilities truly ceased at the end of the Korean War [121,122]. This war has been referred to as the “Forgotten War”. Today, the two Koreas are largely building peaceful relationships, although conflicts and tensions still exist between them [122,123,124].
To analyse the trends of South Korean political development, we used the military expenditure (as a percentage of the GDP), Liberal Democracy Index (LDI), and Corruption Perceptions Index (CPI) as indicators. The military expenditure showed decreasing trends over the examined decades, while the LDI increased. The current value of the CPI has increased tremendously when compared to the 1990s (Figure 6). It is therefore assumed that the South Korean people are aware of corruption within their government and strive for a transparent and incorrupt government.

3.2. Comparison of Development among MLR Countries as of 2015

The developments of 46 MLR countries were numerically analysed and compared from economic, environmental, social, and political perspectives. The normalised values of the South Korean indicators that depict the previous status of the country were averaged at five-year intervals for each sector for the purpose of aggregation (Figure 7). Considering the indicators with negative connotations, including the values of CO2 emissions, PM2.5 concentrations, educational inequality Gini coefficient, and military expenditure (as a percentage of the GDP), their values were made negative. As a result, the economic and political status of South Korea showed consistently increasing trends, while the social status indicated an overall increasing trend. The environmental status showed a negative trend for much of the study period, but an increasing trend was noted from 2005 onward.
When we numerically compared the values of the MLR countries, most depicting economic development were concentrated between 0 and 0.5, which was also shown from the 1960s to 1990s for South Korean economic development (Figure 8, Table 2). The economic status of the MLR countries was the highest for the United States, followed by China and Japan, while it was the lowest for Bosnia and Herzegovina, followed by Iran and Macedonia. The current economic situations for most MLR countries are worse than in South Korea, except for the United States, China, Japan, and Kuwait.
Most of the values demonstrating environmental development were concentrated below −1.5, which indicates that the current environmental status of MLR countries is below the lowest status shown in the documented history of South Korean environmental development. The environmental status was the highest for Portugal, followed by Japan and Spain, while it was the lowest for Saudi Arabia, followed by Egypt and Nepal. The current environmental situations of most MLR countries are worse than in South Korea, except for Portugal, Japan, Spain, Italy, Montenegro, and Bhutan.
Most values for social development were situated between 0.5 and 1.0, the same range that can be seen between 1980 and 2010 for South Korean social development. The social status was the highest for Spain, followed by Israel and France, while it was the lowest for Bhutan, followed by Afghanistan and Pakistan. The current social situations of most MLR countries were worse than in South Korea, except for Spain, Israel, France, Italy, the United States, and Japan.
Values depicting political development were evenly distributed, thereby demonstrating that the political situations of MLR countries are diverse. The political status was at the highest for Japan, followed by the United States and France, while it was the lowest for North Korea, followed by Syria and Turkmenistan. The current political situations of most MLR countries were worse than South Korea, except for Japan, the United States, France, Portugal, Malta, Cyprus, Spain, Bhutan, and Croatia.

3.3. Comparative Latitudinal Maps of Development among MLR Countries as of 2015

The developmental status of 46 MLR countries was spatially analysed using the natural breaks [18] method, and was compared from economic, environmental, social, and political perspectives (Figure 9a). It was demonstrated that the economic status of the United States and China are at the role-model level. The environmental status was at the role-model or good level across Europe, North America, and East Asia, excluding China; meanwhile, social status was at the role-model or good level in Europe, the United States, South Korea, and Japan, and the political statuses of Europe, the United States, and Japan were at the role-model or good level. Additionally, a clear differentiation between South Korea and North Korea was observed in terms of political status. The results showed that Central Asia was mostly at a low level of development in this regard, demonstrating the need to improve economic and social conditions in this region. Moreover, both Central Asia and East Asia demonstrated low and alarming levels of environmental and political development, revealing the need for significant improvements. By analysing the status of each sector, the average status was calculated, which showed that Central Asia has the most room for improvement among the MLR countries (Figure 9b).

4. Discussion

Sustainable development is necessary to ensure a better future, while rapid economic development often exhibits a trade-off relationship with environmental, social, and political sectors. The decision making that is involved in sustainable development can be complex, multifaceted, and difficult, principally because of the interests of different stakeholders and political agendas [3,4,5]. The consideration of all social, political, environmental, and economic perspectives is necessary to achieve a balanced growth that will permit sustainable development. Moreover, all aspects of development are correlated with one another. For example, Friedman (2006) noted that economic growth frequently fosters greater opportunities, tolerance of diversity, social mobility, commitment to fairness, and dedication to democracy [125].
This study is expected to contribute to the achievement of the UN SDGs using modern South Korean history as a reference for sustainable development, as distinct developmental paradigms in South Korean history were identified from the analysis in this study. Although South Korea is one of the 37 OECD countries and is a member of the Group of 20 (G20), it is still a developing country, and there are many improvements that may still be enacted [9,10,11]. However, South Korea recognises that it must also act to decrease the disparities between developing and developed countries because it has previously received aid, which permitted its rapid development [126].
While there are limitations of South Korea being a complete developing model, it was identified that the time-series analysis and the comparison analysis of the study can be utilized for development of developing and emerging countries as the analyses were quantitative. Although rapid economic development can have trade-offs with other sectors, South Korea’s developmental trends show that there is a consistently positive relationship between economic, social, and political development; additionally, the environmental development of South Korea revealed a dramatic change toward improvement since 2005. The results demonstrated that there is a potential to develop quantification of historic analyses which can help the countries to identify the national status of development. By considering the developmental chronology of this nation as a model, the current developmental stages of MLR countries were identified, and this analysis permits us to begin a discourse to understand the needs of developing countries with which they might improve, encourage immediate action toward sustainable development, as well as identify good and bad practices, while striving to create a more sustainable world. The indicators used in this study are controllable, and therefore, may be improved with respect to the actions of a country and the creation of policies for development. Moreover, a specific strategy for technological advances and financing should be established in a future study via an exhaustive review of the needs of each country, as well as through international cooperation, which will allow for the achievement of global sustainable development.
This study faces some limitations. The required data were not always readily available, and the available indicators were only used for analysing the development of MLR countries. If there were missing values for the year 2015 among the required indicators, the values from the year 2010 were substituted, as the data from all the indicators were obtained at five-year intervals. Among the 18 indicators, five (CO2 emissions (kt), biodiversity, educational inequality Gini coefficient, the average number of years of education, and electric power consumption) required this substitution. If an indicator was not available for either 2010 or 2015, it was excluded when obtaining an average for the various sectors. However, future studies are recommended to incorporate more indicators for the analysis to ensure the results and apply them for sustainable development. In addition, an extension of the study area to the Southern Hemisphere is needed for further application of the results of the study.
Although South Korea has demonstrated a tremendous capability for development up until now, the observed trends may not continue. South Korea has been facing many challenges, such as the slowing of its economic growth, the rapid ageing of its population [127], and the polarisation of society in terms of region and income. These challenges accelerate the expansion of economic, cultural, and social gaps [128]. Therefore, South Korea must overcome this new set of challenges; a new solution for achieving rapid progress is required. Furthermore, the general conditions and situations of MLR countries may differ vastly. Therefore, sustainable development should be specific to the context of each country’s conditions and current situations.

5. Conclusions

We aimed to suggest the compressed development of South Korea as a reference model for developing countries because it can serve as an option to reach sustainability in a short period and global issues should be solved urgently given the limited timeline. We conducted time-series, comparative, and map-based spatial analyses for MLR countries, wherein a large fraction of the global population resides and many socioeconomic and environmental concerns are present. To achieve this, 18 indicators were numerically and spatially analysed to quantitatively estimate the development of South Korea from economic, social, environmental, and political perspectives. As a result, the economic and political status of South Korea showed constantly increasing trends, while the social status indicated an overall increasing trend. Although the environmental status of South Korea initially demonstrated a negative trend, an increasing trend was observed beginning in 2005. It was revealed that the social and political sectors had a constantly positive relationship with economic development in South Korea, and the environmental sector underwent a dramatically positive change in 2005.
Indicators for the year 2015 for 46 MLR countries were analysed with reference to the development of South Korea. From these analyses, distinct developmental paradigms in South Korean history were identified that could be used to identify the current developmental status of MLR countries. Additionally, the developmental status of 46 MLR countries was spatially analysed and the results indicated which countries may be treated as role models, as well as those that require global assistance and support through the provision of new technologies and finances. The economic status of the MLR countries was the highest for the United States, followed by China and Japan, while it was the lowest for Bosnia and Herzegovina, followed by Iran and Macedonia. The environmental status was the highest for Portugal, followed by Japan and Spain, while it was the lowest for Saudi Arabia, followed by Egypt and Nepal. The social status was the highest for Spain, followed by Israel and France, while it was the lowest for Bhutan, followed by Afghanistan and Pakistan. The political status was the highest for Japan, followed by the United States and France, while it was the lowest for North Korea, followed by Syria and Turkmenistan.
Sustainable development considering all social, political, environmental, and economic perspectives is necessary to ensure a better future. We may conclude that the chronological model of South Korean development can be considered a practical reference model for countries that wish to achieve similar compressed growth. This study is expected to be used to identify areas that need global assistance and help confirm the development status of the MLR countries for international cooperation. However, global sustainable development should be only achieved through an exhaustive consideration of the context and the needs of the countries.

Author Contributions

Conceptualization, S.J.K. and W.-K.L.; methodology, S.J.K. and W.-K.L.; formal analysis, S.J.K. and J.Y.A.; data curation, S.J.K. and W.-K.L.; writing—original draft preparation, S.J.K. and W.-K.L.; writing—review and editing, W.-K.L., S.J.K., W.L., S.J.L. and J.Y.A.; visualization, S.J.K.; supervision, W.-K.L.; funding acquisition, W.-K.L. All authors have read and agreed to the published version of the manuscript.

Funding

This work was supported by the National Research Foundation of Korea (NRF) grant funded by the Korea government (MSIT) (No. 2018R1A2B6005682) and by the OJEong Resilience Institute (OJERI) as part of the “SDGs and Water-Food-Energy Nexus Team”.

Institutional Review Board Statement

Not applicable.

Informed Consent Statement

Not applicable.

Data Availability Statement

The data presented in this study are available on request from the corresponding author. The data are not publicly available due to privacy reasons.

Conflicts of Interest

The authors declare no conflict of interest.

References

  1. Sachs, J.D. From millennium development goals to sustainable development goals. Lancet 2012, 379, 2206–2211. [Google Scholar] [CrossRef]
  2. United Nations General Assembly. Transforming our world. In Proceedings of the 2030 Agenda for Sustainable Development, United Nations, New York, NY, USA, 25 September 2015. [Google Scholar]
  3. Bleischwitz, R.; Spataru, C.; VanDeveer, S.D.; Obersteiner, M.; van der Voet, E.; Johnson, C.; Andrews-Speed, P.; Boersma, T.; Hoff, H.; van Vuuren, D.P. Resource nexus perspectives towards the United Nations Sustainable Development Goals. Nat. Sustain. 2018, 1, 737–743. [Google Scholar] [CrossRef] [Green Version]
  4. Kiker, G.A.; Bridges, T.S.; Varghese, A.; Seager, T.P.; Linkov, I. Application of Multicriteria Decision Analysis in Environmental Decision Making. Integr. Environ. Assess. Manag. 2005, 1, 95. [Google Scholar] [CrossRef] [PubMed]
  5. McGowan, P.J.K.; Stewart, G.B.; Long, G.; Grainger, M.J. An imperfect vision of indivisibility in the Sustainable Development Goals. Nat. Sustain. 2019, 2, 43–45. [Google Scholar] [CrossRef] [Green Version]
  6. Kuznets, P.W. An East Asian Model of Economic Development: Japan, Taiwan, and South Korea. Econ. Dev. Cult. Chang. 1988, 36, S11–S43. [Google Scholar] [CrossRef]
  7. Minns, J. Of miracles and models: The rise and decline of the developmental state in South Korea. Third World Q. 2001, 22, 1025–1043. [Google Scholar] [CrossRef]
  8. Krueger, A.O. East Asian Experience and Endogenous Growth Theory. In Growth Theories in Light of the East Asian Experience; Ito, T., Krueger, A.O., Eds.; The University of Chicago Press: Chicago, IL, USA; London, UK, 1995; pp. 9–36. ISBN 0-226-38670-8. [Google Scholar]
  9. Birdsall, N.M.; Campos, J.E.L.; Kim, C.S.; Corden, W.M.; MacDonald, L. The East Asian Miracle: Economic Growth and Public Policy: Main Report; Oxford University Press: Oxford, UK, 1993; ISBN 0195209931. [Google Scholar]
  10. Choi, Y.J.; Cho, Y.M.; Park, C.K.; Jang, H.C.; Park, K.S.; Kim, S.Y.; Lee, H.K. Rapidly increasing diabetes-related mortality with socio-environmental changes in South Korea during the last two decades. Diabetes Res. Clin. Pract. 2006, 74, 295–300. [Google Scholar] [CrossRef]
  11. Palley, H.A. Social Policy and the Elderly in South Korea: Confucianism, Modernization, and Development. Asian Surv. 1992, 32, 787–801. [Google Scholar] [CrossRef]
  12. Sorensen, C.W. Success and Education in South Korea. Comp. Educ. Rev. 1994, 38, 10–35. [Google Scholar] [CrossRef]
  13. Yang, S.; Khang, Y.H.; Harper, S.; Davey Smith, G.; Leon, D.A.; Lynch, J. Understanding the rapid increase in life expectancy in South Korea. Am. J. Public Health 2010, 100, 896–903. [Google Scholar] [CrossRef]
  14. Rockström, J.; Sukhdev, P. How Food Connects All the SDGs. Available online: https://www.stockholmresilience.org/research/research-news/2016-06-14-how-food-connects-all-the-sdgs.html (accessed on 30 March 2020).
  15. ECLAC; OECD. Emerging Challenges and Shifting Paradigms: New Perspectives on International Cooperation for Development; Economic Commission for Latin America and the Caribbean (ECLAC)/Organisation for Economic Cooperation and Development (LC/PUB.2018/16); United Nations: Santiago, Chile, 2018. [Google Scholar]
  16. Kemp, R.; Loorbach, D.; Rotmans, J. Transition management as a model for managing processes of co-evolution towards sustainable development. Int. J. Sustain. Dev. World 2007, 14, 78–91. [Google Scholar] [CrossRef] [Green Version]
  17. Geels, F.W. Technological transitions as evolutionary reconfiguration processes: A multi-level perspective and a case-study. Res. Policy 2002, 31, 1257–1274. [Google Scholar] [CrossRef] [Green Version]
  18. Jenks, F.G. The Data Model Concept in Statistical Mapping. Int. Yearb. Cartogr. 1967, 7, 186–190. [Google Scholar]
  19. World Bank. Air Transport, Registered Carrier Departures Worldwide. Available online: https://data.worldbank.org/indicator/IS.AIR.DPRT (accessed on 30 March 2020).
  20. Zhang, F.; Graham, D.J. Air transport and economic growth: A review of the impact mechanism and causal relationships. Transp. Rev. 2020, 40, 1–23. [Google Scholar] [CrossRef]
  21. Button, K.; Taylor, S. International air transportation and economic development. J. Air Transp. 2000, 6, 209–222. [Google Scholar] [CrossRef] [Green Version]
  22. World Bank. Electric Power Consumption (kWh per Capita). Available online: https://data.worldbank.org/indicator/EG.USE.ELEC.KH.PC (accessed on 30 March 2020).
  23. Ferguson, R.; Wilkinson, W.; Hill, R. Electricity use and economic development. Energy Policy 2000, 28, 923–934. [Google Scholar] [CrossRef]
  24. Kasperowicz, R. Electricity consumption and economic growth: Evidence from Poland. J. Int. Stud. 2014, 7. [Google Scholar] [CrossRef] [PubMed]
  25. Hirsh, R.F.; Koomey, J.G. Electricity consumption and economic growth: A new relationship with significant consequences? Electr. J. 2015, 28, 72–84. [Google Scholar] [CrossRef]
  26. International Labour Office. Employment-to-Population Ratio-ILO Modelled Estimates. Available online: https://www.ilo.org/ilostat/faces/oracle/webcenter/portalapp/pagehierarchy/Page33.jspx;ILOSTATCOOKIE=GgkqbmOfklrVSG_CmXQ5PeE7wV6ECz-kcDvvCssUcp-YiVsmP5cd!-1102363596?locale=EN&MBI_ID=7&_adf.ctrl-state=1b62a5xg4u_50&_afrLoop=10542516107271835&_afrWindowMod (accessed on 30 March 2020).
  27. World Bank. Electricity Production from Renewable Sources, Excluding Hydroelectric (% of Total). Available online: https://data.worldbank.org/indicator/EG.ELC.RNWX.ZS (accessed on 30 March 2020).
  28. Stiglitz, J.E.; Sen, A.; Fitoussi, J.P. Report by the Commission on the Measurement of Economic Performance and Social Progress; Commission on the Measurement of Economic Performance and Social Progress (CMEPSP): Paris, France, 2009.
  29. Cohen, A.J.; Brauer, M.; Burnett, R.; Anderson, H.R.; Frostad, J.; Estep, K.; Balakrishnan, K.; Brunekreef, B.; Dandona, L.; Dandona, R.; et al. Estimates and 25-year trends of the global burden of disease attributable to ambient air pollution: An analysis of data from the Global Burden of Diseases Study 2015. Lancet 2017, 389, 1907–1918. [Google Scholar] [CrossRef] [Green Version]
  30. Klein Goldewijk, K.; Beusen, A.; van Drecht, G.; de Vos, M. The HYDE 3.1 spatially explicit database of human-induced global land-use change over the past 12,000 years. Glob. Ecol. Biogeogr. 2011, 20, 73–86. [Google Scholar] [CrossRef]
  31. Alkemade, R.; van Oorschot, M.; Miles, L.; Nellemann, C.; Bakkenes, M.; ten Brink, B. GLOBIO3: A framework to investigate options for reducing global terrestrial biodiversity loss. Ecosystems 2009, 12, 374–390. [Google Scholar] [CrossRef] [Green Version]
  32. Convention on Biological Diversity. Decision VII/30: Strategic Plan: Future Evaluation of Progress. 2004. Available online: https://www.cbd.int/decision/cop/?id=7767 (accessed on 10 July 2019).
  33. World Bank. CO2 Emissions (kt). Available online: https://data.worldbank.org/indicator/EN.ATM.CO2E.KT (accessed on 30 March 2020).
  34. World Bank. Forest Area (% of Land Area). Available online: https://data.worldbank.org/indicator/AG.LND.FRST.ZS (accessed on 30 March 2020).
  35. World Bank. GDP (Current US$). Available online: https://data.worldbank.org/indicator/NY.GDP.MKTP.CD (accessed on 30 March 2020).
  36. van Leeuwen, B.; van Leeuwen-Li, J. Average Years of Education, IISH Data Collection, V1. Available online: https://hdl.handle.net/10622/KCBMKI (accessed on 30 March 2020).
  37. UNDP. Human Development Data (1990–2018). Available online: http://hdr.undp.org/en/data# (accessed on 30 March 2020).
  38. Inter-Parliamentary Union. Compare Data on Parliaments: Percentage of Women. Available online: https://data.ipu.org/compare?field=country%3A%3Afield_structure_of_parliament#map (accessed on 30 March 2020).
  39. World Bank. Life Expectancy at Birth, Total (Years). Available online: https://data.worldbank.org/indicator/sp.dyn.le00.in (accessed on 31 March 2020).
  40. van Leeuwen, B.; van Leeuwen-Li, J. Educational Inequality Gini Coefficient, IISH Data Collection, V1. Available online: https://hdl.handle.net/10622/KORKQW (accessed on 30 March 2020).
  41. Bettencourt, L.M.; Lobo, J.; Helbing, D.; Kühnert, C.; West, G.B. Growth, innovation, scaling, and the pace of life in cities. Proc. Natl. Acad. Sci. USA 2007, 104, 7301–7306. [Google Scholar] [CrossRef] [PubMed] [Green Version]
  42. UNDESA. World Urbanization Prospects: The 2018 Revision; United Nations: New York, NY, USA, 2019. [Google Scholar]
  43. Transparency International. Corruption Perceptions Index 2017. Available online: https://www.transparency.org/news/feature/corruption_perceptions_index_2017 (accessed on 30 March 2020).
  44. Coppedge, M.; Gerring, J.; Henrik Knutsen, C.; Lind-berg, S.I.; Skaaning, S.E.; Teorell, J.; Altman, D.; Bernhard, M.; Cornell, A.; Steven Fish, M.; et al. V-Dem Dataset v8, Varieties of Democracy (V-Dem) Project; Department of Political Science, University of Gothenburg: Gothenburg, Sweden, 2018. [Google Scholar] [CrossRef]
  45. Pemstein, D.; Marquardt, K.L.; Tzelgov, E.; Wang, Y.; Krusell, J.; Miri, F. The V-Dem Measurement Model: Latent Variable Analysis for Cross-National and Cross-Temporal Expert-Coded Data. V-Dem Work. Pap. 2018, 21. [Google Scholar] [CrossRef]
  46. Stockholm International Peace Research Institute. SIPRI Military Expenditure Database. Available online: https://www.sipri.org/databases/milex (accessed on 30 March 2020).
  47. Brauner, J. Military spending and democracy. Def. Peace Econ. 2015, 26, 409–423. [Google Scholar] [CrossRef]
  48. Töngür, Ü.; Hsu, S.; Elveren, A.Y. Military expenditures and political regimes: Evidence from global data, 1963–2000. Econ. Model. 2015, 44, 68–79. [Google Scholar] [CrossRef]
  49. Ahlström, A.; Raupach, M.R.; Schurgers, G.; Smith, B.; Arneth, A.; Jung, M.; Reichstein, M.; Canadell, J.G.; Friedlingstein, P.; Jain, A.K.; et al. The dominant role of semi-arid ecosystems in the trend and variability of the land CO2 sink. Science 2015, 348, 895–899. [Google Scholar] [CrossRef] [PubMed] [Green Version]
  50. Chen, Y.; Tang, H. Desertification in north China: Background, anthropogenic impacts and failures in combating it. Land Degrad. Dev. 2005, 16, 367–376. [Google Scholar] [CrossRef]
  51. Kafatos, M.C.; Kim, S.H.; Lim, C.H.; Kim, J.; Lee, W.K. Responses of Agroecosystems to Climate Change: Specifics of Resilience in the Mid-Latitude Region. Sustainability 2017, 9, 1361. [Google Scholar] [CrossRef] [Green Version]
  52. Kummu, M.; Varis, O. The world by latitudes: A global analysis of human population, development level and environment across the north-south axis over the past half century. Appl. Geogr. 2011, 31, 495–507. [Google Scholar] [CrossRef]
  53. Lee, W.K.; Shvidenko, A.; Kraxner, F.; Son, Y.; Jeon, S.W.; Moon, J.Y. Carbon Science Economics Convergence Research for Mid-Latitude Ecotone: Carbon Science Economics Convergence Research for Mid-Latitude Ecotone. No North without South, no South without North: The urgent need for an integrated view on global forests. In Proceedings of the XIV World Forestry Congress, World Forestry Congress 2015, Durban, South Africa, 10 September 2015; Volume 12. [Google Scholar]
  54. Meersmans, J.; Arrouays, D.; van Rompaey, A.J.J.; Pagé, C.; de Baets, S.; Quine, T.A. Future C loss in mid-latitude mineral soils: Climate change exceeds land use mitigation potential in France. Sci. Rep. 2016, 6, 1–11. [Google Scholar] [CrossRef] [Green Version]
  55. Norris, J.R.; Allen, R.J.; Evan, A.T.; Zelinka, M.D.; O’Dell, C.W.; Klein, S.A. Evidence for climate change in the satellite cloud record. Nature 2016, 536, 72–75. [Google Scholar] [CrossRef] [PubMed] [Green Version]
  56. Sachs, J.; Schmidt-Traub, G.; Kroll, C.; Durand-Delacre, D.; Teksoz, K. SDG Index and Dashboards Report 2017; Bertelsmann Stiftung and Sustainable Development Solutions Network (SDSN): New York, NY, USA, 2017. [Google Scholar]
  57. Song, C.; Kim, S.J.; Moon, J.; Lee, S.J.; Lee, W.; Kim, N.; Wang, S.W.; Lee, W.K. Classification of Global Land Development Phases by Forest and GDP Changes for Appropriate Land Management in the Mid-Latitude. Sustainability 2017, 9, 1342. [Google Scholar] [CrossRef] [Green Version]
  58. CEIC. South Korea GDP per Capita (1953–2020). Available online: https://www.ceicdata.com/en/indicator/korea/gdp-per-capita (accessed on 30 March 2020).
  59. Kim, J. Aid and state transition in Ghana and South Korea. Third World Q. 2015, 36, 1333–1348. [Google Scholar] [CrossRef] [Green Version]
  60. Lee, Y. From an ODA-dependent country to a donor: Korea’s ODA experience and its implication for Lao development. J. Contemp. Korean Stud. 2015, 2, 153–178. [Google Scholar]
  61. Coy, J.; Poley, J.; Schunka, A. Migrations in the German Lands, 1500–2000; Berghahn Books: New York, NY, USA, 2016; ISBN 978-1-78533-144-2. [Google Scholar]
  62. Hong, I. South Korea Country Report; INTERACT Research Report 2014/07; European University Institute: San Domenico di Fiesole, Italy, 2014. [Google Scholar]
  63. FAO. Integrated Policy for Forests, Food Security and Sustainable Livelihoods: Lessons from the Republic of Korea; Food and Agriculture Organization of the United Nations (FAO): Rome, Italy, 2016. [Google Scholar]
  64. Horikane, Y. The political economy of heavy industrialization: The heavy and chemical industry (HCI) push in South Korea in the 1970s. Mod. Asian Stud. 2005, 39, 369–397. [Google Scholar] [CrossRef]
  65. Kim, S.Y. Consolidating the authoritarian developmental state in the 1970s Korea: Chosen strategies. Int. Rev. Public Adm. 2007, 12, 119–132. [Google Scholar] [CrossRef]
  66. Kim, S.K.; Finch, J. Living with Rhetoric, Living against Rhetoric: Korean Families and the IMF Economic Crisis. Korean Stud. 2002, 26, 120–139. [Google Scholar] [CrossRef]
  67. Igbafen, M.L. South Korea’s Development Experience as an Aid Recipient: Lessons for Sub-Saharan Africa. In The South Korean Development Experience: Beyond Aid; Kim, E.M., Kim, P.H., Eds.; Palgrave Macmillan: London, UK, 2014; pp. 111–135. ISBN 978-1-349-44753-4. [Google Scholar]
  68. OECD. DAC Members’ Net ODA in 2018. Available online: http://www.oecd.org/dac/financing-sustainable-development/development-finance-data/ (accessed on 30 March 2020).
  69. Forest Stewardship Council. Centralized National Risk Assessment for Republic of Korea; FSC International Center: Bonn, Germany, 2017. [Google Scholar]
  70. Korea Forest Service. Leveraging Public Programmes with Socio-Economic and Development Objectives to Support Conservation and Restoration of Ecosystems: Lessons Learned from the Republic of Korea’s National Reforestation Programme; Korea Forest Service: Daejeon, Korea, 2014.
  71. Korea Forest Service. Forestry Education. Available online: https://www.forest.go.kr/newkfsweb/html/HtmlPage.do?pg=/foreston/fon_culture/UI_KFS_1001_050203.html&orgId=fon&mn=KFS_01_13_03_06_02 (accessed on 30 March 2020).
  72. Kim, G.S.; Lim, C.H.; Kim, S.; Lee, J.; Son, Y.; Lee, W.K. Effect of National-Scale Afforestation on Forest Water Supply and Soil Loss in South Korea, 1971–2010. Sustainability 2017, 9, 1017. [Google Scholar] [CrossRef] [Green Version]
  73. Kim, S.J.; Lim, C.H.; Kim, G.S.; Lee, J.; Geiger, T.; Rahmati, O.; Son, Y.; Lee, W.K. Multi-Temporal Analysis of Forest Fire Probability Using Socio-Economic and Environmental Variables. Remote Sens. 2019, 11, 86. [Google Scholar] [CrossRef] [Green Version]
  74. Korea Forest Service. Forest Basic Statistics 2015; Korea Forest Service: Daejeon, Korea, 2016.
  75. Lim, C.H.; Kim, Y.S.; Won, M.; Kim, S.J.; Lee, W.K. Can satellite-based data substitute for surveyed data to predict the spatial probability of forest fire? A geostatistical approach to forest fire in the Republic of Korea. Geomat. Nat. Hazards Risk 2019, 10, 719–739. [Google Scholar] [CrossRef] [Green Version]
  76. Brown, L.R. Plan B: Rescuing a Planet under Stress and a Civilization in Trouble; WW Norton & Company: New York, NY, USA; London, UK, 2003; ISBN 978-0393325232. [Google Scholar]
  77. Noronha, R. Why is it so difficult to grow fuelwood? Unasylva 1981, 33, 4–13. [Google Scholar]
  78. Ministry of Environment. National Survey on Public Attitudes towards the Environmental Preservation; Research & Research, Inc.: Seoul, Korera, 2014.
  79. Lodge, G.C.; Vogel, E.F. Ideology and National Competitiveness: An Analysis of Nine Countries; Harvard Business School Press: Boston MA, USA, 1987. [Google Scholar]
  80. Korea Environment Institute. 2017 Public Attitudes towards the Environment. KEI Focus 2018, 33, 6-3. [Google Scholar]
  81. Lee, M.S. Korean Social Trends 2016: Public Awareness and Attitude toward the Environment; Statistics Research Institute: Daejeon, Korea, 2016.
  82. World Bank. PM2.5 Air Pollution, Mean Annual Exposure (Micrograms per Cubic Meter). Available online: https://data.worldbank.org/indicator/EN.ATM.PM25.MC.M3 (accessed on 30 March 2020).
  83. Kim, D.S. Air Pollution History, Regulatory Changes, and Remedial Measures of the Current Regulatory Regimes in Korea. J. Korean Soc. Atmos. 2013, 29, 353–368. [Google Scholar] [CrossRef]
  84. National Institute of Environmental Research. Annual Report of Air Quality in Korea 2017; National Institute of Environmental Research (NIER): Incheon, Korea, 2018.
  85. National Institute of Environmental Research. Emissions by Substance. Available online: https://airemiss.nier.go.kr/mbshome/mbs/airemiss/index.do (accessed on 30 March 2020).
  86. Park, S.; Kim, S.J.; Yu, H.; Lim, C.H.; Park, E.; Kim, J.; Lee, W.K. Developing an Adaptive Pathway to Mitigate Air Pollution Risk for Vulnerable Groups in South Korea. Sustainability 2020, 12, 1790. [Google Scholar] [CrossRef] [Green Version]
  87. World Health Organization. 9 Out of 10 People Worldwide Breathe Polluted Air, but More Countries are Taking Action. WHO Newsroom. 2 May 2018. Available online: https://www.who.int/news/item/02-05-2018-9-out-of-10-people-worldwide-breathe-polluted-air-but-more-countries-are-taking-action (accessed on 1 August 2019).
  88. Chung, U.; Choi, J.; Yun, J.I. Urbanization effect on the observed change in mean monthly temperatures between 1951-1980 and 1971-2000 in Korea. Clim. Chang. 2004, 66, 127–136. [Google Scholar] [CrossRef]
  89. Kang, L. South Korea’s sustainable urban planning and environmental technology. Discussions 2014, 10, 1. [Google Scholar]
  90. Ministry for Education and Employment. A National Literacy Strategy for All in Malta and Gozo 2014–2019; Ministry for Education and Employment of Government of Malta: Floriana, Malta, 2014.
  91. UNESCO Institute for Statistics. The Next Generation of Literacy Statistics: Implementing the Literacy Assessment and Monitoring Programme (LAMP); UNESCO Institute for Statistics (UNESCO-UIS): Montreal, QC, Canada, 2009. [Google Scholar]
  92. Yi, C.; Kim, S.; Adams, D.K. Sixty Years of Korean Education; Seoul National University Press: Seoul, Korea, 2010; ISBN 8952111796. [Google Scholar]
  93. International Labour Office. A Skilled Workforce for Strong, Sustainable and Balanced Growth: A G20 Training Strategy; International Labour Office (ILO): Geneva, Switzerland, 2011. [Google Scholar]
  94. Kim, D.I.; Topel, R.H. Labor Markets and Economic Growth: Lessons from Korea’s Industrialization, 1970–1990. In Differences and Changes in Wage Structures; Freeman, R.B., Katz, L.F., Eds.; University of Chicago Press: Chicago, IL, USA, 1995; pp. 227–264. ISBN 0-226-26160-3. [Google Scholar]
  95. Seth, M.J. Education Fever: Society, Politics, and the Pursuit of Schooling in South Korea; University of Hawaii Press: Honolulu, HI, USA, 2002; ISBN 9780824862305. [Google Scholar]
  96. World Bank. Proportion of Seats Held by Women in National Parliaments (%). Available online: https://data.worldbank.org/indicator/SG.GEN.PARL.ZS (accessed on 30 March 2020).
  97. Kang, M. The Korean Business Conglomerate: Chaebol Then and Now. Korea Res. Monogr. 1996, 21, 457. [Google Scholar]
  98. Park, K.A. Women and Development: The Case of South Korea. Comp. Politics 1993, 25, 127–145. [Google Scholar] [CrossRef]
  99. Jang, H.J. Summary and Evaluation of 50 Years of Working Women; Discussion on the Basic Direction of Working Women’s Policy in the 21st Century; Korean Women’s Development Institute: Seoul, Korea, 2001; pp. 75–125. [Google Scholar]
  100. Statistics Korea. The Changes in Korean Society in Statistics after the 70th Anniversary of the Independence I (Explanation); Human Culture Arirang: Seoul, Korea, 2015; ISBN 9791155656839.
  101. UNRISD Economic and Social Development in the Republic of Korea: Processes; Institutions and Actors, Research and Policy Brief 14; UNRISD: Geneva, Switzerland, 2012.
  102. Statistics Korea. Female Economically Active Population and Participation Rate. Available online: http://www.index.go.kr/potal/main/EachDtlPageDetail.do?idx_cd=1572 (accessed on 31 March 2020).
  103. Statistics Korea. Female to Male Wage Ratio. Available online: http://www.index.go.kr/potal/main/EachDtlPageDetail.do?idx_cd=2714 (accessed on 31 March 2020).
  104. OECD. Fertility Rates (Indicator). Available online: https://data.oecd.org/pop/fertility-rates (accessed on 31 March 2020). [CrossRef]
  105. OECD. Gender Wage Gap (Indicator). Available online: http://www.oecd-ilibrary.org/employment/gender-wage-gap/indicator/english_7cee77aa-en (accessed on 31 March 2020). [CrossRef]
  106. Koh, E. Gender issues and Confucian scriptures: Is Confucianism incompatible with gender equality in South Korea? Bull. Sch. Orient Afr. Stud. 2008, 71, 345–362. [Google Scholar] [CrossRef]
  107. Soh, E. Ten years’ experience of gender quota system in Korean politics. Gend. Equal. Multicult. Conviv. Age Glob. 2011, 98, 98–104. [Google Scholar]
  108. Statistics Korea. Percentage of Female Parliamentarians. Available online: http://www.index.go.kr/potal/stts/idxMain/selectPoSttsIdxSearch.do?idx_cd=4064&stts_cd=406403 (accessed on 31 March 2020).
  109. Anderson, G.F. Universal health care coverage in Korea. Health Aff. 1989, 8, 24–34. [Google Scholar] [CrossRef] [PubMed]
  110. National Health Insurance Service. National Health Insurance System of Korea; National Health Insurance Service: Wonju, Korea, 2015. [Google Scholar]
  111. Kwon, S. South Korean Health Policy and Universal Health Coverage. In Secrets of an Economic Miracle: Lessons for Sustainable Development from South Korea; Kim, T., Young, S., Eds.; KDI School of Public Policy and Management: Sejong, Korea, 2019; ISBN 979-11-5545-189-2. [Google Scholar]
  112. World Bank. School Enrollment, Tertiary (% Gross). Available online: https://data.worldbank.org/indicator/SE.TER.ENRR (accessed on 30 March 2020).
  113. Croissant, A. Electoral Politics in South Korea. In Electoral Politics in Southeast & East Asia; Croissant, A., Bruns, G., John, M., Eds.; Friedrich-Ebert-Stiftung: Singapore, 2002; pp. 233–276. ISBN 981-04-6020-1. [Google Scholar]
  114. Kang, D.C. Bad loans to good friends: Money politics and the developmental state in South Korea. Int. Organ. 2002, 56, 177–207. [Google Scholar] [CrossRef]
  115. Rhee, T.C. South Korea’s Economic Development and its Socio-Political Impact. Asian Surv. 1973, 13, 677–690. [Google Scholar] [CrossRef]
  116. Cotton, J. Understanding the State in South Korea. Comp. Political Stud. 1992, 24, 512–531. [Google Scholar] [CrossRef]
  117. Lee, S.H. Transitional Politics of Korea, 1987–1992: Activation of Civil Society. Pac. Aff. 1993, 66, 351. [Google Scholar] [CrossRef]
  118. Saxer, C.J. From Transition to Power Alternation: Democracy in South Korea, 1987–1997; Routledge: London, UK, 2013. [Google Scholar]
  119. Doucette, J. The Occult of Personality: Korea’s Candlelight Protests and the Impeachment of Park Geun-hye. J. Asian Stud. 2017, 76, 851–860. [Google Scholar] [CrossRef] [Green Version]
  120. Lee, S.H. Political transfiguration and the reinvented popular masses: A sociological study into the “Candlelight Struggle” in South Korea in 2016–17. Sociétés 2017, 138, 85–97. [Google Scholar] [CrossRef]
  121. Kim, D.J. The Once and Future Korea. Foreign Policy 1992, 40–55. [Google Scholar] [CrossRef]
  122. Moon, M. International News Coverage of the Korean Conflict. In International News Coverage and the Korean Conflict: The Challenges of Reporting Practices; Moon, M., Ed.; Palgrave Macmillan: Singapore, 2019; pp. 111–127. ISBN 978-981-13-6290-3. [Google Scholar]
  123. Kim, Y. Old narratives in new times: Representations of North Korea and unification in South Korean social studies textbooks. Comp. J. Comp. Int. Educ. 2019, 1–18. [Google Scholar] [CrossRef]
  124. Roberts, T. An Analysis of Inter-Korean Relations and Sports Diplomacy Leading Up to, during and Following the 2018 Pyeongchang Winter Olympics in South Korea. Master’s Thesis, Leiden University, Leiden, The Netherlands, 2019. [Google Scholar]
  125. Friedman, B.M. The Moral Consequences of Economic Growth; Vintage Books: New York, NY, USA, 2006; ISBN 9781400095711. [Google Scholar]
  126. Ministry of Foreign Affairs. 2015 Diplomatic White Paper; Ministry of Foreign Affairs: Seoul, Korea, 2015.
  127. OECD. Labour Force Participation Rate by Sex, 15+, 15–64 and 15–24 Years Old. Available online: http://www.oecd.org/gender/data/labour-force-participation-by-sex-age.htm (accessed on 31 March 2020).
  128. Shin, K.Y. A new approach to social inequality: Inequality of income and wealth in South Korea. J. Chin. Sociol. 2020, 7, 1–15. [Google Scholar] [CrossRef]
Figure 1. Flow chart of the analytical approach used to determine the current developmental status of MLR countries.
Sustainability 13 01905 g001
Figure 2. Study area of MLR countries.
Sustainability 13 01905 g002
Figure 3. Development of South Korea normalised with the minima and maxima presented in the legends for economic development from 1950 to 2015.
Sustainability 13 01905 g003
Figure 4. Development of South Korea normalised with the minima and maxima presented in the legends for environmental development from 1950 to 2015.
Sustainability 13 01905 g004
Figure 5. Development of South Korea normalised with the minima and maxima presented in the legends for social development from 1950 to 2015.
Sustainability 13 01905 g005
Figure 6. Development of South Korea normalised with the minima and maxima presented in the legends for political development from 1950 to 2015.
Sustainability 13 01905 g006
Figure 7. Development of South Korea normalised with the minima and maxima presented in the legends for overall developmental trends from 1950 to 2015.
Sustainability 13 01905 g007
Figure 8. Comparisons of national development as of 2015 among MLR countries.
Sustainability 13 01905 g008
Figure 9. (a) Developmental status of MLR countries according to: (upper left) economic, (upper right) environmental, (lower left) social, and (lower right) political perspectives. (b) Average developmental status of MLR countries.
Sustainability 13 01905 g009
Table 1. Indicators used in developmental analyses.
SectorIndicatorUnitSource
Economic
development
Air transport (registered)-World Bank
Electric power consumptionkWh per capitaWorld Bank
Employment-to-population ratio%International Labour Organisation
GDPCurrent billion USDWorld Bank
Environmental developmentPM2.5 air pollution, mean annual exposureμg/m3World Bank
Biodiversity-Clio
CO2 emissionsktWorld Bank
Electricity production from renewable sources, excluding hydroelectricity% of totalWorld Bank
Forest area% of landWorld Bank
Social
development
Average years of educationyear(s)Clio
HDI-United Nations Development Programme
Percentage of assemblywomen%World Bank
Educational inequality Gini
coefficient
%Clio
Life expectancyyear(s)World Bank
Urban population% of totalUN Department of Social and Economic Affairs
Political
development
CPI-Transparency International
LDI-V-Dem
Military expenditure% of GDPSIPRI
Table 2. Country abbreviations.
AbbreviationCountryAbbreviationCountry
AfghanistanAFGSouth KoreaKOR
AlbaniaALBKuwaitKWT
AlgeriaDZAKyrgyzstanKGZ
ArmeniaARMLebanonLBN
AzerbaijanAZEMacedoniaMKD
BhutanBTNMaltaMLT
Bosnia and HerzegovinaBIHMongoliaMNG
BulgariaBGRMontenegroMNE
ChinaCHNMoroccoMAR
CroatiaHRVNepalNPL
CyprusCYPPakistanPAK
EgyptEGYPortugalPRT
FranceFRARomaniaROU
GeorgiaGEOSaudi ArabiaSAU
GreeceGRCSerbiaSRB
IranIRNSpainESP
IraqIRQSyriaSYR
IsraelISRTajikistanTJK
ItalyITATunisiaTUN
JapanJPNTurkeyTUR
JordanJORTurkmenistanTKM
KazakhstanKAZUnited StatesUSA
North KoreaPRKUzbekistanUZB
Publisher’s Note: MDPI stays neutral with regard to jurisdictional claims in published maps and institutional affiliations.

