Article

Forested Riparian Buffers as Climate Adaptation Tools for Management of Riverine Flow and Thermal Regimes: A Case Study in the Meramec River Basin

1
Department of Biology, Saint Louis University, 3507 Laclede Avenue, St. Louis, MO 63103, USA
2
National Great Rivers Research and Education Center, One Confluence Way, East Alton, IL 62024, USA
3
The Nature Conservancy Missouri Chapter, 3110 Crape Myrtle Drive, Columbia, MO 65203, USA
4
Department of Biological and Agricultural Engineering, University of Illinois, Urbana-Champaign, 1304 W Pennsylvania Avenue, Urbana, IL 61801, USA
5
School of Natural Resources, Biomedical, Biological, & Chemical Engineering, University of Missouri-Columbia, Columbia, MO 65211, USA
*
Author to whom correspondence should be addressed.
Sustainability 2021, 13(4), 1877; https://doi.org/10.3390/su13041877
Submission received: 31 December 2020 / Revised: 28 January 2021 / Accepted: 3 February 2021 / Published: 9 February 2021
(This article belongs to the Special Issue Durable Protections for Free-Flowing Rivers)

Abstract

:
Ongoing and projected changes in climate are expected to alter discharge and water temperature in riverine systems, thus resulting in degraded habitat. Climate adaptation management strategies are proposed to serve as buffers to changes in air temperature and precipitation, with these strategies potentially providing relatively stable protection for flow and thermal regimes. Using a hydrologic and water temperature modeling approach in the Meramec River basin in eastern Missouri, U.S.A., we examined the ability of forested riparian buffers to serve as a useful climate adaptation strategy against ongoing and projected changes in climate. We developed a multi-scale approach using Soil and Water Assessment Tool (SWAT) hydrologic and water temperature models as well as a Stream Network Temperature Model (SNTEMP) with different amounts of simulated riparian vegetation to estimate streamflow and water temperature variation within the Meramec River basin under both contemporary and projected future climate conditions. Our results suggest that riparian buffers offer benefits to mitigating increases in water temperature due to shading effects; however, patterns in discharge did not vary substantially based on simulations. From an ecological perspective, the addition of riparian buffers is also projected to reduce the impacts of climate change on Smallmouth Bass (Micropterus dolomieu) by decreasing the number of days water temperatures exceed the thermal tolerance of this species.

1. Introduction

Free-flowing rivers represent an important but increasingly rare resource for the conservation of freshwater biodiversity. The ecological importance of these unimpounded systems is realized, in part, through the provisioning of relatively natural flows and thermal characteristics, which are fundamental drivers regulating lotic ecosystems [1,2]. When rivers are impounded, flows and thermal characteristics are altered, with well-documented effects on physical and biological processes in these systems [3,4,5]. In particular, flow volume (discharge) and seasonal variability in flows influence species diversity and ecosystem functioning [1,6,7]. Species richness and diversity as well as ecosystem productivity are also regulated by the amount of (thermal) energy in a system [2,8], and the exceedance of temperature thresholds can result in reduced performance and mortality of freshwater taxa [9,10], as well as alterations to their ecological interactions [11].
While free-flowing rivers and intact vegetated landscapes contribute to the relatively long-term stationarity of hydrologic processes and riverine thermal regimes, ongoing and projected changes in climate are expected to perpetuate recently evident non-stationary patterns in discharge and water temperature [12,13,14,15]. These directional changes in environmental characteristics of rivers will presumably move free-flowing systems away from their natural state, with results that should be analogous to the impacts of impoundments on riverine systems. Climate adaptation strategies are management approaches designed to serve as a buffer to changes in air temperature and precipitation by increasing a system’s resilience to climate change [16]. However, there is a limited quantitative understanding of how contemporary management practices may buffer against projected changes in climate in riverine systems.
A recently discussed nature-based climate adaptation strategy for riverine systems is the addition of woody vegetation to riparian areas [17]. Re-establishing natural riparian habitats can mitigate against extreme flows and water temperatures, thus preserving discharge and thermal characteristics of free-flowing rivers [18,19]. Riparian vegetation also supports the maintenance of natural geomorphological conditions as well as reduces sediment and point and non-point source pollution reaching rivers, e.g., [20,21]. Although recommendations for effective buffer sizes vary, Sweeney and Newbold [18] suggest that a minimum of 30 m of the natural riparian buffer is needed to provide protection against thermal alterations, while the buffer width necessary to mitigate against increased surface runoff can be slightly lower. The type of vegetation in riparian zones is also critical, with forested areas generally providing the greatest benefits to the maintenance of in-stream processes [22,23].
While the majority of research on riparian buffers has focused on the contemporary physical and biological benefits of a forested riparian zone, recent attention has been given to the need for intact riparian zones in a changing climate [17,21]. Because changes in climate have the potential to increase water temperatures, the frequency of extreme discharge events, and alter contaminant transport processes [14,24,25], intact forested riparian zones may serve as a valuable climate adaptation management strategy. However, assessment of these pre-emptive management approaches is largely dependent on model-based projections of future hydrological and thermal processes in riverine systems.
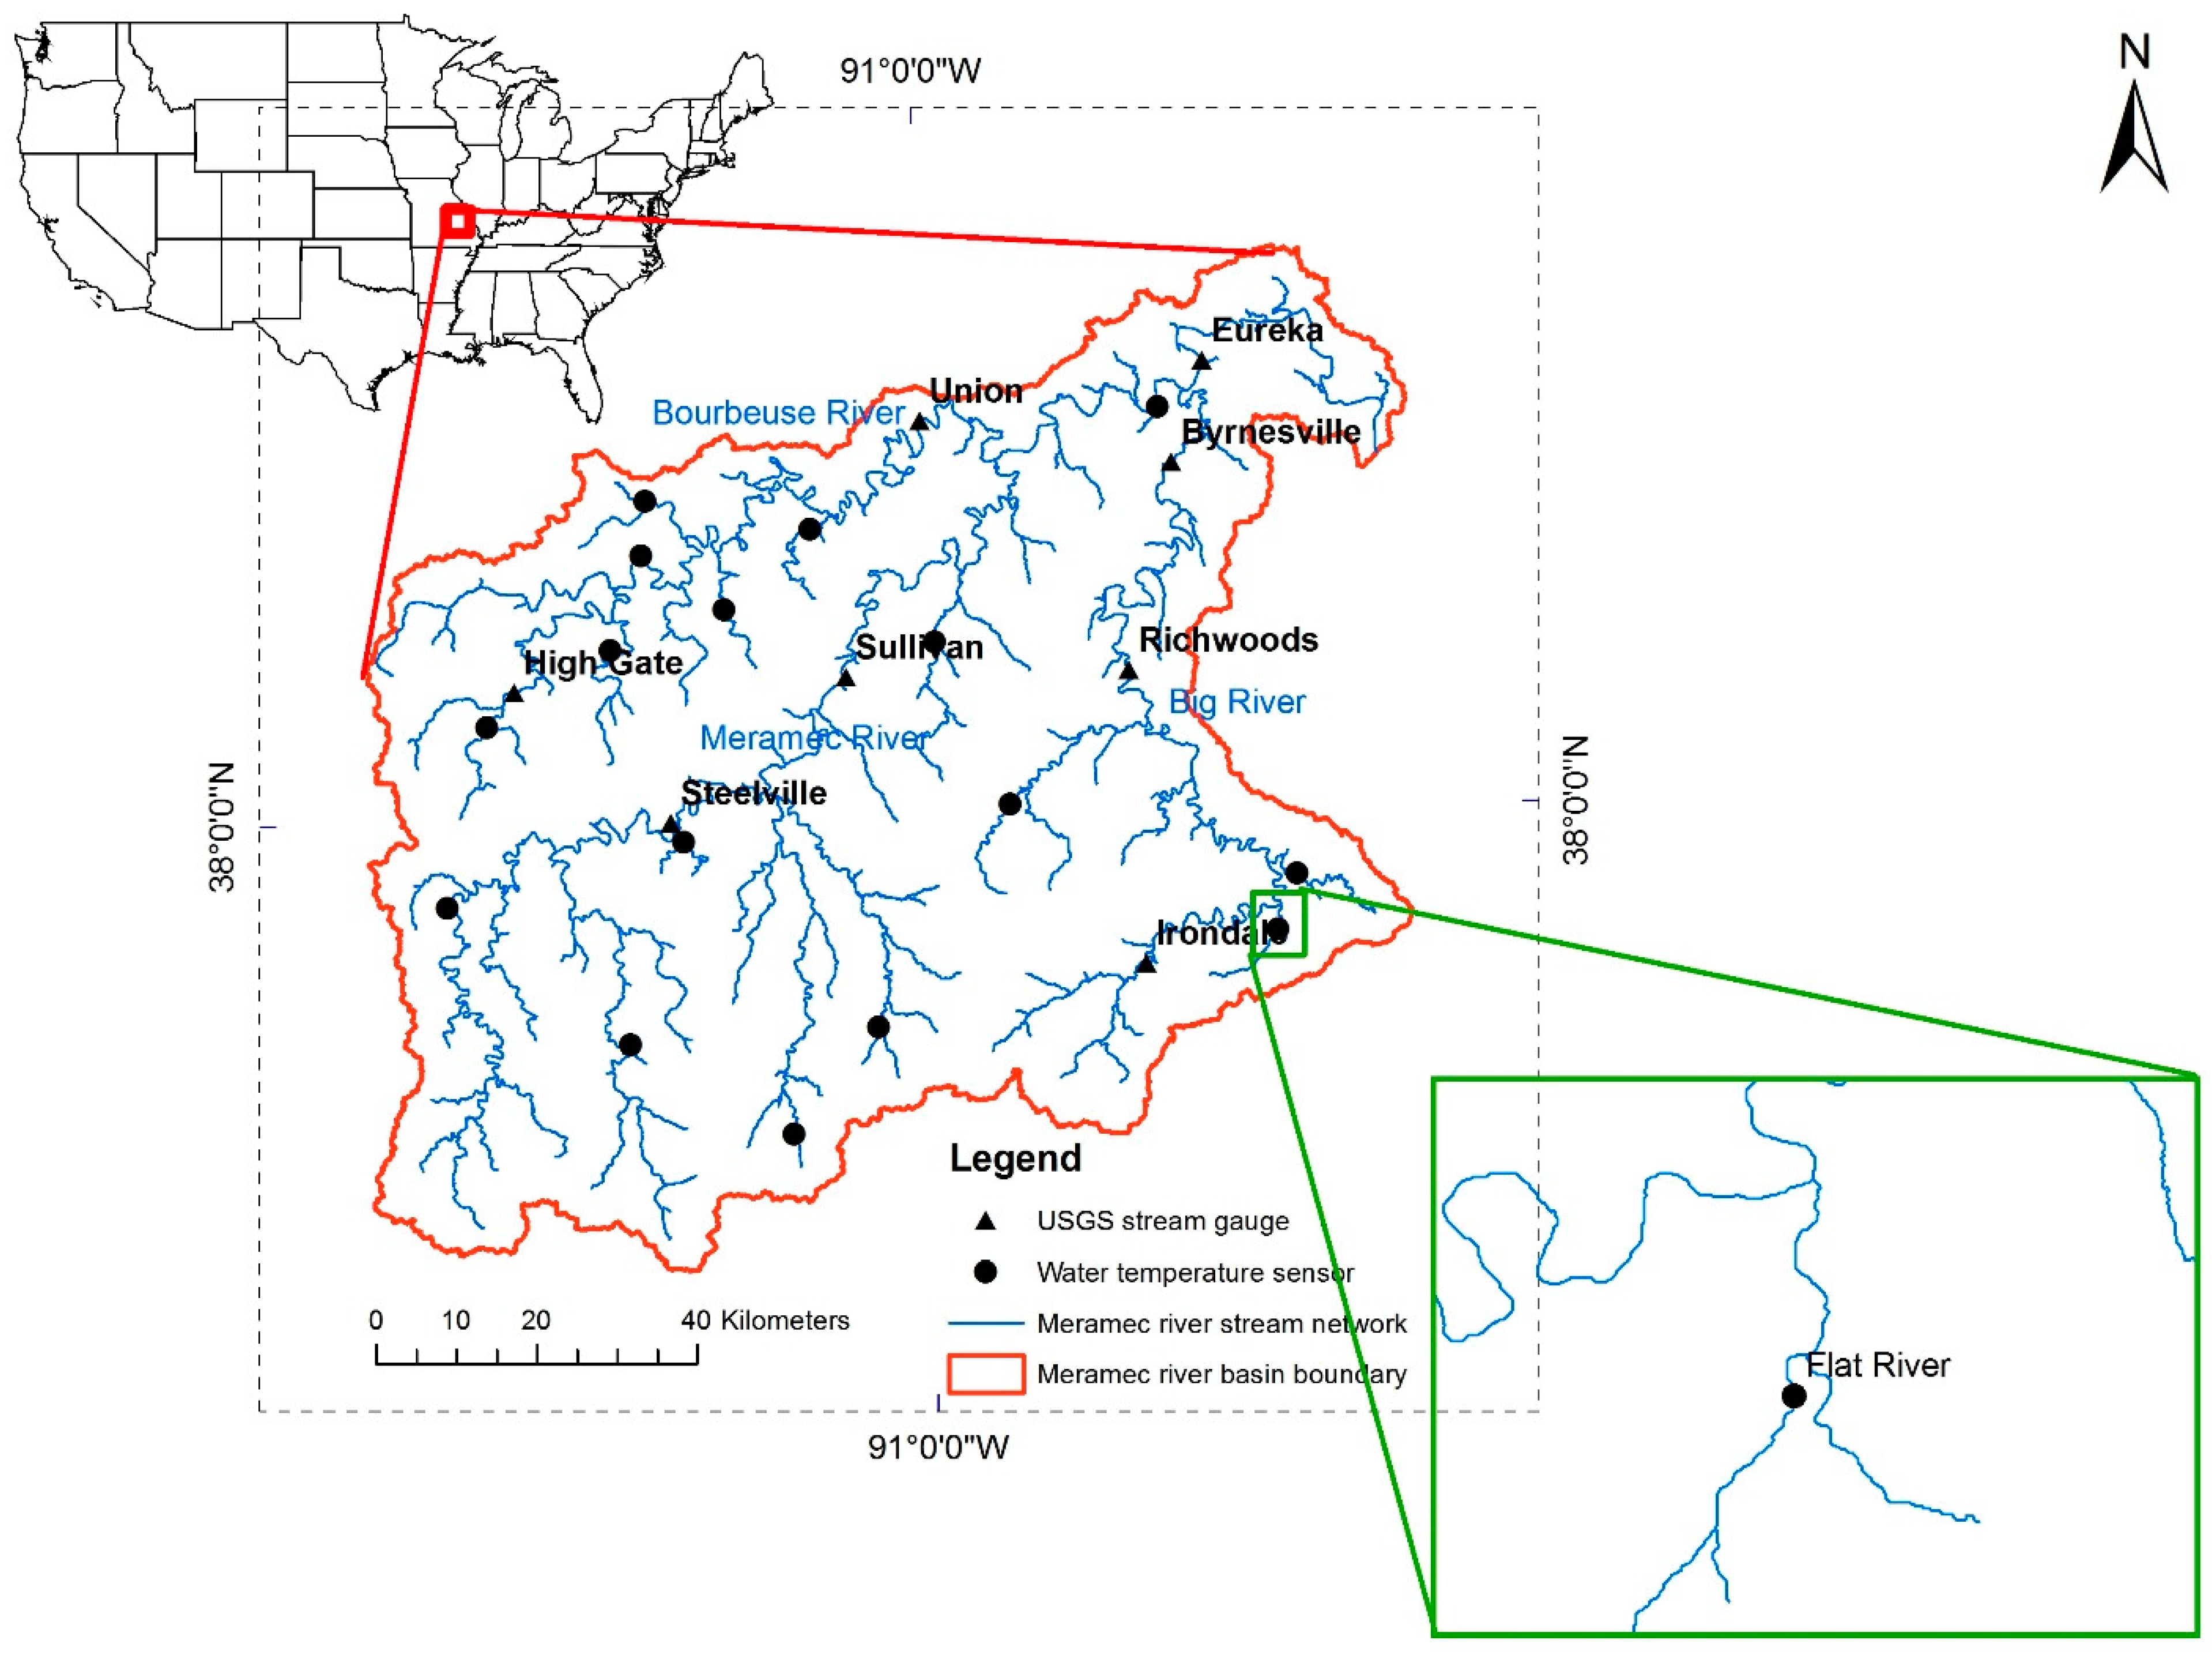
The purpose of this study is to provide a novel perspective on the potential benefits of forested riparian buffers as a climate adaptation strategy for maintaining natural flow and thermal regimes in free-flowing river systems as climate changes. We use hydrologic and water temperature models to project the potential effects of adding riparian buffers on streamflow and water temperature at a basin scale across the Meramec River basin (MRB) in eastern Missouri, USA. We also investigate the potential influence of canopy shading from riparian buffers on water temperature at the stream reach scale under both contemporary and future climate conditions. To highlight the potential ecological significance of riparian buffers across the basin and provide an additional novel perspective on this management approach, we relate reach-scale estimates of water temperature to the thermal tolerance of Smallmouth Bass (Micropterus dolomieu), an ecologically and recreationally important sport fish in the MRB.

2. Materials and Methods

2.1. Study Area

The MRB covers an area of approximately 10,270 km2 in east-central Missouri, USA (Figure 1). The basin contains three primary branches, including the mainstem Meramec River and two large tributaries of the Meramec River: the Bourbeuse River and the Big River. The Meramec River flows northeast for 351 km to the outlet at the Mississippi River (38.39056° N, 90.34417° W), approximately 30 km south of St. Louis, Missouri. The MRB receives an average of 104 cm of precipitation annually [26]. The primary land uses in the MRB are forest (68%), pasture/hay (19%), and urban (8%), with smaller areas also represented by agriculture and wetlands [27]. The United States Geological Survey maintains gauging stations across the basin that provide discharge data we used to calibrate and validate our hydrologic models (https://waterdata.usgs.gov/nwis accessed on 1 September 2020) (Figure 1).
The MRB supports relatively high levels of freshwater biodiversity and has been identified as one of the most biologically important river basins in the United States [7,28,29]. In the 1930s, the Meramec River Basin Project proposed the construction of major dams on the three main branches within the MRB (Meramec, Big, and Bourbeuse Rivers) and several smaller dams on tributaries throughout the watershed. The United States Congress authorized details of this plan in 1966, with a major impoundment initially targeted on the main branch of the Meramec River, yet public resistance led to deauthorization of the plan in 1981 and the MRB remains a largely free-flowing system. Despite being in relatively good overall ecological health related to flows, excessive sediment runoff from localized land transformations as well as impacts from mining operations (among other point and non-point source inputs) are negatively impacting the MRB [28,30].

2.2. Soil and Water Assessment Tool Hydrologic Model

We used the Soil and Water Assessment Tool (SWAT) hydrologic model to estimate discharge across the MRB. SWAT is a continuous-time, semi-distributed watershed model which divides a watershed into subbasins, which are further subdivided into hydrologic response units (HRUs) based on similarities in land cover, soil properties, and landscape slope. For each HRU, SWAT simulates soil water balance, groundwater flow, lateral flow, channel routing (main and tributary), evapotranspiration, crop growth and nutrient uptake, pond and wetland balances, soil pesticide degradation, and in-stream transformation of nutrients and pesticides. Detailed descriptions of the theory and model structure are given by Reference [31] and in the SWAT theoretical documentation [32]. To estimate water temperature, we used an improved SWAT water temperature model developed by Ficklin et al. [33] for ungauged subbasins in the MRB. The modified water temperature module can better capture stream temperature change influenced by changing hydroclimatic conditions caused by land-use change, implementation of management practices, and climate change [33].
The SWAT hydrologic model for the MRB was built upon a previous version described in Wu et al. [21]. SWAT inputs were the same as in Wu et al. [21]; however, the model was re-calibrated and re-validated on a daily (as opposed to monthly) time step to characterize variation in streamflow and water temperature at a time scale that was relevant to our current study. The SWAT Calibration and Uncertainty Procedures (SWAT-CUP 2012) with the Sequential Uncertainty Fitting version-2 (SUFI-2) [34] were used for parameter sensitivity analysis, calibration, and validation of daily streamflow simulation. The calibration and validation periods for streamflow were 1 January 1995–31 December 2004, and 1 January 2005–31 December 2014, respectively [as in 21].
Since SWAT-CUP was not designed to carry out calibration for the modified SWAT water temperature model, we adopted a Multi-method Genetically Adaptive Multi-objective Optimization Algorithm (AMALGAM) [35] to calibrate parameters influencing stream temperature. AMALGAM adaptively and simultaneously employs multiple Evolution Multi-objective Optimizers (EMOs) to ensure a reliable and computationally efficient solution to multi-objective optimization problems. We used four EMO algorithms in AMALGAM, including Non-dominated Sorting Genetic Algorithm II (NSGAII, [36]), Particle Swarm Optimization (PSO, [37]), Adaptive Metropolis Search (AMS, [38]), and Differential Evolution (DE, [39]). Water temperatures were assembled from 15 HOBO Water Temperature Pro v2 Data Loggers deployed across the MRB and used for stream temperature calibration and validation (Figure 1). The calibration period for the stream temperature measurements was from 15 November 2017 to 19 July 2018, while the validation period was from 20 July 2018 to 19 November 2018. The calibrated SWAT parameters and their final values are listed in Table 1.
Two statistical criteria were used to quantify model performance in simulating daily streamflow and water temperature during the calibration and validation periods: the coefficient of determination (R2, [40]) and the Nash-Sutcliffe coefficient (NSE, [41]). The R2 value provides insight into the goodness-of-fit of the model to the observed data. The NSE is also an indicator of goodness-of-fit and is an often-used metric because it normalizes model performance into an interpretable scale. NSE = 1 indicates perfect correspondence between observations and simulations. NSE = 0 indicates that the model simulations are as accurate as the observation mean, whereas NSE < 0 indicates the model is a less accurate predictor than the observation mean.

2.3. Climate Model Analysis and Scenario Selection

Gridded precipitation and temperature data from 1950–2099 were extracted from General Circulation Model (GCM) outputs and integrated into calibrated and validated SWAT models to project discharge and water temperature in the MRB over the coming decades [42]. The United States Bureau of Reclamation has developed a daily archive of downscaled CMIP5 (Coupled Model Intercomparison Project Phase 5) projections at a 1/8° resolution using the two-step bias correction and spatial disaggregation algorithm [43]. Description of downscaled CMIP5 climate and hydrologic projections and additional documentation on the archive and the methodology can be found in Reclamation [44,45].
We analyzed 67 projections generated by 20 different climate models from the CMIP5 archive spanning four representative concentration pathways (RCPs): RCP2.6 (peak in radiative forcing at 2.6 W/m2 before 2100); RCP4.5 (stabilization without overshoot to 4.5 W/m2 at 2100); RCP6.0 (stabilization without overshoot to 6 W/m2 after 2100); RCP8.5 (increasing radiative forcing to 8.5 W/m2 by 2100) [42]. The gridded air temperature data were spatially averaged and compared with each climate projection to obtain air temperature differences between the historical and the future periods. For this study, we focused on a historical period and two future periods: 2000–2003, 2030–2033, and 2060–2063. To condense our results yet still assess the range of impacts of a warming climate on water temperature from our 67 GCM projections, we selected the GCM scenarios with the smallest and the largest increases in maximum air temperature (Tmax) and the GCM scenario with a median change compared to historical estimates.

2.4. Riparian Buffer Simulation

Riparian buffer additions throughout the MRB were simulated by creating a new land use map by modifying the existing land use data used to calibrate and validate the SWAT models. We did this by converting land use in the current riparian buffer zone that was not already represented as forest to mixed forest, except for areas currently categorized as water or wetlands. The buffer width was set at 30.5 m on both sides of the stream channel [21], a size suggested to be effective by Sweeney and Newbold [18]. We recognize that the location of the modified riparian buffer is not represented in a spatially explicit manner within each subbasin in SWAT given the nature of the model’s structure. Instead, the buffer expansion was simulated as a type of land use change within each subbasin, representing the influence of conversion of land use on surface runoff.
After developing the updated land use data with simulated riparian buffers, the validated SWAT model was then run using the updated land use data in conjunction with the current and future temperature and precipitation data described above. Outputs from the updated riparian buffer scenario were then compared to the current riparian condition scenario to assess the impacts of buffer expansion on streamflows and water temperatures in each subbasin. The SWAT water temperature model does not account for the shading effect of riparian vegetation on water temperatures. Water temperature estimation is largely influenced by discharge volume and air temperature. Consequently, the watershed scale temperature model is developed to determine if changes in flow will subsequently result in altered thermal regimes. To assess the shading effects of riparian vegetation on water temperature, outputs from the watershed-scale SWAT simulations were input to a reach-scale water temperature model to assess potential localized cooling effects of buffer addition on water temperatures, as follows.

2.5. Stream Network Temperature Model (SNTEMP)

SNTEMP is a mechanistic, one-dimensional heat transport model created by the Natural Resources Conservation Service (formerly Soil Conservation Service) and The U.S. Fish and Wildlife Service [46,47]. The main objective of SNTEMP is to simulate the effects of management practices on mean and maximum water temperatures within local stream sections (as opposed to SWAT, which operates at a watershed scale). The net heat flux is computed as the addition and subtraction of heat to and from atmospheric radiation, solar radiation, convection, conduction, evaporation, vegetation shading, fluid friction from the streambed, and back radiation from the water. SNTEMP nodes are used to divide the simulated reaches into segments with homogeneous flow, width, and shading. The data required for each node include flow in, flow out, water temperature at the inlet, reach length, top width, slope, channel roughness, and shading characterization [48,49]. The properties applied at a node are effective downstream until the next node is found where new calculations are made. The meteorological inputs include air temperature, relative humidity, wind speed, and percent of possible solar exposure. Solar radiation is computed by the model based on the nodes, latitude, time of the year, and meteorological conditions.
We selected the Flat River, a tributary of the Big River in the MRB, for SNTEMP modeling (Figure 1). The Flat River has a total length of 3.4 km, approximately 75% forested riparian buffer, and is within a section of the Big River that exhibited relatively high SWAT model accuracy in the analyses presented in the previous section. Three SNTEMP nodes (Figure 2, Table 2) were used to simulate the two riparian land use conditions: contemporary riparian vegetation and fully restored riparian vegetation (Table 3).
Daily stream temperatures for each of our time frames (2000–2003, 2030–2033, 2060–2063) were simulated from 1 June to 31 August, as this period includes the warmest times of the year and the greatest potential thermal stress to freshwater taxa due to elevated temperatures. The flow data at the inlet and outlet (Nodes 0 and 2) were extracted from the SWAT hydrologic model outputs for each of the 18 contemporary and future GCM + riparian vegetation scenarios (Table 4). Discharge and water temperature were input at the inlet (Node 0) based on outputs from the SWAT hydrologic and water temperature models. The stream geometry for each SNTEMP node and hence, for each segment, was calculated from the watershed stream shapefile and satellite imagery [50], whereas the roughness of the channel was provided by the SWAT calibrated model. The shading characterization is based on topographic altitude, vegetation density, height, and tree crown diameter. The topographic altitude refers to the angle of the sun with respect to the Earth’s horizon and varies based on the time of day, time of year, and latitude. The topographic altitude is at its maximum at noon and during summer and is defined as 0.9 radians for the simulated periods (1 June to 31 August) at the latitude of the stream reach outlet (37.86° N). The assumed height and crown diameter of the implemented riparian vegetation was 30 m and 10 m, respectively. The air temperature was derived from the relevant GCM, while monthly historical values of daily relative humidity, wind speed, and percent of the possible sun were derived from the National Oceanic and Atmospheric Administration (NOAA) Comparative Climatic Data database [51].

2.6. Smallmouth Bass Thermal Tolerance

Smallmouth Bass is an ecologically and recreationally important piscivorous freshwater fish species in North America [52,53], and common in the MRB [54]. Whitledge et al. [55] developed a bioenergetics model for Smallmouth Bass collected from Missouri and used this model to estimate that Smallmouth Bass in the MRB region are expected to lose weight when stream temperatures exceed 27 °C [56]. Accordingly, we use 27 °C as a threshold to determine the frequencies when contemporary and future water temperatures estimated by the SNTEMP model will exceed suitable conditions for this ecologically important species. These threshold exceedance frequencies are calculated for all time periods, climate models, and under each riparian buffer scenario.

3. Results

3.1. SWAT Model Performance

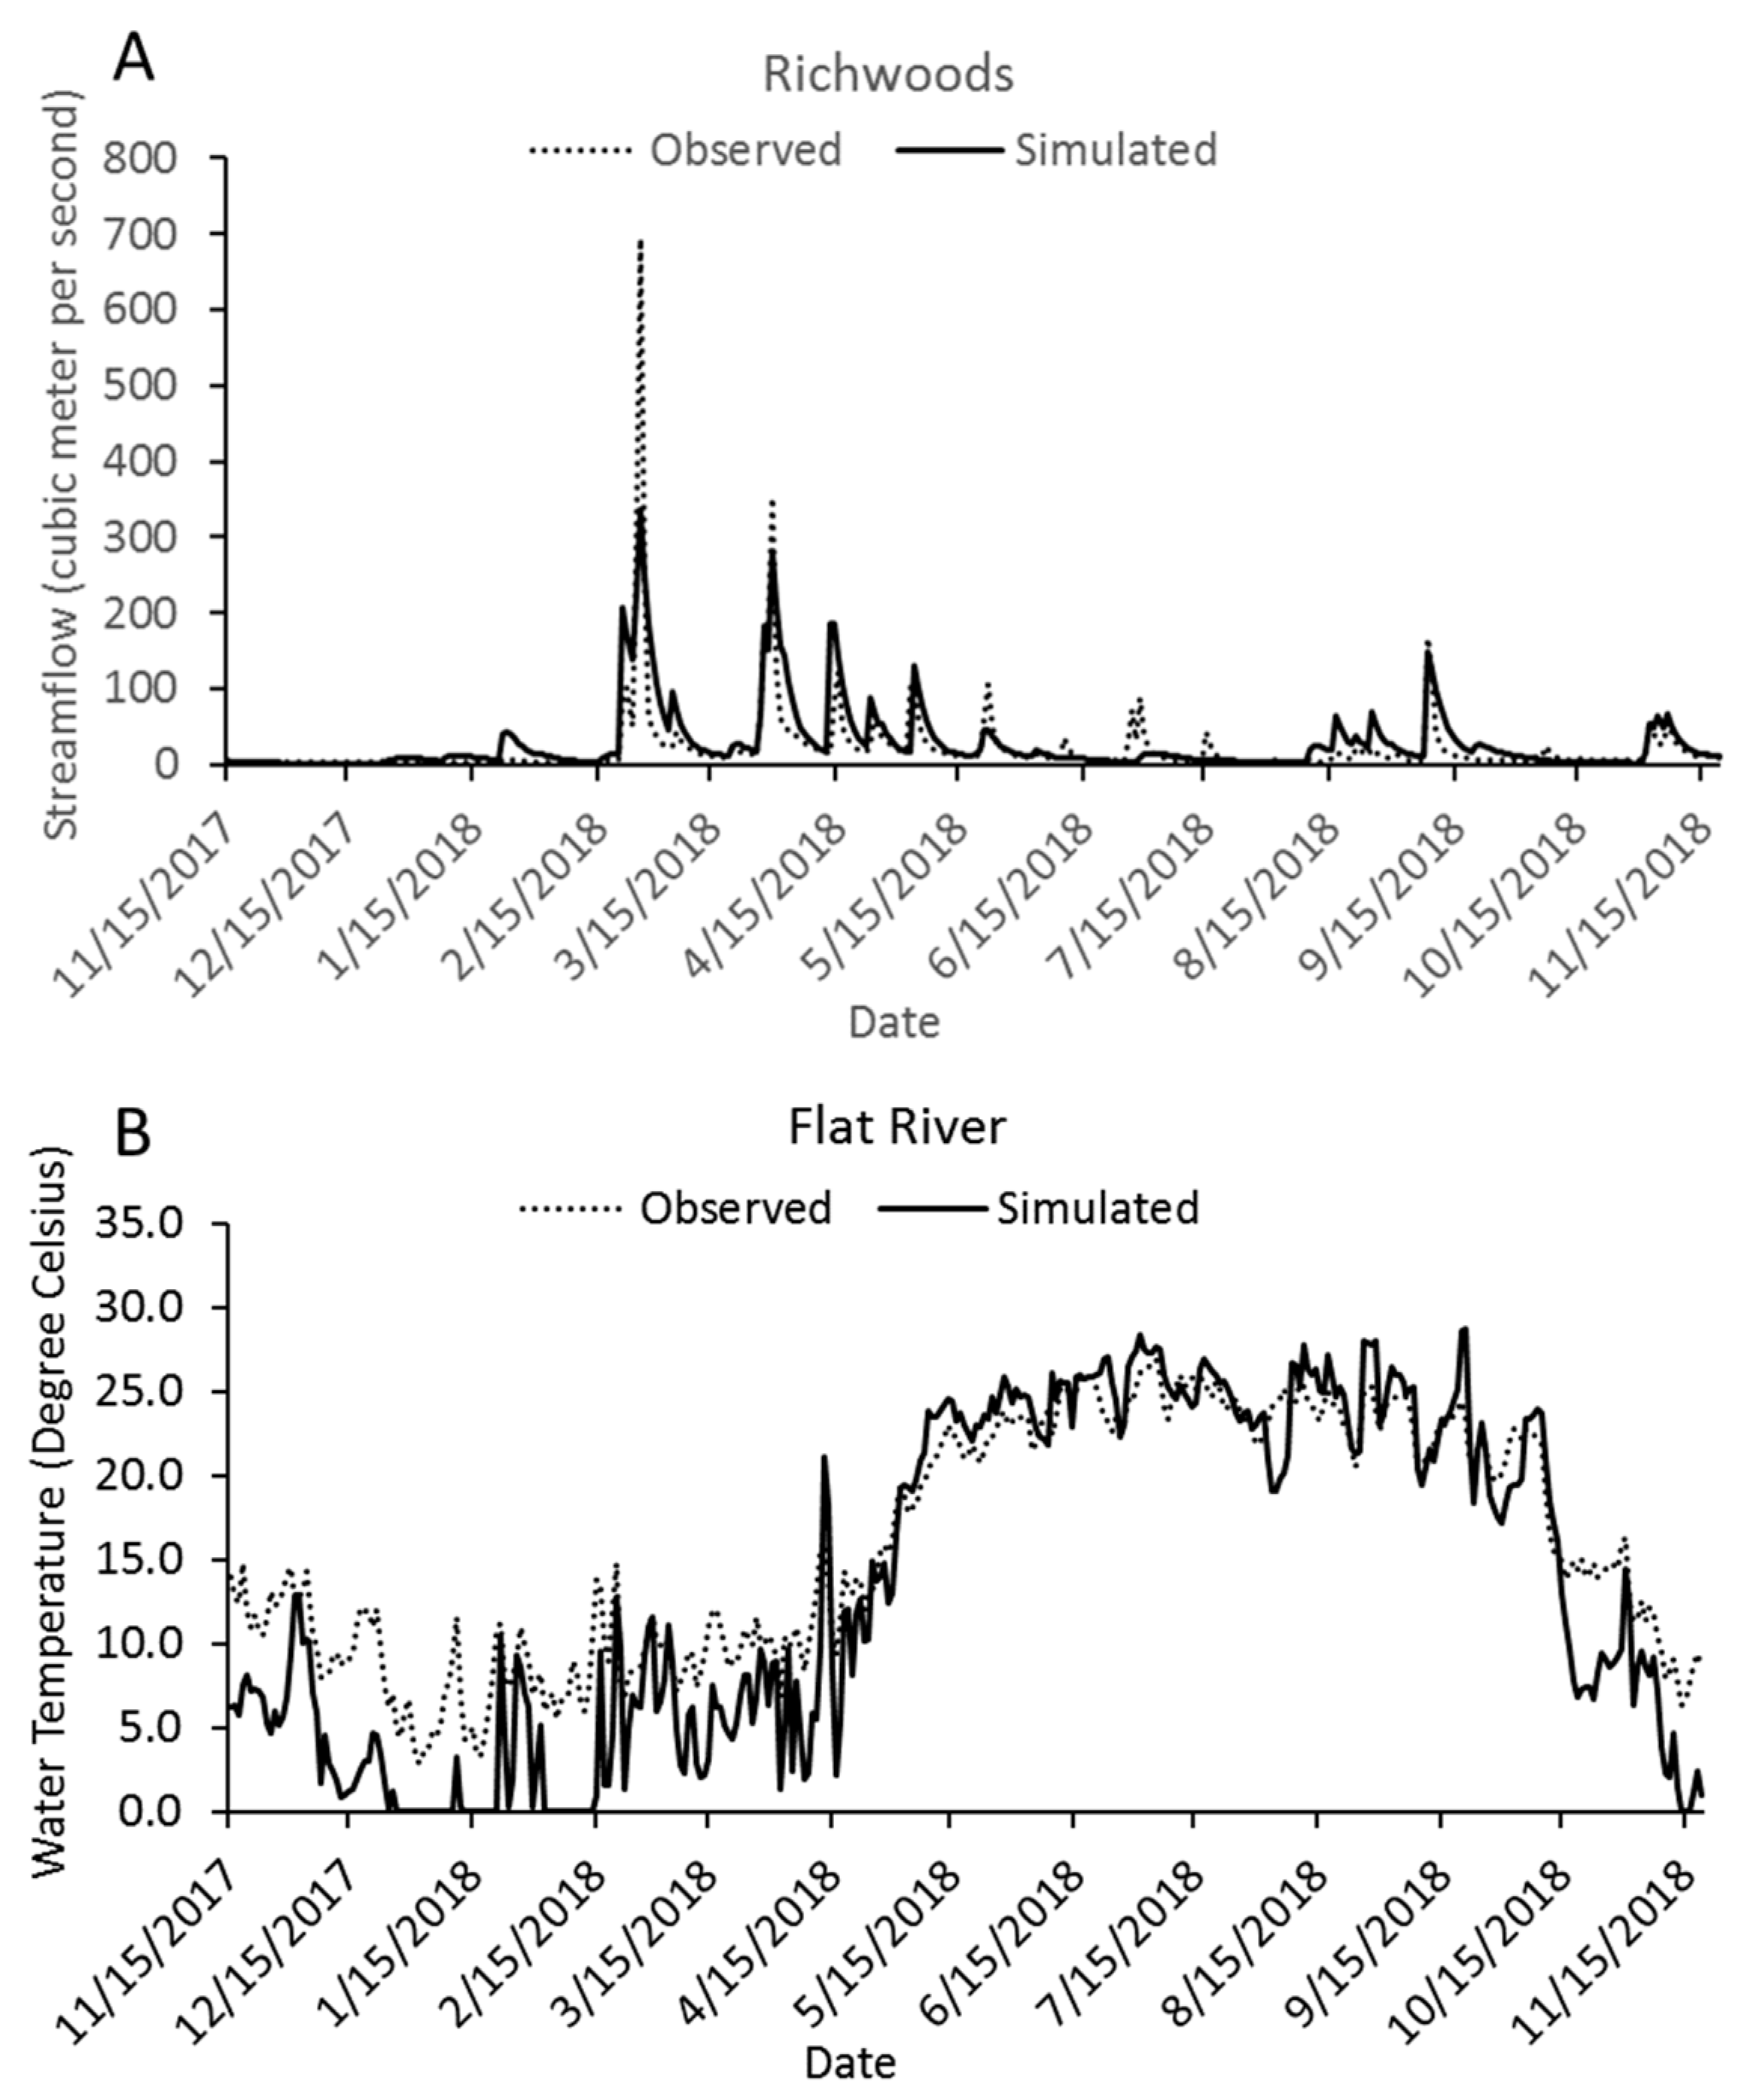
Correlations between simulated and observed streamflow generally indicate high correspondence between the two measures (Table 5), although streamflow during storm peaks and winter months tended to be underpredicted (Figure 3A). Average R2 values for streamflow across the MRB ranged from 0.44 to 0.63 for calibration, and 0.34 to 0.64 for validation, while average NSE values across the MRB varied between 0.34–0.63 and 0.36–0.63 for calibration and validation, respectively (Table 5). For the water temperature model, average R2 values for the calibration (R2 = 0.91) and validation (R2 = 0.93) periods indicate a strong correlation between observed and simulated data (Table 6), with the model performing well in simulating stream temperatures during the summer months (June–August) (Figure 3B). Thus, model estimates can be reasonably used to simulate the impacts of climate change and riparian buffer expansion during the warmest times of the year.

3.2. Future Climate Variability

The Global Circulation Models (GCMs) and RCPs representing minimum, median, and maximum projected temperature increases that were selected for further analyses include MRI-CGCM3-RCP2.6 (Meteorological Research Institute), CCSM4-RCP4.5 (National Center for Atmospheric Research), and MIROC-ESM-RCP8.5 (Japan Agency for Marine-Earth Science and Technology, Atmosphere and Ocean Research Institute, and National Institute for Environmental Studies). Among the selected projections, MRI-CGCM3-RCP2.6 projects a 0.2 °C increase in Tmax, while CCSM4-RCP4.5 and MIROC-ESM-RCP8.5 both project a 1.3 °C increase in Tmax for 2030–2033. From 2060–2063, MRI-CGCM3-RCP2.6, CCSM4-RCP4.5, and MIROC-ESM-RCP8.5 GCMs project increase Tmax by 0.6 °C, 2.3 °C, and 4.1 °C, respectively.

3.3. SWAT Estimated Impacts of Climate Change and Riparian Buffer Expansion

The 2030–2033 and 2060–2063 simulations for the three GCMs under the current and buffer expansion conditions were compared with the historical period of 2000–2003. Changes in streamflow and water temperature caused by projected climate change and the riparian buffer expansion are shown in Figure 4 and Figure 5. The average annual streamflow is projected to increase by 53.1% in both the current riparian conditions and buffer expansion conditions during the summer months of 2030–2033. Streamflow is projected to further increase during 2060–2063, with an average increase of 85.5% projected across the watershed when the riparian zone remains in the current condition, and an average increase of 85.1% when the riparian zone is fully reforested. Even though riparian buffers in the MRB have been projected to significantly reduced sediment in the watershed [21], results from this watershed-scale analysis indicate that the addition of buffers will not significantly alter average discharge as climate changes.
The SWAT water temperature model does not account for the shading influences of riparian vegetation, with model outputs primarily influenced by changes in discharge and air temperature. From 2030–2033, stream temperature is projected to increase by an average of 1.1 °C for the summer months under both the contemporary riparian conditions and if the riparian buffer is fully converted to forest. From 2060–2063, the projected increase in stream temperature in the summer months is 2.3 °C for both contemporary and restored riparian conditions. These minimal differences in projected water temperatures between riparian zone scenarios are not unexpected considering the limited changes in discharge associated with reforested riparian zones.

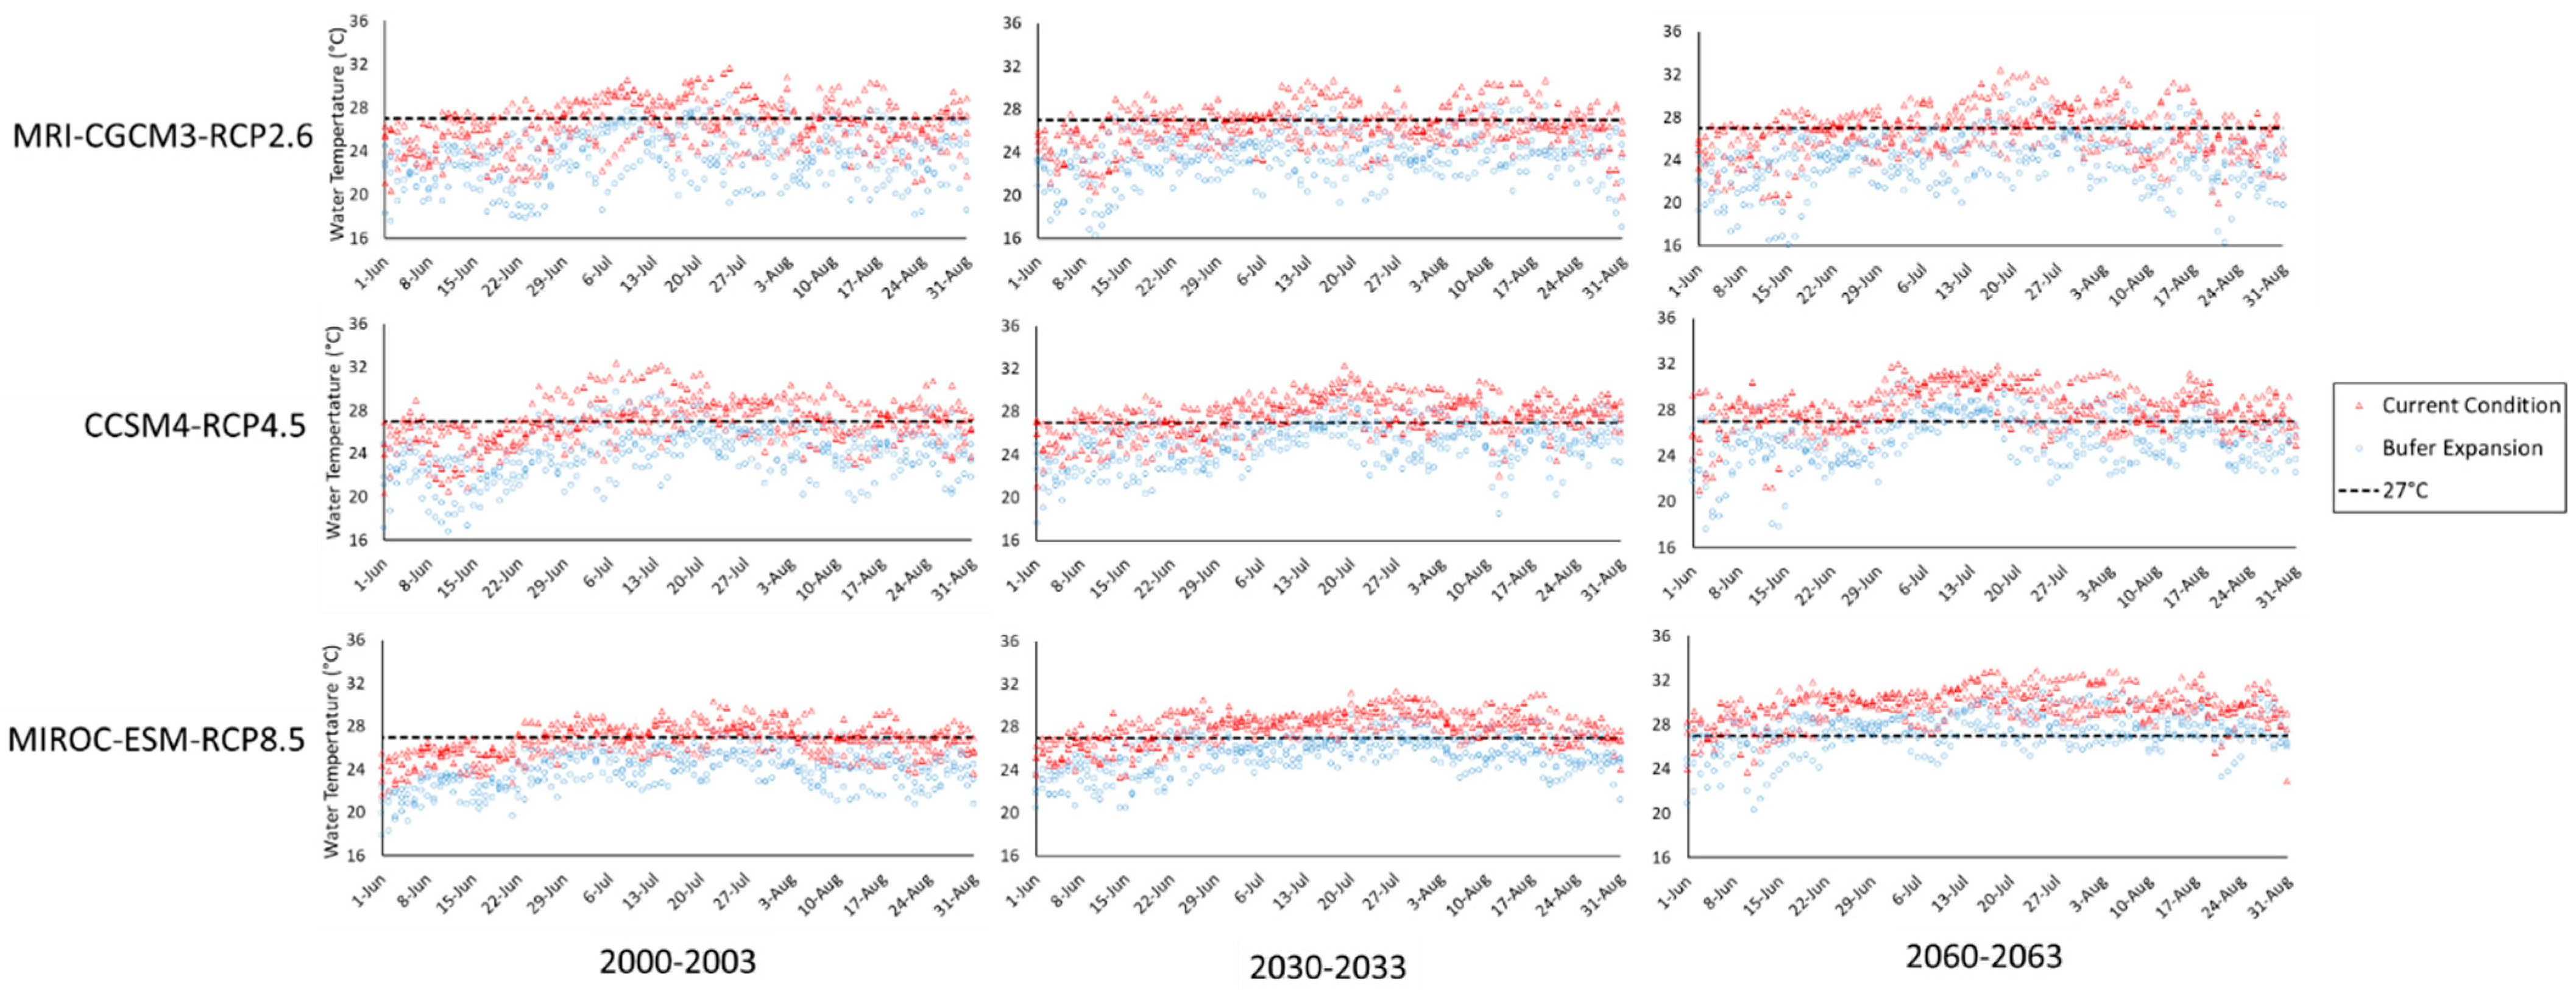
3.4. SNTEMP Estimated Impacts of Climate Change and Riparian Buffer Expansion

Water temperatures are projected to increase from 2000–2003 through 2060–2063 (Table 7). Nevertheless, water temperature estimates decreased with simulated increases in riparian buffers within each time frame under all scenarios (Table 7, Figure 6). The number of days exceeding the 27 °C threshold for Smallmouth Bass growth was reduced under all scenarios with simulated increases in riparian buffers (Table 8). In particular, expansion of riparian buffers is projected to result in a 36.2% average decrease in the number of days (34.3 fewer days) exceeding 27 °C during contemporary (2000–2003) conditions, 47.3% average decrease in the number of days (43.5 fewer days) exceeding 27 °C during 2030–2033, and a 39.1% average decrease in the number of days (36.0 fewer days) exceeding 27 °C during 2060–2063 (Table 8), suggesting the durability of the addition of riparian buffers as climate changes.

4. Discussion

Sustaining natural flow and thermal regimes are some of the primary ecological benefits of maintaining free-flowing river systems [1,2]. When rivers are impounded or water diverted, flows and thermal regimes tend to deviate from historical patterns. Ongoing and projected changes in climate are having a generally similar effect on flow and thermal regimes by altering discharge volume and seasonal patterns of flow variability as well as increasing water temperatures [57,58]. While recent and ongoing changes in climate have likely put the goal of maintaining natural (i.e., historical) flow and thermal regimes out of reach in some areas, the opportunity to buffer against future changes in climate using climate adaptation approaches is a possibility [59,60].
Projected changes in climate are expected to result in intensified seasonal precipitation across the MRB, potentially increasing the frequency of high discharge events and the amount of sediment in the river [21]. In terms of thermal stresses in the MRB, increases in water temperature over the past century associated with the urban heat island effect reflect the potential impacts of climate change-associated temperature increases on fish populations [61]. Using a model-based simulation approach, Wu et al. [21] demonstrated that riparian buffers can, in many cases, reduce the amount of sediment entering stream channels from surface runoff, under both contemporary and future climate conditions. We extended the approach of Wu et al. [21] to assess whether the addition of riparian buffers could serve as a climate adaptation strategy to buffer against flow alterations and increased water temperatures associated with a changing climate. Our work also extends Wu et al. [21] by examining the influence of riparian buffers at a daily time-step (as opposed to monthly in Wu et al. [21]) at multiple scales, and the potential subsequent impacts of water temperature increases on local fish populations. Results indicate that contemporary and future flow regimes would not be significantly altered by the addition of riparian buffers, at least at the extent examined in this study. Results from the SWAT water temperature model also indicate that the minimal changes in flow volumes associated with the addition of riparian buffers would not significantly alter water temperatures. It is important to note that projections from the SWAT water temperature model, as applied in this study, would only be influenced by changes in discharge volume as the effects of shading are not considered by the SWAT model.
The SNTEMP model, as opposed to the SWAT model, is able to estimate the effects of riparian shading by accounting for reach-scale physical characteristics of the riparian zone [46,47]. While the SNTEMP model cannot easily be developed at the watershed scale, outputs at the reach scale can provide insights into the local thermal impacts of an intact riparian zone [49]. Results indicate that adding a fully restored forested riparian buffer could potentially decrease water temperatures in all scenarios, with average decreases ranging from 0.9 °C–1.3 °C across the summer months in our analyses. Moreover, addition of fully intact riparian buffers is projected to result in water temperatures in the 2030–2033 and 2060–2063 RCP2.6 and RCP4.5 scenarios that are lower than or, in one case, analogous to estimated contemporary conditions.
While estimates of average changes in water temperatures provide insights into the potential physical response of freshwater systems to changes in climate, the biological implications of these changes based on species-specific physiological data are often unavailable. Results from our SNTEMP models indicate that re-establishment of riparian buffers can provide critical benefits in terms of thermal thresholds for Smallmouth Bass. For example, fully restored riparian buffers would reduce the number of days exceeding the 27 °C growth threshold from approximately one month to less than one week in the 2030–2033 RCP2.6 scenario and from approximately two months to less than two weeks in the 2030–2033 RCP4.5 scenario, thus providing a dramatic increase in the number of positive growth days for Smallmouth Bass in this section of the MRB. Moreover, re-establishment of the riparian buffer would decrease the percentage of days exceeding 27 °C in all future time periods and RCP scenarios compared to estimates based on contemporary climate and buffer conditions, except for the 2060–2063 RCP8.5 scenario. In particular, results from our projections suggest that restoring a forested buffer would decrease the percentage of days exceeding 27 °C from 2030–2033 compared to contemporary unrestored conditions by 34.2%, 35.2%, and 25.1% for RCP2.6 RCP 4.5, and RCP8.5, respectively. Additionally, restoring a forested buffer would decrease the percentage of days exceeding 27 °C from 2060–2063 compared to contemporary unrestored conditions by 8.7% and 27.5% for RCP2.6 and RCP 4.5 scenarios, respectively. These results suggest the potentially significant ecological benefits of fully restored riparian zones, with sustained habitat improvements continuing even as climate changes.
Most research on the benefits of river restoration to freshwater fish populations has focused on habitat improvements with the assumption of a stationary climate (reviewed in Reference [62]). The combination of these results suggests that habitat remediation can both concentrate fish due to shorter-term movements as well as facilitate longer-term increases in abundance due to enhanced reproduction and survival, e.g., [63,64], with the size and type of habitat restoration having important implications for the degree of population response [65,66]. Considering ongoing and projected changes in climate, we now must consider not only the size and type of habitat improvements but also the durability of these management actions over the next several decades. Results from our multi-scale assessment of the impacts of restored riparian buffers suggest that enhanced buffers should have durable long-term benefits, at least in reducing water temperatures, and may offer sustained habitat improvements compared to contemporary riparian conditions, even as climate changes.

5. Conclusions

We simulated the potential effects of a restored forested riparian zone on discharge and water temperatures based on an array of future climate scenarios and found that these buffers can reduce current and future water temperatures but do little to alter flow regimes. Moreover, the decreases in water temperature also dramatically decrease the potential duration of thermal stress on Smallmouth Bass, which is an ecologically and recreationally important fish within the basin. Whether intact riparian zones represent a durable form of protection likely depends on a wide array of factors [67]. From an ecological perspective, durability is dependent on riparian vegetation persisting over time, which is in part due to plant species’ ability to tolerate local climate and hydrologic variation (e.g., floods, droughts). Durability also depends on favorable social, political, and economic conditions, which are also driven by local factors. Accordingly, establishing durable riparian protection for rivers in the context of a changing climate is a place-based issue where modes of application may not be effectively transferred among regions without appropriate consideration of complex socio-environmental conditions and interactions.
While the effectiveness of forested riparian zones in contributing to sustainable development goals is likely context-dependent, consistent regional application of management activities designed to improve ecosystem services can generally improve conditions of freshwater systems [68,69]. Moreover, localized protection of source water, in part through habitat remediation such as riparian restoration, is also suggested to contribute to the achievement of sustainable development goals [70]. While a variety of approaches will likely be necessary to buffer the impacts of ongoing changes in climate, results from our study of the Meramec River basin suggest that reforested riparian buffers can mitigate against projected increases in water temperature and subsequent effects on local biodiversity, thus contributing to the durability of free-flowing river systems.

Author Contributions

Conceptualization, J.H.K., A.B.-A., C.-L.W., B.C., M.L.C., D.M.H., and S.J.H.; methodology, J.H.K., A.B.-A., C.-L.W., B.C., M.L.C., and S.J.H.; formal analysis, J.H.K., A.B.-A., and C.-L.W.; investigation, J.H.K., A.B.-A., C.-L.W., B.C., M.L.C., A.I.D., D.M.H., and S.J.H.; resources, J.H.K., A.B.-A., C.-L.W., B.C., M.L.C., and S.J.H.; data curation, J.H.K., A.B.-A., C.-L.W., and M.L.C.; writing—original draft preparation, J.H.K., A.B.-A., and C.-L.W.; writing—review and editing, J.H.K., A.B.-A., C.-L.W., B.C., M.L.C., A.I.D., D.M.H., and S.J.H.; visualization, A.B.-A. and C.-L.W.; supervision, J.H.K.; project administration, J.H.K.; funding acquisition, J.H.K. and S.J.H. All authors have read and agreed to the published version of the manuscript.

Funding

This project was supported by funds from The Nature Conservancy (061716-01) and the United States National Science Foundation (DBI-1564896).

Institutional Review Board Statement

Not applicable.

Informed Consent Statement

Not applicable.

Data Availability Statement

The data presented in this study are available on request from the corresponding author.

Acknowledgments

The authors appreciate the efforts of Alexander Juan and Diella Packman in collecting field-based forest canopy estimates. The authors also appreciate the efforts and comments from three anonymous reviewers which improved this manuscript.

Conflicts of Interest

The authors declare no conflict of interest.

References

  1. Poff, N.L.; Allan, J.D.; Bain, M.B.; Karr, J.R.; Prestegaard, K.L.; Richter, B.D.; Sparks, R.E.; Stromberg, J.C. The natural flow regime. BioScience 1997, 47, 769–784. [Google Scholar] [CrossRef]
  2. Caissie, D. The thermal regime of rivers: A review. Freshw. Biol. 2006, 51, 1389–1406. [Google Scholar] [CrossRef]
  3. Baxter, R.M. Environmental effects of dams and impoundments. Annu. Rev. Ecol. Syst. 1977, 8, 255–283. [Google Scholar] [CrossRef]
  4. Allan, J.D.; Flecker, A.S. Biodiversity conservation in running waters. Bioscience 1993, 43, 32–43. [Google Scholar] [CrossRef]
  5. Taylor, C.A.; Knouft, J.H.; Hiland, T. Consequences of stream impoundment on fish communities in a small North American drainage. Regul. Rivers 2001, 17, 687–698. [Google Scholar] [CrossRef]
  6. Niu, S.Q.; Franczyk, M.P.; Knouft, J.H. Regional species richness, hydrological characteristics and the local species richness of assemblages of North American stream fishes. Freshw. Biol. 2012, 57, 2367–2377. [Google Scholar] [CrossRef]
  7. Niu, S.Q.; Knouft, J.H. Hydrologic characteristics, food resource abundance, and spatial variation in stream assemblages. Ecohydrology 2017, 10, e1770. [Google Scholar] [CrossRef]
  8. Knouft, J.H.; Page, L.M. Climate, elevation, stream channel diversity, and geographic clines in species richness of North American freshwater fishes. J. Biogeogr. 2011, 38, 2259–2269. [Google Scholar] [CrossRef]
  9. Beitinger, T.L.; Bennett, W.A.; McCauley, R.W. Temperature tolerances of North American freshwater fishes exposed to dynamic changes in temperature. Environ. Boil. Fishes 2000, 58, 237–275. [Google Scholar] [CrossRef]
  10. Beitinger, T.L.; Lutterschmidt, W.I. Measures of thermal tolerance. In Encyclopedia of Fish Physiology: From Genome to Environment; Farrell, A.P., Ed.; Elsevier Inc: Amsterdam, The Netherlands, 2011; pp. 1695–1702. [Google Scholar]
  11. Dell, A.I.; Pawar, S.; Savage, V.M. Temperature dependence of trophic interactions are driven by asymmetry of species responses and foraging strategy. J. Anim. Ecol. 2014, 83, 70–84. [Google Scholar] [CrossRef] [PubMed]
  12. Ormerod, S.J. Climate change, river conservation and the adaptation challenge. Aquat. Conserv. Mar. Freshw. Ecosyst. 2009, 19, 609–613. [Google Scholar] [CrossRef]
  13. Ficklin, D.L.; Robeson, S.M.; Knouft, J.H. Impacts of recent climate change on trends in baseflow and stormflow in United States watersheds. Geophys. Res. Lett. 2016, 43, 5079–5088. [Google Scholar] [CrossRef]
  14. Knouft, J.H.; Ficklin, D.L. The potential impacts of climate change on biodiversity in flowing freshwater systems. Annu. Rev. Ecol. Evol. Syst. 2017, 48, 111–133. [Google Scholar] [CrossRef]
  15. Ficklin, D.L.; Abatzoglou, J.T.; Robeson, S.M.; Null, S.E.; Knouft, J.H. Natural and managed watersheds show similar responses to recent climate change. Proc. Natl. Acad. Sci. USA 2018, 115, 8553–8557. [Google Scholar] [CrossRef] [Green Version]
  16. Salerno, F. Adaptation strategies for water resources: Criteria for research. Water 2017, 9, 805. [Google Scholar] [CrossRef] [Green Version]
  17. Krosby, M.; Theobald, D.M.; Norheim, R.; McRae, B.H. Identifying riparian climate corridors to inform climate adaptation planning. PLoS ONE 2018, 13, e0205156. [Google Scholar] [CrossRef]
  18. Sweeney, B.W.; Newbold, J.D. Streamside forest buffer width needed to protect stream water quality, habitat, and organisms: A literature review. J. Am. Water Resour. Assoc. 2014, 50, 560–584. [Google Scholar] [CrossRef]
  19. Broadmeadow, S.B.; Jones, J.G.; Langford, T.E.L.; Shaw, P.J.; Nisbet, T.R. The influence of riparian shade on lowland stream water temperatures in southern England and their viability for brown trout. River Res. Appl. 2011, 27, 226–237. [Google Scholar] [CrossRef]
  20. Weller, D.E.; Baker, M.E.; Jordan, T.E. Effects of riparian buffers on nitrate concentrations in watershed discharges: New models and management implications. Ecol. Appl. 2011, 21, 1679–1695. [Google Scholar] [CrossRef] [PubMed]
  21. Wu, C.; Herrington, S.J.; Charry, B.; Chu, M.L.; Knouft, J.H. Assessing the potential of riparian reforestation to facilitate watershed climate adaptation. J. Environ. Manag. 2021, 277, 111431. [Google Scholar] [CrossRef] [PubMed]
  22. Sweeney, B.W. Streamside forests and their physical, chemical and trophic characteristics of Piedmont streams in eastern North America. Water Sci. Technol. 1992, 26, 2653–2673. [Google Scholar] [CrossRef]
  23. Thomas, S.M.; Griffiths, S.W.; Ormerod, S.J. Beyond cool: Adapting upland streams for climate change using riparian woodlands. Glob. Chang. Biol. 2016, 22, 310–324. [Google Scholar] [CrossRef] [PubMed] [Green Version]
  24. Arnell, N.W.; Gosling, S.N. The impacts of climate change on river flow regimes at the global scale. J. Hydrol. 2013, 486, 351–364. [Google Scholar] [CrossRef]
  25. Cousino, L.K.; Becker, R.H.; Zmijewski, K.A. Modeling the effects of climate change on water, sediment, and nutrient yields from the Maumee River watershed. J. Hydrol. Reg. Stud. 2015, 4, 762–775. [Google Scholar] [CrossRef]
  26. National Climate Data Center. Available online: https://www.ncdc.noaa.gov/cdo-web/ (accessed on 1 September 2020).
  27. Homer, C.G.; Dewitz, J.A.; Yang, L.; Jin, S.; Danielson, P.; Xian, G.; Coulston, J.; Herold, N.D.; Wickham, J.D.; Megown, K. Completion of the 2011 National Land Cover Database for the conterminous United States-Representing a decade of land cover change information. Photogramm. Eng. Rem. Sens. 2015, 81, 345–354. [Google Scholar]
  28. The Nature Conservancy (TNC). Meramec River Conservation Action Plan; The Nature Conservancy, Missouri Chapter: St. Louis, MO, USA, 2014. [Google Scholar]
  29. Knouft, J.H.; Chu, M.L. Using watershed-scale hydrological models to predict the impacts of increasing urbanization on freshwater fish assemblages. Ecohydrology 2015, 8, 273–285. [Google Scholar] [CrossRef]
  30. Krause, K.P.; Wu, C.; Chu, M.L.; Knouft, J.H. Fish assemblage-environment relationships suggest differential trophic responses to heavy metal contamination. Freshw. Biol. 2019, 64, 632–642. [Google Scholar] [CrossRef]
  31. Arnold, J.G.; Srinivasan, R.; Muttiah, R.S.; Williams, J.R. Large area hydrologic modeling and assessment part I: Model development. J. Am. Water Resour. Assoc. 1998, 34, 73–89. [Google Scholar] [CrossRef]
  32. Neitsch, S.L.; Arnold, J.G.; Kiniry, J.R.; Williams, J.R.; King, K.W. Soil and Water Assessment Tool: Theoretical Documentation; Version 2000; Grassland, Soil and Water Research Laboratory, Agricultural Research Service: Temple, TX, USA, 2002. [Google Scholar]
  33. Ficklin, D.L.; Luo, Y.; Stewart, I.T.; Maurer, E.P. Development and application of a hydroclimatological stream temperature model within the Soil and Water Assessment Tool. Water Resour. Res. 2012, 48, W01511. [Google Scholar] [CrossRef] [Green Version]
  34. Abbaspour, K.C.; Yang, J.; Maximov, I.; Siber, R.; Bogner, K.; Mieleitner, J.; Zobrist, J.; Srinivasan, R. Modelling hydrology and water quality in the pre-alpine/alpine Thur watershed using SWAT. J. Hydrol. 2007, 333, 413–430. [Google Scholar] [CrossRef]
  35. Vrugt, J.A.; Robinson, B.A. Improved evolutionary optimization from genetically adaptive multimethod search. Proc. Natl. Acad. Sci. USA 2007, 104, 708–711. [Google Scholar] [CrossRef] [PubMed] [Green Version]
  36. Deb, K.; Pratap, A.; Agarwal, S.; Meyarivan, T.A.M.T. A fast and elitist multi-objective genetic algorithm: NSGA-II. IEEE Trans. Evol. Comput. 2002, 6, 182–197. [Google Scholar] [CrossRef] [Green Version]
  37. Eberhart, R.C.; Shi, Y.; Kennedy, J. Swarm Intelligence; Elsevier: San Mateo, CA, USA, 2001. [Google Scholar]
  38. Haario, H.; Saksman, E.; Tamminen, J. An adaptive Metropolis algorithm. Bernoulli 2001, 7, 223–242. [Google Scholar] [CrossRef] [Green Version]
  39. Storn, R.; Price, K. Differential evolution—A simple and efficient heuristic for global optimization over continuous spaces. J. Glob. Optim. 1997, 11, 341–359. [Google Scholar] [CrossRef]
  40. Legates, D.R.; McCabe, G.J., Jr. Evaluating the use of “goodness-of-fit” measures in hydrologic and hydroclimatic model validation. Water Resour. Res. 1999, 35, 233–241. [Google Scholar] [CrossRef]
  41. Nash, J.E.; Sutcliffe, J.V. River flow forecasting through conceptual models, Part I—A discussion of principles. J. Hydrol. 1970, 10, 282–290. [Google Scholar] [CrossRef]
  42. Taylor, K.E.; Stouffer, R.J.; Meehl, G.A. An overview of the CMIP5 and the experiment design. Bull. Am. Meteorol. Soc. 2012, 93, 485–498. [Google Scholar] [CrossRef] [Green Version]
  43. Wood, A.W.; Leung, L.R.; Sridhar, V.; Lettenmaier, D.P. Hydrologic implications of dynamical and statistical approaches to downscaling climate model outputs. Clim. Chang. 2004, 62, 189–216. [Google Scholar] [CrossRef]
  44. Reclamation. Downscaled CMIP3 and CMIP5 Climate Projections: Release of Downscaled CMIP5 Climate Projections, Comparison with Preceding Information, and Summary of User Needs, Downscaled CMIP3 and CMIP5 Climate and Hydrology Projections, US Department of the Interior, Bureau of Reclamation; Technical Service Center: Denver, CO, USA, 2013; p. 47. [Google Scholar]
  45. Reclamation. Downscaled CMIP3 and CMIP5 Climate and Hydrology Projections: Release of Hydrology Projections, Comparison with preceding Information, and Summary of User Needs, prepared by the US Department of the Interior, Bureau of Reclamation; Technical Service Center: Denver, CO, USA, 2014; p. 110. [Google Scholar]
  46. Theurer, F.D.; Voos, K.A.; Miller, W.J. Instream Water Temperature Model Instream Flow Information Paper 16; U.S. Fish and Wildlife Service: Washington, DC, USA, 1984.
  47. Theurer, F.D.; Voos, K.A.; Miller, W.J. Instream Water Temperature Model Part II Physical Processes and Math Models; U.S. Fish and Wildlife Service: Washington, DC, USA, 1984; p. 86.
  48. Bartholow, J.M. Stream Temperature Investigations—Field and Analytical Methods Instream Flow Information Paper 13; Biological Report; U.S. Fish and Wildlife Service: Washington, DC, USA, 1989; Volume 89, p. 139.
  49. Bartholow, J.M. A modeling assessment of the thermal regime for an urban sport fishery. Environ. Manag. 1991, 15, 833–845. [Google Scholar] [CrossRef]
  50. Google. Landsat/Copernicus, Maxer Technologies, U.S. Geological Survey, USDA Farm Service Agency. 2020. Available online: https://www.google.com/maps/ (accessed on 23 October 2020).
  51. NOAA. Comparative Climatic Data. 2020. Available online: https://www.ncdc.noaa.gov/ghcn/comparative-climatic-data (accessed on 15 October 2020).
  52. Harvey, B.C.; Cashner, R.C.; Matthews, W.J. Differential effects of Largemouth and Smallmouth Bass on habitat use by Stoneroller minnows in stream pools. J. Fish Biol. 1988, 33, 481–487. [Google Scholar] [CrossRef]
  53. Jackson, D.A. Ecological effects of Micropterus introductions: The dark side of black bass. In Black Bass: Ecology, Conservation and Management; Phillip, D.P., Ridgeway, M.S., Eds.; American Fisheries Society Symposium: Bethesda, MD, USA, 2002; p. 724. [Google Scholar]
  54. Pflieger, W.L. The Fishes of Missouri; Missouri Department of Conservation: Jefferson City, MO, USA, 1997.
  55. Whitledge, G.W.; Hayward, R.; Zweifel, R.D.; Rabeni, C.F. Development and laboratory evaluation of a bioenergetics model for subadult and adult Smallmouth Bass. Trans. Am. Fish. Soc. 2003, 132, 316–325. [Google Scholar] [CrossRef]
  56. Whitledge, G.W.; Rabeni, C.F.; Annis, G.; Sowa, S.P. Riparian shading and groundwater enhance growth potential for Smallmouth Bass in Ozark streams. Ecol. Appl. 2006, 16, 1461–1473. [Google Scholar] [CrossRef] [Green Version]
  57. Kaushal, S.S.; Likens, G.E.; Jaworski, N.A.; Pace, M.L.; Sides, A.M.; Seekell, D.; Belt, K.T.; Secor, D.H.; Wingate, R.L. Rising stream and river temperatures in the United States. Front. Ecol. Environ. 2010, 8, 461–466. [Google Scholar] [CrossRef]
  58. Pohle, I.; Helliwell, R.; Aube, C.; Gibbs, S.; Spencer, M.; Spezia, L. Citizen science evidence from the past century shows that Scottish rivers are warming. Sci. Total. Environ. 2019, 659, 53–65. [Google Scholar] [CrossRef] [PubMed]
  59. Haddaway, N.R.; Brown, C.; Eales, J.; Eggers, S.; Josefsson, J.; Kronvang, B.; Randall, N.P.; Uusi-Kämppä, J. The multifunctional roles of vegetated strips around and within agricultural fields. Environ. Evid. 2018, 7, 14. [Google Scholar] [CrossRef] [Green Version]
  60. Stutter, M.; Kronvang, B.; Huallacháin, D.Ó.; Rozemeijer, J. Current insights into the effectiveness of riparian management, attainment of multiple benefits, and potential technical enhancements. J. Environ. Qual. 2019, 48, 236–247. [Google Scholar] [CrossRef] [Green Version]
  61. Pagliaro, M.D.; Knouft, J.H. Differential effects of the urban heat island on thermal responses of freshwater fishes from unmanaged and managed systems. Sci. Total. Environ. 2020, 723, e138084. [Google Scholar] [CrossRef]
  62. Roni, P. Does river restoration increase fish abundance and survival or concentrate fish? The effects of project scale, location, and fish life history. Fisheries 2019, 44, 8–19. [Google Scholar] [CrossRef] [Green Version]
  63. Gowan, C.; Fausch, K.D. Mobile Brook Trout in two high elevation Colorado streams: Re-evaluating the concept of restricted movement. Can. J. Fish. Aquat. Sci. 1996, 53, 1370–1381. [Google Scholar] [CrossRef]
  64. White, S.L.; Gowan, C.; Fausch, K.D.; Harris, J.G.; Saunders, W.C. Response of trout populations in five Colorado streams two decades after habitat manipulation. Can. J. Fish. Aquat. Sci. 2011, 68, 2057–2063. [Google Scholar] [CrossRef]
  65. Schmutz, S.; Jurajda, P.; Kaufmann, S.; Lorenz, A.W.; Muhar, S.; Paillex, A.; Poppe, M.; Wolter, C. Response of fish assemblages to hydromorphological restoration in central and northern European rivers. Hydrobiologia 2016, 769, 49–60. [Google Scholar] [CrossRef] [Green Version]
  66. Roni, P.; Hanson, K.; Beechie, T. Global review of the physical and biological effectiveness of stream habitat rehabilitation techniques. N. Am. J. Fish Manag. 2008, 28, 856–890. [Google Scholar] [CrossRef]
  67. Higgins, J.; Zablocki, J.; Newsock, A.; Krolopp, A.; Tabas, P.; Salama, M. Durable freshwater protection: A framework for establishing and maintaining long-term protection for freshwater ecosystems and the values they sustain. Sustainability 2021, in press. [Google Scholar]
  68. Cole, L.J.; Stockan, J.; Helliwell, R. Managing riparian buffer strips to optimise ecosystem services: A review. Agric. Ecosyst. Environ. 2020, 296, 106891. [Google Scholar] [CrossRef]
  69. Grizzetti, B.; Liquete, C.; Pistocchi, A.; Vigiak, O.; Zulian, G.; Bouraoui, F.; De Roo, A.; Cardoso, A.C. Relationship between ecological condition and ecosystem services in European rivers, lakes and coastal waters. Sci. Total. Environ. 2019, 671, 452–465. [Google Scholar] [CrossRef] [PubMed]
  70. Abell, R.; Vigerstol, K.; Higgins, J.; Kang, S.T.; Karres, N.; Lehner, B.; Sridhar, A.; Chapin, E. Freshwater biodiversity conservation through source water protection: Quantifying the potential and addressing the challenges. Aquat. Conserv. Mar. Freshw. Ecosyst. 2019, 29, 1022–1038. [Google Scholar] [CrossRef] [Green Version]
Figure 1. Location of the Meramec River Basin including United States Geological Survey (USGS) streamflow gauge stations, water temperature sensors, and the Flat River.
Sustainability 13 01877 g001
Figure 2. Diagram of the Stream Network Temperature Model (SNTEMP) nodes.
Sustainability 13 01877 g002
Figure 3. (A) Observed and simulated streamflow at USGS streamflow gauge in Richwood, Missouri. (B) Observed and simulated water temperature in the middle section of the Flat River.
Sustainability 13 01877 g003
Figure 4. Percent change in streamflow during the summer (June–August) based on climate change and riparian reforestation projections. (A) average percent change in streamflow between the periods of 2030–2033 and 2000–2003; (B) average percent change in streamflow between the periods of 2060–2063 and 2000–2003; (C) average percent change in streamflow between the periods of 2030–2033 and 2000–2003 when the riparian zone was fully reforested; (D) average percent change in streamflow between the periods of 2060–2063 and 2000–2003 when the riparian zone was fully reforested.
Sustainability 13 01877 g004
Figure 5. Changes in stream temperature during the summer (June–August) based on climate change and riparian reforestation projections. (A) average change in water temperature between the periods of 2030–2033 and 2000–2003; (B) average change in water temperature between the periods of 2060–2063 and 2000–2003; (C) average change in water temperature between the periods of 2030–2033 and 2000–2003 when the riparian zone was fully reforested; (D) average change in water temperature between the periods of 2060–2063 and 2000–2003 when the riparian zone was fully reforested.
Sustainability 13 01877 g005
Figure 6. Daily water temperature at the outlet of the Flat River from 1 June to 31 August under selected GCM’s and riparian buffer conditions as estimated by SNTEMP.
Sustainability 13 01877 g006
Table 1. Soil and Water Assessment Tool (SWAT) calibrated parameters and their final values for the Meramec River Basin. * Parameter value is multiplied by (1 + the fitted value).
SWAT Calibration ParameterInitial Value RangeFinal Fitted Value
CN2 *−0.4–0.20.155
ALPHA_BNK0–10.799
CH_N2−0.01–0.10.012
CH_K2−0.01–10038.890
SOL_BD *−0.4–0.40.011
SOL_AWC *−0.5–0.2−0.036
SOL_K *−0.5–0.50.188
GWQMN0–1000357.860
GW_DELAY0–300182.894
RCHRG_DP0–10.959
ALPHA_BF0–10.881
SFTMP−10–10−2.764
SMTMP−10–10−3.112
ESCO0–10.759
EPCO0–10.251
CANMX0–10050.303
SLSUBBSN10–150105.526
LAT_TTIME0–18021.524
SLSOIL1–15047.512
HRU_SLP0–0.20.081
OV_N0.01–156.334
α0.1–1.11.100
β0.1–1.10.100
K0.0–0.10.095
Lag0–147.000
CN2: SCS runoff curve number; ALPHA_BNK: baseflow alpha factor for bank storage (days); CH_N2: Manning’s coefficient (n) for the main channel; CH_K2: Effective hydraulic conductivity in main channel alluvium (mm/hr); SOL_BD: Moist bulk density (mg/m3); SOL_AWC: Available water capacity of the soil layer (mm); SOL_K: Saturated hydraulic conductivity (mm/hr); GWQMN: Threshold depth of water in the shallow aquifer required for return flow to occur (mm); GW_DELAY: Groundwater delay time (days); RCHRG_DP: Deep aquifer percolation fraction; ALPHA_BF: Baseflow alpha factor (1/days); SFTMP: Snowfall temperature (°C); SMTMP: Snow melt base temperature (°C); ESCO: Soil evaporation compensation factor; EPCO: Plant uptake compensation factor; CANMX: Maximum amount of water that can be trapped in the canopy when the canopy is fully developed (mm); SLSUBBSN: Slope length (m); LAT_TTIME: Lateral flow travel time (days); SLSOIL: Slope length for lateral subsurface flow (m); HRU_SLP: Average slope of the subbasin (m/m); OV_N: Manning’s “n” value for overland flow; α: Coefficeint influencing snow melt temperature contributions; β: Coefficient influencing groundwater temperature contributions; K: Bulk coefficient of heat transfer (1/h); Lag: Average air temperature lag (days).
Table 2. SNTEMP nodes, distance from outlet, and shade characteristics.
Node NameDistance from OutletVegetation Properties
Node 0—Inlet3.4 kmForested riparian buffer
Node 10.84 kmNo riparian vegetation
Node 2Outlet
Table 3. Riparian land use conditions applied in SNTEMP.
LANDUSEDESCRIPTIONNODES INCLUDED
CURRENT CONDITIONRiparian buffer coverage = 75% forested vegetation.Node 0, Node 1, Node 2
BUFFER EXPANSIONRiparian buffer coverage = 100% forested vegetation.Node 0, Node 2
Table 4. Simulated scenarios applied in SNTEMP from 1 June–31 August of scenario year. * Simulations were conducted from 1 June to 31 August each year within each period.
SCENARIOLAND USEGCMPERIOD *
1Current ConditionMRI-CGCM3-RCP2.62000–2003
2Current ConditionMRI-CGCM3-RCP2.62030–2033
3Current ConditionMRI-CGCM3-RCP2.62060–2063
4Current ConditionCCSM4-RCP4.52000–2003
5Current ConditionCCSM4-RCP4.52030–2033
6Current ConditionCCSM4-RCP4.52060–2063
7Current ConditionMIROC-ESM-RCP8.52000–2003
8Current ConditionMIROC-ESM-RCP8.52030–2033
9Current ConditionMIROC-ESM-RCP8.52060–2063
10Buffer ExpansionMRI-CGCM3-RCP2.62000–2003
11Buffer ExpansionMRI-CGCM3-RCP2.62030–2033
12Buffer ExpansionMRI-CGCM3-RCP2.62060–2063
13Buffer ExpansionCCSM4-RCP4.52000–2003
14Buffer ExpansionCCSM4-RCP4.52030–2033
15Buffer ExpansionCCSM4-RCP4.52060–2063
16Buffer ExpansionMIROC-ESM-RCP8.52000–2003
17Buffer ExpansionMIROC-ESM-RCP8.52030–2033
18Buffer ExpansionMIROC-ESM-RCP8.52060–2063
Table 5. Comparisons of mean, the coefficient of determination (R2), and Nash-Sutcliffe coefficient (NSE) for streamflow at the USGS gauges located in the Meramec River Basin for the calibration and validation periods.
Calibration (1995–2004)Validation (2005–2014)
MeanR2NSEMeanR2NSE
StationObserved (m3/s)Simulated (m3/s)Observed (m3/s)Simulated (m3/s)
Byrnesville22.9426.610.520.4924.4226.210.640.63
Richwoods19.9221.620.590.5720.3321.240.620.61
Irondale4.844.480.490.475.724.970.340.32
Union20.0717.090.540.5121.3316.190.560.50
High Gate4.092.840.440.343.952.910.460.36
Eureka94.3294.370.630.6398.1395.590.620.62
Sullivan34.8036.170.580.5436.5141.680.630.62
Steelville16.5718.280.520.5117.7922.600.590.57
Table 6. Comparisons of mean, the coefficient of determination (R2), and Nash-Sutcliffe coefficient (NSE) for the observed and simulated water temperatures in the Meramec River Basin for the calibration and validation periods.
Calibration (15 November 2017–19 July 2018)Validation (20 July 2018–19 November 2018)
MeanR2NSEMeanR2NSE
StationObserved (°C)Simulated (°C)Observed (°C)Simulated (°C)
LaBarque Creek11.0510.910.820.7615.6813.930.950.94
Red Oak Creek12.4711.650.930.9219.4318.450.900.84
Spring Creek12.0011.920.93−1.4717.1418.650.93−8.03
Boone Creek12.4811.130.870.8118.8017.690.710.42
Brush Creek12.4311.670.940.9319.3418.900.950.93
Clear Creek12.9111.770.920.9019.7419.180.950.91
Fourche A Renault10.9011.420.900.6119.4718.490.95−0.44
Whittenburg Creek12.2112.310.85−1.7415.6119.470.92−4.64
Terre Bleue Creek12.5311.140.960.9319.0518.400.960.93
Flat River14.1011.310.930.5719.6818.380.930.59
Dry Fork12.9511.390.910.8218.7618.920.910.83
Big River12.2711.590.950.6818.7418.680.960.46
Curtois Creek10.3710.050.800.3619.9118.400.940.72
Meramec River12.7411.690.970.9320.2418.430.970.75
Huzzah Creek11.8812.080.960.7718.5018.580.980.49
Table 7. Average of mean daily water temperatures (°C) estimated by SNTEMP.
Average of Mean Daily Water Temperature (°C)
2000–20032030–20332060–2063
Current ConditionBuffer ExpansionCurrent ConditionBuffer ExpansionCurrent ConditionBuffer Expansion
MRI-CGCM3-RCP2.622.621.723.021.923.522.2
CCSM4-RCP4.523.522.324.323.424.923.9
MIROC-ESM-RCP8.523.422.124.823.826.926.0
Table 8. Average number of days per year that water temperature at the outlet exceeded 27 °C as estimate by SNTEMP. Percentages are calculated as the number of days with a maximum water temperature exceeding 27 °C divided by the total number of days (N = 92) in the study period.
2000–20032030–20332060–2063
Current ConditionBuffer ExpansionCurrent ConditionBuffer ExpansionCurrent ConditionBuffer Expansion
MRI-CGCM3-RCP2.636.86.031.75.344.38.0
(40.0%)(6.5%)(34.5%)(5.8%)(48.2%)(8.7%)
CCSM4-RCP4.545.28.261.712.869.825.3
(49.1%)(8.9%%)(67.1%)(13.9%)(75.9%)(27.5%)
MIROC-ESM-RCP8.536.81.769.013.786.559.3
(40.0%)(1.8%)(75.0%)(14.9%)(94.0%)(64.5%)
Publisher’s Note: MDPI stays neutral with regard to jurisdictional claims in published maps and institutional affiliations.

