Abstract
Irrigated agriculture determines large blue water withdrawals, and it is considered a key intervention area to reach sustainable development objectives. Precision agriculture technologies have the potential to mitigate water resource depletion that often characterises conventional agricultural approaches. This study investigates the factors influencing farmers’ intentions to adopt variable rate irrigation (VRI) technology. The Technology Acceptance Model 3 (TAM-3) was employed as a theoretical framework to design a survey to identify the factors influencing farmers’ decision-making process when adopting VRI. Data were gathered through quantitative face-to-face interviews with a sample of 138 fruit and grapevine producers from the Northeast of Italy (Veneto, Emilia-Romagna, Trentino-Alto Adige, Friuli-Venezia Giulia). Data were analysed using partial least squares path modelling (PLS-PM). The results highlight that personal attitudes, such as perceived usefulness and subjective norm, positively influence the intention to adopt VRI. Additionally, the perceived ease of use positively affects intention, but it is moderated by subject experience.
1. Introduction
Irrigated agriculture can be considered a key element in reaching sustainable development objectives since approximately 70% of water worldwide is used for agriculture [1]. During the last century, impacts of irrigation have been of pivotal importance, and not just in terms of agricultural development. They have embraced relevant rural developments while transforming the health and the entire way of life in rural areas [2]. Today, irrigated agriculture must cope with several threats and challenges such as water scarcity, mitigation of negative environmental impacts associated with conventional agriculture, climate change effects [3], and groundwater bodies’ deterioration [4,5,6]. In this context, site-specific approaches associated with improvements in the operation and management of irrigation and fertigation practices can represent feasible solutions.
Among the various approaches, variable rate irrigation technology (VRI) is a branch of precision agriculture (PA) that allows better control of the water used in irrigation systems, improves resource management and control, and increases water use efficiency. This approach is essentially based on collecting information on crop water need, analysing data to produce irrigation prescription maps, and precisely applying water to the soil. For instance, the detection of spatial variability in soil and crops’ hydrological characteristics can be conducted using proximal and remote sensing technologies [7]. The spatial data can be managed through Geographical Information Systems (GIS) to obtain homogeneous management zones for applying a dedicated irrigation schedule [8]. Finally, VRI is applied thanks to irrigation systems able to distribute water to the management zones, and this may take the form of pivot, sprinkler, or drip irrigation, depending on the type of crop.
Very few contributions have documented water conservation strategies using VRI, particularly in viticulture. Ortuani et al. [9] experimented a VR drip irrigation in Northern Italy, achieving a reduction in water usage by 18% compared to the farmer’s habits and a more homogeneous grape maturation, without affecting yield and product quality. Balafoutis et al. [10] experienced a VRI coupled with a VR fertiliser application in North-eastern Greece that reduced grape carbon footprint. Klein et al. [11] presented a fully automated large-scale closed-loop VR drip irrigation system in California, resulting in a 26% yield increase in the second year and an average increase of 16% in water use efficiency.
Although currently underutilised, VRI technology has the potential to positively impact water use efficiency, water, and energy conservation, with positive effects on the environment. Thus, there is a critical need to develop fully integrated VRI technology systems to mitigate water scarcity and negative environmental impacts associated with conventional agriculture, as well as climate change effects.
Among existing adoption barriers, Evans et al. [12] hinted at high technology marginal costs, poor economic incentives, limited research support to growers and lack of know-how, particularly regarding data analysis. Rather than focusing on the most common objective factors influencing technology adoption, such as monetary costs and benefits, this study aimed to understand what factors affect growers’ intention to adopt a VRI approach to irrigate their orchards and vineyards. The goal is to highlight those behavioural aspects that can be addressed by political, technical and peer-to-peer mediation to facilitate PA uptake.
The behavioural aspect is especially important for adopting new technologies [13]. Therefore, firstly, we considered a theoretical model of the growers’ behaviour. A relevant body of research has addressed the examination of factors affecting information technology acceptance, laying its foundation in the technology acceptance model (TAM), initially developed by Davis [14] to explain computer-usage behaviour. Several models and theories have been discussed in the field of information technology acceptance, such as the theory of planned behaviour (TPB) [15], the diffusion of innovation (DOI) theory [16,17], and the unified theory of acceptance and use of technology (UTAUT) [18] but, apparently, TAM still is the dominant model for investigating factors affecting users’ acceptance of novel technical systems [19,20].
TAM is based on the theory of reasoned action (TRA) proposed by Fishbein and Ajzen [21], who demonstrated that the behaviour is best predicted by intentions determined both by the person’s attitude and subjective norms concerning the behaviour. In its earlier version, TAM states that two particular beliefs, the Perceived Ease of Use and the Perceived Usefulness, referring, respectively, to the degree to which the user expects the technology to be free of effort, and the prospective user’s subjective probability to use the technology, will increase their job performance. An expanded version of the model, TAM2 [22], was developed by introducing new determinants for the Perceived Usefulness and two moderators (Experience and Voluntariness). Finally, the latest version, TAM-3 [23], also includes a list of determinants for the Perceived Ease of Use. Determinants play the role of external variables influencing individual perceptions that, in turn, determine behaviours. The intention to adopt a certain technology was included within the construct Attitude toward Use. Figure 1 concisely illustrates TAM-3, considering both Davis [14] and Venkatesh and Bala’s [23] contributions.
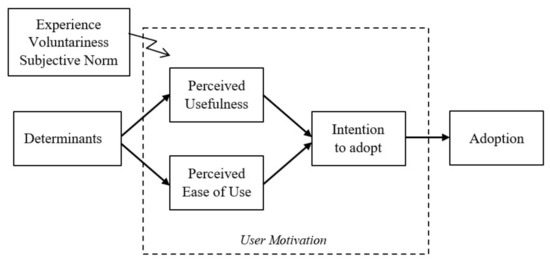
Figure 1.
A concise illustration of Technology Acceptance Model 3 (TAM-3).
Thus, in this study, we assume that the intention to adopt VRI is affected by perceptions and attitudes regarding the technology and the social context. The TAM-3 constructs were operationalised through a set of Likert scales, and the empirical data necessary to test the strength of the relationships between constructs were collected using a questionnaire-based survey.
The data collection was conducted in the Northeast of Italy. This area includes the region of Friuli Venezia Giulia, Veneto, Trentino Alto Adige, and part of the Emilia-Romagna region, and it is considered one of the most productive areas in Europe regarding food production. Among the most famous products that characterise this area, it is worth mentioning Prosecco (a DOC (Denominazione di origine controllata: Italian certification for controlled designation of origin) or DOCG (Denominazione di origine controllata e garantita) is intended to be a superior classification to DOC) white wine produced in a large area spanning nine provinces in the Veneto and Friuli Venezia Giulia regions), and the South Tyrolean PGI (Protected geographical indication) is a EU scheme of geographical indications and traditional specialties) Apple produced in Trentino Alto Adige. Fruit growing is one of the most important agricultural activities in Emilia-Romagna, a region that is considered Italy’s main orchard. This wide area was affected in the summer of 2017 by a severe drought, and this negative contingency could make VRI technology of interest to those farmers who found it necessary to mitigate the problem of water scarcity.
The study is organised as follows. In Section 2, the methodological framework is described, specifying the determinants of the intention to adopt VRI technology, the underlying hypotheses, as well as the constructs measurement method; thus, the method adopted to administrate the questionnaire to collect data from growers is described, and data analysis conducted using partial least square path modelling (PLS-PM) is explained. The growers’ sample description is reported in Section 2.4. Section 3 and Section 4 report research results and discussion. Section 5 concludes the study, with recommendations for PA stakeholders and policy-makers.
2. Materials and Methods
2.1. Theoretical Framework and Construct Operationalisation
Following the TAM-3 theoretical model, we set the construct “Intention to adopt VRI” (INT) as the dependent variable; its value is affected by two endogenous constructs, Perceived Ease of Use (PEU) and the Perceived Usefulness (PUF), and the exogenous construct Subjective Norms (SN) and a series of interaction variables. Several external variables were chosen in line with Venkatesh and Bala [23] as potential direct or indirect determinants of the PEU and PUF constructs, as reported in Table 1. Each variable was defined by a set of items (typically 3 or 4) included in the structured questionnaire that has been pre-tested in November 2017 with 15 growers. The final version of the items used in the survey is reported in the Appendix A. In considering the variables of the TAM-3 model, we decided to exclude the endogenous construct Objective Usability (OU), defined as a “comparison of systems based on the actual level (rather than perceptions) of effort required to completing specific tasks” [24]. The reason is that we perceived such adjustment not easily applicable in the context of VRI technology; the pre-test confirmed this hypothesis: growers had no sufficient background to judge any actual level of effort required to use VRI, having no experience in any of the technology and equipment which define VRI. Therefore, including OU would have led to misrepresentation. Table 1 shows the TAM-3 version with the set of variables adopted in this study.

Table 1.
TAM-3 hypotheses and paths.
2.2. Survey Procedure
The requirements to join the survey were that growers were responsible for decision-making in their farm and still have not adopted VRI technology. The final questionnaire was structured in three parts: (1) intention to adopt VRI technology and attitudes toward novel technology, (2) grower demographics, and (3) main farm production and economic characteristics, with single- and multiple-choice questions. In part (1), respondents were asked to give their opinion about statements related to TAM-3 variables according to a 7-point Likert-like scale, ranging from 1 (totally disagree) to 7 (totally agree). These items were presented in a randomised order to avoid order bias. Prior to part (1), general information about PA and VRI was provided. At first, participants were told the following:
“Precision agriculture is a farming approach for agronomic interventions that considers the actual needs of the crop and soil characteristics so that it can calibrate the application of nutrients within the field. In this way, it can lead to environmental and economic benefits”.
Then, specific information about VRI technology features was provided in order to make the participants aware of VRI potentials and benefits, with the following:
“Variable Rate Irrigation is a site-specific/plant-specific approach regarding better water management. Irrigation water can be applied when and where it is needed, resulting in increased water efficiency. It combines several precision agriculture tools that enable a centralised water use control. Variable Rate Irrigation allows growers to apply water at different time rates, based on specific crop needs.”
In addition, to help participants better understand VRI, a picture describing the use of an irrigation-management software was shown to them and explained. The questionnaire was through face-to-face interviews with a sample of grape and fruit growers in the Northeast of Italy. Surveys were administered with fruit and grape growers during the “FuturPera” Agricultural fair (16–18 November 2017, Ferrara, Italy). In a second moment, participants were asked to fill out an online survey until February 2018. The sampling procedure was enriched by a snowballing sample procedure, with some new participants suggested by whom we met at the fair.
2.3. Data Analysis
Data from the questionnaire related to TAM-3 variables were processed adopting a partial-least square path modelling (PLS-PM) approach [25] based on the statistical package “plspm” available in R [26]. PLS-PM is a multivariate technique used to test path dependence models and estimate the model parameters that minimise the dependent variables’ residual variance [27]. In PLS-PM, constructs are estimated as a linear combination of their items through simple regression. The adopted algorithm follows a sequential procedure that can be divided into three stages: (1) calculating the weights to compute variable scores based on constructs’ items, (2) estimating the path coefficients (inner model) through least-squares regressions, and (3) obtaining the path loadings by means of simple correlations (outer model).
Path modelling applied to our data allows us to measure how much each factor could influence the decision to adopt the VRI technology. Moderating effects of Experience (EXP) and Voluntariness (VOL) as described in Table 1 were considered using the Product Indicator approach [26], i.e., adding new constructs in the form of product-indicators of the new latent variables. To have an idea, the new items related variable PEU*EXP resulted from the product between the two items of PEU and the three items of EXP; in general, for each moderated construct, n*k additional items were obtained from the product between the n items of the moderator variable with the k items of the latent variable.
The reliability of the PLS-PM model was evaluated in terms of constructs’ internal and external consistency. Internal consistency was checked using Cronbach’s alpha and the Dillon-Goldstein’s rho statistics [26,28], while the external consistency was checked by evaluating items’ loadings, calculated as correlations between the latent variable and its items [26,28].
2.4. Sample Description
In total, 138 participants completed the survey. The net response rate was around 25% and the completion rate was around 10%, which is reasonable in this type of survey. Seventy-one participants (51.4%) were from Emilia-Romagna, 29 (21.0%) were from Veneto, 21 (15.2%) were from Trentino Alto Adige, and 17 persons (12.3%) were from Friuli Venezia Giulia. As expected, most respondents were male (89%), with an average age of 43. The average number of years of experience working in agriculture was 21. Most respondents graduated from high school (45%), and the number of growers with a university degree was quite high (38%). The average total farm surface was 30 ha, ranging from 1 ha to 200 ha.
In terms of PA technology adoption, 34.5% of respondents declared they had already adopted at least one technology other than VRI. The adopted technologies were, in descending order: sensors monitoring humidity and temperature (62.5%), guidance technology (47.9%), automated section control (30%), monitoring technology and VR technology, both with 29.2%. The high adoption rate was surprisingly beyond expectations but, on the other hand, most of the respondents declared the use of just sensors monitoring the environment, which may be representative of the first step of a more comprehensive PA adoption process.
3. Results
3.1. Reliability and Consistency of the Model
Before examining the model result, its reliability and validity are examined. In particular, we evaluated the following three aspects: (1) internal and (2) external consistency of the model, and (3) possible similarities between latent variables. This study considered the threshold level of 0.7 to assess model adequacy based on Cronbach’s alpha and the Dillon-Goldstein’s rho statistics [26,28]. For almost all constructs (17 out of 19), Cronbach’s alpha exceeded 0.7, with the exceptions of SN (Subjective Norm, 0.65) and PEC (Perception of External Control, 0.62). For these two constructs, Cronbach’s alpha is still higher than 0.6, which can be considered acceptable for marketing research. Dillon-Goldstein’s rho is higher than 0.7 for all constructs (Table 2). These statistics indicate an overall good internal consistency of the model and the main constructs’ internal reliability.
Table 2.
Internal consistency of TAM-3 constructs.
The external consistency reflects constructs’ consistency in explaining latent variables. In this case, item loadings (>0.7) are used to evaluate convergent validity. A loading greater than 0.7 means that its latent construct captures more than 50% of the variability in an indicator. In the first run, almost all the 71 item loadings were higher than 0.7, except PEU_02 (0.69), PEU_01 (0.66), RD_01 (0.65), SN_02 and PEC_01 (both 0.64), and PEC_04 (0.46). This outcome suggested removing alarming items considered unfit. Hence, we started to remove the items with the lowest loading iteratively while checking the model’s internal and external consistency. By the end, PEC_04, SN_02, RD_01 and PEU_01 were removed from the constructs. Although we observed a slight decrease in Cronbach’s alpha for the PEC, SN, RD and PEU constructs, respectively, from 0.62 to 0.49, from 0.65 to 0.63, from 0.62 to 0.69, and from 0.60 to 0.45, Dillon-Goldstein’s rho values were still fine for the same constructs: 0.78 for PEC (same as before), 0.84 for SN (increased from 0.81), 0.86 for RD (increased from 0.80), and 0.79 for PEU (same as before). Hence, we decided to keep the model version with the highest model external consistency with almost no effects in internal construct consistency. Lastly, possible similarities between latent variables were excluded by checking items’ cross-loadings: no traitor indicators were observed.
After the quality of the measurement model is successfully assessed, the next step is to assess the quality of the structural part. This aspect was evaluated by considering a pseudo-R2 associated with the regression with the exogenous dependent variables, the goodness of fit (GoF), and the average variance extracted (AVE). The pseudo-R2 coefficients were calculated as 0.5499 for the Intention to Adopt (INT), 0.7603 for the Perceived Usefulness (PUF), and 0.5842 for the Perceived Ease of Use (PEU), indicating reasonable fit for all three. GoF was calculated as 0.6421, indicating a good fit for the whole model. All constructs’ values of AVE were above 0.5 (the least was PEC with 0.54).
As expected, Subjective Norm (SN) plays a pivotal role, both considering the direct effect (H3) and as moderated by Voluntariness (VOL) (H6) and Experience (EXP) (H5). Intention to Adopt (INT) appears to be determined by Perceived Ease of Use (PEU), only if moderated by Experience (EXP) (H4), while the total effect of Perceived Ease of Use (PEU) on Intention to Adopt (INT) appears to be not significant (H2). These results demonstrate that peers have a vital effect on producers’ intention to adopt VRI, while possible easiness of VRI would only affect producers’ intention if he/she has already experienced new technologies.
Turning to the Perceived Usefulness (PUF), the most evident determinant is Job Relevance (REL) moderated by Output Quality (OQ) (H15). Contrarily to expectations, however, Job Relevance (REL) is negatively correlated with Perceived Usefulness (PUF) (H11). The correlation between Result Demonstrability (RD) and Perceived Usefulness (PUF) was found to be positive and meaningful (H9). Less significant but still positive were the relationships with Subjective Norm (SN), both alone (H10) and moderated by Experience (EXP) (H13), and Image (IM) (H8). On the contrary, we observed a negative relationship between Perceived Usefulness (PUF) and Perceived Ease of Use (PEU) if moderated by Experience (EXP) (H14), which was found to be positive if not moderated by Experience (EXP) (H7); this suggests that with increasing experience, the influence of Perceived Ease of Use (PEU) on Perceived Usefulness (PUF) will be weaker.
3.2. Path Modelling Results
Table 3 shows the results associated with the PLS-PM model from the original sample (N = 138). Four out of six hypotheses (H1, H3, H4, and H6) in terms of factors affecting the Intention to Adopt (INT) were clearly verified.
Table 3.
PLS-PM results of TAM-3 constructs.
Regarding Perceived Ease of Use, a strong positive correlation was found with Perceived Enjoyment (ENJ) (H17). However, with increasing experience, the influence of Perceived Enjoyment (ENJ) on Perceived Ease of Use (PEU) will be significantly weaker (H23). On the contrary, Experience (EXP) positively affects the influence of Playfulness (PLY) on Perceived Ease of Use (PEU) (H22). This outcome appears reasonable: cognitive spontaneity characterising Playfulness (PLY) increases with experience, while the enjoyment aside from the technology’s performance may just affect less experienced subjects.
As expected, Anxiety (ANX) was found to negatively affect Perceived Ease of Use (PEU) (H19), with Experience (EXP) mitigating this effect (H21). A positive correlation was also observed with Perception of External Control (PEC) (H16); this confirms the theoretical hypothesis that organisational resources may favour Perceived Ease of Use (PEU). A similar effect was also observed for Self-Efficacy (SE) (H18). Surprisingly, increased levels of Playfulness (PLY) are associated with diminishing Perceived Ease of Use (PEU) (H20), albeit with a low level of significance; perhaps some growers partially perceived VRI as an amusement object, rather than something really useful. Lastly, Subjective Norm (SN) was found to significantly affect Image (IM) (H24), in line with theoretical assumptions. Figure 2 shows the TAM-3 model applied to growers’ intention to adopt VRI technology. Anxiety (ANX) in applying new technology is negatively associated with the perceived ease of use of VRI (PEU), and experience (EXP) does not mitigate such effect.
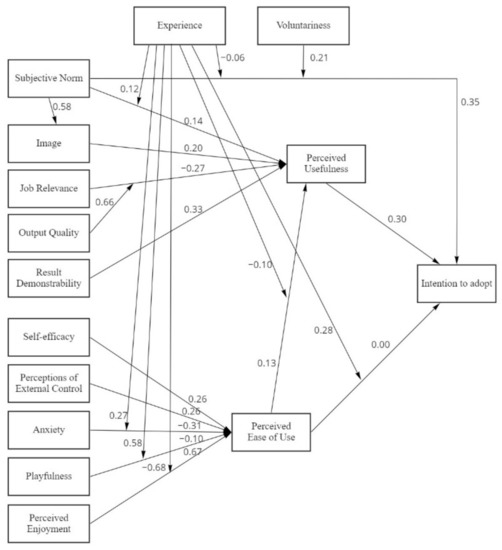
Figure 2.
Partial least squares path modelling (PLS-PM) of TAM-3 constructs.
4. Discussion
Most of the theoretical assumptions of TAM-3 were verified, but somehow subjects’ attitudes regarding VRI technology emerge with their peculiarities. The results found that Job Relevance (REL) and Output Quality (OQ) are the two important determinants of PUF, which positively affect the intention to adopt VRI.
Overall, these results are in line with other studies which have measured intentions to adopt PA. In particular, the prominent role played by the Perceived Usefulness (PUF) in the decision to adopt PA technologies was also recognised in Adrian et al. [29], in which the weak direct effect of the Perceived Ease of Use (PEU) was also acknowledged. Similar findings were also observed in Lu et al. [30]. Our findings are in accordance with Aubert et al. [31], who found that PEU and PUF lacked significant correlation. PEU does not directly affect the Intention to Adopt (INT), but it has a direct and significant effect on PUF. Therefore, the more the technology is perceived as being easy to use, the more it tends to be perceived as useful and, consequently, the intention to adopt it increases.
Going back to the analysis of TAM-3 relationships between determinants, it was found that the Perceived Enjoyment (ENJ) largely influenced the Perceived Ease of Use (PEU), in accordance with Shyu and Huang [32]. Additionally, Result Demonstrability (RD) has shown a remarkable influence on PUF.
In interpreting the effect that Job Relevance (REL) has on the Perceived Usefulness (PUF), the moderation of Output Quality (OQ*REL) must also be considered; indeed, REL is strongly affected by OQ, and, not surprisingly, the two constructs are highly correlated. Despite the apparently negative relation between REL and PUF, it is to be noted that since OQ*REL has a very high positive value, the combined effect of REL and its interaction with OQ is still positive.
Both internal controls such as Self-Efficacy (SE), which reflects the ability to use new technology, and external controls, such as expected public policies and financial and technical support, would encourage growers to adopt VRI.
The results did suggest some aspects for scholars and policymakers to consider. Researchers should better demonstrate benefits related to PA adoption. Public authorities should provide appropriate policies as well as financial and technical support to encourage producers to adopt the technology while reducing possible anxiety. Moreover, as already suggested by Evans et al. [12], there is a large need to educate government boards and bankers on the potential benefits of VRI systems. In this context, the challenge is to demonstrate that VRI will improve water management and increase farm net returns.
Lastly, as noted by several scholars in the last few years, water management improvements cannot prescind from the inclusion of measures for controlling the expansion of the irrigation area to overcome undesirable effects such as Jevon’s paradox [33,34].
5. Conclusions
To foster the adoption of this technology, and, in general, of PA technologies, in this study, we examined the factors that affect the intention to adopt VRI technology and applied the TAM-3 model to a sample of fruit and grape growers from Northeast Italy. Model items were mathematically assessed with PLS-PM. The TAM-3 model gave satisfactory outcomes and explained, to a good extent, the intention to adopt VRI technology. The findings highlight that several factors concur to determine individual attitudes and behaviours that may favour adopting this type of system. Subjective norms, perceived usefulness and perceived ease of use moderated by experience are the most important constructs for farmers when adopting new technology.
In particular, this study confirms that the Subjective Norm construct, which describes social pressure and neighbour influence, mostly affects the intention to adopt this technology. In addition, it has a remarkable effect when moderated by the subject’s voluntariness to adopt. The intention to adopt is also positively affected with the same magnitude by the Perceived Usefulness (PUF) and by the Perceived Ease of Use (PEU), only if it is moderated by Experience. The remaining constructs appear quite strong, with significant effects of TAM-3 determinants on PEU and PUF. The role of Experience is recognised with a higher emphasis on PEU determinants than PUF.
In turn, these constructs are associated with several determinants, of which it is worth mentioning job relevance and output quality, result demonstrability, and perceived enjoyment. These associations can pave the ground to numerous actions that service providers, technology suppliers, public authorities and scholars may consider to foster PA technology adoption. In particular, this study suggests that several aspects belonging to different agricultural businesses and stakeholders should be stressed to promote the adoption of VRI. PA technology providers should emphasise the relevance of VRI to growers by giving examples of farmers who successfully adopt it, have fruitful results and enjoy the technology.
Author Contributions
Conceptualization, M.C.; methodology, M.M., R.W. and S.R.; software, M.M., R.W. and S.R.; validation, M.C. and M.M.; formal analysis, M.C. and M.M.; investigation, M.M., R.W., V.X. and S.R.; resources, M.C.; data curation, M.M.; writing—original draft preparation, M.M.; writing—review and editing, M.C. and M.M.; visualization, M.M.; supervision, M.C.; project administration, M.C., R.W. and M.M.; funding acquisition, M.C. All authors have read and agreed to the published version of the manuscript.
Funding
This research was funded by the Italian Ministry of Agricultural, Food and Forestry Policies in the framework of the “ICT-AGRI2 ERA-NET”, contract number 28454/7303/15.
Institutional Review Board Statement
The study did not require ethical approval.
Informed Consent Statement
Informed consent was obtained from all subjects involved in the study.
Data Availability Statement
The data presented in this study are available on request from the corresponding author. The data are not publicly available due to privacy restrictions.
Acknowledgments
This project, “VAROS—VAriable Rate Operations for orchardS” was funded by the Ministry of Agricultural, Food and Forestry Policies (Italy), in the framework of the “ICT-AGRI2 ERA-NET”, Contract no. 28454/7303/15.
Conflicts of Interest
The authors declare no conflict of interest.
Appendix A
Table A1.
Original items used for the definition of constructs.
Table A1.
Original items used for the definition of constructs.
| Item | Definition |
|---|---|
| INT_01 | I am sure that I will use VRI in the near future |
| INT_02 | I intend to use VRI in the near future |
| INT_03 * | If significant barriers did not exist, I would use VRI in the near future |
| SN_01 | Persons who influence my decisions think I should use VRI |
| SN_02 ** | Many producers I know have already used VRI |
| SN_03 | My clients think I should use VRI |
| PUF_01 | VRI could make it easy to do my job |
| PUF_02 | VRI could increase my productivity |
| PUF_03 | VRI gives me greater control over my job |
| IM_01 | Using VRI would make me feel better than my colleagues |
| IM_02 | Using VRI could create a good image for my farm |
| IM_03 | Producers who use VRI will have more prestige than those who do not |
| REL_01 | In my job, using VRI is important |
| REL_02 | VRI could be useful for my farm |
| REL_03 | The use of VRI is relevant to my farm activities |
| OQ_01 | I consider the output of using VRI will be excellent |
| OQ_02 | Using VRI will improve the quality of my products |
| OQ_03 | Using VRI will allow me to control the quality of my products |
| RD_01 ** | The result of using VRI will be apparent to me |
| RD_02 | I believe I could communicate to others the consequences of using VRI |
| RD_03 | I believe I would have no problem explaining to others the benefits/drawbacks of using VRI |
| PEU_01 ** | VRI could be used easily |
| PEU_02 | Using VRI will not require a lot of effort |
| PEU_03 | It would be easy for me to become skilful at using VRI on the farm |
| SE_01 | I would feel comfortable using VRI on my own |
| SE_02 | I am confident in my ability to use VRI |
| SE_03 * | I am proficient in the use of a computer |
| PEC_01 | There are public policies supporting producers to use VRI |
| PEC_02 | I could receive the necessary financial support to invest in VRI |
| PEC_03 | I could receive the necessary technical support and help while I use VRI |
| PEC_04 ** | I think I would need a technical support when adopting VRI |
| ANX_01 | I get nervous when working with new technology |
| ANX_02 | Working with a computer makes me nervous |
| ANX_03 * | Computer makes me feel uneasy |
| PLY_01 | I am creative when using new technology |
| PLY_02 | I am calm when using new technology |
| PLY_03 | I am fast learning when using new technology |
| ENJ_01 | I think I might enjoy using VRI |
| ENJ_02 | Using VRI will be pleasant for me |
| ENJ_03 | Using VRI will be fun/entertaining |
| VOL_01 | My use of VRI will be voluntary |
| VOL_02 | The decision to adopt VRI depends entirely on me |
| VOL_03 * | I will use VRI even when my clients did not ask me to use it |
| VOL_04 * | Although it might be helpful, using VRI is not compulsory to me |
| EXP_01 | I have experience using new technology in farm activities |
| EXP_02 | I have experience using other precision agriculture technologies |
| EXP_03 | I have experience using computers in farm management |
* Dropped after pre-test evaluation and internal consistency check; ** Dropped after constructs’ external consistency check.
References
- Marchal, V.; Dellink, R.; Van Vuuren, D.; Clapp, C.; Château, J.; Lanzi, E.; Magné, B.; Van Vliet, J. OECD Environmental Outlook to 2050 Chapter 3: Climate Change; OECD: Paris, France, 2011; Volume 90. [Google Scholar] [CrossRef]
- Molden, D. Water for Food Water for Life: A Comprehensive Assessment of water Management in Agriculture; Routledge: Abingdon, UK, 2013; ISBN 9781849773799. [Google Scholar]
- FAO. Coping with Water Scarcity in Agriculture: A Global Framework for Action in a Changing Climate; FAO: Rome, Italy, 2016. [Google Scholar]
- Famiglietti, J.S. The global groundwater crisis. Nat. Clim. Chang. 2014, 4, 945–948. [Google Scholar] [CrossRef]
- Llamas, M.R.; Martínez-Santos, P. Intensive groundwater use: A silent revolution that cannot be ignored. Water Sci. Technol. 2005, 51, 167–174. [Google Scholar] [CrossRef]
- Elshall, A.S.; Arik, A.D.; El-Kadi, A.I.; Pierce, S.; Ye, M.; Burnett, K.M.; Wada, C.A.; Bremer, L.L.; Chun, G. Groundwater sustainability: A review of the interactions between science and policy. Environ. Res. Lett. 2020, 15, 093004. [Google Scholar] [CrossRef]
- Vitali, G.; Francia, M.; Golfarelli, M.; Canavari, M. Crop Management with the IoT: An Interdisciplinary Survey. Agronomy 2021, 11, 181. [Google Scholar] [CrossRef]
- Haghverdi, A.; Leib, B.G.; Washington-Allen, R.A.; Ayers, P.D.; Buschermohle, M.J. Perspectives on delineating management zones for variable rate irrigation. Comput. Electron. Agric. 2015, 117, 154–167. [Google Scholar] [CrossRef]
- Ortuani, B.; Facchi, A.; Mayer, A.; Bianchi, D.; Bianchi, A.; Brancadoro, L. Assessing the effectiveness of variable-rate drip irrigation on water use efficiency in a Vineyard in Northern Italy. Water 2019, 11, 1964. [Google Scholar] [CrossRef]
- Balafoutis, A.; Koundouras, S.; Anastasiou, E.; Fountas, S.; Arvanitis, K. Life Cycle Assessment of Two Vineyards after the Application of Precision Viticulture Techniques: A Case Study. Sustainability 2017, 9, 1997. [Google Scholar] [CrossRef]
- Klein, L.J.; Hamann, H.F.; Hinds, N.; Guha, S.; Sanchez, L.; Sams, B.; Dokoozlian, N. Closed Loop Controlled Precision Irrigation Sensor Network. IEEE Internet Things J. 2018, 5, 4580–4588. [Google Scholar] [CrossRef]
- Evans, R.G.; LaRue, J.; Stone, K.C.; King, B.A. Adoption of site-specific variable rate sprinkler irrigation systems. Irrig. Sci. 2013, 31, 871–887. [Google Scholar] [CrossRef]
- Davis, F.D.; Venkatesh, V. Toward preprototype user acceptance testing of new information systems: Implications for software project management. Eng. Manag. IEEE Trans. 2004, 51, 31–46. [Google Scholar] [CrossRef]
- Davis, F.D. Perceived usefulness, perceived ease of use, and user acceptance of information technology. MIS Q. Manag. Inf. Syst. 1989, 13, 319–339. [Google Scholar] [CrossRef]
- Ajzen, I. The theory of planned behavior. Organ. Behav. Hum. Decis. Process. 1991, 50, 179–211. [Google Scholar] [CrossRef]
- Rogers, E.M.; Singhal, A.; Quinlan, M.M. Diffusion of innovations. In An Integrated Approach to Communication Theory and Research, 3rd ed.; Taylor and Francis: Oxfordshire, UK, 2019; pp. 415–433. ISBN 9781351358712. [Google Scholar]
- Rogers, E.M. Diffusion of Innovations; The Free Press: Glencoe, Scotland, 1962; ISBN 0-612-62843-4. [Google Scholar]
- Venkatesh, V.; Morris, M.G.; Davis, G.B.; Davis, F.D. User acceptance of information technology: Toward a unified view. MIS Q. Manag. Inf. Syst. 2003, 27, 425–478. [Google Scholar] [CrossRef]
- Legris, P.; Ingham, J.; Collerette, P. Why do people use information technology? A critical review of the technology acceptance model. Inf. Manag. 2003, 40, 191–204. [Google Scholar] [CrossRef]
- Rahimi, B.; Nadri, H.; Afshar, H.L.; Timpka, T. A systematic review of the technology acceptance model in health informatics. Appl. Clin. Inform. 2018, 9, 604–634. [Google Scholar] [CrossRef] [PubMed]
- Fishbein, M.; Ajzen, I. Belief, Attitude, Intention and Behavior: An Introduction to Theory and Research; Addison-Wesley: Boston, MA, USA, 1975. [Google Scholar]
- Venkatesh, V.; Davis, F.D. Theoretical extension of the Technology Acceptance Model: Four longitudinal field studies. Manag. Sci. 2000, 46, 186–204. [Google Scholar] [CrossRef]
- Venkatesh, V.; Bala, H. Technology Acceptance Model 3 and a Research Agenda on Interventions. Decis. Sci. 2008, 39, 273–315. [Google Scholar] [CrossRef]
- Venkatesh, V. Determinants of Perceived Ease of Use: Integrating Control, Intrinsic Motivation, and Emotion into the Technology Acceptance Model. Inf. Syst. Res. 2000, 11, 342–365. [Google Scholar] [CrossRef]
- Tenenhaus, M.; Vinzi, V.E.; Chatelin, Y.M.; Lauro, C. PLS path modeling. Comput. Stat. Data Anal. 2005, 48, 159–205. [Google Scholar] [CrossRef]
- Sanchez, G. PLS Path Modeling with R. R Packag. Notes 2013, 383, 1–235. [Google Scholar]
- Hair, J.F.; Hult, G.T.M.; Ringle, C.M.; Sarstedt, M. A Primer on Partial Least Squares Structural Equation Modeling, 2nd ed.; Sage: Thousand Oaks, CA, USA, 2017. [Google Scholar]
- Fornell, C.; Larcker, D.F. Evaluating Structural Equation Models with Unobservable Variables and Measurement Error. J. Mark. Res. 1981, 18, 39. [Google Scholar] [CrossRef]
- Adrian, A.M.; Norwood, S.H.; Mask, P.L. Producers’ perceptions and attitudes toward precision agriculture technologies. Comput. Electron. Agric. 2005, 48, 256–271. [Google Scholar] [CrossRef]
- Lu, Y.; Lu, Y.; Wang, B.; Pan, Z.; Qin, H. Acceptance of government-sponsored agricultural information systems in China: The role of government social power. Inf. Syst. e-Bus. Manag. 2015, 13, 329–354. [Google Scholar] [CrossRef]
- Aubert, B.A.; Schroeder, A.; Grimaudo, J. IT as enabler of sustainable farming: An empirical analysis of farmers’ adoption decision of precision agriculture technology. Decis. Support Syst. 2012, 54, 510–520. [Google Scholar] [CrossRef]
- Shyu, S.H.P.; Huang, J.H. Elucidating usage of e-government learning: A perspective of the extended technology acceptance model. Gov. Inf. Q. 2011, 28, 491–502. [Google Scholar] [CrossRef]
- Sanderson, M.R.; Hughes, V. Race to the Bottom (of the Well): Groundwater in an Agricultural Production Treadmill. Soc. Probl. 2019, 66, 392–410. [Google Scholar] [CrossRef]
- Sears, L.; Caparelli, J.; Lee, C.; Pan, D.; Strandberg, G.; Vuu, L.; Lin Lawell, C.-Y. Jevons’ Paradox and Efficient Irrigation Technology. Sustainability 2018, 10, 1590. [Google Scholar] [CrossRef]


Publisher’s Note: MDPI stays neutral with regard to jurisdictional claims in published maps and institutional affiliations. |
© 2021 by the authors. Licensee MDPI, Basel, Switzerland. This article is an open access article distributed under the terms and conditions of the Creative Commons Attribution (CC BY) license (http://creativecommons.org/licenses/by/4.0/).