
Sustainable Transportation and Policy Development: A Study for Impact Analysis of Mobility Patterns and Neighborhood Assessment of Walking Behavior

 ,
,  ,
, 
 and
and
Abstract
1. Introduction
2. Background
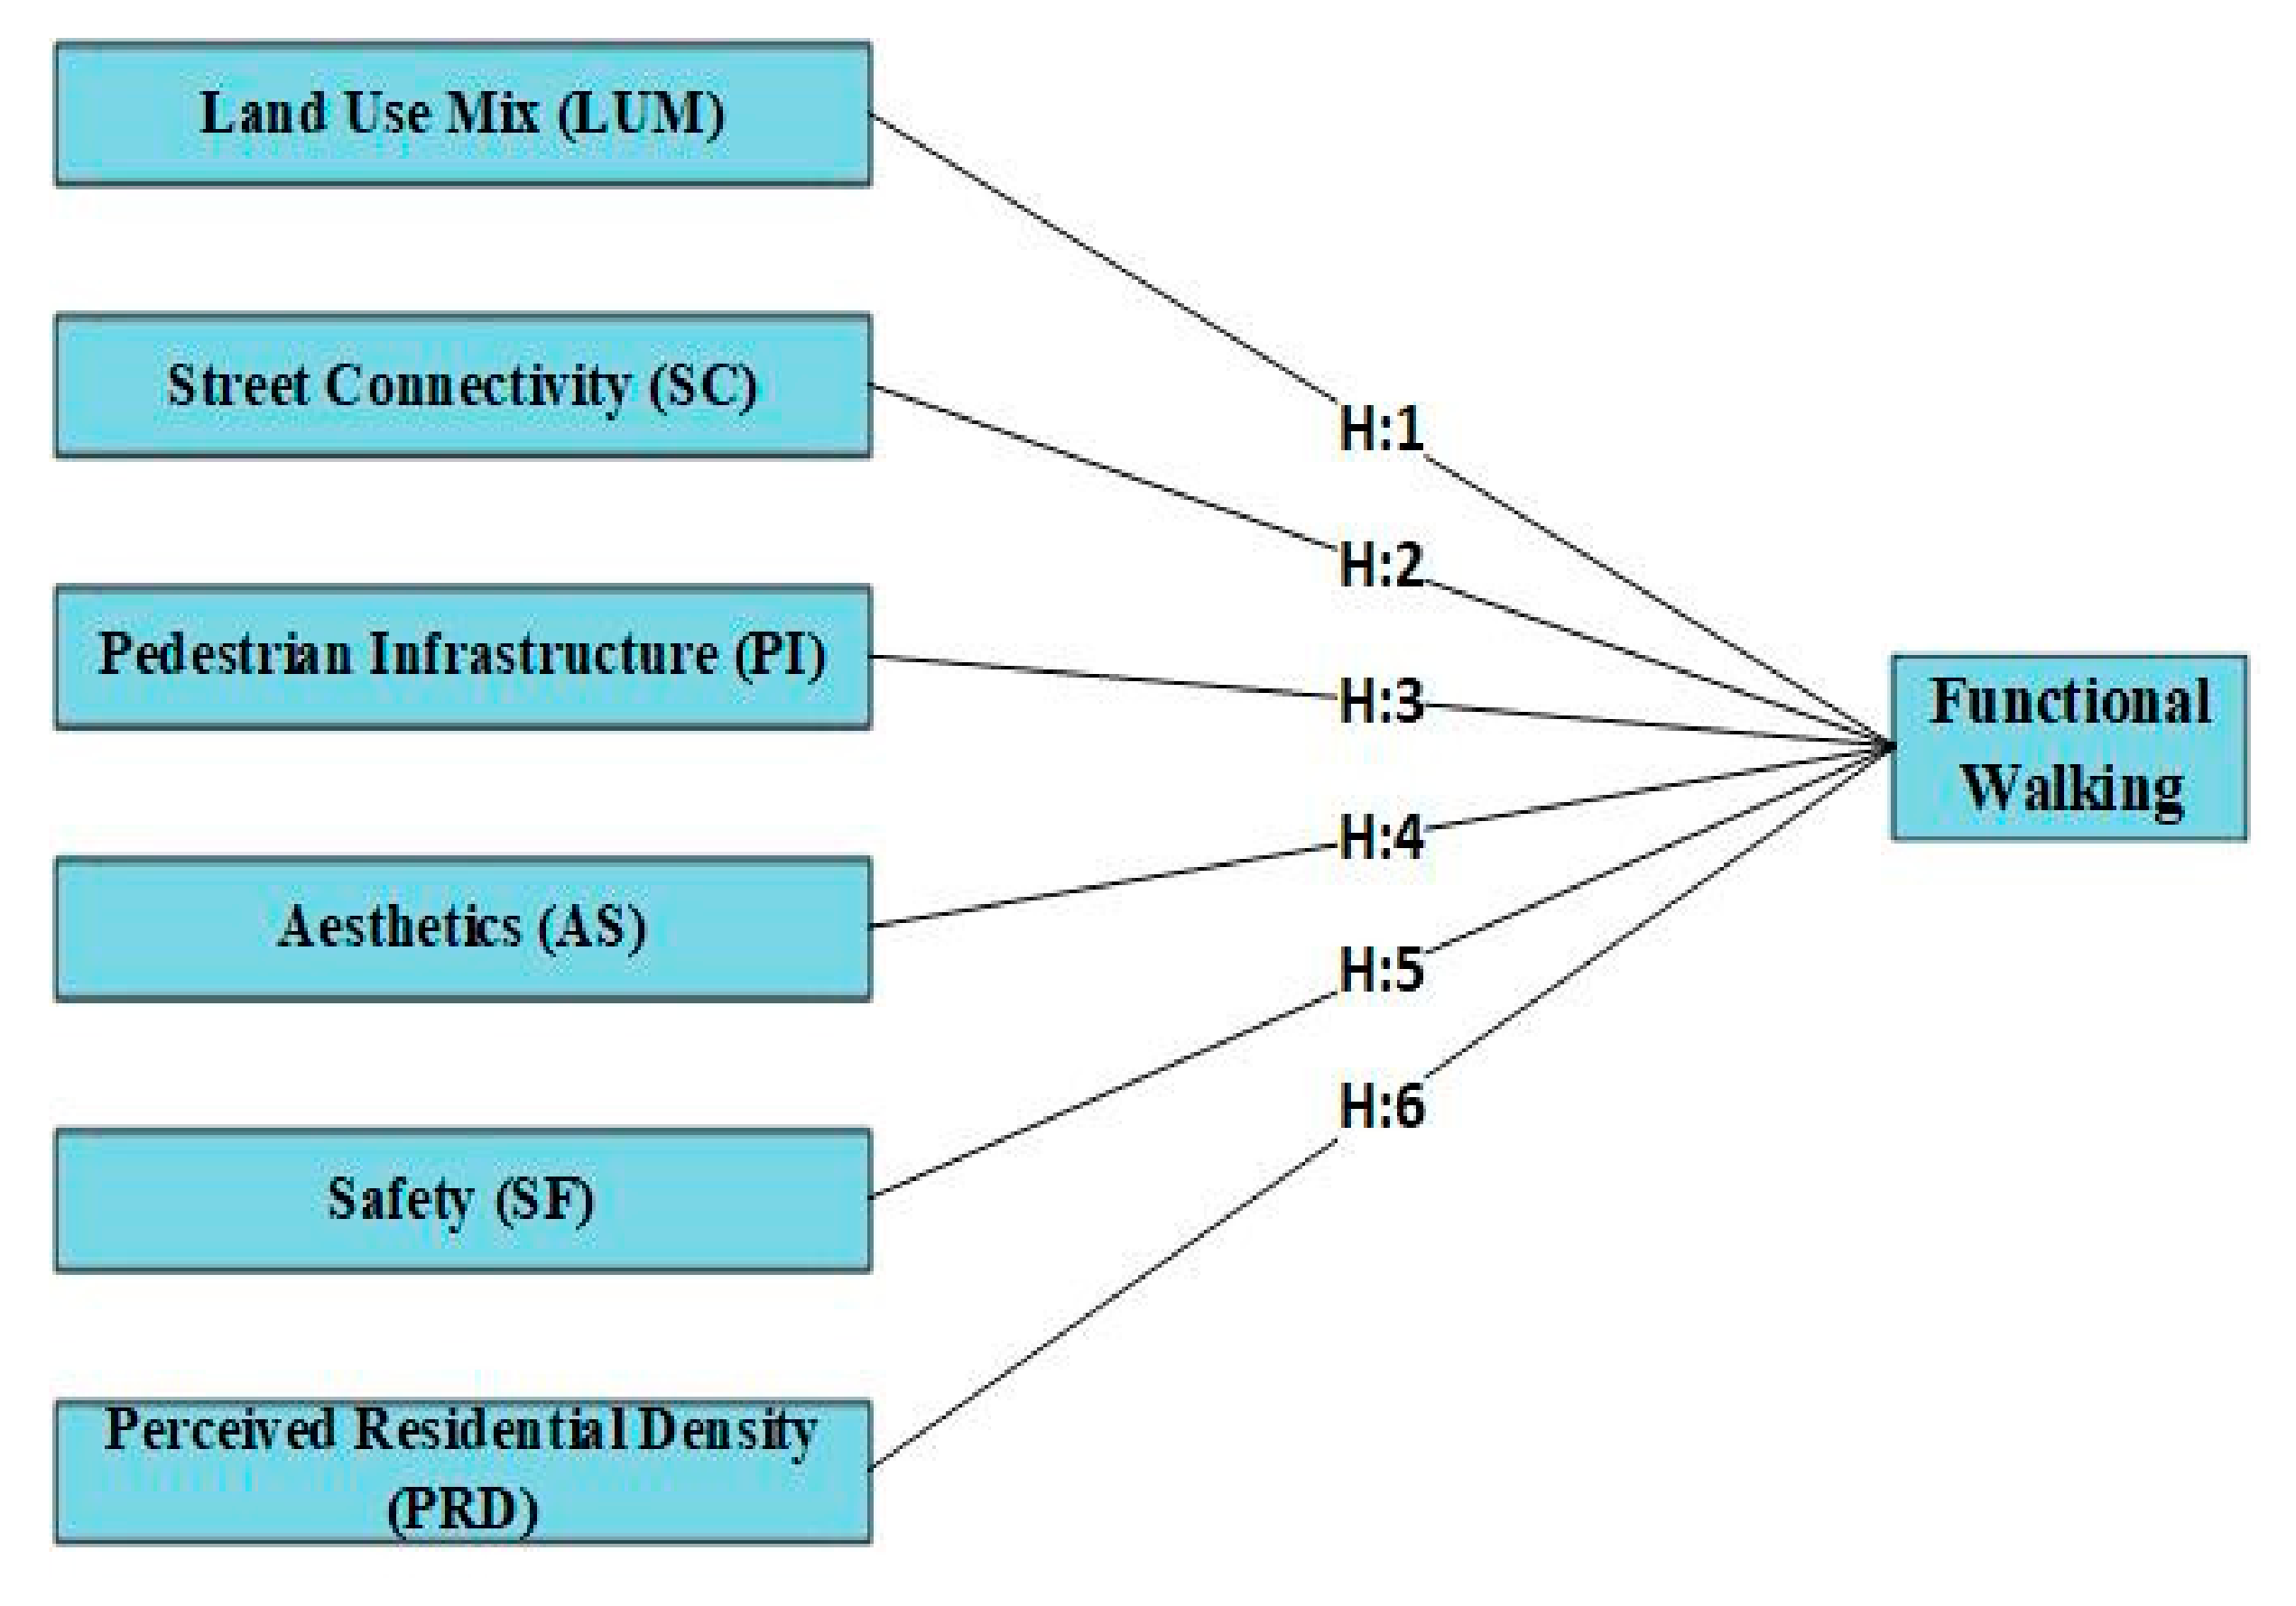
3. Theoretical Model
3.1. H1: Land Use Mix → Functional Walking
3.2. H2: Street Connectivity → Functional Walking
3.3. H3: Pedestrian Infrastructure → Functional Walking
3.4. H4: Aesthetics → Functional Walking
3.5. H5: Safety → Functional Walking
3.6. H6: Perceived Residential Density → Functional Walking
4. Materials and Methods
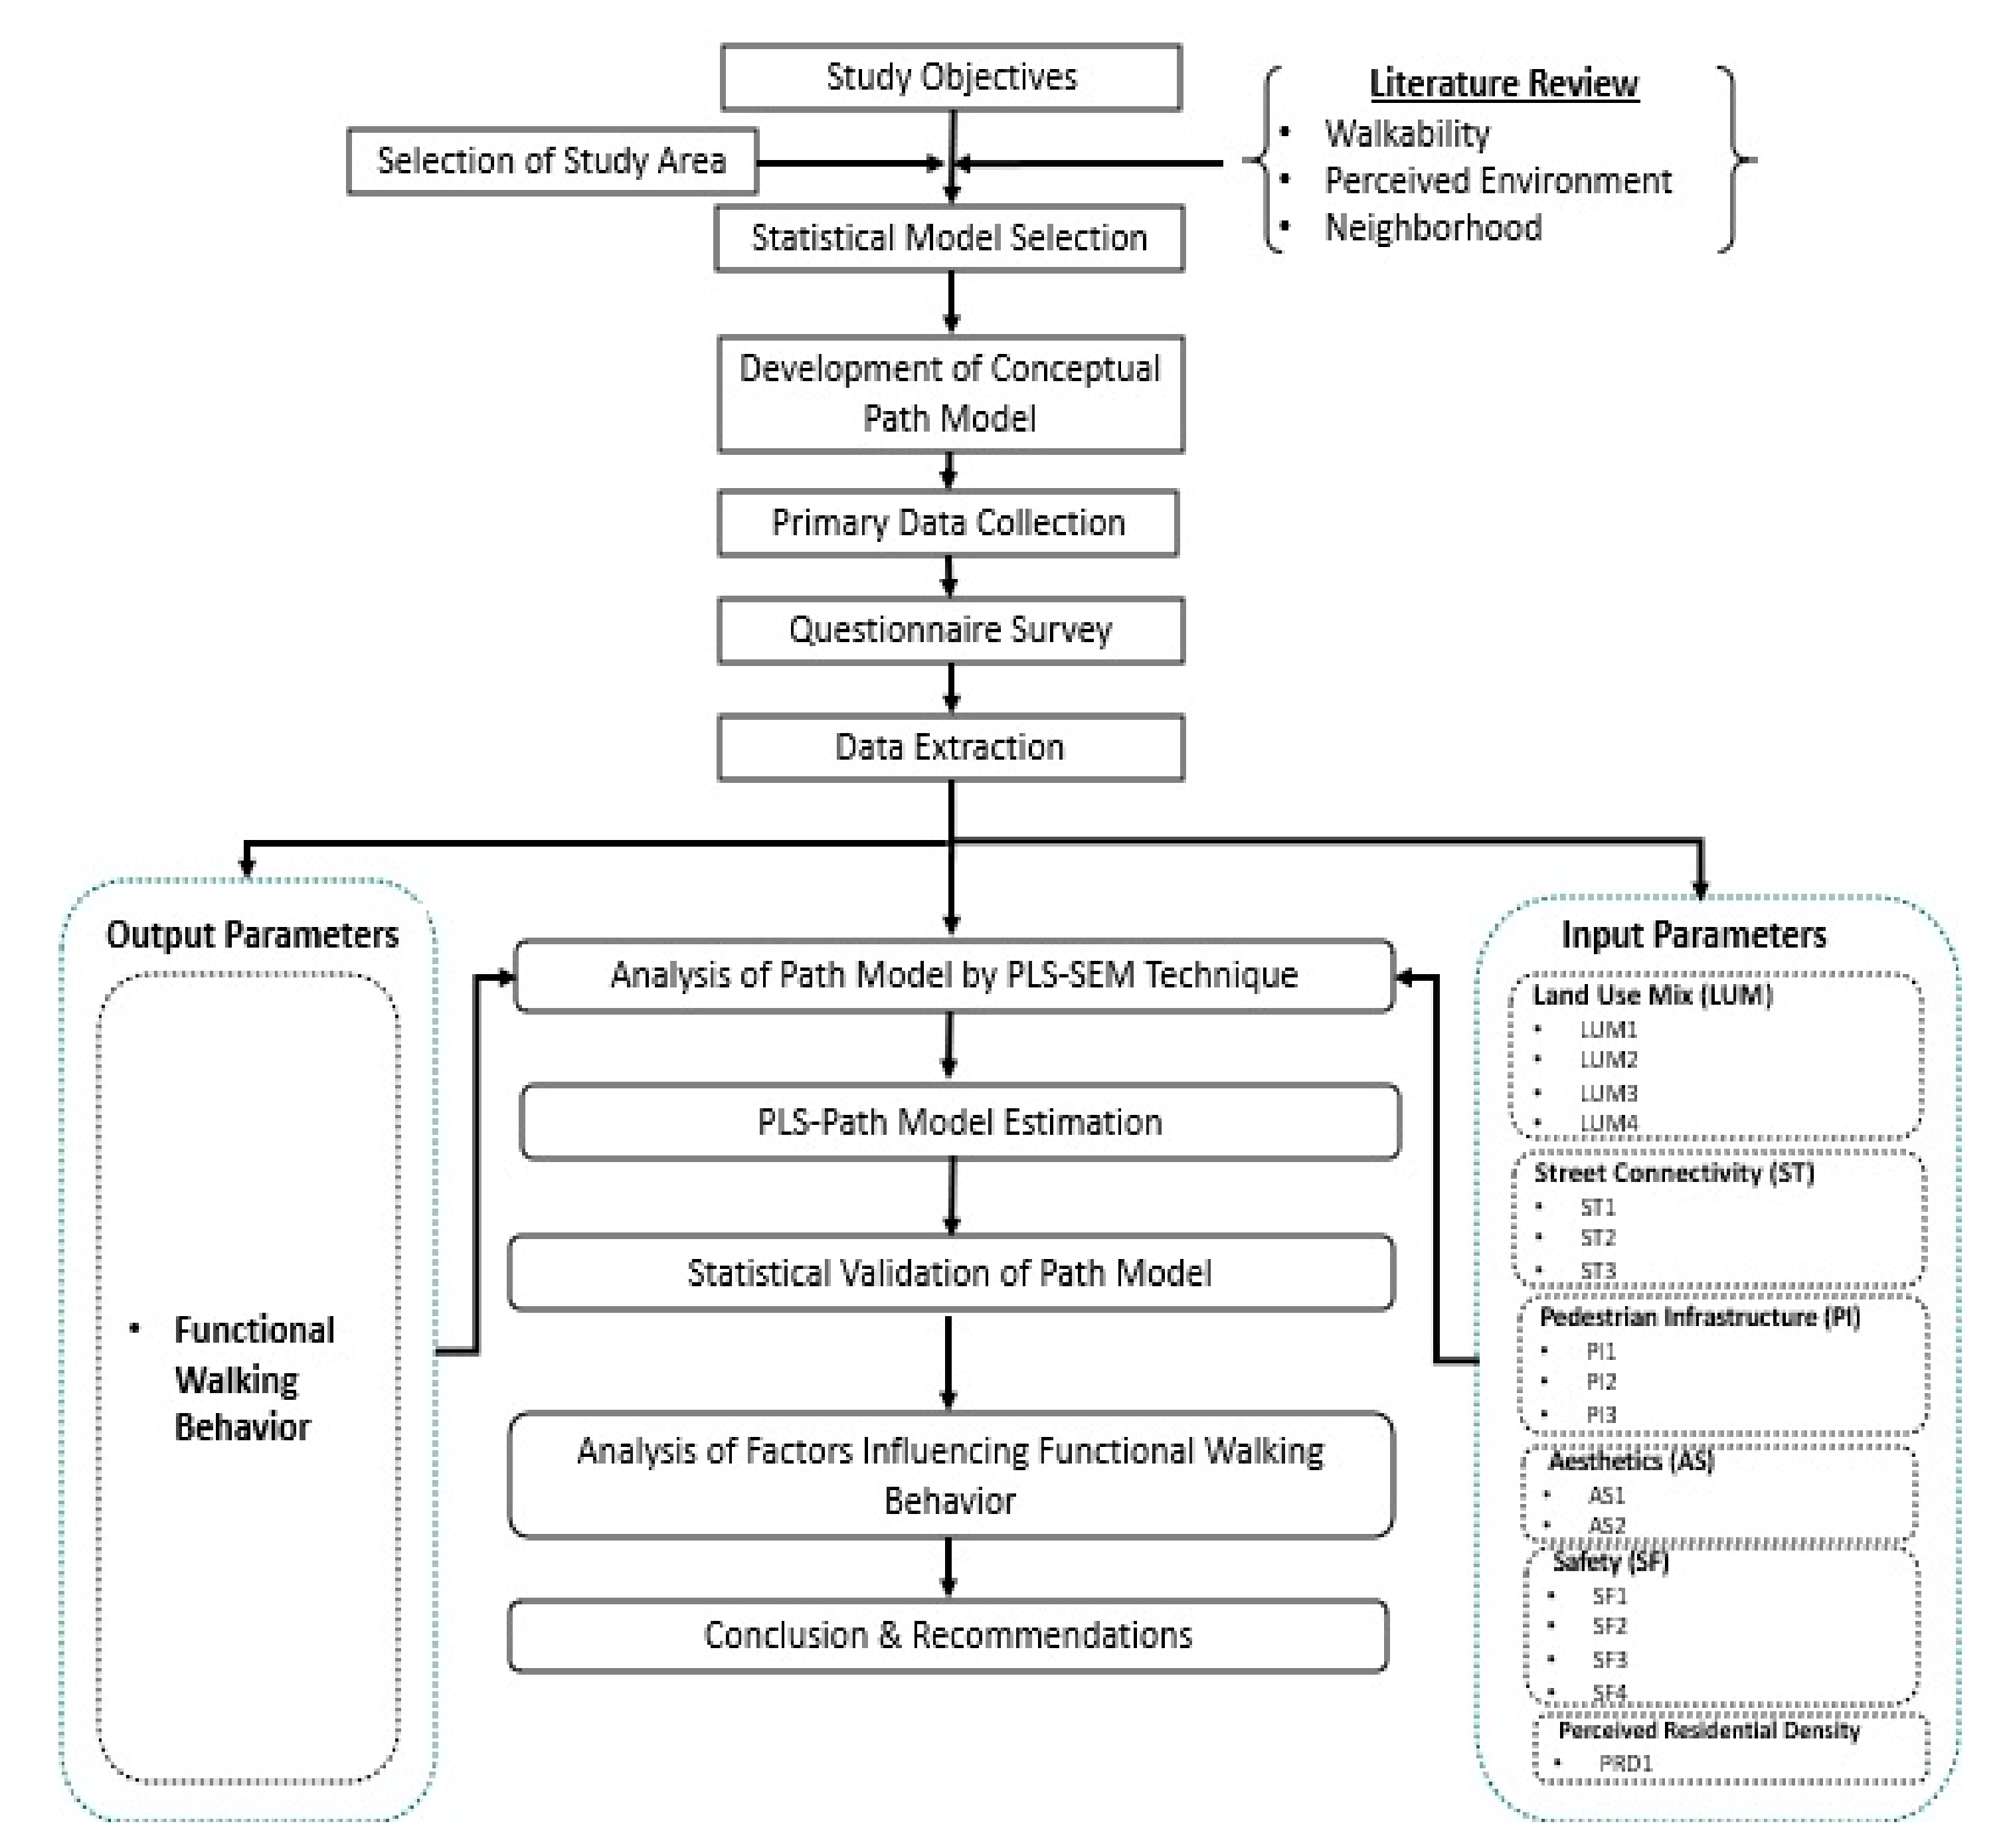
4.1. Research Framework
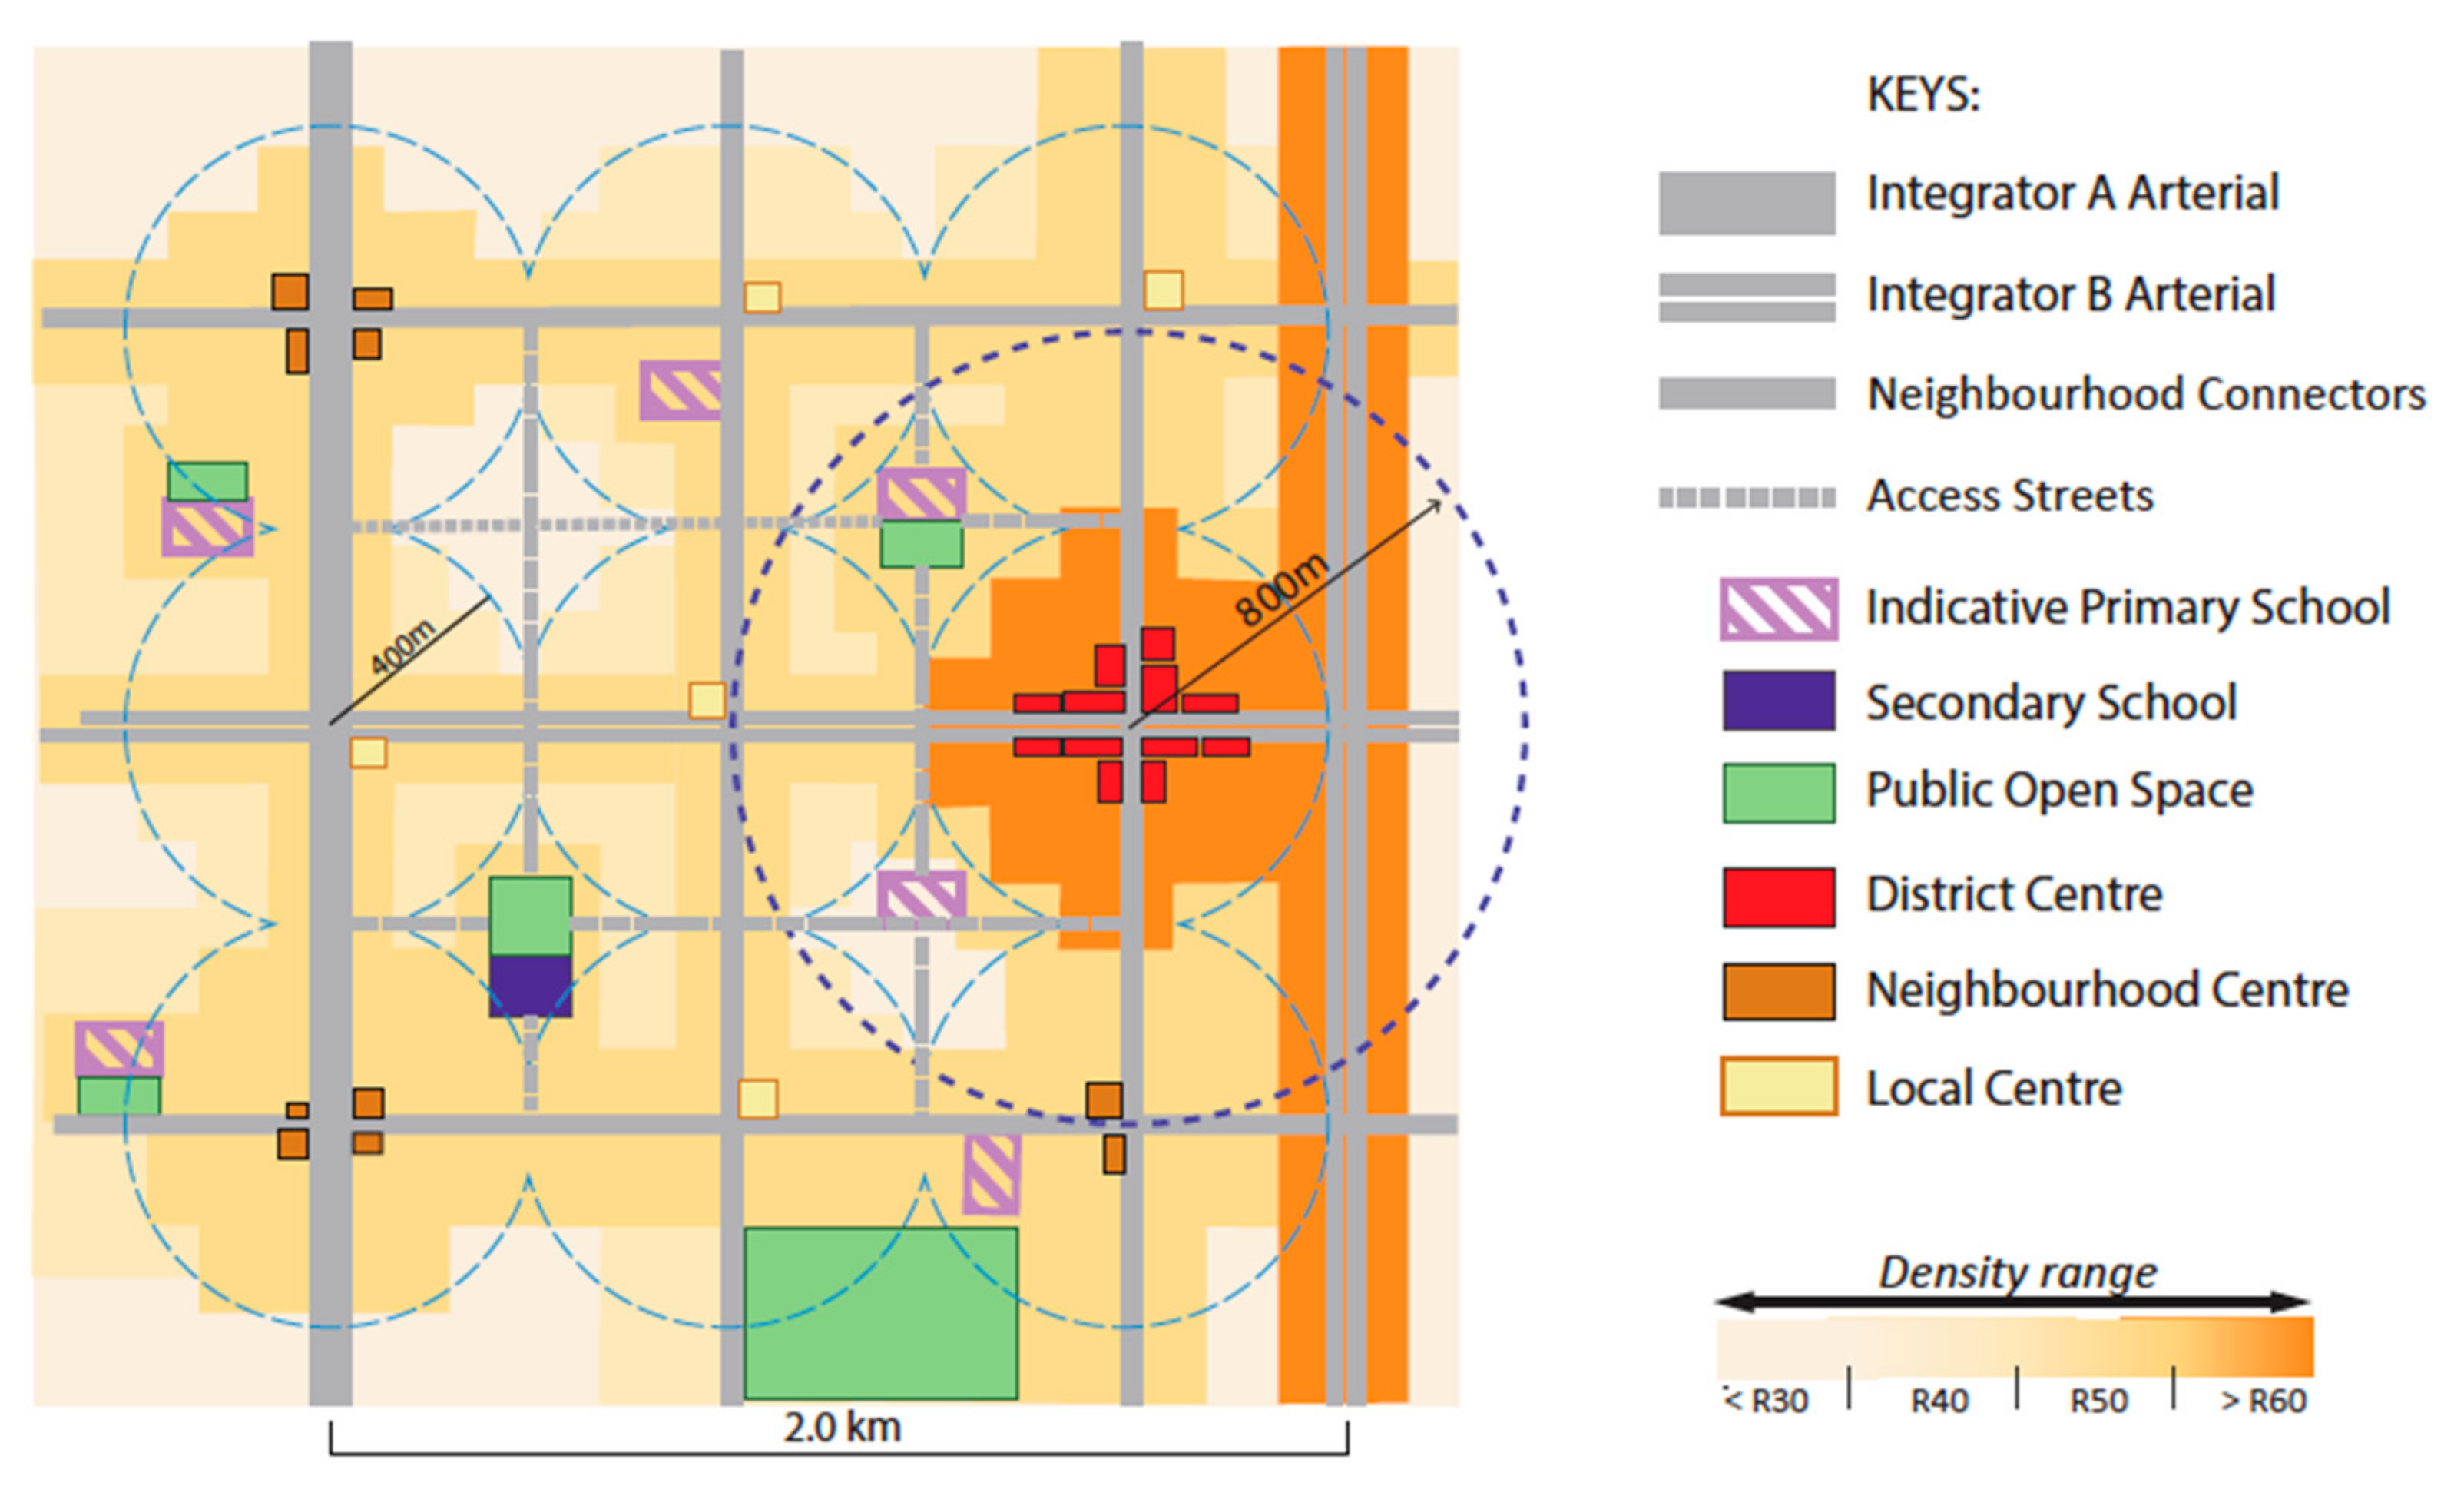
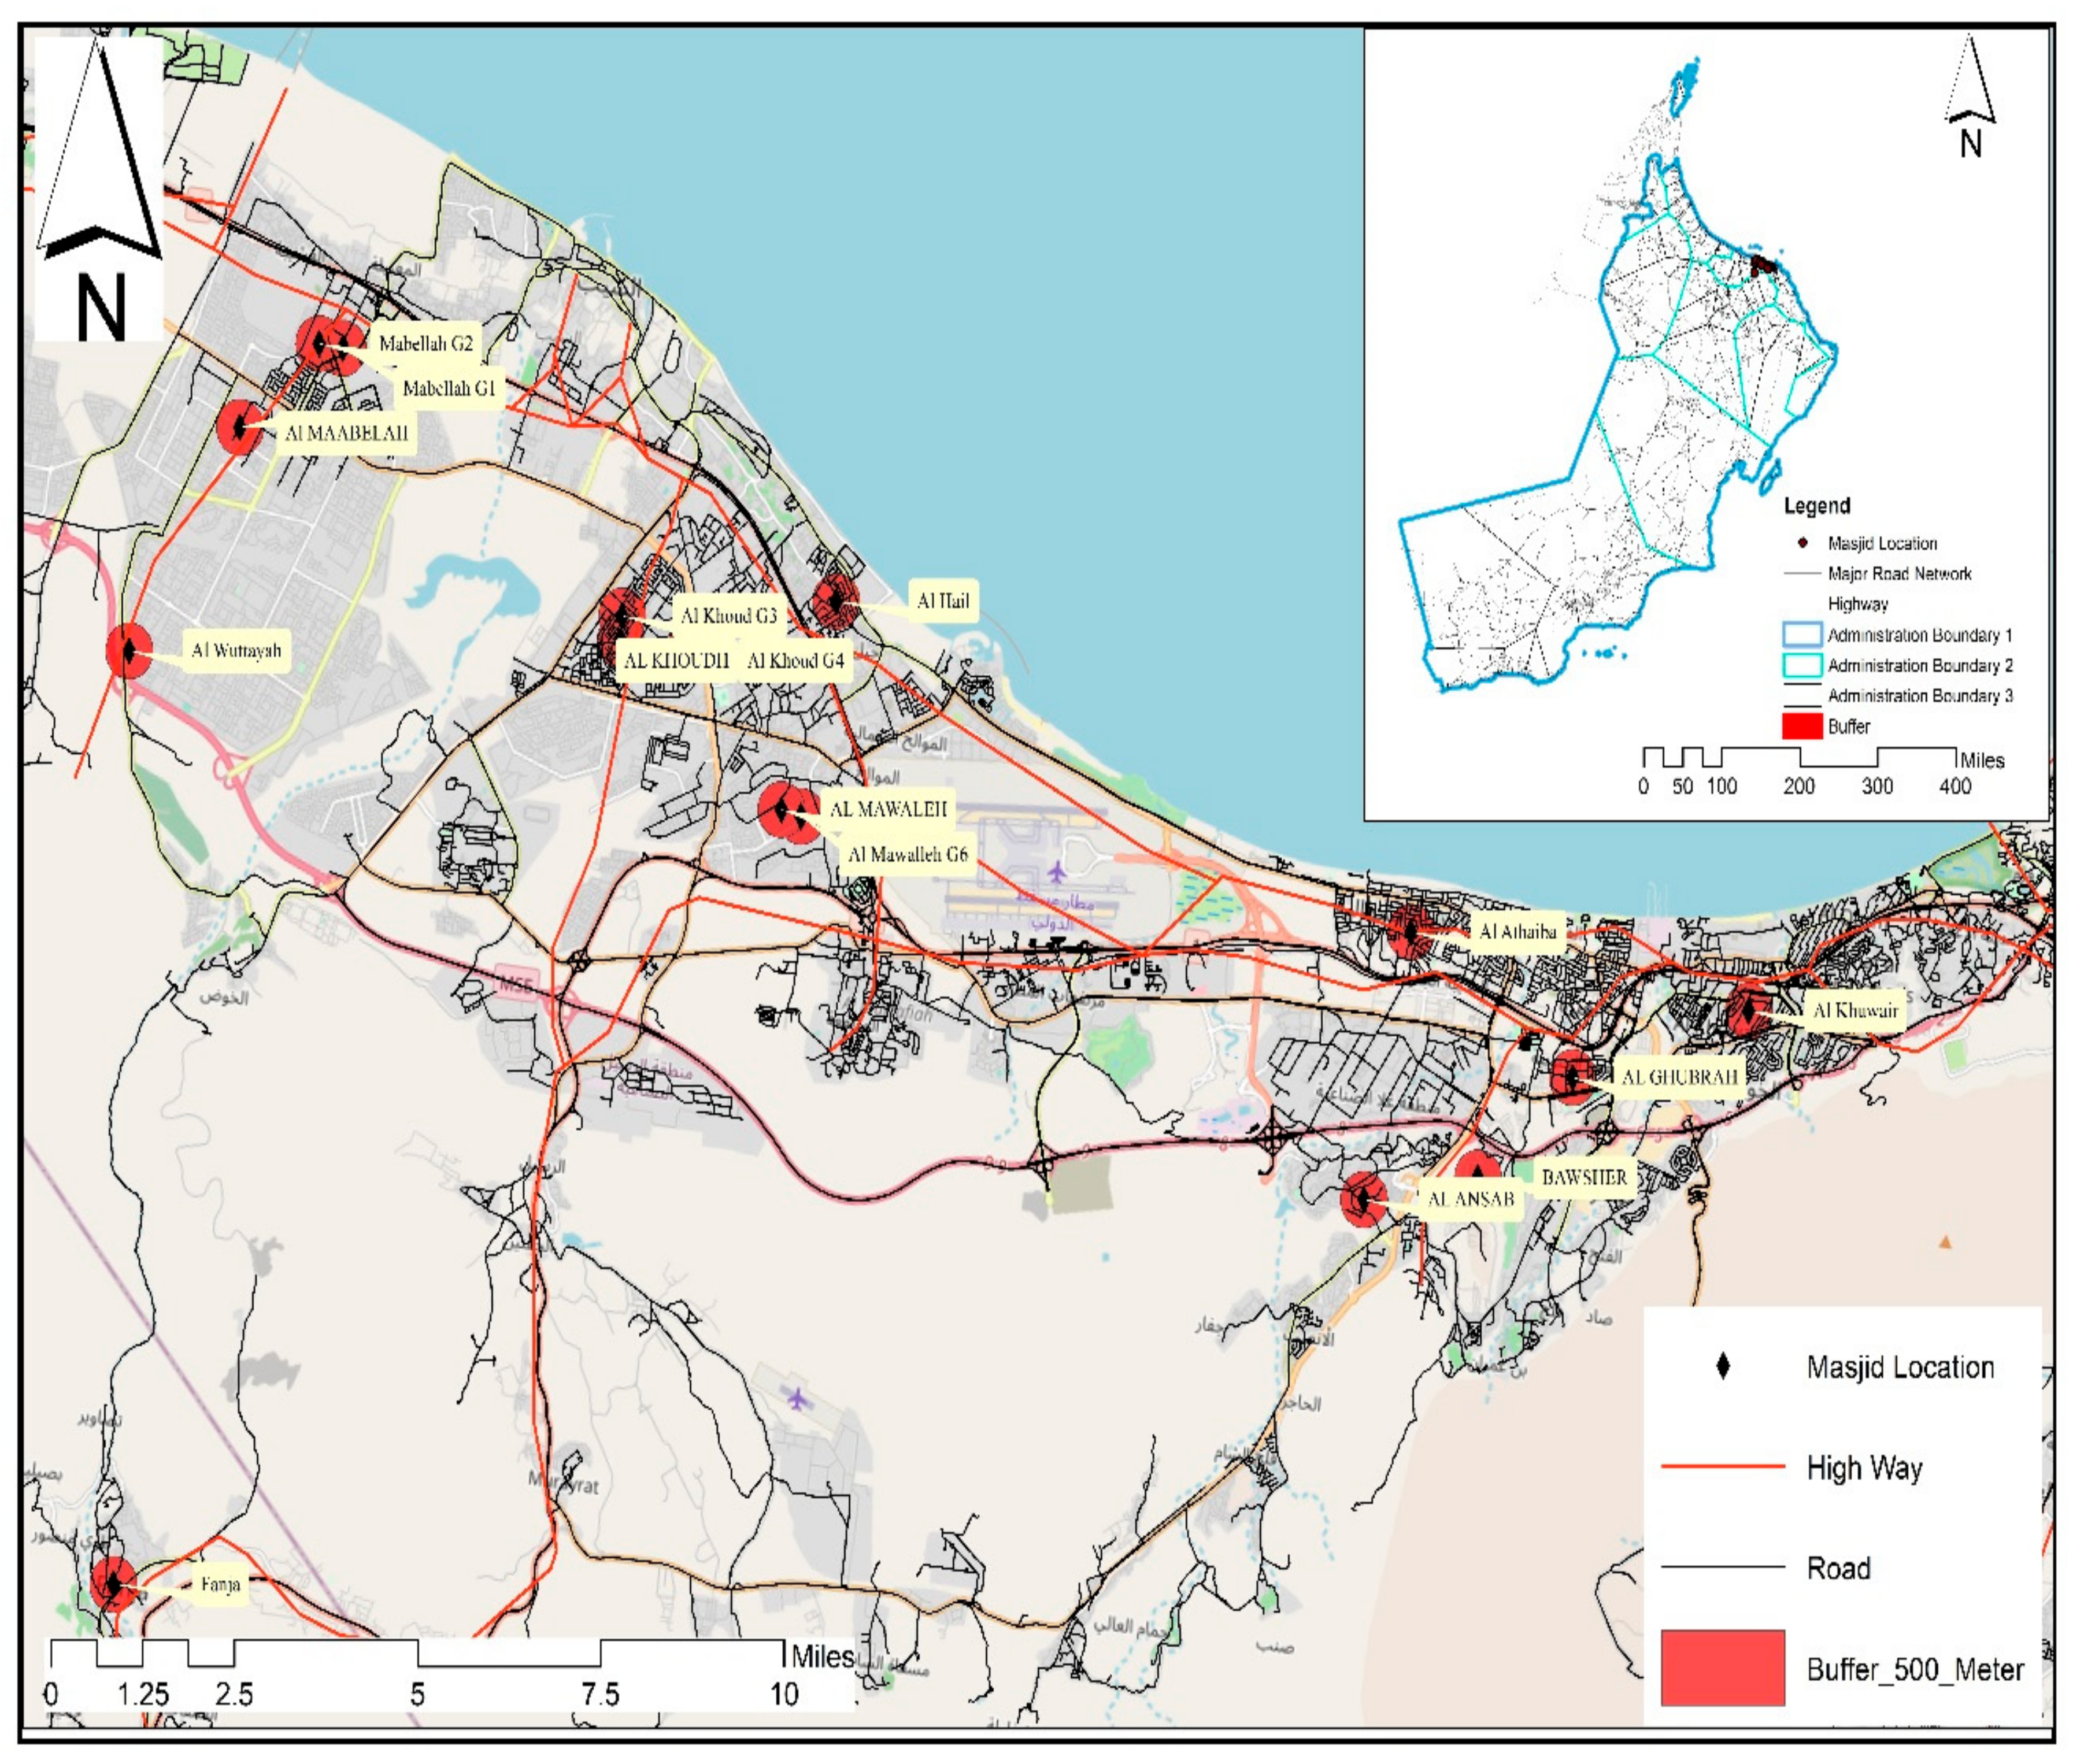
4.2. Study Area and Geography
4.3. Data Collection
4.4. Application of PLS-SEM Modelling Technique
5. Analysis and Results
- Convergent Validity and Individual Item Validity
- Discriminant Validity
- Structural Model Relationships
- Overall Fitness of the Model
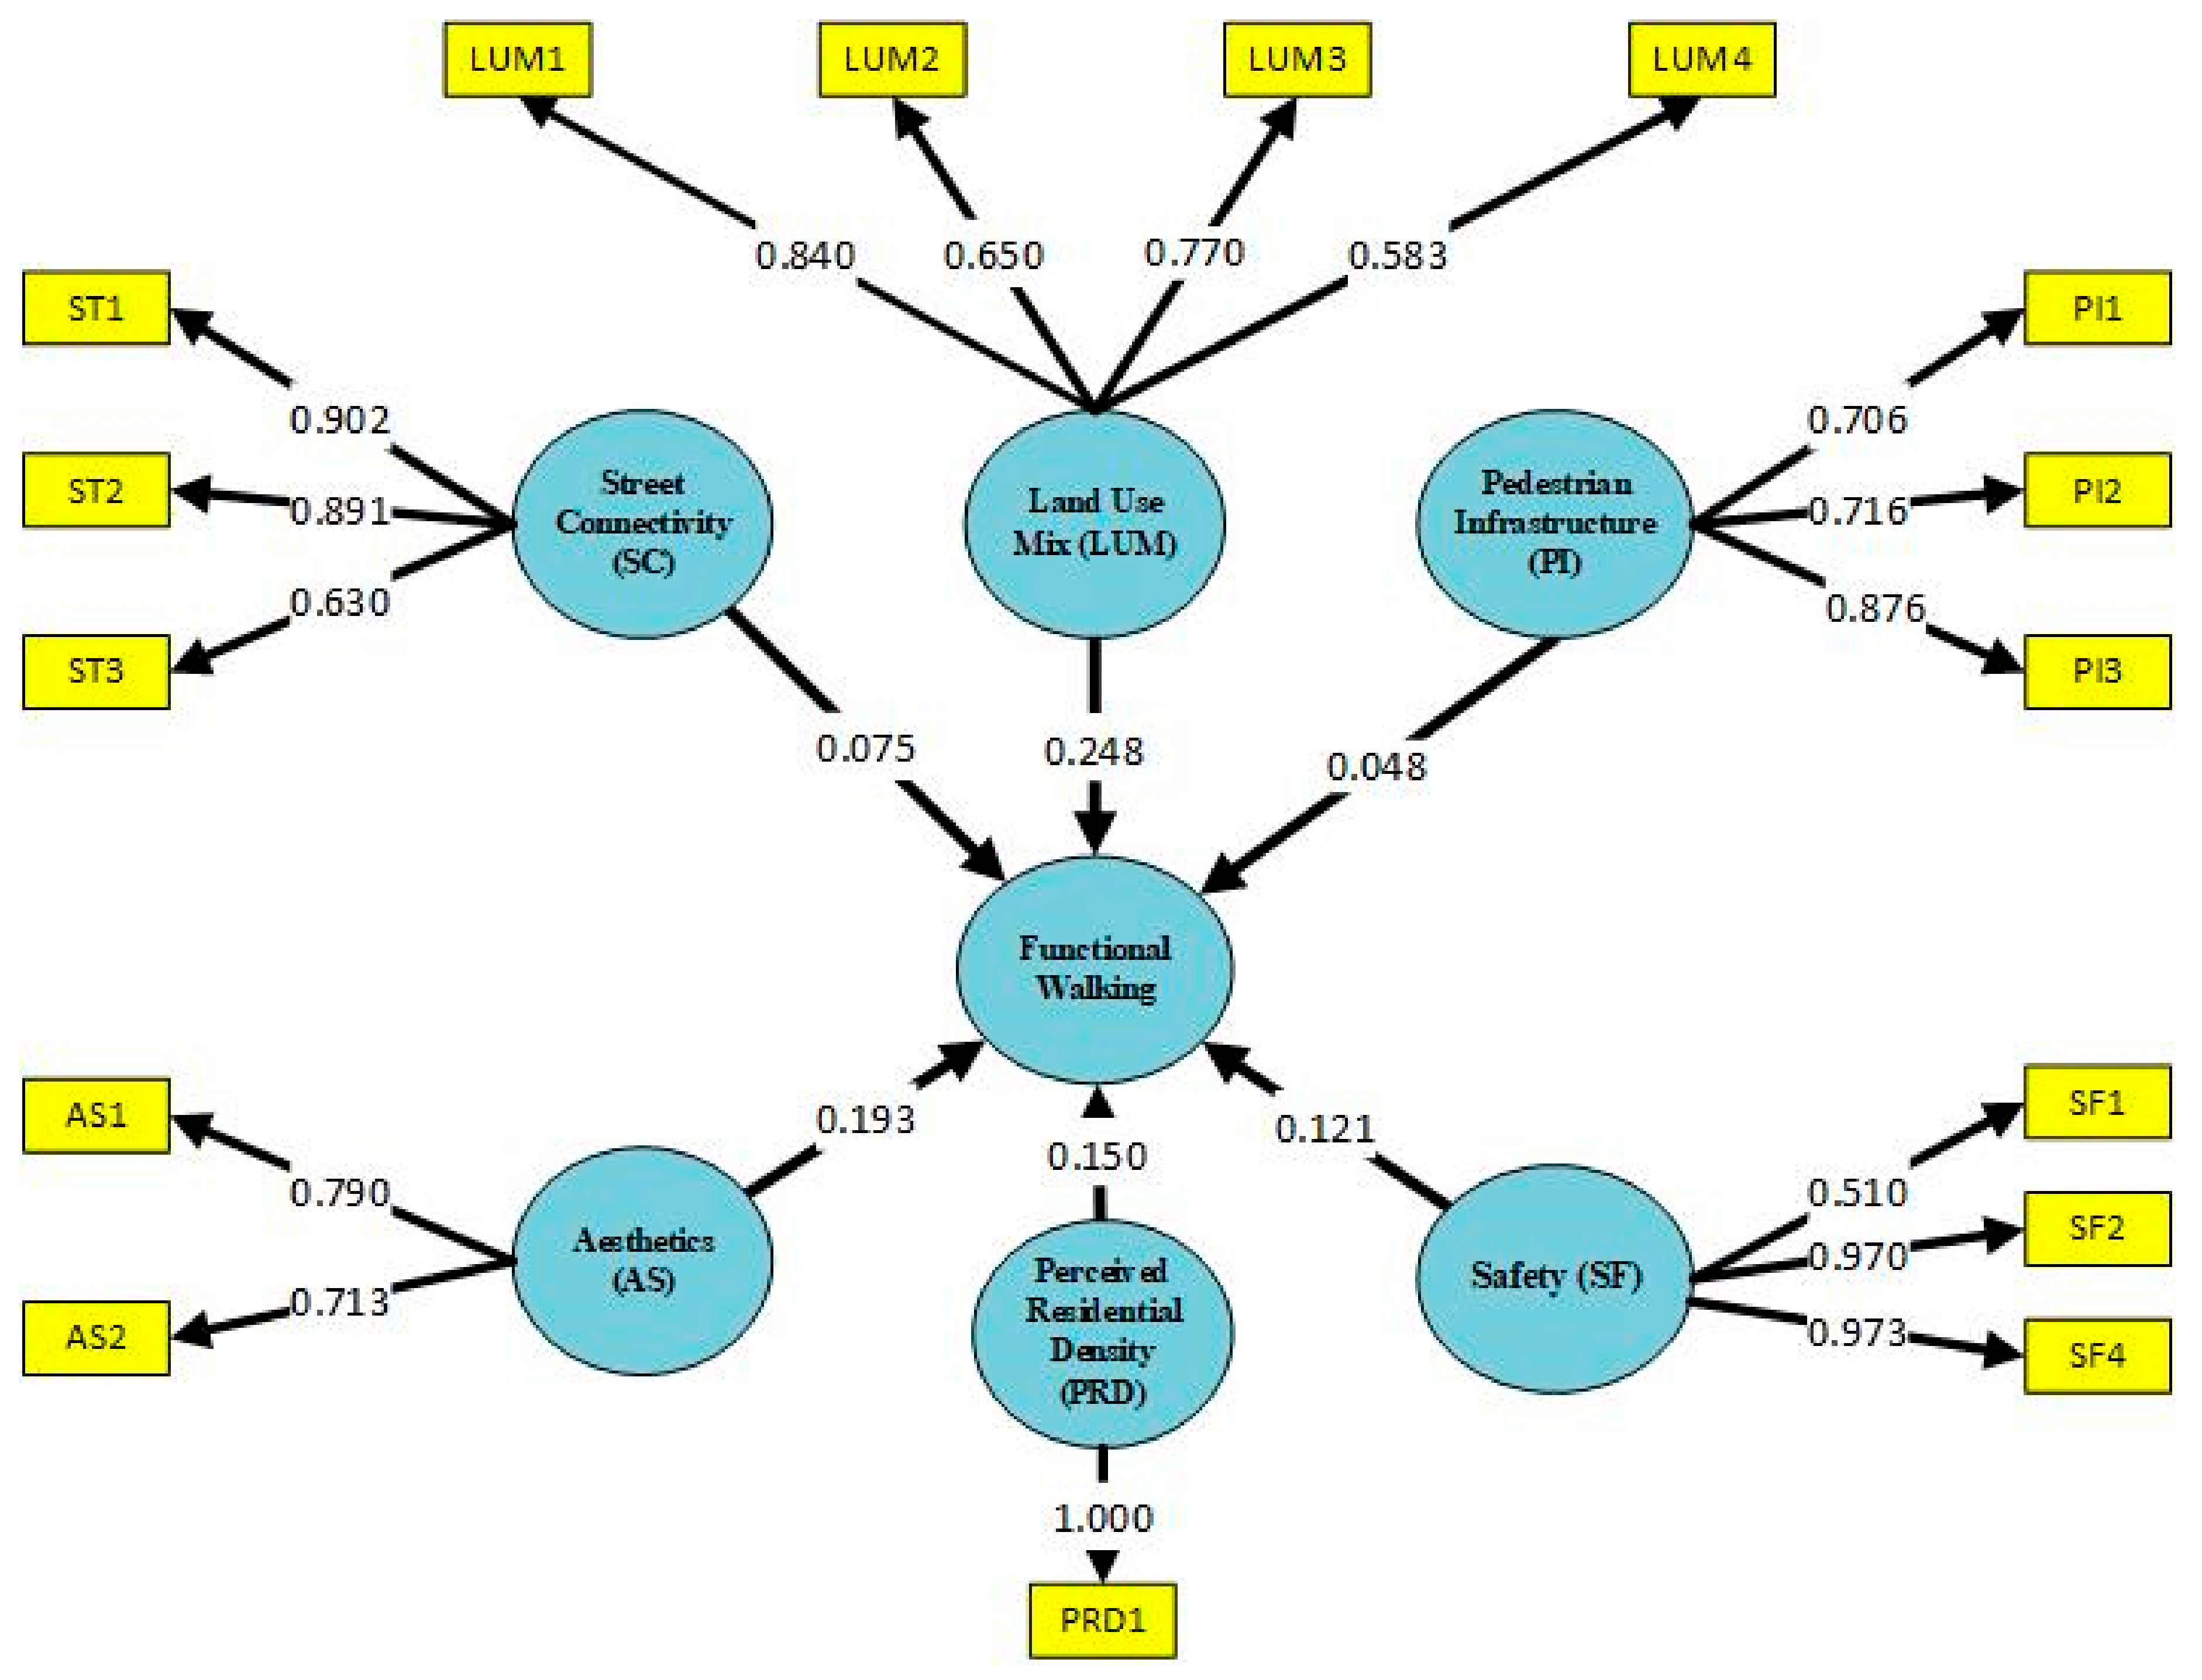
5.1. Convergent Validity and Individual Item Validity
5.2. Discriminant Validity
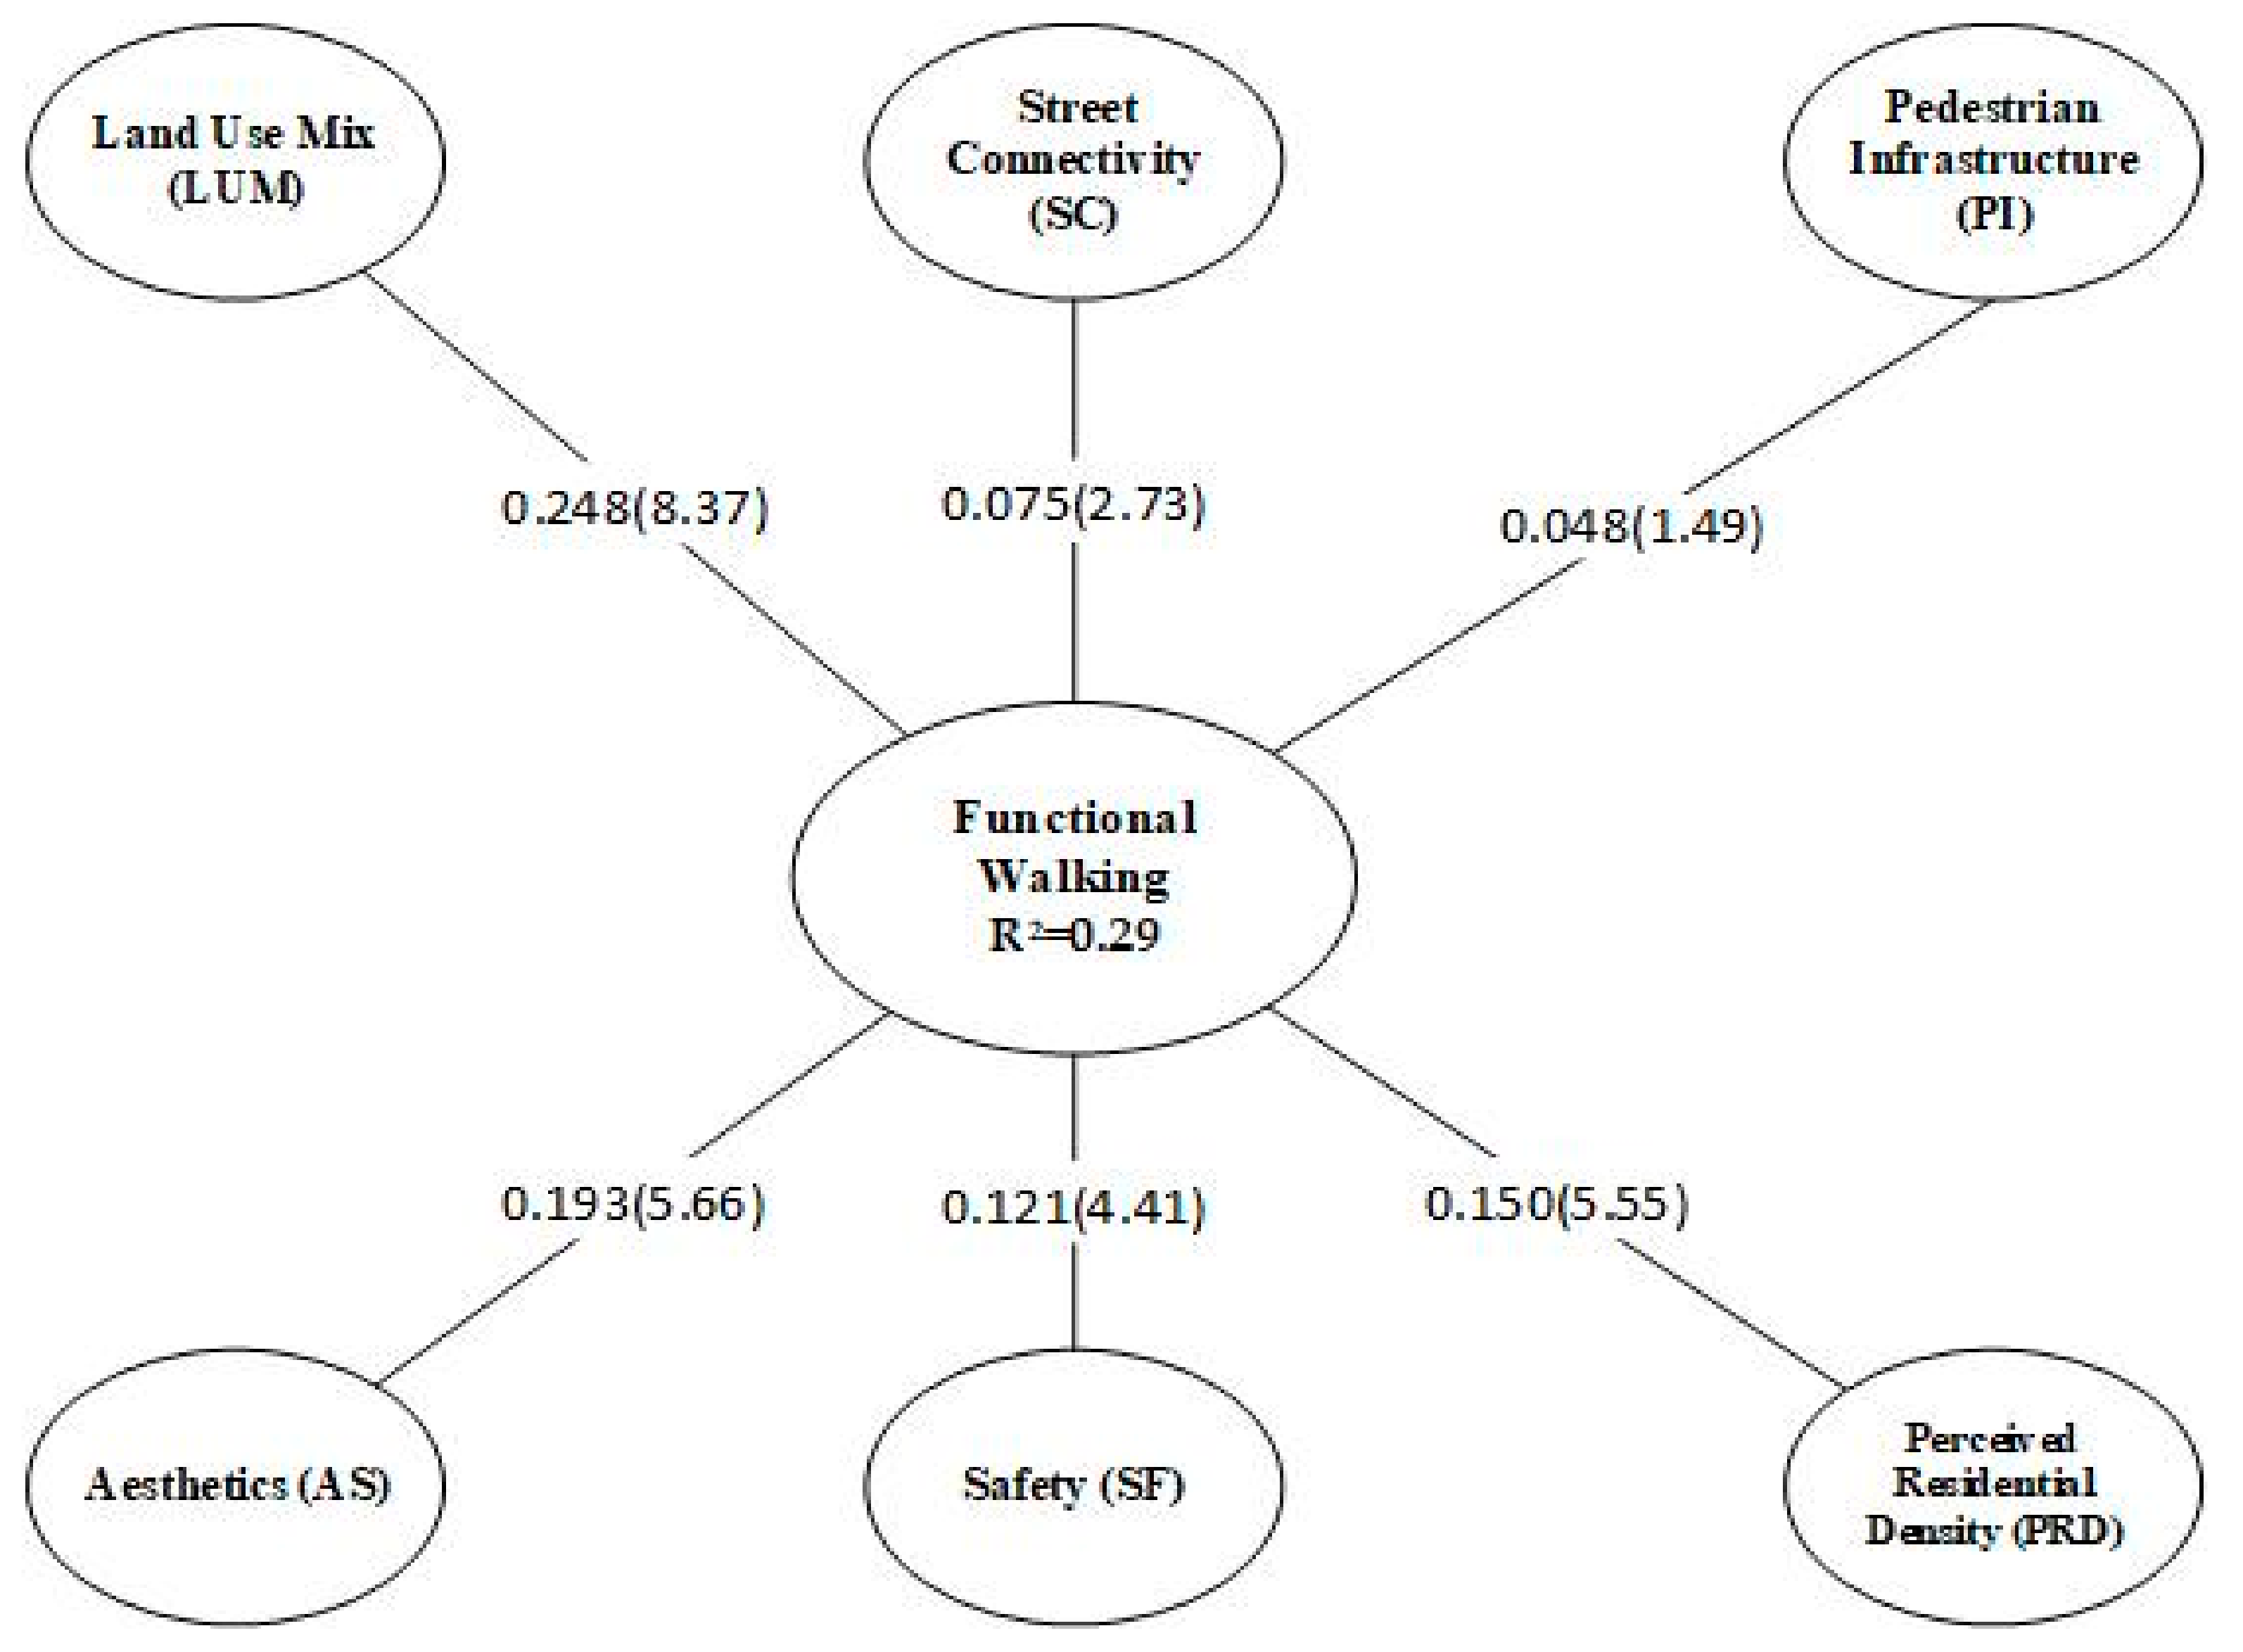
5.3. Structural Model Relationships
5.4. Overall Model Fitness Analysis
6. Discussion
7. Conclusions
8. Limitations of the Study
- Prevailing methodologies to assess the associations between environmental attributes and perceived walkability are universal. Walkability tools, in their current state, are directly applicable.
- Rapid urbanization associated with different levels of development of urban infrastructure substantially impacts the perception of walkability. Prevailing walkability tools need adjustments.
Author Contributions
Funding
Institutional Review Board Statement
Informed Consent Statement
Data Availability Statement
Acknowledgments
Conflicts of Interest
References
- Duany, A.; Plater-Zyberk, E.; Speck, J. Suburban Nation: The Rise of Sprawl and the Decline of the American Dream; Macmillan: New York, NY, USA, 2001. [Google Scholar]
- Putnam, R.D. Bowling Alone: The Collapse and Revival of American Community; Simon and Schuster: New York, NY, USA, 2000. [Google Scholar]
- Lund, H. Pedestrian Environments and Sense of Community. J. Plan. Educ. Res. 2002, 21, 301–312. [Google Scholar] [CrossRef]
- Lund, H. Testing the Claims of New Urbanism: Local Access, Pedestrian Travel, and Neighboring Behaviors. J. Am. Plan. Assoc. 2003, 69, 414–429. [Google Scholar] [CrossRef]
- Cerin, E.; Saelens, B.E.; Sallis, J.F.; Frank, L.D. Neighborhood Environment Walkability Scale: Validity and development of a short form. Med. Sci. Sports Exerc. 2006, 38, 1682. [Google Scholar] [CrossRef]
- Oyeyemi, A.L.; Sallis, J.F.; Oyeyemi, A.Y.; Amin, M.M.; De Bourdeaudhuij, I.; Deforche, B. Adaptation, Test-Retest Reliability, and Construct Validity of the Physical Activity Neighborhood Environment Scale in Nigeria (PANES-N). J. Phys. Act. Health 2013, 10, 1079–1090. [Google Scholar] [CrossRef] [PubMed]
- Frank, L.D.; Schmid, T.L.; Sallis, J.F.; Chapman, J.; Saelens, B.E. Linking objectively measured physical activity with objectively measured urban form: Findings from SMARTRAQ. Am. J. Prev. Med. 2005, 28, 117–125. [Google Scholar] [CrossRef] [PubMed]
- Leslie, E.; Coffee, N.; Frank, L.; Owen, N.; Bauman, A.; Hugo, G. Walkability of local communities: Using geographic information systems to objectively assess relevant environmental attributes. Health Place 2007, 13, 111–122. [Google Scholar] [CrossRef]
- Gebel, K.; Bauman, A.; Sugiyama, T.; Owen, N. Mismatch between perceived and objectively assessed neighborhood walkability attributes: Prospective relationships with walking and weight gain. Health Place 2011, 17, 519–524. [Google Scholar] [CrossRef]
- Loh, V.H.; Veitch, J.; Salmon, J.; Cerin, E.; Mavoa, S.; Villanueva, K.; Timperio, A. Environmental Mismatch: Do Associations between the Built Environment and Physical Activity among Youth Depend on Concordance with Perceptions? Int. J. Environ. Res. Public Health 2020, 17, 1309. [Google Scholar] [CrossRef]
- Fan, P.; Wan, G.; Xu, L.; Park, H.; Xie, Y.; Liu, Y.; Yue, W.; Chen, J. Walkability in urban landscapes: A comparative study of four large cities in China. Landsc. Ecol. 2017, 33, 323–340. [Google Scholar] [CrossRef]
- Barnett, G. Liveable Neighbourhoods—A Western Australian Government Sustainable Cities Initiative; Western Australian Planning Commission: Perth, Australia, 2000; p. 88. [Google Scholar]
- Cheshmehzangi, A.; Dawodu, A. Sustainable Urban Development in the Age of Climate Change: People: The Cure or Curse; Springer: Berlin/Heidelberg, Germany, 2018. [Google Scholar]
- Newman, P.; Kosonen, L.; Kenworthy, J. Theory of urban fabrics: Planning the walking, transit/public transport and automobile/motor car cities for reduced car dependency. Town Plan. Rev. 2016, 87, 429–458. [Google Scholar] [CrossRef]
- Van Der Ryn, S.; Calthorpe, P. Sustainable Communities—A New Design Synthesis for Cities, Suburbs, and Towns; Sierra Club: San Francisco, CA, USA, 1986; Volume 6. [Google Scholar]
- Ewing, R.; Cervero, R. Travel and the Built Environment: A Synthesis. Transp. Res. Rec. J. Transp. Res. Board 2001, 1780, 87–114. [Google Scholar] [CrossRef]
- Keall, M.D.; Shaw, C.; Chapman, R.; Howden-Chapman, P. Reductions in carbon dioxide emissions from an intervention to promote cycling and walking: A case study from New Zealand. Transp. Res. Part D Transp. Environ. 2018, 65, 687–696. [Google Scholar] [CrossRef]
- Molina-Garcí, A.Q.J.; Adams, M.A.; Conway, T.L.; Sallis, J.F. Neighborhood Built Environment and Socio-Economic Status in Relation to Multiple Health Outcomes in Adolescents. Available online: https://www.sciencedirect.com/science/article/abs/pii/S0091743517303122 (accessed on 1 January 2021).
- Arvidsson, D.; Naomi, K.; Henrik, O.; Kristina, S. Physical activity and concordance between objective and perceived walkability. Med. Sci. Sports Exerc. 2012, 44, 280–287. [Google Scholar] [CrossRef] [PubMed]
- Hinckson, E.; Cerin, E.; Mavoa, S.; Smith, M.; Badland, H.; Stewart, T.; Duncan, S.; Schofield, G. Associations of the perceived and objective neighborhood environment with physical activity and sedentary time in New Zealand adolescents. Int. J. Behav. Nutr. Phys. Act. 2017, 14, 145. [Google Scholar] [CrossRef]
- Rogers, S.H.; Gardner, K.H.; Carlson, C.H. Social Capital and Walkability as Social Aspects of Sustainability. Sustain. 2013, 5, 3473–3483. [Google Scholar] [CrossRef]
- Pivo, G.; Fisher, J.D. The Walkability Premium in Commercial Real Estate Investments. Real Estate Econ. 2011, 39, 185–219. [Google Scholar] [CrossRef]
- Speck, J. Walkable City Rules: 101 Steps to Making Better Places; Island Press: Washington, DC, USA, 2018. [Google Scholar]
- Jacobs, J. The Death and Life of Great American Cities; Random House: New York, NY, USA, 1961. [Google Scholar]
- Chang, L.-Y.; Chu, H.-C.; Lin, D.-J.; Lui, P. Analysis of Freeway Accident Frequency using Multivariate Adaptive Regression Splines. Procedia Eng. 2012, 45, 824–829. [Google Scholar] [CrossRef]
- Trudeau, D. A typology of New Urbanism neighborhoods. J. Urban. Int. Res. Placemaking Urban Sustain. 2013, 6, 113–138. [Google Scholar] [CrossRef]
- Rodríguez, D.A.; Khattak, A.J.; Evenson, K.R. Can New Urbanism Encourage Physical Activity?: Comparing a New Urbanist Neighborhood with Conventional Suburbs. J. Am. Plan. Assoc. 2006, 72, 43–54. [Google Scholar] [CrossRef]
- Ewing, R.; Cervero, R. Travel and the built environment: A meta-analysis. J. Am. Plan. Assoc. 2010, 76, 265–294. [Google Scholar] [CrossRef]
- WHO. WHO Premature NCD Deaths. Available online: https://www.who.int/gho/ncd/mortality_morbidity/ncd_premature_text/en/ (accessed on 5 January 2021).
- Mabry, R. Urbanisation and Physical Activity in the GCC: A Case Study of Oman. Available online: https://www.semanticscholar.org/paper/Urbanisation-and-physical-activity-in-the-GCC%3A-a-of-Mabry/4057d708a1cf6b07ccc1945b30b26d6779e56159 (accessed on 1 January 2021).
- Mabry, R.M.; Koohsari, M.J.; Bull, F.; Owen, N. A systematic review of physical activity and sedentary behaviour research in the oil-producing countries of the Arabian Peninsula. BMC Public Health 2016, 16, 1–22. [Google Scholar] [CrossRef]
- Mabry, R.M.; Morsi, M.; Owen, N. Descriptive Epidemiology of Sitting Time in Omani Men and Women: A Known Risk Factor for Non-Communicable Diseases. Oman Med. J. 2017, 32, 233–239. [Google Scholar] [CrossRef]
- Sultanate of Oman Ministry of Health. Health Vision 2050 Sultanate of Oman. Available online: https://www.moh.gov.om/documents/16506/119833/Health+Vision+2050/7b6f40f3-8f93-4397-9fde-34e04026b829 (accessed on 1 January 2021).
- Bourdeaudhuij, I.D.; Van Dyck, D.; Salvo, D.; Davey, R.; Reis, R.S.; Schofield, G.; Sarmiento, O.L.; Mitas, J.; Christiansen, L.B.; MacFarlane, D. International study of perceived neighbourhood environmental attributes and Body Mass Index: IPEN Adult study in 12 countries. Int. J. Behav. Nutr. Phys. Act. 2015, 12, 1–10. [Google Scholar] [CrossRef] [PubMed]
- Van Dyck, D.; Cerin, E.; De Bourdeaudhuij, I.; Hinckson, E.; Reis, R.S.; Davey, R.; Sarmiento, O.L.; Mitas, J.; Troelsen, J.; Macfarlane, D.; et al. International study of objectively measured physical activity and sedentary time with body mass index and obesity: IPEN adult study. Int. J. Obes. 2015, 39, 199–207. [Google Scholar] [CrossRef]
- Van Dyck, D.; Cardon, G.; Deforche, B.; Owen, N.; Sallis, J.F.; De Bourdeaudhuij, I. Neighborhood Walkability and Sedentary Time in Belgian Adults. Am. J. Prev. Med. 2010, 39, 25–32. [Google Scholar] [CrossRef] [PubMed]
- Kerr, J.; Sallis, J.F.; Owen, N.; De Bourdeaudhuij, I.; Cerin, E.; Sugiyama, T.; Reis, R.; Sarmiento, O.; Frömel, K.; Mitás, J.; et al. Advancing Science and Policy Through a Coordinated International Study of Physical Activity and Built Environments: IPEN Adult Methods. J. Phys. Act. Health 2013, 10, 581–601. [Google Scholar] [CrossRef]
- Kerr, J.; Emond, J.A.; Badland, H.; Reis, R.; Sarmiento, O.L.; Carlson, J.; Sallis, J.F.; Cerin, E.; Cain, K.L.; Conway, T.; et al. Perceived Neighborhood Environmental Attributes Associated with Walking and Cycling for Transport among Adult Residents of 17 Cities in 12 Countries: The IPEN Study. Environ. Health Perspect. 2016, 124, 290–298. [Google Scholar] [CrossRef]
- Hagstromer, M.S.M.; Hagströmer, M.; Oja, P.; Sjöström, M. The International Physical Activity Questionnaire (IPAQ): A study of concurrent and construct validity. Public Health Nutr. 2006, 9, 755–762. [Google Scholar] [CrossRef] [PubMed]
- Giles-Corti, B.; Vernez-Moudon, A.; Reis, R.; Turrell, G.; Dannenberg, A.L.; Badland, H.; Foster, S.; Lowe, M.; Sallis, J.F.; Stevenson, M.; et al. City planning and population health: A global challenge. Lancet 2016, 388, 2912–2924. [Google Scholar] [CrossRef]
- Appolloni, L.; Corazza, M.V.; D’Alessandro, D. The Pleasure of Walking: An Innovative Methodology to Assess Appropriate Walkable Performance in Urban Areas to Support Transport Planning. Sustainability 2019, 11, 3467. [Google Scholar] [CrossRef]
- Park, K.; Ewing, R.; Sabouri, S.; Choi, D.-A.; Hamidi, S.; Tian, G. Guidelines for a Polycentric Region to Reduce Vehicle Use and Increase Walking and Transit Use. J. Am. Plan. Assoc. 2020, 86, 236–249. [Google Scholar] [CrossRef]
- WAPC. Liveable Neighbourhoods: A Western Government Sustainable Cities Initiative 2009; Western Australian Planning Commission: Perth, Australia, 2009. [Google Scholar]
- De Siqueira, G.L.; Petrovic, A.A.B.O.; Pasha, P. Where Omanis Walk? A Comparison between the Perception and the Morphology of the Built Environment in different Neighborhoods of Muscat. In Proceedings of the AMPS Proceedings Series 13. Constructing an Urban Future, Abu Dhabi University, Abu Dhabi, United Arab Emirates, 18–19 March 2018; pp. 64–72. [Google Scholar]
- Westland, J.C. Lower bounds on sample size in structural equation modeling. Electron. Commer. Res. Appl. 2010, 9, 476–487. [Google Scholar] [CrossRef]
- Hair, J.F.; Ringle, C.M.; Sarstedt, M. PLS-SEM: Indeed a Silver Bullet. J. Mark. Theory Pr. 2011, 19, 139–152. [Google Scholar] [CrossRef]
- Henseler, J.; Chin, W.W. A Comparison of Approaches for the Analysis of Interaction Effects Between Latent Variables Using Partial Least Squares Path Modeling. Struct. Equ. Model. A Multidiscip. J. 2010, 17, 82–109. [Google Scholar] [CrossRef]
- Haenlein, M.; Kaplan, A.M. A beginner’s guide to partial least squares analysis. Underst. Stat. 2004, 3, 283–297. [Google Scholar] [CrossRef]
- Hair, J.F., Jr.; Sarstedt, M.; Hopkins, L.; Kuppelwieser, V.G. Partial least squares structural equation modeling (PLS-SEM). Eur. Bus. Rev. 2014, 26, 106–121. [Google Scholar] [CrossRef]
- Garson, D. Partial Least Squares: Regression & Structural Equation Modeling; Statistical Associates Publishing: Asheboro, NC, USA, 2016. [Google Scholar]
- Ali, F.; Kim, W.G.; Ryu, K. The effect of physical environment on passenger delight and satisfaction: Moderating effect of national identity. Tour. Manag. 2016, 57, 213–224. [Google Scholar] [CrossRef]
- Henseler, J.; Ringle, C.M.; Sinkovics, R.R. The use of partial least squares path modeling in international marketing. In New Challenges to International Marketing; Emerald Group Publishing Limited: Bingley, UK, 2009; Volume 20, pp. 277–319. [Google Scholar]
- Hair, J.F.; Sarstedt, M.; Ringle, C.M.; Mena, J.A. An assessment of the use of partial least squares structural equation modeling in marketing research. J. Acad. Mark. Sci. 2012, 40, 414–433. [Google Scholar] [CrossRef]
- Esposito Vinzi, V.; Chin, W.W.; Henseler, J.; Wang, H. Handbook of Partial Least Squares: Concepts, Methods and Applications; Springer: Berlin/Heidelberg, Germany, 2010. [Google Scholar]
- Fornell, C.; Larcker, D.F. Evaluating structural equation models with unobservable variables and measurement error. J. Mark. Res. 1981, 18, 39–50. [Google Scholar] [CrossRef]
- Chin, W.W. The partial least squares approach to structural equation modeling. Mod. Methods Bus. Res. 1998, 295, 295–336. [Google Scholar]
- Barclay, C.; Thompson, D.; dan Higgins, R. The Partial Least Squares (PLS) Approach to Causal Modeling: Personal Computer Adoption and Use an Illustration. Technol. Stud. 1995, 2, 285–309. [Google Scholar]
- Liu, Y. A new antihypertensive drug ameliorate insulin resistance. Acta Pharmacol. Sin. 2012, 33, 429–430. [Google Scholar] [CrossRef] [PubMed]
- Kushary, D. Bootstrap Methods and their Application. Technometrics 2000, 42, 216–217. [Google Scholar] [CrossRef]
- Akter, S.; D’Ambra, J.; Ray, P. An Evaluation of PLS based Complex Models: The Roles of Power Analysis, Predictive Relevance and GoF Index. In Proceedings of the Renaissance of Information Technology for Sustainability and Global Competitiveness, 17th Americas Conference on Information Systems (AMCIS 2011), Detroit, MI, USA, 4–8 August 2011. [Google Scholar]
- Lleras, C. Path Analysis. Encycl. Soc. Meas. 2005, 3, 25–30. [Google Scholar] [CrossRef]
- Aibinu, A.A.; Al-Lawati, A.M. Using PLS-SEM technique to model construction organizations’ willingness to participate in e-bidding. Autom. Constr. 2010, 19, 714–724. [Google Scholar] [CrossRef]
- Cohen, J.; Cohen, P.; West, S.G.; Aiken, L.S. Applied Multiple Regression/Correlation Analysis for the Behavioral Sciences; Routledge: London, UK, 2013. [Google Scholar]
- Henseler, J.; Sarstedt, M. Goodness-of-fit indices for partial least squares path modeling. Comput. Stat. 2013, 28, 565–580. [Google Scholar] [CrossRef]
- Wetzels, M.; Odekerken-Schröder, G.; Van Oppen, C. Using PLS path modeling for assessing hierarchical construct models: Guidelines and empirical illustration. MIS Q. 2009, 177–195. [Google Scholar] [CrossRef]
- Taleai, M.; Amiri, E.T. Spatial multi-criteria and multi-scale evaluation of walkability potential at street segment level: A case study of tehran. Sustain. Cities Soc. 2017, 31, 37–50. [Google Scholar] [CrossRef]
- Mitchell, R. Is physical activity in natural environments better for mental health than physical activity in other environments? Soc. Sci. Med. 2013, 91, 130–134. [Google Scholar] [CrossRef]
- Sallis, J.F.; Johnson, M.F.; Calfas, K.J.; Caparosa, S.; Nichols, J.F. Assessing Perceived Physical Environmental Variables that May Influence Physical Activity. Res. Q. Exerc. Sport 1997, 68, 345–351. [Google Scholar] [CrossRef]
- Villanueva, K.; Knuiman, M.; Nathan, A.; Giles-Corti, B.; Christian, H.; Foster, S.; Bull, F. The impact of neighborhood walkability on walking: Does it differ across adult life stage and does neighborhood buffer size matter? Health Place 2014, 25, 43–46. [Google Scholar] [CrossRef]
- Bauman, A.E.; Smith, B.; Stoker, L.; Bellew, B.; Booth, M. Geographical influences upon physical activity participation: Evidence of a ‘coastal effect’. Aust. N. Z. J. Public Health 1999, 23, 322–324. [Google Scholar] [CrossRef] [PubMed]
- Wright, C.; MacDougall, C.; Atkinson, R.; Booth, B. Exercise in Daily Life, Supportive Environments. Report of a National Heart Foundation Research Project Funded by the Commonwealth Department of Health and Family Services; Commonwealth of Australia: Canberra, Australia, 1996. [Google Scholar]
- Hawthorne, W. Why Ontarians Walk, Why Ontarians Don’t Walk More: A Study of the Walking Habits of Ontarians; Energy Probe Research Foundation: Toronto, ON, Canada, 1989. [Google Scholar]
- Geurs, K.T.; Van Wee, B. Accessibility evaluation of land-use and transport strategies: Review and research directions. J. Transp. Geogr. 2004, 12, 127–140. [Google Scholar] [CrossRef]
- Heim, B.; Joosten, M.; Von Richthofen, A.; Rupp, F. Land-allocation and clan-formation in modern residential developments in Oman. City Territ. Arch. 2018, 5, 8. [Google Scholar] [CrossRef]
- Larco, N.; Steiner, B.; Stockard, J.; West, A. Pedestrian-friendly environments and active travel for residents of multifamily housing: The role of preferences and perceptions. Environ. Behav. 2012, 44, 303–333. [Google Scholar] [CrossRef]
- Ball, K.; Bauman, A.; Leslie, E.; Owen, N. Perceived environmental aesthetics and convenience and company are associated with walking for exercise among Australian adults. Prev. Med. 2001, 33, 434–440. [Google Scholar] [CrossRef]
- Ewing, R.; Handy, S. Measuring the Unmeasurable: Urban Design Qualities Related to Walkability. J. Urban Des. 2009, 14, 65–84. [Google Scholar] [CrossRef]
- Hooper, P.; Foster, S.; Bull, F.; Knuiman, M.; Christian, H.; Timperio, A.; Wood, L.; Trapp, G.; Boruff, B.; Francis, J. Living liveable? RESIDE’s evaluation of the “Liveable Neighborhoods” planning policy on the health supportive behaviors and wellbeing of residents in Perth, Western Australia. SSM Popul. Health 2020, 10, 100538. [Google Scholar] [CrossRef]
- Hakimian, P.; Lak, A. Adaptation and reliability of neighborhood environment walkability scale (NEWS) for Iran: A questionnaire for assessing environmental correlates of physical activity. Med. J. Islam. Repub. Iran 2016, 30, 427. [Google Scholar]
- Cerin, E.; Sit, C.H.; Cheung, M.-C.; Ho, S.-Y.; Lee, L.-C.J.; Chan, W.-M. Reliable and valid News for Chinese seniors: Measuring perceived neighborhood attributes related to walking. Int. J. Behav. Nutr. Phys. Act. 2010, 7, 84. [Google Scholar] [CrossRef] [PubMed]
- Malavasi, L.M.; de Fatima, S.D.M.; Both, J. Neighborhood Walkability Scale (news-Brazilian Version): Construct Validity Board. Med. Sci. Sports Exerc. 2007, 39, S189–S190. [Google Scholar] [CrossRef]
- Hyunshik, K.; Younglae, C.; Jiameng, M.; Kuam Hyung, M.M.; Sunkyoung, L. The neighborhood environment walkability scale for the republic of Korea: Reliability and relationship with walking. Iran. J. Public Health 2016, 45, 1427. [Google Scholar]
- Cervero, R.; Kockelman, K. Travel demand and the 3Ds: Density, diversity, and design. Transp. Res. Part D Transp. Environ. 1997, 2, 199–219. [Google Scholar] [CrossRef]


| Group/Construct | Item | Description of Item |
|---|---|---|
| Land Use Mix (LUM) | LUM1 | The stores are within an easy walking distance of my house. |
| LUM2 | There are major barriers to walk in my local area that make it hard to get from place to place (for example, freeways, rivers, etc.). | |
| LUM3 | There are many places to go within an easy walking distance of my home. | |
| LUM4 | It’s easy to walk to a transit stop (bus, taxi) from my home. | |
| Street Connectivity (SC) | SC1 | Streets in my neighborhood do not have many cul-de-sacs. |
| SC2 | The distance between intersections in my neighborhood is usually short (90 m or less; length of a football field). | |
| SC3 | There are many alternative routes to get from place to place in my neighborhood (I don’t have to go the same way every time). | |
| Pedestrian Infrastructure (PI) | PI1 | There are sidewalks on most of the streets in my neighborhood. |
| PI2 | The walking paths are well shaded in my neighborhood. | |
| PI3 | There are trees along the streets in my neighborhood. | |
| Aesthetics (AS) | AS1 | There is too much garbage near the paths that make it unpleasant to walk in my neighborhood. |
| AS2 | There are attractive natural sights and attractive facades in my neighborhood. | |
| Safety (SF) | SF1 | There is so much traffic along the streets that it makes it unpleasant or difficult to walk in my neighborhood. |
| SF2 | There are crosswalks and pedestrian signals to help walkers cross the busy streets. | |
| SF3 | My neighborhoods’ streets are well lit at night. | |
| SF4 | The speed of traffic on most streets is usually low. | |
| Perceived Residential Density (PRD) | PRD1 | Typology of buildings in the immediate neighborhood (i.e., single-family villas, twin villas, Arab style houses, apartment buildings). |
| Constructs | First Iteration | Final Iteration | |||||
|---|---|---|---|---|---|---|---|
| Items | Loading | AVE | CR | Loading | AVE | CR | |
| Land Use Mix (LUM) | LUM1 LUM2 LUM3 LUM4 | 0.840 0.650 0.770 0.583 | 0.515 | 0.722 | 0.840 0.650 0.770 0.583 | 0.515 | 0.722 |
| Street Connectivity (SC) | SC1 SC2 SC3 | 0.902 0.891 0.630 | 0.668 | 0.855 | 0.902 0.891 0.630 | 0.668 | 0.855 |
| Pedestrian Infrastructure (PI) | PI1 PI2 PI3 | 0.706 0.716 0.876 | 0.592 | 0.812 | 0.706 0.716 0.876 | 0.592 | 0.812 |
| Aesthetics (AS) | AS1 AS2 | 0.790 0.713 | 0.566 | 0.722 | 0.790 0.713 | 0.566 | 0.722 |
| Safety (SF) | SF1 SF2 SF3 SF4 | 0.451 0.105 0.975 0.973 | 0.528 | 0.769 | 0.510 Omitted 0.975 0.973 | 0.70 | 0.865 |
| Perceived Residential Density (PRD) | PRD1 | 1.0 | 1.0 | 1.0 | 1.0 | 1.0 | 1.0 |
| LUM | ST | PI | AS | SF | PRD | |
|---|---|---|---|---|---|---|
| LUM1 | 0.840 | 0.393 | 0.214 | 0.302 | 0.218 | 0.289 |
| LUM2 | 0.650 | 0.125 | 0.142 | 0.085 | 0.391 | 0.057 |
| LUM3 | 0.770 | 0.345 | 0.321 | 0.396 | 0.174 | 0.257 |
| LUM4 | 0.583 | 0.212 | 0.161 | 0.075 | 0.149 | 0.116 |
| ST1 | 0.284 | 0.902 | 0.173 | 0.328 | 0.173 | 0.290 |
| ST2 | 0.198 | 0.891 | 0.127 | 0.297 | 0.155 | 0.263 |
| ST3 | 0.448 | 0.630 | 0.069 | 0.247 | 0.233 | 0.245 |
| PI1 | 0.240 | 0.079 | 0.706 | 0.328 | −0.080 | 0.192 |
| PI2 | 0.149 | 0.084 | 0.716 | 0.193 | −0.009 | 0.125 |
| PI3 | 0.271 | 0.165 | 0.786 | 0.354 | −0.023 | 0.247 |
| AS1 | 0.258 | 0.285 | 0.415 | 0.790 | −0.050 | 0.353 |
| AS2 | 0.217 | 0.256 | 0.155 | 0.713 | 0.097 | 0.210 |
| SF1 | 0.066 | 0.205 | 0.011 | 0.012 | 0.451 | 0.189 |
| SF3 | 0.016 | 0.309 | −0.043 | 0.077 | 0.975 | 0.205 |
| SF4 | 0.004 | 0.310 | 0.061 | 0.076 | 0.973 | 0.201 |
| PRD1 | 0.260 | 0.329 | 0.256 | 0.380 | 0.073 | 1.00 |
| Abbreviation | Constructs | Path Coefficient (β) | t-Value |
|---|---|---|---|
| LUM | Land Use Mix | 0.248 | 8.37 * |
| ST | Street Connectivity | 0.075 | 2.73 * |
| PI | Pedestrian Infrastructure | 0.048 | 1.49 |
| AS | Aesthetics | 0.193 | 5.66 * |
| SF | Safety | 0.121 | 4.41 * |
| PRD | Perceived Residential Density | 0.150 | 5.55 * |
Publisher’s Note: MDPI stays neutral with regard to jurisdictional claims in published maps and institutional affiliations. |
© 2021 by the authors. Licensee MDPI, Basel, Switzerland. This article is an open access article distributed under the terms and conditions of the Creative Commons Attribution (CC BY) license (http://creativecommons.org/licenses/by/4.0/).
Share and Cite
Siqueira, G.d.; Adeel, A.; Pasha, P.; Balushi, A.A.; Shah, S.A.R. Sustainable Transportation and Policy Development: A Study for Impact Analysis of Mobility Patterns and Neighborhood Assessment of Walking Behavior. Sustainability 2021, 13, 1871. https://doi.org/10.3390/su13041871
Siqueira Gd, Adeel A, Pasha P, Balushi AA, Shah SAR. Sustainable Transportation and Policy Development: A Study for Impact Analysis of Mobility Patterns and Neighborhood Assessment of Walking Behavior. Sustainability. 2021; 13(4):1871. https://doi.org/10.3390/su13041871
Chicago/Turabian StyleSiqueira, Gustavo de, Ahmad Adeel, Petrit Pasha, Amal Al Balushi, and Syyed Adnan Raheel Shah. 2021. "Sustainable Transportation and Policy Development: A Study for Impact Analysis of Mobility Patterns and Neighborhood Assessment of Walking Behavior" Sustainability 13, no. 4: 1871. https://doi.org/10.3390/su13041871
APA StyleSiqueira, G. d., Adeel, A., Pasha, P., Balushi, A. A., & Shah, S. A. R. (2021). Sustainable Transportation and Policy Development: A Study for Impact Analysis of Mobility Patterns and Neighborhood Assessment of Walking Behavior. Sustainability, 13(4), 1871. https://doi.org/10.3390/su13041871