
Technical Efficiency in the European Dairy Industry: Can We Observe Systematic Failures in the Efficiency of Input Use?


Abstract
1. Introduction
2. Theoretical Background
3. Materials and Methods
3.1. Methodology Used in the Study
3.1.1. Input Distance Function
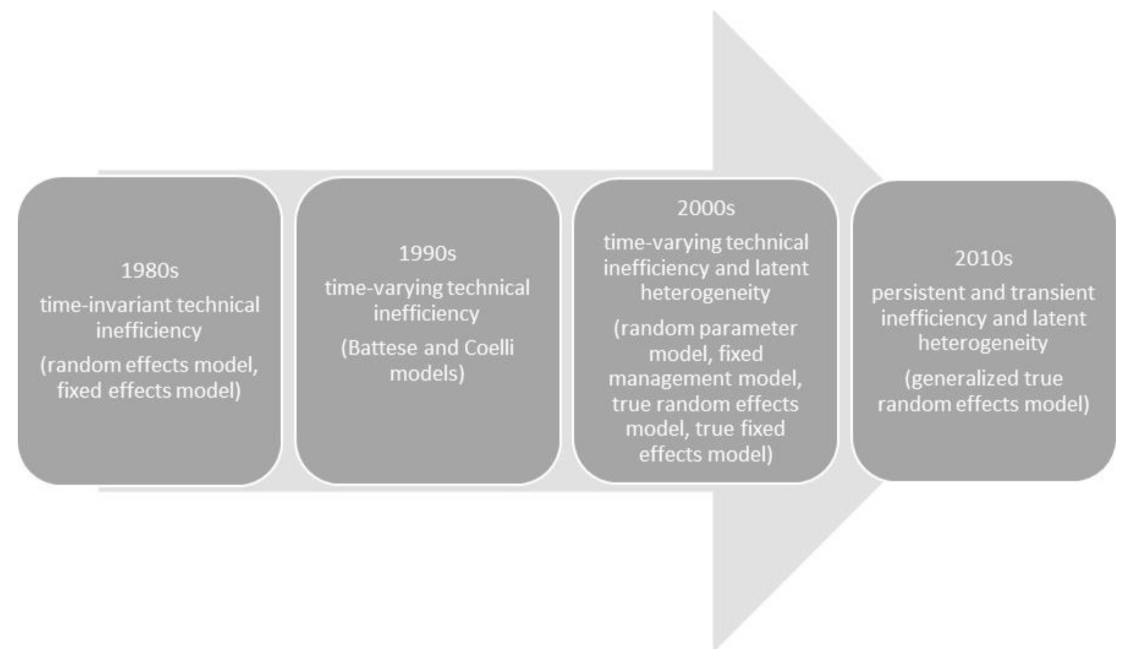
3.1.2. Heterogeneity in Technology
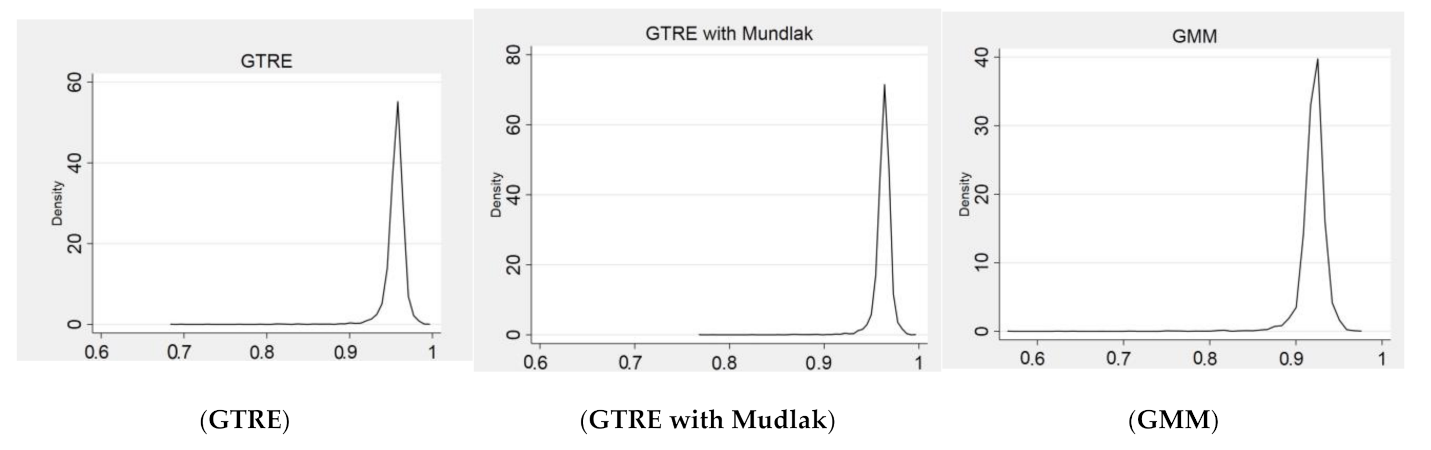
3.1.3. Estimation Strategy
3.2. Data Used in the Study
4. Results
5. Discussion
6. Conclusions
Author Contributions
Funding
Institutional Review Board Statement
Informed Consent Statement
Data Availability Statement
Acknowledgments
Conflicts of Interest
References
- Eurostat. Annual Detailed Enterprise Statistics for Industry (NACE Rev. 2, B-E) [sbs_na_ind_r2]. Last Update: 11 October 2020. Available online: https://appsso.eurostat.ec.europa.eu/nui/show.do?dataset=sbs_na_ind_r2&lang=en (accessed on 15 November 2020).
- European Commission. The Competitive Position of the European Food and Drink Industry; Publications Office of the European Union: Luxembourg, 2016. [Google Scholar]
- Kapelko, M. Measuring productivity change accounting for adjustment costs: Evidence from the food industry in the European Union. Ann. Oper. Res. 2019, 278, 215–234. [Google Scholar] [CrossRef]
- Nakat, Z.; Bou-Mitri, C. COVID-19 and the food industry: Readiness assessment. Food Control 2021, 121, 107661. [Google Scholar] [CrossRef] [PubMed]
- Allendorf, J.; Hirsch, S. Dynamic productivity growth in the European food processing industry. In Proceedings of the 55th Annual Conference of German Association of Agricultural Economists (GEWISOLA), Giessen, Germany, 23–25 September 2015. [Google Scholar]
- Čechura, L.; Hockmann, H.; Kroupová, Z. Productivity and Efficiency of European Food Processing Industry; COMPETE Working Paper N7; IAMO: Halle, Germany, 2014. [Google Scholar]
- Náglová, Z.; Šimpachová Pechrová, M. Subsidies and technical efficiency of Czech food processing industry. Agric. Econ. Czech 2019, 65, 151–159. [Google Scholar] [CrossRef]
- Čechura, L.; Hockmann, H. Heterogeneity in Production Structures and Efficiency: An Analysis of the Czech Food Processing Industry. Pac. Econ. Rev. 2017, 22, 702–719. [Google Scholar] [CrossRef]
- Rudinskaya, T. Heterogeneity and efficiency of food processing companies in the Czech Republic. Agric. Econ. Czech 2017, 63, 411–420. [Google Scholar] [CrossRef]
- Rezitis, A.N.; Kalantzi, M.A. Investigating Technical Efficiency and Its Determinants by Data Envelopment Analysis: An Application in the Greek Food and Beverages Manufacturing Industry. Agribus. Int. J. 2015, 37. [Google Scholar] [CrossRef]
- Špička, J. The efficiency improvement of central European corporate milk processors in 2008–2013. AGRIS Line Pap. Econ. Inform. 2015, 7, 175–188. [Google Scholar] [CrossRef][Green Version]
- Popović, R.; Panić, D. Technical Efficiency of Serbian Dairy Processing Industry. Econ. Agric. 2018, 65, 569–581. [Google Scholar] [CrossRef]
- Setiawan, M.; Emvalomatis, G.; Oude Lansink, A. The relationship between technical efficiency and industrial concentration: Evidence from the Indonesian food and beverages industry. J. Asian Econ. 2012, 23, 466–475. [Google Scholar] [CrossRef]
- Soboh, R.A.M.E.; Oude Lansink, A.; Van Dijk, G. Efficiency of European Dairy Processing Firm. NJAS Wagening. J. Life Sci. 2014, 70–71, 53–59. [Google Scholar] [CrossRef]
- Dimara, E.; Skuras, D.; Tsekouras, K.; Tzelepid, D. Productive efficiency and firm exit in the food sector. Food Policy 2008, 33, 185–196. [Google Scholar] [CrossRef]
- Baran, J. Efficiency of the production scale of Polish dairy companies based on data envelopment analysis. Oeconomia 2013, 12, 5–13. [Google Scholar]
- Kapelko, M.; Oude Lansink, A.; Stefanou, S.H. The impact of the 2008 financial crisis on dynamic productivity growth of the Spanish food manufacturing industry. An impulse response analysis. Agric. Econ. 2017, 48, 561–571. [Google Scholar] [CrossRef]
- Kapelko, M.; Oude Lansink, A.; Stefanou, S.H. Effect of Food Regulation on the Spanish Food Processing Industry: A Dynamic Productivity Analysis. PLoS ONE 2015, 10, e0128217. [Google Scholar] [CrossRef]
- Rudinskaya, T.; Kuzmenko, E. Investments, Technical Change and Efficiency: Empirical Evidence from Czech Food Processing. AGRIS Line Pap. Econ. Inform. 2019, 11, 93–103. [Google Scholar] [CrossRef]
- Čechura, L. Technological change in the Czech food processing industry: What did we experience in the last decade? In Proceedings of the 131st EAAE Seminar, ‘Innovation for Agricultural Competitiveness and Sustainability of Rural Areas’, Prague, Czech Republic, 18–19 September 2012. [Google Scholar]
- Kapelko, M.; Oude Lansink, A. Dynamic multi-directional inefficiency analysis of European dairy manufacturing firms. Eur. J. Oper. Res. 2017, 257, 338–344. [Google Scholar] [CrossRef]
- Kapelko, M.; Oude Lansink, A. Technical Efficiency of the Spanish Dairy Processing Industry: Do Size and Exporting Matter? In Efficiency Measures in the Agricultural Sector; Mendes, A., Soares da Silva, E.L.D.G., Azevedo Santos, J., Eds.; Springer: Dordrecht, The Netherlands, 2013; pp. 93–106. [Google Scholar] [CrossRef]
- Koopmans, T.C. Analysis of Production as an Efficient Combination of Activities. In Activity Analysis of Production and Allocation (Proceedings of Conference); Koopmans, T.C., Ed.; John Wiley & Sons, Inc.: New York, NY, USA, 1951; pp. 33–97. [Google Scholar]
- Debreu, G. The coefficient of resource utilization. Econometrica 1951, 19, 273–292. [Google Scholar] [CrossRef]
- Farrel, M.J. The Measurement of Productive Efficiency. J. R. Stat. Soc. 1957, 120, 253–290. [Google Scholar] [CrossRef]
- Fried, H.O.; Knox Lovell, C.A.; Schmidt, S.S. The Measurement of Productive Efficiency and Productivity Growth; Oxford University Press: New York, NY, USA, 2008. [Google Scholar] [CrossRef]
- Coelli, T.J.; Rao, D.S.P.; O’Donnell, C.J.; Battese, G.E. An Introduction to Efficiency and Productivity Analysis, 2nd ed.; Springer: New York, NY, USA, 2005. [Google Scholar] [CrossRef]
- Kumbhakar, S.C.; Wang, H.-J.; Horncastle, A.P. A Practitioner’s Guide to Stochastic Frontier Analysis Using Stata; Cambridge University Press: New York, NY, USA, 2015. [Google Scholar] [CrossRef]
- Meeusen, W.; van den Broeck, J. Efficiency Estimation from Cobb-Douglas Production Functions with Composed Error. Int. Econ. Rev. 1977, 18, 435–444. [Google Scholar] [CrossRef]
- Aigner, D.; Lovell, K.C.A.; Schmidt, P. Formulation and estimation of stochastic frontier production function model. J. Econom. 1977, 6, 21–37. [Google Scholar] [CrossRef]
- Alem, H. Effects of model specification, short-run, and long-run inefficiency: An empirical analysis of stochastic frontier models. Agric. Econ. Czech 2018, 64, 508–516. [Google Scholar] [CrossRef]
- Bartolucci, F.; Belotti, F.; Peracchi, F. Testing for time-invariant unobserved heterogeneity in generalized linear models for panel data. J. Econom. 2015, 184, 111–123. [Google Scholar] [CrossRef]
- Tsionas, M.; Kumbhakar, S. Firm-Heterogeneity, Persistent and Transient Technical Inefficiency: A generalized true random-effects model. J. Appl. Econom. 2014, 29, 110–132. [Google Scholar] [CrossRef]
- Badunenko, O.; Kumbhakar, S.C. When, where and how to estimate persistent and transient efficiency in stochastic frontier panel data models. Eur. J. Oper. Res. 2016, 255, 272–287. [Google Scholar] [CrossRef]
- Pisulewski, A.; Marzec, J. Heterogeneity, transient and persistent technical efficiency of Polish crop farms. Span. J. Agric. Res. 2019, 17, e0106. [Google Scholar] [CrossRef]
- Njuki, E.; Bravo-Ureta, B.E. The economic cost of environmental regulation in U.S. dairy farming: A directional distance function approach. Am. J. Agric. Econ. 2015, 97, 1087–1106. [Google Scholar] [CrossRef]
- Kumbhakar, S.C.; Lien, G. Yardstick Regulation of Electricity Distribution—Disentangling Short-run and Long-run Inefficiencies. Energy J. 2017, 38, 17–37. [Google Scholar] [CrossRef]
- Filippini, M.; Greene, W. Persistent and transient productive inefficiency: A maximum simulated likelihood approach. J. Product. Anal. 2016, 45, 187–196. [Google Scholar] [CrossRef]
- Rashidghalam, M.; Heshmati, A.; Dashti, G.; Pishbahar, E. A Comparison of Panel Data Models in Estimating Technical Efficiency; IZA Discussion Paper No. 9807; IZA: Bonn, Germany, 2016. [Google Scholar]
- Caves, D.W.; Christensen, L.R.; Diewert, W.E. The Economic Theory of Index Numbers and the Measurement of Input, Output, and Productivity. Econometrica 1982, 50, 1393–1414. [Google Scholar] [CrossRef]
- Karagiannis, G.; Midmore, P.; Tzouvelekas, V. Parametric Decomposition of Output Growth Using a Stochastic Input Distance Function. Am. J. Agric. Econ. 2004, 86, 1044–1057. [Google Scholar] [CrossRef]
- Greene, W. Reconsidering heterogeneity in panel data estimators of the stochastic frontier model. J. Econom. 2005, 126, 269–303. [Google Scholar] [CrossRef]
- Irz, X.; Thirtle, C. Dual Technological Development in Botswana Agriculture: A Stochastic Input Distance Function Approach. J. Agric. Econ. 2005, 55, 455–478. [Google Scholar] [CrossRef]
- Singbo, A.; Larue, B. Scale Economies, Technical Efficiency, and the Sources of Total Factor Productivity Growth of Quebec Dairy Farms. Can. J. Agric. Econ. 2016, 64, 339–363. [Google Scholar] [CrossRef]
- Čechura, L.; Grau, A.; Hockmann, H.; Levkovych, I.; Kroupová, Z. Catching up or falling behind in Eastern European agriculture—The case of milk production. J. Agric. Econ. 2017, 68, 206–227. [Google Scholar] [CrossRef]
- Sipiläinen, T. Sources of productivity growth on Finnish dairy farms—Application of input distance function. Acta Agric. Scand. Sect. C 2007, 4, 65–67. [Google Scholar] [CrossRef]
- Lovell, K.C.A.; Richardson, S.; Travers, P.; Wood, L.L. Resources and Functionings: A New View of Inequality in Austria. In Models and Measurement of Welfare and Inequality; Eichhorn, W., Ed.; Springer: New York, NY, USA, 1994; pp. 787–807. [Google Scholar]
- Ullah, S.; Akhar, P.; Yaeferian, G. Dealing with endogeneity bias: The generalized method of moments (GMM). Ind. Mark. Manag. 2018, 71, 69–78. [Google Scholar] [CrossRef]
- Mundlak, Y. On the Pooling of Time Series and Cross Section Data. Econometrica 1978, 46, 69–85. [Google Scholar] [CrossRef]
- Kumbhakar, S.C.; Lien, G.; Hardaker, J.B. Technical efficiency in competing panel data models: A study of Norwegian grain farming. J. Product. Anal. 2014, 41, 321–337. [Google Scholar] [CrossRef]
- Bokusheva, B.; Čechura, L. Evaluating Dynamics, Sources and Drivers of Productivity Growth at the Farm Level; OECD Food, Agriculture and Fisheries Papers, No. 106; OECD Publishing: Paris, France, 2017. [Google Scholar]
- Arellano, M.; Bover, O. Another look at the instrumental variable estimation of error-components models. J. Econom. 1995, 68, 29–51. [Google Scholar] [CrossRef]
- Blundell, R.; Bond, S. Initial conditions and moment restrictions in dynamic panel data models. J. Econom. 1998, 87, 115–143. [Google Scholar] [CrossRef]
- Roodman, D. How to do xtabond2: An introduction to difference and system GMM in Stata. Stata J. 2009, 9, 86–136. [Google Scholar] [CrossRef]
- Hansen, L.P. Large Sample Properties of Generalized Method of Moments Estimator. Econometrica 1982, 50, 1029–1054. [Google Scholar] [CrossRef]
- Arellano, M.; Bond, S. Some tests of specification for panel data: Monte Carlo evidence and an application to employment equations. Rev. Econ. Stud. 1991, 58, 277–297. [Google Scholar] [CrossRef]
- Čechura, L.; Žáková Kroupová, Z.; Rumánková, L.; Jaghdani, T.J.; Samoggia, A.; Thakur, M. Assessment of Economics of Scale and Technical Change along the Food Chain; The VALUMICS project funded by EU Horizon 2020 G.A. No 727243 Deliverable, D5.6; Czech University of Life Sciences: Prague, Czech Republic, 2020. [Google Scholar]
- Baumol, W.J.; Panzar, J.C.; Willig, R.D. Contestable Markets and the Theory of Industry Structure; Harcourt Brace Jovanovich: New York, NY, USA, 1982. [Google Scholar]
- Török, Á.; Tóth, J.; Balogh, J.M. Push or Pull? The nature of innovation process in the Hungarian food SMEs. J. Innov. Knowl. 2019, 4, 234–239. [Google Scholar] [CrossRef]
- Kumbhakar, S.C.; Lien, G.; Flaten, O.; Tveterås, R. Impacts of Norwegian Milk Quotas on Output Growth: A Modified Distance Function Approach. J. Agric. Econ. 2008, 59, 350–369. [Google Scholar] [CrossRef]
- Diewert, W.E.; Wales, T.J. Flexible Functional Forms and Global Curvature Conditions. Econometrica 1987, 55, 43–68. [Google Scholar] [CrossRef]


| Study | Countries | Years | Method |
|---|---|---|---|
| Čechura and Hockmann [8] | CZ | 2003–2012 | Stochastic frontier analysis (SFA) |
| Čechura et al. [6] | AT, BE, BG, CZ, DE, DK, EE, ES, FI, FR, UK, GR, HU, IR, IT, LT, LV, NL, PL, PT, RO, SW, SL, SI, SR | 2003–2012 | SFA |
| Kapelko and Oude Lansink [21] | AT, BE, FI, FR, DE, LU, NL, NO, CH, BIH, BG, HR, CZ, EE, HU, PL, RO, SR, SL, SI, IT, PT, ES | 2005–2012 | Data envelopment analysis (DEA) |
| Kapelko and Oude Lankink [22] | ES | 2001–2009 | DEA |
| Rezitis and Kalandzi [10] | GR | 1984–2007 | DEA |
| Rudinskaya [9] | CZ | 2005–2012 | SFA |
| Soboh et al. [14] | BE, DK, FR, DE, IR, NL | 1995–2005 | SFA |
| Špička [11] | CZ, PL, SK | 2008–2013 | DEA |
| Country | AT | BE | CZ | DE | ES | FI | FR | IT | SW | UK | Total |
|---|---|---|---|---|---|---|---|---|---|---|---|
| I | 15 | 40 | 58 | 80 | 114 | 36 | 211 | 97 | 22 | 62 | 735 |
| N | 131 | 336 | 498 | 658 | 1108 | 285 | 1940 | 915 | 150 | 496 | 6517 |
| RS1 | 48 | 40 | 43 | 32 | 41 | 84 | 33 | 58 | 54 | 60 | 48 |
| RS2 | 44 | 74 | 79 | 59 | 82 | 97 | 48 | 95 | 70 | 90 | 63 |
| 10.5 | GTRE | GTRE with Mundlak | GMM | ||||||
|---|---|---|---|---|---|---|---|---|---|
| Variable | Coef. | St.Er. | P > |z| | Coef. | St.Er. | P > |z| | Coef. | St.Er. | P > |t| |
| ln_y | −0.9601 | 0.0064 | 0.0000 | −0.8886 | 0.0207 | 0.0000 | −0.9801 | 0.0039 | 0.0000 |
| ln_xL | 0.2976 | 0.0161 | 0.0000 | 0.3039 | 0.0230 | 0.0000 | 0.2620 | 0.0088 | 0.0000 |
| ln_xM | 0.6483 | 0.0146 | 0.0000 | 0.6375 | 0.0222 | 0.0000 | 0.6864 | 0.0084 | 0.0000 |
| t | −0.0074 | 0.0008 | 0.0000 | −0.0090 | 0.0009 | 0.0000 | −0.0069 | 0.0010 | 0.0000 |
| ln_y_2 | −0.0032 | 0.0057 | 0.5740 | −0.0007 | 0.0053 | 0.8890 | 0.0045 | 0.0052 | 0.3920 |
| ln_xL_2 | 0.0538 | 0.0072 | 0.0000 | 0.0582 | 0.0077 | 0.0000 | 0.0656 | 0.0127 | 0.0000 |
| ln_xM_2 | 0.1322 | 0.0098 | 0.0000 | 0.1326 | 0.0090 | 0.0000 | 0.1472 | 0.0080 | 0.0000 |
| ln_xLxM | −0.0847 | 0.0079 | 0.0000 | −0.0863 | 0.0077 | 0.0000 | −0.0949 | 0.0103 | 0.0000 |
| t_2 | 0.0005 | 0.0004 | 0.1400 | 0.0000 | 0.0003 | 0.9240 | 0.0009 | 0.0005 | 0.0780 |
| ln_yt | 0.0005 | 0.0005 | 0.2800 | 0.0008 | 0.0005 | 0.0950 | 0.0004 | 0.0010 | 0.6780 |
| ln_xLt | −0.0001 | 0.0011 | 0.9380 | 0.0003 | 0.0011 | 0.7700 | −0.0014 | 0.0030 | 0.6390 |
| ln_xMt | −0.0001 | 0.0012 | 0.9650 | −0.0004 | 0.0012 | 0.7760 | 0.0033 | 0.0026 | 0.1920 |
| ln_yxL | −0.0055 | 0.0073 | 0.4570 | −0.0016 | 0.0069 | 0.8200 | 0.0008 | 0.0079 | 0.9180 |
| ln_yxM | −0.0080 | 0.0059 | 0.1760 | −0.0101 | 0.0057 | 0.0750 | −0.0246 | 0.0069 | 0.0000 |
| _cons | −0.0714 | 0.0136 | 0.0000 | −0.0772 | 0.0135 | 0.0000 | −0.0915 | 0.0095 | 0.0000 |
| ln_y_gmean | −0.0867 | 0.0200 | 0.0000 | ||||||
| ln_xL_gmean | −0.0049 | 0.0201 | 0.8080 | ||||||
| ln_xM_gmean | −0.0013 | 0.0232 | 0.9550 | ||||||
| t_gmean | 0.0007 | 0.0066 | 0.9110 | ||||||
| Mean | Std.D. | Mean | Std.D. | Mean | Std.D. | ||||
| Overall TE | 0.9553 | 0.0139 | 0.9624 | 0.0099 | 0.9200 | 0.0179 | |||
| Transient TE | 0.9561 | 0.0139 | 0.9629 | 0.0099 | 0.9500 | 0.0177 | |||
| Persistent TE | 0.9992 | 0.0000 | 0.9994 | 0.0000 | 0.9684 | 0.0044 | |||
| Country | Overall Technical Efficiency | Transient Technical Efficiency | Persistent Technical Efficiency | |||||||||
|---|---|---|---|---|---|---|---|---|---|---|---|---|
| Mean | Std.Dev. | Min. | Max. | Mean | Std.Dev. | Min. | Max. | Mean | Std.Dev. | Min. | Max. | |
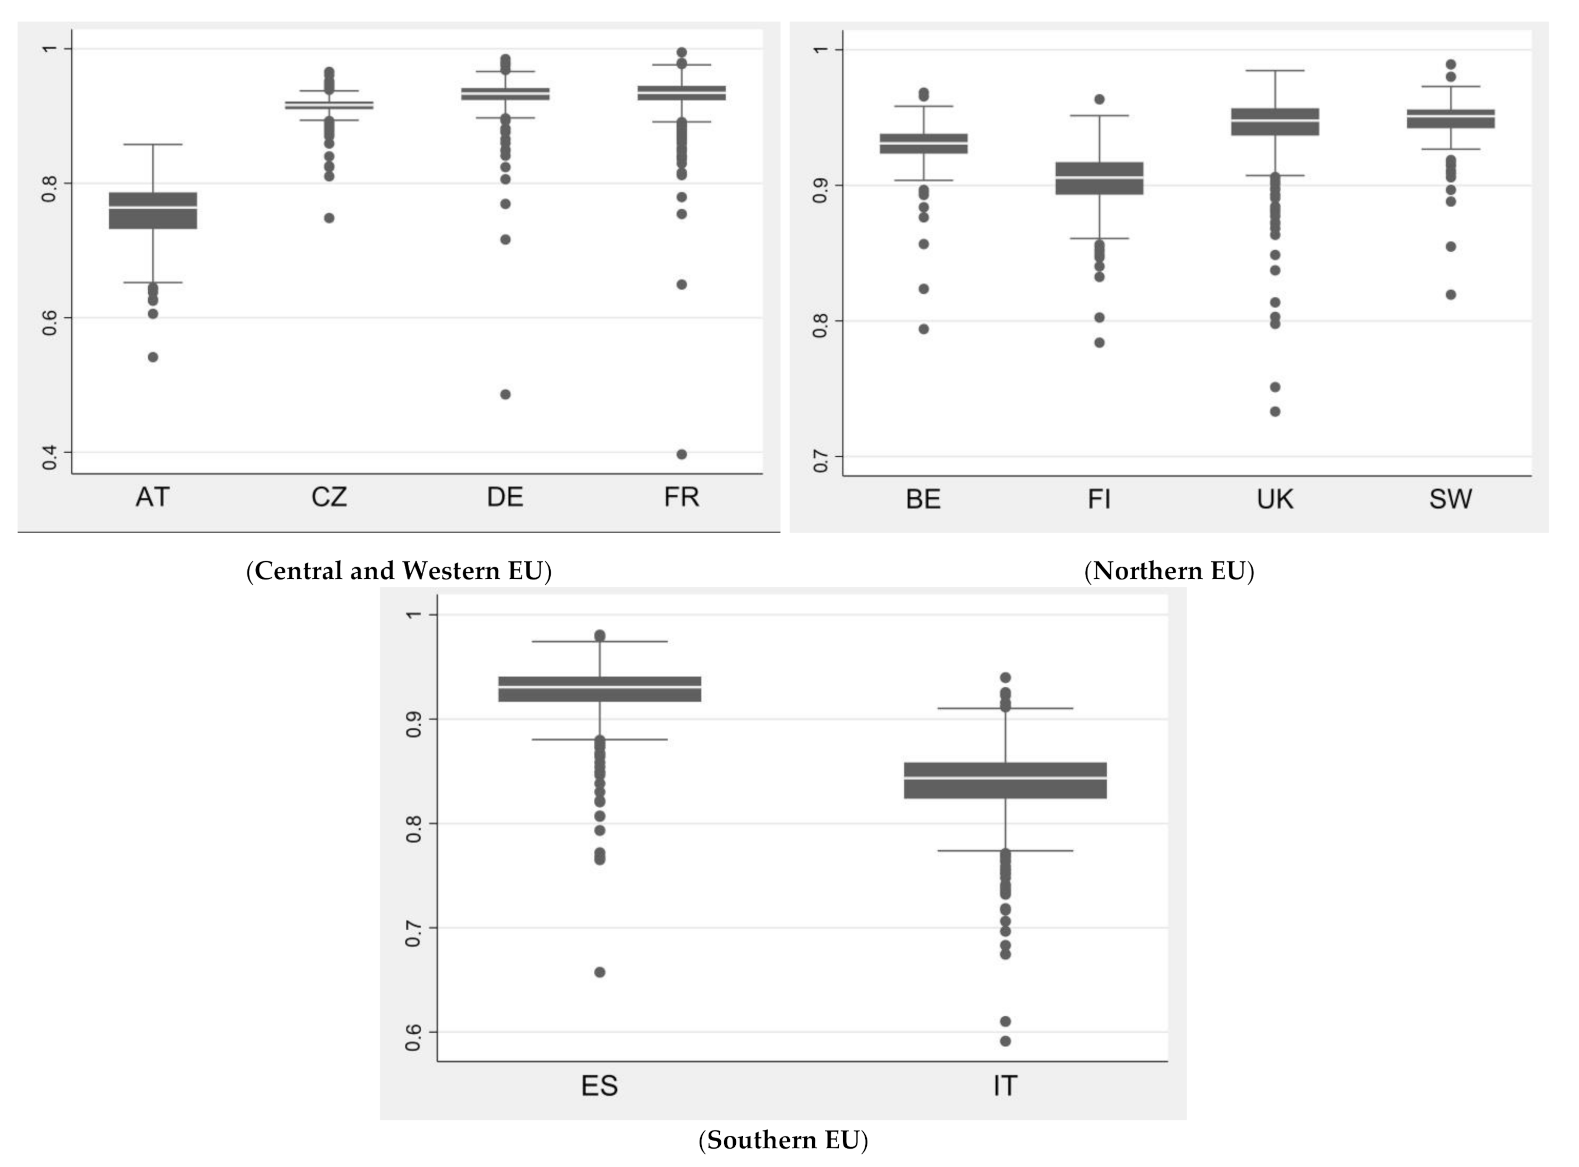
| Austria | 0.7548 | 0.0541 | 0.5414 | 0.8577 | 0.8319 | 0.0438 | 0.6454 | 0.9153 | 0.9066 | 0.0300 | 0.8234 | 0.9371 |
| Belgium | 0.9297 | 0.0158 | 0.794 | 0.9684 | 0.9309 | 0.0159 | 0.7949 | 0.9695 | 0.9988 | 0.0000 | 0.9988 | 0.9988 |
| Czechia | 0.9121 | 0.0185 | 0.723 | 0.9686 | 0.9123 | 0.0185 | 0.7232 | 0.9688 | 0.9997 | 0.0000 | 0.9997 | 0.9997 |
| Finland | 0.9028 | 0.0219 | 0.784 | 0.9635 | 0.903 | 0.0219 | 0.7842 | 0.9637 | 0.9997 | 0.0000 | 0.9997 | 0.9997 |
| France | 0.9320 | 0.0243 | 0.3968 | 0.9947 | 0.9328 | 0.0243 | 0.3971 | 0.9954 | 0.9992 | 0.0000 | 0.9992 | 0.9992 |
| Germany | 0.9303 | 0.0271 | 0.4859 | 0.9846 | 0.9307 | 0.0271 | 0.4862 | 0.9851 | 0.9995 | 0.0000 | 0.9995 | 0.9995 |
| Italy | 0.8393 | 0.0345 | 0.5913 | 0.9398 | 0.9227 | 0.0279 | 0.6312 | 0.9783 | 0.9095 | 0.0240 | 0.8168 | 0.9620 |
| Spain | 0.9267 | 0.0249 | 0.6573 | 0.9806 | 0.9269 | 0.0249 | 0.6574 | 0.9808 | 0.9998 | 0.0000 | 0.9998 | 0.9998 |
| Sweden | 0.9466 | 0.0192 | 0.8194 | 0.9892 | 0.9483 | 0.0192 | 0.8209 | 0.991 | 0.9982 | 0.0000 | 0.9981 | 0.9982 |
| United Kingdom | 0.9427 | 0.0266 | 0.7332 | 0.9847 | 0.9434 | 0.0266 | 0.7337 | 0.9854 | 0.9993 | 0.0000 | 0.9993 | 0.9993 |
| Country | Overall Technical Efficiency | Transient Technical Efficiency | Persistent Technical Efficiency | |||||||||
|---|---|---|---|---|---|---|---|---|---|---|---|---|
| Mean | Std.Dev. | Min. | Max. | Mean | Std.Dev. | Min. | Max. | Mean | Std.Dev. | Min. | Max. | |
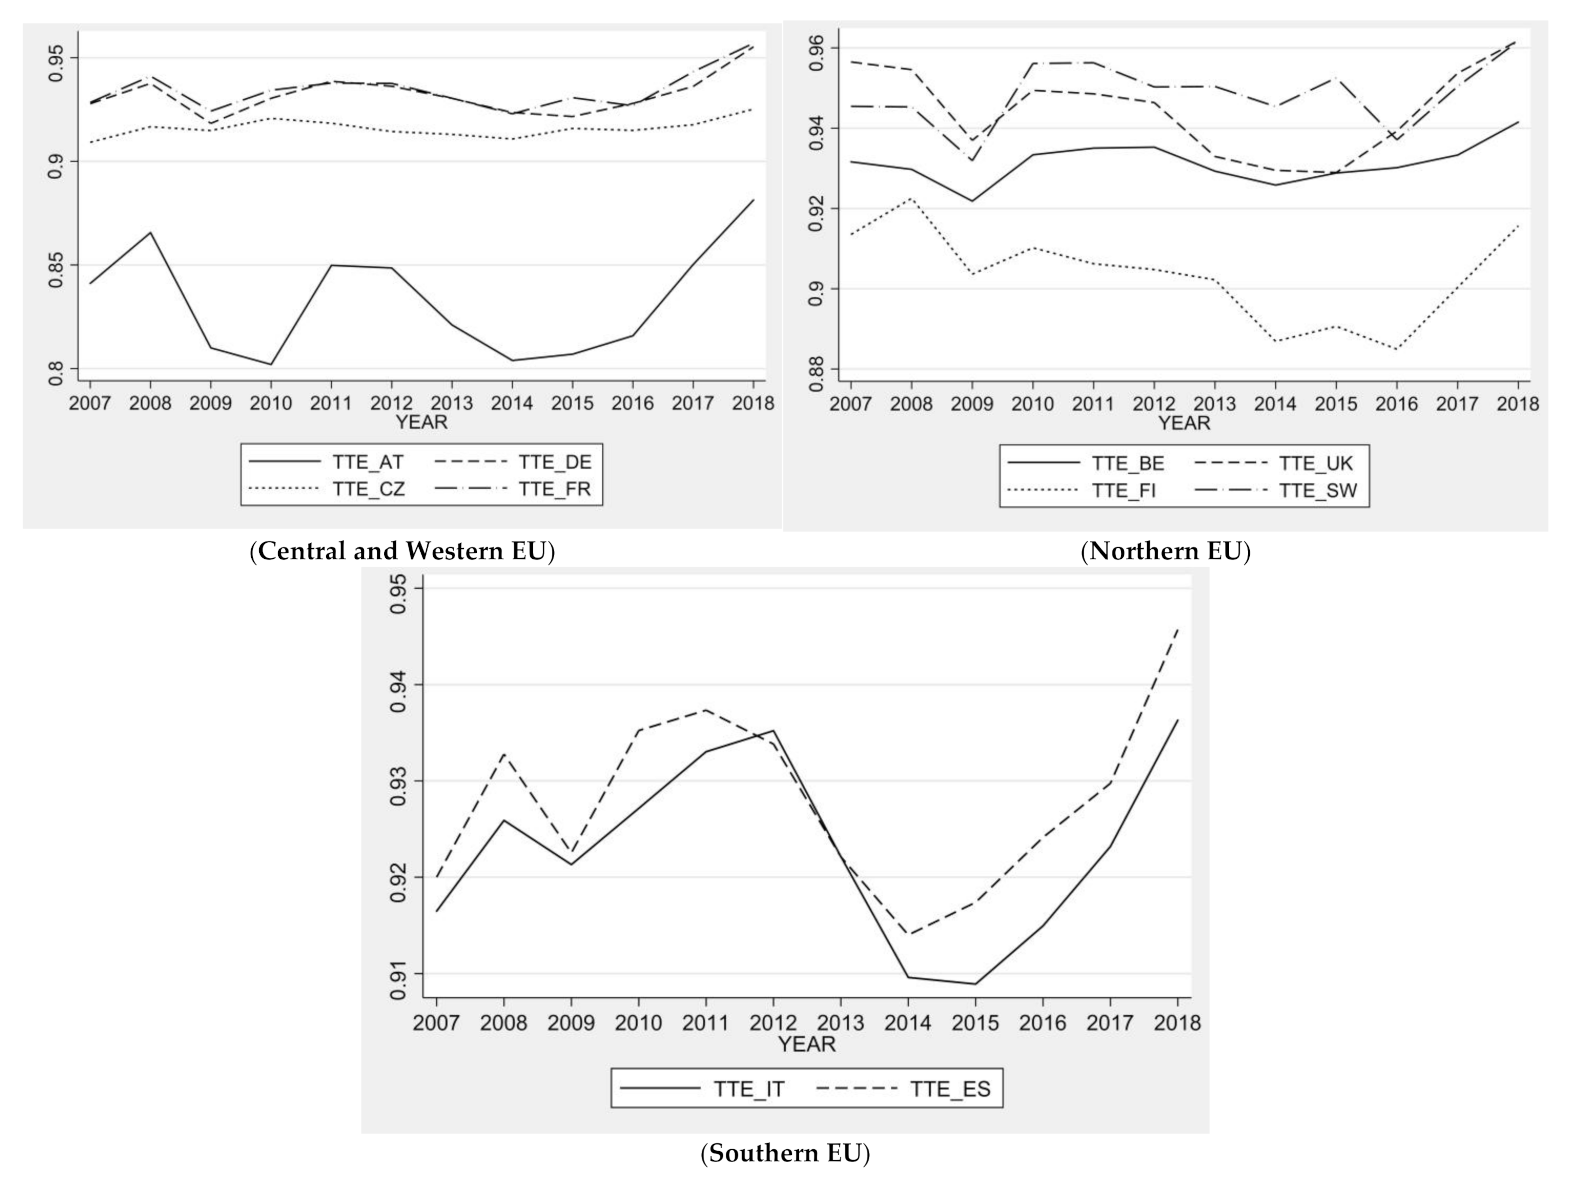
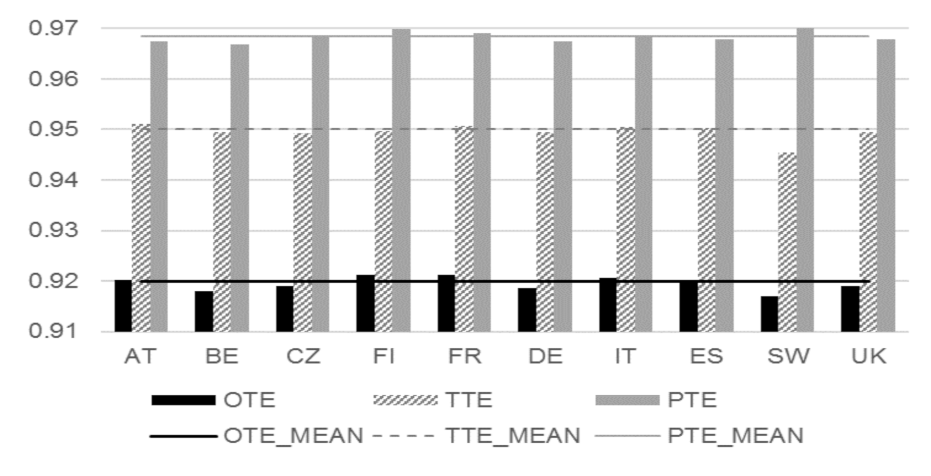
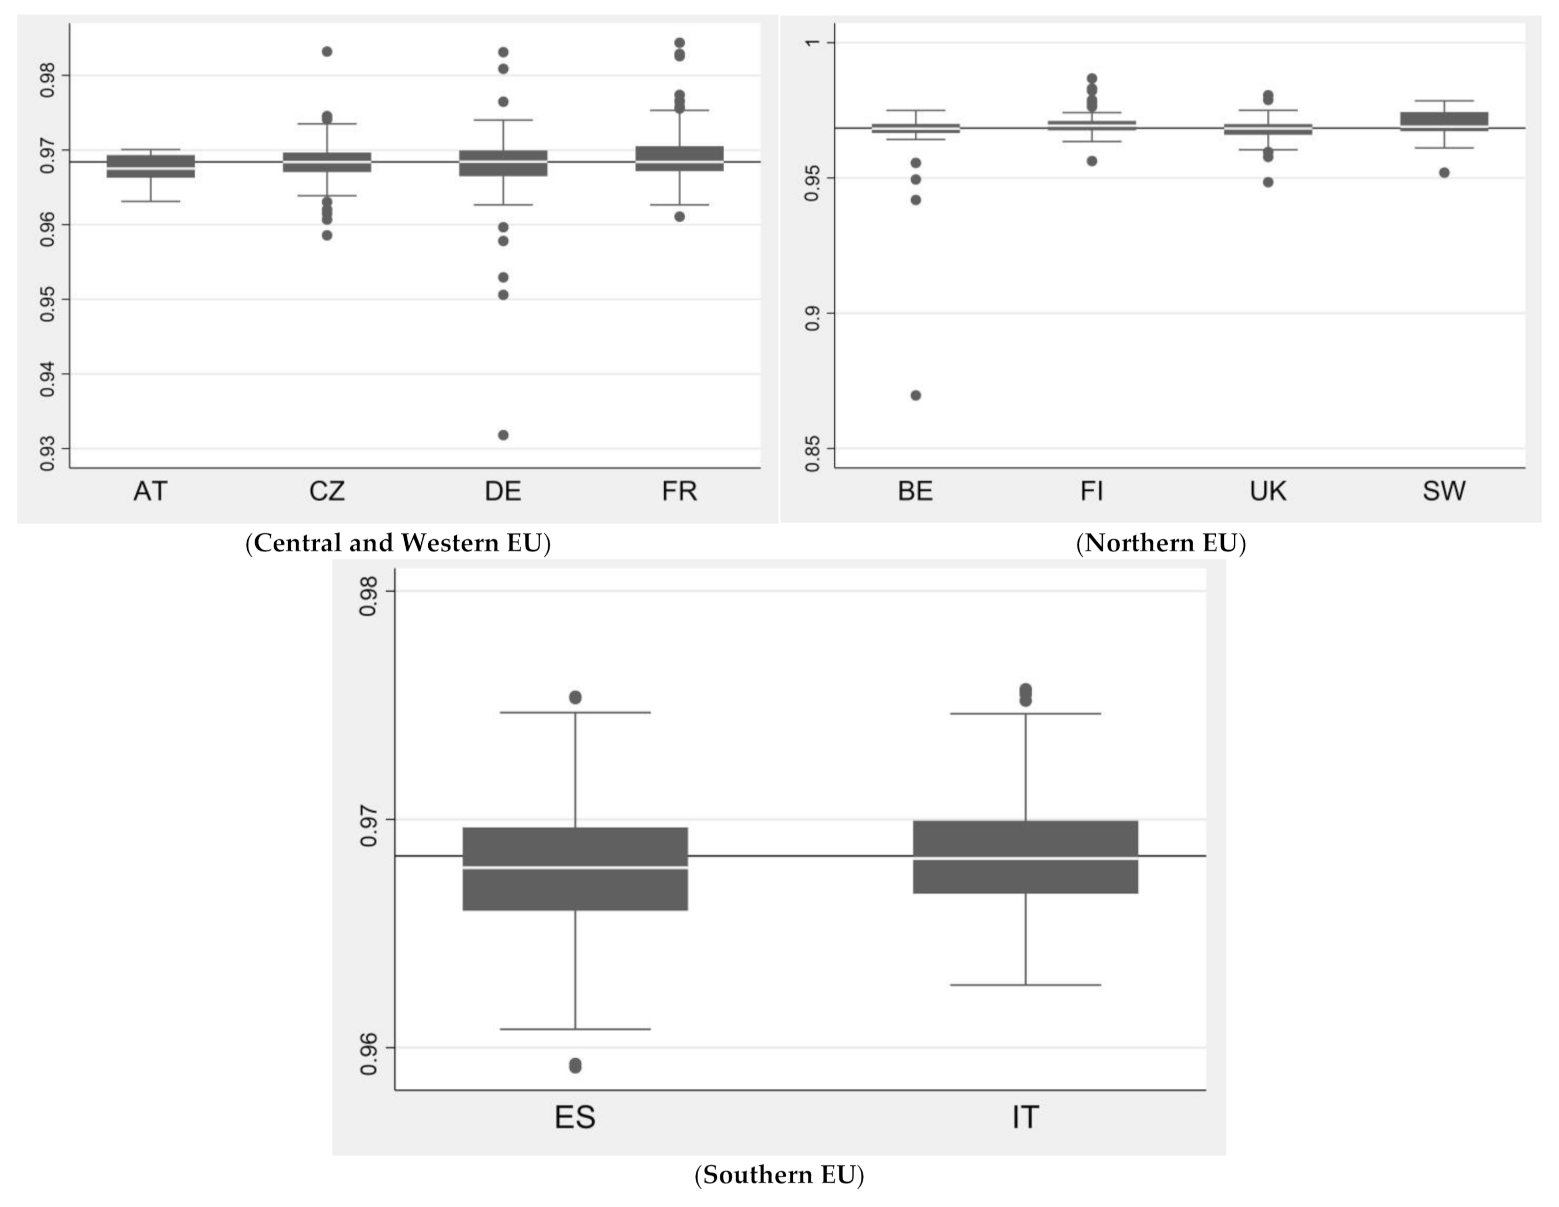
| Austria | 0.9202 | 0.0092 | 0.8608 | 0.9392 | 0.9511 | 0.0093 | 0.8888 | 0.9682 | 0.9675 | 0.0017 | 0.9631 | 0.9701 |
| Belgium | 0.9181 | 0.0200 | 0.7490 | 0.9537 | 0.9495 | 0.0155 | 0.8379 | 0.9873 | 0.9669 | 0.0101 | 0.8696 | 0.9750 |
| Czechia | 0.9191 | 0.0217 | 0.6862 | 0.9639 | 0.9492 | 0.0220 | 0.7069 | 0.9894 | 0.9682 | 0.0033 | 0.9586 | 0.9832 |
| Finland | 0.9212 | 0.0183 | 0.8179 | 0.9741 | 0.9498 | 0.0181 | 0.8326 | 0.9871 | 0.9699 | 0.0051 | 0.9562 | 0.9868 |
| France | 0.9212 | 0.0152 | 0.5673 | 0.9715 | 0.9506 | 0.0153 | 0.5903 | 0.9963 | 0.9690 | 0.0034 | 0.9611 | 0.9844 |
| Germany | 0.9185 | 0.0254 | 0.6251 | 0.9673 | 0.9494 | 0.0249 | 0.6484 | 0.9893 | 0.9674 | 0.0059 | 0.9318 | 0.9831 |
| Italy | 0.9206 | 0.0139 | 0.7570 | 0.9576 | 0.9505 | 0.0141 | 0.7785 | 0.9832 | 0.9686 | 0.0027 | 0.9627 | 0.9757 |
| Spain | 0.9197 | 0.0145 | 0.7566 | 0.9578 | 0.9503 | 0.0147 | 0.7784 | 0.9820 | 0.9678 | 0.0030 | 0.9591 | 0.9754 |
| Sweden | 0.9171 | 0.0314 | 0.7384 | 0.9732 | 0.9454 | 0.0317 | 0.7705 | 0.9945 | 0.9700 | 0.0062 | 0.9520 | 0.9785 |
| United Kingdom | 0.9190 | 0.0195 | 0.7105 | 0.9613 | 0.9495 | 0.0191 | 0.7491 | 0.9825 | 0.9679 | 0.0044 | 0.9484 | 0.9806 |
Publisher’s Note: MDPI stays neutral with regard to jurisdictional claims in published maps and institutional affiliations. |
© 2021 by the authors. Licensee MDPI, Basel, Switzerland. This article is an open access article distributed under the terms and conditions of the Creative Commons Attribution (CC BY) license (http://creativecommons.org/licenses/by/4.0/).
Share and Cite
Čechura, L.; Žáková Kroupová, Z. Technical Efficiency in the European Dairy Industry: Can We Observe Systematic Failures in the Efficiency of Input Use? Sustainability 2021, 13, 1830. https://doi.org/10.3390/su13041830
Čechura L, Žáková Kroupová Z. Technical Efficiency in the European Dairy Industry: Can We Observe Systematic Failures in the Efficiency of Input Use? Sustainability. 2021; 13(4):1830. https://doi.org/10.3390/su13041830
Chicago/Turabian StyleČechura, Lukáš, and Zdeňka Žáková Kroupová. 2021. "Technical Efficiency in the European Dairy Industry: Can We Observe Systematic Failures in the Efficiency of Input Use?" Sustainability 13, no. 4: 1830. https://doi.org/10.3390/su13041830
APA StyleČechura, L., & Žáková Kroupová, Z. (2021). Technical Efficiency in the European Dairy Industry: Can We Observe Systematic Failures in the Efficiency of Input Use? Sustainability, 13(4), 1830. https://doi.org/10.3390/su13041830