Abstract
Despite the growing interest in social innovation (SI) in agriculture, the literature lacks validated tools for evaluating such initiatives. This paper provides an empirical application of the evaluation approach developed within the H2020 SIMRA project to a pilot experience conducted in a rural area of Southern Italy. The value added by this case study is the application of the five types of criteria used by the OECD for the evaluation of development programs, which are commonly referred to as REEIS: relevance, effectiveness, efficiency, impact, and sustainability. This experiment demonstrates the adequacy of the evaluation framework in identifying strengths and weaknesses of the initiative, according to a multifaceted perspective. The overall evaluation proves that most indicators fall under the high (48%) and medium categories (36%), and only few indicators are low (16%). The usefulness of the evaluation results is manifold. First, this evaluation highlights relevant arguments to support the communication strategy addressed at civil society, therefore reinforcing the civic engagement of the initiative, which is the distinctive feature of SI. Second, it supports project managers in addressing interventions to face emerging weaknesses. Finally, the evaluation provides factual evidence to policy makers to perform cost-effective analysis of rural development policies.
1. Introduction
Agricultural activities are one of the main economic and social drivers of rural areas in Europe [1]. They provide essential business and employment opportunities for the vast majority of the rural population, playing a major role in local economies. This is especially true for economically marginalized and peripherally remote areas, where agriculture is one of the last remaining activities to contrast depopulation and brain drain. In an interconnected and changing world, traditional and rural agricultural economies are asked to reconfigure themselves, embracing innovation [2]. Innovation is an essential disruptive process, enabling farmers to generate value (through new products and services) in newly transformed economic systems, strengthening the links between rural and urban markets. In rural areas, bottom-up approaches are suitable to encourage the engagement of the local community, in order to tackle local and specific problems (e.g., depopulation, aging population, land abandonment, etc.) [3]. Initiatives based on the engagement of the civic society fall under the common umbrella of social innovation (SI). Murray et al. [4] defines SI as “… new ideas (products, services and models) that simultaneously meet social needs (more effectively than alternatives) and create new social relationships or collaborations. … they are innovations that are both good for society and enhance society’s capacity to act. The interest is in innovations that are social both in their ends and in their means”. Due to the emerging importance of SI as a promising paradigm to challenge local needs of rural communities, the European Union has allocated a significant amount of financial resources to foster theoretical advancement and knowledge in this domain. To this aim, a consortium, formed by 27 partners, was funded in 2016, within the framework of Horizon 2020, for a four-year project named “Social Innovation in Marginalised Rural Areas—SIMRA” (grant agreement no. 677622, 2016–2020).
Within the SIMRA project, SI is defined as “The reconfiguring of social practices, in response to societal challenges, which seeks to enhance outcomes on societal well-being and necessarily includes the engagement of civil society actors” [5]. This definition emphasizes the key role of human agency in transforming existing attitudes, social networks, or governance arrangements to ameliorate the collective well-being of the community.
The most common SI initiatives in the agricultural domain emerging in recent years are mainly referred to as social farming and community supported agriculture [6,7]. The aim of many initiatives relies on the pursuing of multifunctionality towards the provision of social services, that is, coupling productive agricultural activities with educational, caregiving, or social inclusion of fragile groups. In addition, some other experiences are aimed at reinforcing the connections between farmers and urban consumers in direct informal relationships. Moreover, the emergence of agricultural hubs both for consumers (e.g., food hubs) [8] and producers is also common in rural areas, as a way of fostering knowledge and best practices exchange. Despite the growing experiences of SI in agriculture, the literature lacks validated tools specifically conceived for the evaluation of this type of initiative.
This paper presents an empirical application of the evaluation approach developed within the SIMRA project, which is specifically designed for SI in marginalized rural areas. The experience demonstrates that the evaluation framework is suitable for identifying critical points and highlighting the strengths of the initiative. This is useful to all parties involved in the SI process, as it allows project managers, innovators, and direct and indirect beneficiaries to enable coordination and to focus efforts. In addition, it provides a strong informative basis, which is needed to build a communication strategy addressed at fostering the engagement of civil society, which is the distinctive feature of any SI initiative.
The case study examined herein is a rural hub operating in the Apulia Region (Southern Italy), connecting young farmers to each other and to the urban society, with the final purpose of reinforcing social and professional relationships. The analysis will consider the following five REEIS dimensions: consistency of SI with needs (relevance), adequacy of resource use (efficiency), accomplishment of targets (effectiveness), changes in community (impacts), and likelihood of SI survival in the future (sustainability).
Regarding the structure of the paper, in the next section, materials and methods are presented, with a focus on the case study and data collection. Data have been collected by means of a series of surveys, whose structure has been standardized by the SIMRA consortium and whose data was stored on a common database called OPINIO. We adopted the methodology developed within the SIMRA project, which is widely described in [9,10]. Section 3 illustrates the results, which have been organized according to the five categories of REEIS indicators. Section 4 discusses the findings in order to highlight the importance of the evaluation exercise for SI, distinguishing strengths and weaknesses. Finally, Section 5 provides the concluding remarks, highlighting the importance of the evaluation of SI, the limitations of the adopted methodologies, and suggestions for future improvements.
2. Materials and Methods
2.1. Context and Case Study
The rural hub considered in the analysis is named VàZapp’ [11,12,13,14] and operates in a network of municipalities located within the province of Foggia, Apulia Region, Italy. The province of Foggia is defined by a NUTS 3 level, located in the macroarea of “Mezzogiorno”, in Southern Italy. This is a convergence region with a GDP per inhabitant of less than 75% of the European Union average. The average provincial income is Eur 14,998 [15] per capita, compared to the EU mean of Eur 27,980 (for the year 2019) [16]. According to the Italian National Institute of Statistics (ISTAT), the youth unemployment rate (age 25–34) in 2019 in the province of Foggia was 27.7%, which is far higher than the Italian national average of 14.1%. According to the quality of life ranking, elaborated by the economic magazine “Il Sole 24 ore” in 2019, Foggia ranked 105 out of 107 provinces (dropping down the rankings since 2014). Another critical issue is represented by the per capita public expenditure which, in the Mezzogiorno area, is 20.2% lower than in northern Italian regions [17]. This implies low quality of services for firms and a low quality of life for citizens. Private firms operate in difficult conditions, negatively affecting their competitiveness, both in domestic and foreign markets. In demographic terms, the province of Foggia comprises 61 municipalities, with a total population of 616,310 inhabitants and a total area of 7008 km2 (Figure 1). The mean population density is 87.95 inhabitants/km2 (end of 2019). Foggia is the Italian province endowed with the highest extent of arable land in Italy (495,111 hectares). Among the main problems for agricultural development is the lack of entrepreneurship; in fact, farmers are aged and with low levels of education (70% of them did not finish compulsory education), while young entrepreneurs run only 4% of the farms.
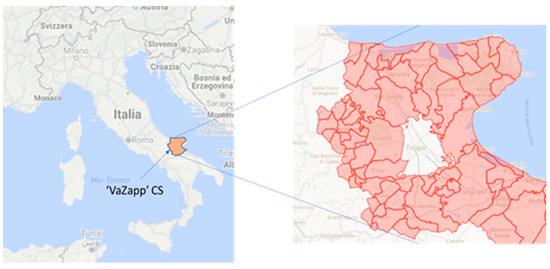
Figure 1.
Location of the study area (Source: Own elaboration based on Google Maps data).
The storyline of the rural hub development is shown in Figure 2, where the most important events that represented decisive moments for the birth, development, and implementation of the process are reported. The rural hub was formerly conceived during a meeting in October 2009 between the members of the group of founders, under the charismatic guidance of an old and very active priest, whose reputation was widely recognized in the province. The rural hub was officially founded in 2014 and aimed at responding to the needs and disadvantages of young people and their lack of hope towards the future. The first activity promoted by the rural hub, called Oliday, took place in 2014 and consisted of a harvesting event devoted to olive picking at a local farm, a typical farming activity performed in autumn that is well rooted in the local culture. This event involved about 30 young non-farmers who were acquainted with the founders. At the same time, the founders, supported by some initial followers, established a formal association in order to register the denomination of the group, which was named “VàZapp’” [12]. From November 2014 to December 2015, the founders and the followers organized a series of four events at different local farms, paving the way to the main SI initiative called Contadinner. The first event was organized in December 2015 and involved 20 young farmers of the province of Foggia. This activity was propaedeutic to the organization of a cycle of 20 identical events to be held all over the province. In fact, the catchphrase used to promote the events was “20-20-20 format”, standing for 20 dinners, 20 hosting farms, 20 guest young farmers. The target was to achieve an overall participation in informal dinners of 400 young farmers, debating about agriculture and sharing their life experiences, projects, and knowledge of agriculture. Contadinner was meant to cause positive changes in attitudes and networks of community.
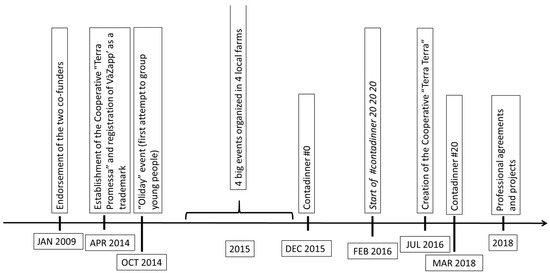
Figure 2.
Milestones of the rural hub development (Source: Own elaboration).
2.2. Data Collection and Analysis
The analysis is based on the methodology developed within the SIMRA project, which is extensively described in [9]. We selected a set of 24 indicators covering the five dimensions of REEIS:
Relevance: the objectives set up in the SI meet the needs of the territory and of the actors involved;
Efficiency: the outputs of the SI have been achieved with few inputs in terms of resources (costs and time);
Effectiveness: the outputs achieved satisfy the initial objectives;
Impacts: the extent to which the SI initiative has impacts on the environment, the society, the economy, and governance;
Sustainability: the extent to which the SI initiative is sustainable, thus measuring the likelihood for the benefits produced to continue to flow after the external funding has ended, with particular reference to their economic and social factors.
In order to perform an evaluation of the SI, two main types of data were collected. The first refers to factual data (e.g., number of final beneficiaries reached, governance improvement, social inclusion). The second refers to a self-assessment done by the people involved in the SI initiative, either in quantitative terms (e.g., cost of the SI process, count of products and services delivered by the SI project, count of new relations created, etc.) or qualitative terms (satisfaction regarding to services provided by the SI initiative). The selected indicators among the REEIS categories are reported in Table 1.

Table 1.
Selection of indicators among the REEIS categories.
Several tools were adopted to collect different sets of data [18,19]. Most of the information was collected through a series of surveys addressed to different respondents affected by the Contadinner (Table 2):
Table 2.
Survey strategy.
- -
- tool_2: focus group (1 session, 12 participants, 3 h);
- -
- tool_3: structured interviews (questionnaires with open and closed questions, addressed to 3 respondents, for a duration of 90 min per interview);
- -
- tool_4: questionnaires (semi-structured interview with 26 respondents, 35 min per respondent);
- -
- tool_6: questionnaires (interviews with 10 respondents, 30 min per respondent)
The calculation method and the extensive description of each selected indicator are reported in Table A1 in the Appendix A.
Data were collected over a 6-month period (April–September 2018), and the survey addressed different categories of actors, such as innovators, followers, transformers, and beneficiaries, as defined by [20]. Data were stored in a common database called OPINIO, which was managed by EURAC (Accademia Europea di Bolzano).
3. Results
In this section we present the elaboration of the information collected through the different survey tools. Questions have been elaborated according to the scale value defined in the Manual of Evaluations [9]; some adjustments have been introduced in the case of indicators whose upper bound value was infinite. The indicator values have been coded according to tertiles (low, medium, high), depending on their position along their range of performance.
As follows, results are presented according to the REEIS categories (see Table 3, Table 4, Table 5, Table 6 and Table 7). Within the overall group of 40 REEIS indicators developed within the SIMRA evaluation framework, 24 are applicable to our case study (60%), while the remaining 16 indicators (40%) could not be calculated due to the lack of adequate information. The last column of the tables reports the performance of the SI initiative in qualitative terms. Finally, we found an overall synthetic evaluation, by counting the number of indicators for each tertile.
Table 3.
Results of the evaluation exercise––Criteria Relevance.
Table 4.
Results of the evaluation exercise––Criteria Efficiency.
Table 5.
Results of the evaluation exercise––Criteria Effectiveness.
Table 6.
Results of the evaluation exercise––Criteria Impacts.
Table 7.
Results of the evaluation exercise––Criteria Sustainability.
Relevance. The indicators of this category are reported in Table 3.
R1: the objectives set by innovators and followers in the early phases of the SI process correspond to about 46% of European societal challenges. They refer mainly to the following challenges: income, jobs, education, sustainable agriculture and food security, and inclusive and innovative societies. Therefore, the project was moderately consistent with the EU aims.
R2: the score of 24% shows that only one quarter of the early needs were met. Though this level is not satisfactory, it is worth mentioning that the innovation is still at an early stage of development.
R3: 44% of the needs expressed by the network members (innovators, followers, transformers, as defined in Table 2) matched with those expressed by the clique (innovators and followers). This matching refers to the following collective needs: (a) restoration of the dignity of local and traditional farmers; (b) providing hope to the young people regarding their personal and professional development along with the agricultural domain. Although the resulting match was moderate, it actually related to the manifesto of the rural hub.
R5: the services provided by the rural hub satisfied existing beneficiaries’ needs, with a mean score of 7 out of 10. By achieving this result, the rural hub paved the way for future civil engagement.
R6: about one third of beneficiary needs were addressed by the initiative. In particular, it is worth mentioning two common needs: the creation of new relationships and the enhancement of cooperation with existing local actors (mentioned by 40% of the beneficiaries) and the possibility of exchanging ideas, technical solutions, and cultural proposals (mentioned by 30% of the beneficiaries).
R7: the whole initiative was highly satisfactory (7.3 out of 10) for the involved actors (innovators, followers, transformers, and project partners), as it was capable of meeting the territorial needs.
By considering the overall level of relevance indicators, we found that only one indicator was low (R2), while the remaining ones scored moderately high. In conclusion, the hub is perceived as capable of addressing the majority of beneficiaries’ and territorial needs.
Efficiency. Table 4 contains the indicators for efficiency, which mainly refer to the economic aspects of the process and the initiative. Different from the manual [9,10], we defined the upper bound range of indicators (E1, E4, E5, E8), which we borrowed from the report regarding the impact of the third sector on Italian economy and society [21].
E1: the total amount of resources invested in the SI process was Eur 18,946, considering personnel (the main component), travel, subsistence, and consumables. This indicated a tiny amount of both monetary and personal resources invested in the project activities. Compared with the national benchmark, this value was very low, implying that the economic efficiency was very high.
E3: the compactness of the network was 0.4, which was a moderate value, considering that when this value is closer to 0, the network is entirely made up of isolates, while when it is closer to 1, the network is a clique and everyone is adjacent.
E4: the cost of the SI project per direct beneficiary was equal to Eur 47.4; compared with the national benchmark, this was moderate, leading to the conclusion that the efficiency was medium.
E5: the total cost of the SI project was equal to Eur 69,170. It should be considered that most of the resources invested were represented by volunteer work. As revealed by the comparison with the national benchmark, this efficiency indicator was considered high.
E8: The unit yearly cost of the initiative per actor involved was Eur 5813, considering both monetary and personnel costs. In this case the upper bound of the national benchmark was represented by the total expenditure of the third sector divided by the total number of employees and volunteers involved. As emerged, the E8 value fell into the medium category, indicating a moderate level of efficiency.
Considering the whole category, we conclude that the initiative exhibited a medium-high level of economic and financial efficiency, as two out of five indicators belong to the high category and three to the medium one, while no indicator falls into the low category.
Effectiveness. The indicators of this category are reported in Table 5.
F1: the network observed changes (enlargement and strengthening) at about 58% of the expected levels. This result proves a medium level of effectiveness of the innovation process. For instance, among the expected changes, innovators, followers, and transformers mentioned the creation of new networks among farmers and the enhancement of collaboration among them in order to overcome common difficulties and the sharing of new ideas. However, among the achieved changes, they recognized only the realization of the Contadinner experience, some storytelling about agriculture to embellish its image, and the actual attempt of rediscovering the importance of trust in people who were first met, overcoming initial diffidence towards strangers. Therefore, matching was not fully achieved, but it could be considered a good start, considering that the rural hub is still at the early stages of development.
F2: the process was quite effective in the network reconfiguration; in particular, respondents assigned high values to respectively new relationships established, and the improved inclusiveness of the network (7.2 out of 10).
F3: the network was strengthened, proven by a small increase of density (+18%), implying that the collaboration among participants of the network after the organization of the first Contadinner was enhanced.
F5: the overall perception of beneficiaries was high (7.5 out of 10), resulting from the agreeableness of the ambience created during the Contadinner and the informal climate where they could share some moments and thoughts with one another.
F6: results suggest a medium level of beneficiaries´ satisfaction with the service delivered by the rural hub, which covered about 40% of their initial demand.
F10: the communication channels were not effective, being poorly evaluated by the respondents, with a low score of 27.5%. The reason was that the use of some social media, such as Facebook, reached only about 60% of the target audience, while other traditional media reached only 30% of beneficiaries. Finally, informal channels, such as word of mouth, were moderately effective at 50%. However, it is likely that the audience was not acquainted with the constant and regular use of these media channels.
F11: participation in the Contadinner resulted in actors being highly aware (7.9 on a scale of 10) of being part of the innovation process and being able to contribute to its further development. In other words, this indicator measures the civic engagement potential of SI and the feeling of being able to contribute to territorial development.
Impact. Since the rural hub is still at the early stages of development, only two indicators were considered as applicable (Table 6).
I6: the initiative reached a relevant number (94.5%) of final beneficiaries, represented by the potential number of acquaintances and relatives of those farmers who started to receive some benefits from the SI initiative.
I10: the initiative positively impacted 62% of items that were investigated during the survey, referring to four domains: environmental, economic, social, and institutional.
Sustainability. Sustainability indicators are reported in Table 7.
S1: the economic self-sufficiency of the SI process was high, since the large majority (99.8%) of the total resources used to run the rural hub were internal (working time, financial and in-kind contributions on a volunteer basis).
S2: the estimated time horizon of the rural hub was more than 70 years in the future, suggesting an important sustainability of this type of project in the Province of Foggia.
S3: the initiative was perceived to be sustainable, considering that more than two thirds (66.67%) of items were validated by the respondents, most of which were related to social aspects, rather than economic ones. In fact, a main social factor that makes the project more likely to survive is its capacity for the engagement of highly motivated people, who are keen to work voluntarily, e.g., all the clique members worked fully voluntarily in the early phases of the project. In addition, the rural hub proved to challenge the central problem of the community, with the introduction of a new way of thinking and approaching the agricultural sector and its modernization.
S5: the financial sustainability was limited to about one year, which is a very short time span considering the complexity of the organization. This indicator proved that, despite the perceived high financial sustainability of the rural hub, which is supported by volunteers, it will not last for more than one year in the case that support is withdrawn.
In short, we elaborated a synthetic representation of the results of the whole evaluation by reporting the number of indicators contained in the same tertile for each REEIS criterion (Table 8).
Table 8.
Synthetic representation of REEIS indicator values.
The largest number of indicators fall under the high (45%) and medium categories (38%), while only a few are low (17%). This represents the basis for a comprehensive evaluation of the initiative by comparing the best performing indicators with those that performed as low, in order to identify strengths and weaknesses, as illustrated in the next section.
4. Discussion
The evaluation exercise highlighted strengths and weaknesses of the SI initiative. As previously mentioned, it is worth noting that the rural hub is still at the early stages of development and, therefore, the value of some indicators was quite modest. This is the case for indicator R2, proving that some adaptation is necessary in the SI in order to meet the social needs. In case of F3, there is a similar explanation, as the reconfiguration of social networks is a process that proceeds at a slow pace; however, it would be desirable that it will continue to develop and to reinforce over time. It should be noted that SIs cannot be considered as “static” processes, but rather dynamic ones, since they should be able to adapt to changes in the social context in the medium term, as well as to the occurrence of extraordinary social events. Therefore, the evaluation exercise concerning this aspect needs to be conducted on a routine basis, providing continuous monitoring.
The evaluation exercise disclosed a crucial issue related to the financial sustainability of the project (indicator S5). In order to be sustainable over time, the SI project cannot fully depend on volunteer work, but requires some capitalization efforts, consisting of consolidation of physical and financial assets as well as a minimum enrollment of personnel endowed with administrative and organization skills. For instance, the establishment of a physical headquarters may reinforce the external visibility and the internal cohesion, strengthening the “sense of belonging” of members and beneficiaries. In addition, there is a need to create a neutral confrontation arena, where every member feels at ease in accessing this safe place and expressing him/herself. To this regard, the role of public support and the collection of membership fees may play a relevant role. This aspect may also explain the scarce effectiveness of the communication channels (F10), which are still oriented at the dissemination of emotional slogans, rather than informing about the achievements of the rural hub. In addition, information may not be adequate in illustrating how new activities are conceived to satisfy the potential beneficiaries. In order to improve this aspect, professional skills and activities undertaken on a continual basis are needed; they require a well-institutionalized organization, endowed with a robust administrative structure and some financial assets.
Despite the importance of identifying the weakness to elaborate some corrective actions, strengths highlighted by the most highly scored indicators reveal that, overall, the SI is performing well. More specifically, each indicator category could be useful to different actors, directly or indirectly involved in the SI initiative. In particular,
- -
- relevance: can be useful for the responsibilities regarding public relations for the SI project, to evaluate and finally communicate the capacity of the project to address the needs and satisfaction of beneficiaries;
- -
- efficiency: addresses the administration and control of the economic sustainability and financial viability of the SI project;
- -
- effectiveness: provides suggestions for project managers performing monitoring and control on specific SI initiatives or actions;
- -
- impacts: represents the synthesis of the performance of the SI initiative, to be used to communicate the role of the SI project to ameliorate the socio-economic situation of the community and to provide suggestions for policy measures aimed at fostering public engagement and fundraising;
- -
- sustainability: provides the basic orientation for project designers committed to the development, reinforcement, and (eventually) replication of the SI.
However, it is necessary to consider that some indicators, such as those related to impacts, could not be captured in the early stages of SI. In fact, several indicators could not be measured, due the fact that some actions addressed at a social level require a long time span to generate observable changes, as compared to projects aimed at infrastructural improvement and physical investments.
Policy support is fundamental in the early stages of development of SI, when the impacts are still not evident. To this regard, the most reliable evaluation criteria are the other aspects (relevance, effectiveness, sustainability), which may represent the capacity of SI to self-organize and to be capable to proceed on its own. It is important that the SI will not become a provider of public services, nor become a fully volunteer organization, but will find its way on a third path, that is, a stand-alone organization, pursuing the enhancement of the capacity of the civic community to satisfy unmet needs.
5. Conclusions
The main lesson learned from this case study has potentially strong implications. In fact, even in areas plagued by great socio-economic problems (e.g., severe economic crisis, causing a dramatic increase of youth unemployment rates), emigration is not the only way out; on the contrary, reaction is possible. Certainly, this reaction is not directly operating on the general economic issues affecting the entire country, as this requires operating at a wider scale by means of policy instruments. Instead, the rural hub operates to revert the cultural basis of the countermeasure against the economic measures (traditionally emigration) by creating acceptance for people who decide to stay. The main way to do this is creating and reinforcing a linkage between the rural status and the urban communities by means of social events. In this way the rural hub tackles the root of the problem, which is restoring dignity to local and traditional agriculture as well as the emancipation of young people. This resulted in enthusiasm among young farmers, a capacity for co-working, and eventually, the ability to capture career opportunities for skilled people.
Another major finding of this study is that the conditions for reaction to occur, and the causality between trigger and SI, are not trivial (trigger ⟶ social needs ⟶ social innovation), but require an actual alignment of specific factors that, in this case, were (i) a long-time accumulation process resulting in needs matching with some personal qualities of the innovators (e.g., strong friendship and spiritual link) as well as their communications and professional skills (i.e., human capital); (ii) a pre-existing network of people (i.e., social capital) and a contextual condition that favored social networking. This enabled the movement to rise spontaneously, without external financial capital, and with the direct involvement of existing human and social capital. To transform, accumulate, and employ these immaterial forms of capital, the rural hub exhibited some level of closure, which allowed for the establishment of specific rules, vision, and governance style (which are the normative and cognitive components of social capital).
Finally, this SI initiative needs to find its way, straddling profit and non-profit domains in producing its outputs, to generate a hybrid model. On one hand, events and relations promotion are produced at the non-profit level. On the other hand, these relations lead to the establishment of professional agreements, which belong to the private sector.
Author Contributions
Conceptualization, A.B., M.P. and A.L.; methodology, V.M.G. and A.L.; investigation, A.B., A.L. and M.P.; resources, A.B., A.L.; data curation, A.B., M.P. and V.M.G.; writing—original draft preparation, A.B., M.P., V.M.G. and A.L.; data interpretation, A.B., M.P. and A.L.; writing—review and editing, A.B., M.P. and A.L.; visualization, A.B. and V.M.G.; supervision, A.B., M.P., V.M.G. and A.L.; project administration, A.L.; funding acquisition, A.L. All authors have read and agreed to the published version of the manuscript.
Funding
This project has received funding from the European Union’s Horizon 2020 Research and Innovation Program under Grant Agreement No. 677622 (H2020 SIMRA–Social Innovation in Marginalised Rural Areas–Project).
Institutional Review Board Statement
Not applicable.
Informed Consent Statement
Not applicable.
Data Availability Statement
Not applicable.
Acknowledgments
This paper is based on research carried out as part of the Project Social Innovation in Marginalized Rural Areas (SIMRA) which is funded by the European Union’s Horizon 2020 Research and Innovation Programme under Grant Agreement No 677622. The views expressed in this article are the sole responsibility of the authors and do not necessarily reflect the views of the European Union.
Conflicts of Interest
The authors declare no conflict of interest.
Appendix A
Table A1.
Description and data computation of indicators among the REEIS categories.
Table A1.
Description and data computation of indicators among the REEIS categories.
| Cod. | Name | Description and Interpretation | Tool | Calculation |
|---|---|---|---|---|
| R1 | Consistency with European societal challenges | The higher the number of objectives set by innovators and followers in the early phases of the SI on the European societal challenges, the better the relevance of the SI process. | 3 | % of matching needs |
| R2 (R1 *) | Shared needs within the Social Innovation network | The higher the number of individual and collective needs shared by the network on the total number of identified needs, the better the relevance of the SI process. | 3 & 4 | % of matching needs |
| R3 (R2 *) | Shared vision regarding collective needs | The higher the number of network’s actors who identify at least one need identified also by innovators, the better the relevance of the SI process. | 3 & 4 | % of agreement with the clique |
| R5 (R3 *) | Level of satisfaction of beneficiaries’ needs | The higher the level of satisfaction of beneficiaries with respect to their needs, the better the relevance of the SI project. | 6 | Mean of Likert scale values |
| R6 (R4 *) | Range of beneficiaries’ needs which are addressed by the Social Innovation project | The higher the number of beneficiaries’ needs satisfied, the better the relevance of the SI project. | 6 | Mean of score |
| R7 (R5 *) | Extent (level) of meeting with territorial needs | The higher the level satisfaction of the actors with respect to the territorial needs, the better the relevance of the SI initiative. | 3 & 4 | Average of all observation |
| E1 | Value of the Investment per network actor in the Social Innovation process | The amount of resources invested in the SI process per participant in SI initiative | 3 & 4 | economic value |
| (E3 *) | Social Innovation process’ internal efficiency of collaborations | The lower the average distance between actors in the collaborative network, the higher the efficiency of the SI process. | 3 & 4 | Breadth index |
| E4 (E4 *) | Unit cost per beneficiary of the Social Innovation project | The lower the cost per beneficiary, the higher the efficiency of the SI project. | 1 | Tot. Costs/Number of Beneficiaries |
| E5 | Total cost of Network of the Social Innovation project | the total cost (mainly in kind) incurred by network of SI initiative | 3 & 4 | economic value |
| E8 | Unit cost per person involved in the Social Innovation initiative—year base | the unit cost (mainly in kind) incurred by each single network’s actor of SI initiative | 1, 3 & 4 | Mean of costs |
| F1 (F1 *) | Expected vs. observed changes in the Social Innovation process | The higher the congruence between expected and observed changes, the better the effectiveness of the SI process. | 3 & 4 | % of matching |
| F2 (F2 *) | Perceived changes in the reconfiguration due to the Social Innovation process | The higher the level of perceived changes determined by the SI process, the better its effectiveness. | 3 & 4 | Mean of Likert scale values |
| F3 (F3 *) | Reconfigured collaborative network | The higher the level of collaboration among the actors during the process compared with the level of collaboration before the process, the better the effectiveness of the SI process. | 3 & 4 | variation of network density |
| F5 (F5 *) | Level of beneficiaries’ satisfaction with the Social Innovation project’s results | The higher the level of beneficiaries’ satisfaction with the project results, the better the effectiveness of the SI project. | 6 | Mean of Likert scale values |
| F6 (F6 *) | Identified vs. delivered products and services of the SI project | The higher the amount of outputs (products and services) delivered compared to the those initially identified, the better the capacity of the SI project to reach its specific objective/s, and thus its effectiveness. | 2 & 6 | % of real demand on potential supply |
| F10 | Effectiveness of the communication channels of the Social Innovation project | The higher the capacity to reach new beneficiaries, the better its effectiveness. | 6 | % of effectiveness |
| F11 (F9 *) | Actors’ perception of being able to make a difference with the Social Innovation initiative | The more the SI process actors are aware of their capacity to make a difference in the territory through the Social Innovation initiative, the better its supposed effectiveness. | 3 & 4 | Mean of Likert scale values |
| I6 (I2 *) | Estimated number of indirect beneficiaries of the Social Innovation project | The higher the number of indirect beneficiaries, the better the supposed impact of the SI project. | 6 | Ratio indirect beneficiaries/total beneficiaries |
| I10 (I4 *) | Stakeholders’ perception of the Social Innovation’s general positive impacts on the four domains | The higher the percentage of elements positively impacted by the Social Innovation initiative with respect to the total elements impacted, the better the supposed impact of the SI initiative according to the stakeholders’ perception | 2 | % of positive impacts on total impacts |
| S1 (S4 *) | Social Innovation project’s financial dependence on internal resources | The higher the level of dependency of the SI budget on internal resources, the higher the SI project’s financial self-sufficiency. | 1 & 3 | percentage |
| S2 | Likelihood of benefits produced by the Social Innovation project to continue to flow in the future | The higher the expected years to continue to exist the benefits produced by SI initiative in the future, the better the likelihood of the SI initiative to continue in the future. | 3 | Mean of years |
| S3 (S5 *) | Social Innovation initiative’s level of socio-economic sustainability | The higher the percentage of factors identified by the SI actors, the better the socio-economic sustainability of the SI initiative. | 3 & 5 | percentage |
| S5 (S2 *) | Social Innovation project’s financial sustainability over time | The higher the number of years indicated by the actors, the better the sustainability over time of the SI project. | 1 & 3 | Mean of scores |
Source: Indicators are adopted from [9]. Note (*): The indicators whose labels are in parentheses have been coded differently in the new edition of the evaluation manual [10].
References
- European Commission. EU Farm Economics Overview Based on 2015 (and 2016) FADN Data; European Comission: Brussels, Belgium, 2018. [Google Scholar]
- Peters, B.; Herens, M.; Brouwers, J. Capturing Social Innovations in Agricultural Transformation from the Field: Outcomes of a Write-Shop. Sustainability 2018, 10, 4727. [Google Scholar] [CrossRef]
- Bock, B. Social innovation and sustainability; how to disentangle the buzzword and its application in the field of agriculture and rural development. Stud. Agric. Econ. 2012, 114, 57–63. [Google Scholar] [CrossRef]
- Murray, R.; Caulier-Grice, J.; Mulgan, G. The Open Book of Social Innovation; National Endowment for Science, Technology and the Art: London, UK, 2010; p. 2. [Google Scholar]
- Polman, N.; Slee, B.; Kluvánková, T.; Dijkshoorn-Dekker, M.; Nijnik, M.; Gezik, V. Classification of Social Innovations for Marginalised Rural Areas. D2.1. Social Innovation in Marginalised Rural Areas (SIMRA); European Commission: Brussels, Belgium, 2017; p. 32. [Google Scholar]
- Gramm, V.; Dalla Torre, C.; Membretti, A. Farms in Progress-Providing Childcare Services as a Means of Empowering Women Farmers in South Tyrol, Italy. Sustainability 2020, 12, 467. [Google Scholar] [CrossRef]
- Blättel-Mink, B.; Boddenberg, M.; Gunkel, L.; Schmitz, S.; Vaessen, F. Beyond the market-New practices of supply in times of crisis: The example community-supported agriculture. Int. J. Consum. Stud. 2017, 41, 415–421. [Google Scholar] [CrossRef]
- Matson, J.; Sullins, M.; Cook, C. The Role of Food Hubs in Local Food Marketing; Service Reports (SR) 280771; United States Department of Agriculture, Rural Development: Washington, DC, USA, 2013; p. 17. [Google Scholar]
- Secco, L.; Pisani, E.; Da Re, R.; Vicentini, K.; Rogelja, T.; Burlando, C.; Ludvig, A.; Weiss, G.; Zivojinovic, I.; Górriz-Mifsud, E.; et al. Deliverable D4.3, Manual on Innovative Methods to Assess SI and Its Impacts; Social Innovation in Marginalised Rural Areas Project (SIMRA); Report to the European Commission; SIMRA: Brussel, Belgium, 2019; Available online: http://www.simra-h2020.eu/wp-content/uploads/2020/02/SIMRA_D4_3_Manual-on-Innovative-Methods-to-Assess-SI-and-its-Impacts-with-ANNEX-PROTETTO_compressed.pdf (accessed on 11 November 2020).
- Secco, L.; Pisani, E.; Da Re, R.; Vicentini, K.; Rogelja, T.; Burlando, C.; Ludvig, A.; Weiss, G.; Zivojinovic, I.; Górriz-Mifsud, E.; et al. Evaluation Manual. Innovative Methods to Assess Social Innovation and Its Impacts in Marginalised Rural Areas; SIMRA Project; SIMRA: Brussel, Belgium, 2020; Available online: https://bia.unibz.it/discovery/delivery?vid=39UBZ_INST:ResearchRepository&repId=12235164690001241#13235154620001241 (accessed on 11 November 2020).
- Palumbo, M. I Quaderni del GAL Dauniofantino, Masserie didattiche, fattorie sociali. In Agriturismi per il Territorio Dauniofantino; Andrea Pacilli Editore: Manfredonia (FG), Italy, 2015; pp. 1–93. ISBN 978-88-96256-69-5. [Google Scholar]
- Lombardi, M. L’innovazione Sociale nel Settore Agricolo del Mezzogiorno; Collana Agricoltura e Benessere, FrancoAngeli: Milano, Italy, 2017; pp. 1–159. ISBN 978-88-917-6144-6. [Google Scholar]
- Martina, M. Dalla Terra all’Italia, sez.2 una Nuova Generazione Agricola; Edizioni Mondadori: Milano, Italy, 2017; ISBN 9788804685524. [Google Scholar]
- Górriz-Mifsud, E.; Marini Govigli, V.; Ravazzoli, E.; Dalla Torre, C.; Gramm, V.; Da Re, R.; Secco, L.; Pisani, E.; Ludvig, A.; Weiss, G.; et al. Compilation of Case Study Protocols and Synthetic Description. Deliverable 5.1, Social Innovation in Marginalised Rural Areas (SIMRA). Report to the European Commission; European Commission: Brussels, Belgium, 2018; p. 135. [Google Scholar]
- Analisi Statistiche—Open Data Dichiarazioni. Available online: https://www1.finanze.gov.it/finanze3/analisi_stat/index.php?search_class[0]=cCOMUNE&opendata=yes&privacy=ok (accessed on 3 June 2020).
- Real GDP per Capita. Available online: http://appsso.eurostat.ec.europa.eu/nui/show.do?wai=true&dataset=sdg_08_10 (accessed on 8 June 2020).
- Rapporto Svimez 2019. L’economia e la Società del Mezzogiorno. Available online: https://www.ibs.it/rapporto-svimez-2019-economia-societa-ebook-vari/e/9788815354563 (accessed on 8 June 2020).
- Secco, L.; Da Re, R.; Pisani, E.; Ludvig, A.; Weiss, G.; Górriz-Mifsud, E.; Marini Govigli, V. Compilation of Tools for Data Collection for SIMRA Pioneer and Regular Case Studies; Report 5.1—Social Innovation in Marginalised Rural Areas (SIMRA); European Union: Brussels, Belgium, 2018; p. 194. [Google Scholar]
- Secco, L.; Pisani, E.; Burlando, C.; Da Re, R.; Gatto, P.; Pettenella, D.; Vassilopoulus, A.; Akinsete, E.; Koundouri, P.; Lopolito, A.; et al. Deliverable D4.2, Set of Methods to Assess SI Implications at Different Levels: Instructions for WPs 5&6; Social Innovation in Marginalised Rural Areas Project (SIMRA), Demonstrator Submitted to the European Commission; SIMRA: Brussel, Belgium, 2017; Available online: http://www.simra-h2020.eu/wp-content/uploads/2017/10/SIMRA_D4.2_Set_of_Methods_to_Assess_SI_Implications_at_Different_Levels_Instructions_for_WPs_5_and_6.pdf (accessed on 3 October 2020).
- Secco, L.; Pisani, E.; Da Re, R.; Rogelja, T.; Burlando, C.; Vicentini, K.; Nijnjk, M. Towards a method of evaluating social innovation in forest-dependent rural communities: First suggestions from a science-stakeholder collaboration. For. Policy Econ. 2019, 104, 9–22. [Google Scholar] [CrossRef]
- Ricercasul Valore Economico del Terzo Settorein Italia. Available online: https://www.forumterzosettore.it/multimedia/allegati/Ricerca.pdf (accessed on 4 December 2020).


Publisher’s Note: MDPI stays neutral with regard to jurisdictional claims in published maps and institutional affiliations. |
© 2021 by the authors. Licensee MDPI, Basel, Switzerland. This article is an open access article distributed under the terms and conditions of the Creative Commons Attribution (CC BY) license (http://creativecommons.org/licenses/by/4.0/).