Abstract
China entered a new era, and the construction of an ecological civilization and green development has been raised to a new strategic height. As the lifeblood of the national economy, industrial parks significantly contribute to economic growth. However, they also generate significant pollution, damaging the ecological environment. It is urgent to ecologically transform traditional industrial parks. This requires identifying methods to correctly and objectively evaluate the ecological level of industrial parks, and provide ecological construction proposals for the government and industrial parks. In this study, the comprehensive evaluation weight was determined by introducing a variation coefficient and an Attribute Hierarchy Model (AHM). The ecological level of four representative eco-industrial parks was then quantitatively evaluated using a grey multi-level evaluation method. The ecological construction level of the four industrial parks was as follows. The Tianjin Economic-Technological Development Area (TEDA) was rated at a “very good” level; and the Suzhou industrial park, Dalian economic and technological development zone, and Fushun mining group were rated at a “good” level. Six dimensions were studied. Of these, policy management had the highest weight, and the total weight of policy management and economic development approached 50%. The result shows that industrial parks can attract innovative enterprises and talents through the policy guidance of local government to improve the level of green innovation technology and cleaner production technology. Then, the ecological level of the industrial parks will be improved. This study enriched the theory and practice of ecological evaluation of industrial parks and provided a reference for the ecological construction of traditional industrial parks.
1. Introduction
The industrial park is a regional complex that integrates economic, social development, resources, and environmental consumption [1]. Different countries are accelerating their industrialization for economic development, leading to the emergence of all kinds of industrial parks. The industrial development system with industrial parks as the main carrier was established in China in around the year 2000 [2]. Industrial park development both promotes the national and regional economy, and significantly damages the ecological environment [3]. The industrial structure of industrial parks is generally ineffective, resources are not fully used, and the environmental pollution is serious. These problems have become obstacles to the further development of the industrial park. Figure 1 shows the development history of eco-industrial parks in China.
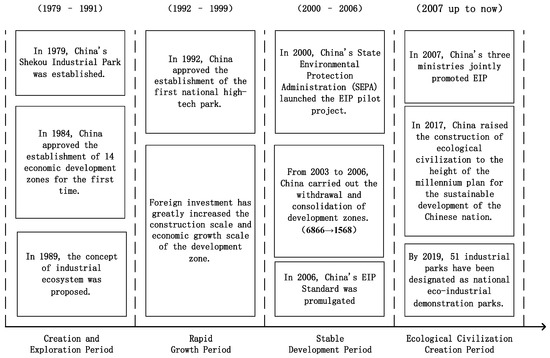
Figure 1.
Development and evolution of eco-industrial parks in China.
As early as 1992, the Rio conference noted that the industrial park ecological transformation is the sole approach to future industrial development [4]. Under the call of protecting the ecological environment and beautiful homelands, the construction of the eco-industrial Park (EIP) has been explored worldwide. China has been constructing pilot eco-industrial park demonstration zones since 1999. According to the Ministry of Ecology and Environment, by June 2019, 93 industrial parks in 25 provinces (autonomous regions and municipalities directly under the central government) had launched the construction of national eco-industrial demonstration parks. Of these, 51 have been officially named for their outstanding performance in green economy development, industrial symbiosis, resource sharing and conservation, environmental protection, and information disclosure [5]. In the 2017 Report of the 19th National Congress, China proposed moving to green development, low-carbon development, and circular development by 2035. The ecological transformation of industrial parks is an inevitable choice for China to relieve resource and environmental pressures, develop resource-friendly industries, and realize sustainable development [6].
Industrial park development in China has progressed through four stages. The first stage was a period of establishment and exploration from 1979 to 1991. The economic scale of the development zone was relatively small, with a slow development speed. The second stage was a period of rapid growth from 1992 to 1999. Foreign investments significantly increased the scale of construction and economic growth in the development zone. These became an important growth point for regional economic development. The third stage was an adjustment and stable development period from 2000 to 2006. In 2003, China began to clean up development zones that did not comply with the regulations of the state environmental protection bureau. By the end of 2006, a total of 5298 development zones of different types had been withdrawn and merged, accounting for 77.2% of the then total.
The fourth stage, from 2006 to now, has been a period of ecological transformation of industrial parks and the establishment of an ecological civilization with respect to industrial parks [7]. In 2017, in the Report to the 19th National Congress of the Communist Party of China (CPC), ecological progress was advanced to a millennium-focused strategic level to encourage the sustainable development of China. Industrial parks are an important pillar of China’s economic development. Given the increasingly significant constraints on social resources and environmental capacity, guiding industrial parks to carry out ecological construction is a key way to balance the relationship between economic growth and the use of the ecological environment [8].
As many traditional industrial parks in China gradually transform into environmentally friendly eco-industrial parks, scholars have started to study methods for scientifically and effectively evaluating the ecological construction level of industrial parks. For example, Huang and Yang (2005) established an evaluation index system for assessing eco-industrial parks, by using an expert consulting method. This approach included the four aspects of economy, environment, management, and ecology. It was then applied to conduct a comprehensive evaluation of an eco-industrial park based on a grey clustering method [9,10]. Using the principle of a circular economy, also known as “3R”, indicating the principles of reduction, reuse and recycling, Yuan (2003) and Shang (2007) proposed an evaluation index system and standards for ecological industrial parks, including the economy, ecological environment, ecological network, and management [11,12].
Deog-seong (2005) also established an evaluation model for assessing eco-industrial parks based on sustainable development. The model included four aspects: material and energy flow, internal and external environment design, industrial symbiosis network construction, and the shaping of the cultural environment. A qualitative analysis was conducted on the DTV industrial park in Korea, finding the DTV project to be a successful practice case [13]. Qu et al. (2013) identified index levels covering the three aspects of economy, environment, and society. That study applied a factor analysis method, assigning the index weights according to the factor contribution rate and factor score coefficient. This led to the quantitative construction of an evaluation index system to assess the sustainable development level of an eco-industrial park [14]. Chen et al. (2016) constructed an ecological industrial park performance evaluation index system with 16 indicators, addressing five aspects of economic development, ecological benefit, reduction, circulation and green management. Based on the principles of ecological efficiency and “3R”, the study adopted fuzzy mathematics to empirically evaluate and analyze the performance of the Changsha Economic and Technological Development Zone [15].
The existing evaluation index system of ecological construction level of industrial parks in China is still not comprehensive. This is mainly reflected by the lack of indicators that can reflect scientific and technological innovation and resource potential. In addition, there is still a lack of quantitative research evaluating industrial parks. To link the theoretical research and practical operation of eco-industrial parks, it is important to explore quantitative evaluation index systems and research methods to assess the development level of eco-industrial parks.
Therefore, based on the practical problems involved in transforming the industrial ecology in China, and by applying theories related to industrial ecology and circular economy as a foundation, this study achieved the following. First, it established an evaluation index system for assessing ecological industrial parks, and introduced a variation coefficient and Attribute Hierarchical Model (AHM) to determine evaluation weights. Second, a multi-level gray evaluation method was introduced to quantitatively evaluate industrial ecological process, and evaluate and monitor the ecological transition of industrial park construction levels. The goal was to provide the government management department tools to better oversee and manage operable evaluation approaches with a scientific basis, and appropriately guide the ecological construction and sustainable development of industrial parks.
2. Construction of the Evaluation Index System
An industrial park is composed of many subsystems, which are interconnected with each other and which have complex hierarchical structures. To scientifically describe and quantitatively evaluate the ecological status of industrial parks, strengthen the decision-making and management of ecological industrial parks, and advance the development of the circular economy, it is necessary to establish an evaluation index system with a reasonable design and strong operability to evaluate the ecological status of industrial parks. This study applied examples from around the world and, based on the existing research literature and expert interviews, evaluated ecological industrial parks that are close to the evaluation indexes. A team of 12 relevant experts, including government leaders, business executives, and academics, were involved in a supplemental investigation and interviews with respect to the indexes obtained during the first round of screening, to does not conform to the target.
In 2015, China’s Environmental Protection Bureau promulgated newly revised standards for national eco-industrial demonstration parks. The standards stipulated evaluation indicators for assessing national eco-industrial parks and divided them into five dimensions, including economic development, industrial symbiosis, resource conservation, environmental protection, and information disclosure [16,17]. For this study, based on the national eco-industrial demonstration park standard, relevant experts were organized to conduct a group assessment and screening. The study also redefined the criteria layer to determine the indicators of economic development, ecological environment, material cycling, and resource potential. In addition, Zhai (2016) proposed a comprehensive effectiveness evaluation index system for ecological industrial parks. They used two dimensions to determine the technological innovation and policy management indicators. Finally, based on the primary selection, an initial set of 39 indexes were determined. The 39 indexes were further classified into 6 dimensions according to the category. Figure 2 shows the framework of the six-dimensional index system. This established a new evaluation index system to specifically assess ecological industrial parks [18], as shown in Table 1.
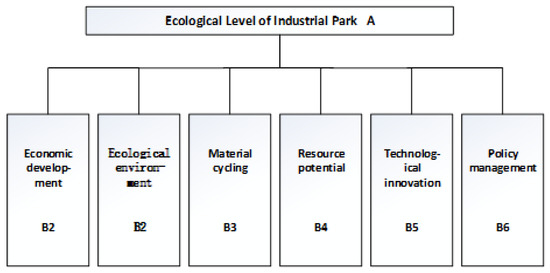
Figure 2.
Framework of an evaluation index system to assess the ecological level of industrial parks.

Table 1.
Evaluation index system for assessing the ecological level of industrial parks.
3. Evaluation Model of the Ecological Level of Industrial Parks
Eco-industrial parks are complex and there are limits to people’s knowledge. In the actual production and operation process, people only absorb a general range of partial information about the eco-industrial park, rather than all information or exact information. A system with only partially known information, with the rest unknown, is called a grey system. This theory mainly through the generation and development of “part”-known information, extract valuable information, realize the correct description and effective monitoring of the system operation behavior and evolution law [19]. The main advantages of grey system theory are as follows:
- It has advantages when analyzing systems with uncertain and incomplete information.
- It only requires a small sample size and has a simple calculation process. Grey theory has been combined with other methods to evaluate eco-city and investment risk in many studies, and the results are objective and credible.
Therefore, this paper introduced grey system theory into the ecological level evaluation of industrial parks, to provide a theoretical basis for the ecological construction of an industrial park. In the evaluation process, calculating the weight of the index system is a very important step. There are currently two methods to determine the index weight: subjective method and objective method. In this paper, the AHM method and coefficient of variation method are combined to make up for the disadvantages of subjective or objective single weighting.
3.1. AHM Method to Determine Subjective Weights
The Attribute Hierarchical Model (AHM) is usually a method of unstructured decision making and originated from the Analytic Hierarchy Process (AHP). Compared with the AHP, the biggest advantage of AHM is a that the matrix provides a comparison even when the indexes do not fully align. It also reduces the difficulty of calculations to ensure consistency, making the evaluation is made to be simpler and more convenient [20]. The specific steps are as follows:
- (1)
- Establish an attribute judgment matrix
The nine-scale method is used to construct a comparison judgment matrix () to compare the relative importance of indicators at the same level. Using this approach, , . is transformed into a measurement matrix using the following formula:
In this expression, and , set as for this study.
- (2)
- Calculate the weight of the single layer index
Let the weight value of the bottom index relative to its top index be , where:
In the formula, is the number of sub-indexes to which the same parent index belongs. Let be the weight of index to the total target layer, be the weight of the index to its criterion layer, and be the weight of the criterion layer compared to the total target layer, where the index is located. Then, is:
3.2. Coefficient of Variation Method to Determine Objective Weight
Let be the weight of the index obtained using the coefficient of variation method; be the number of ecological evaluation indicators for industrial parks; and be the number of industrial parks to be evaluated. The formula to calculate the weight according to the coefficient of variation is as follows:
In this expression, is the value of the index of the industrial park evaluated, and is the average value of the index of all industrial parks evaluated [21].
3.3. Determination of Comprehensive Weight
Assume is the weight of the index after combining the two weighting methods. The variable is expressed as a linear combination of subjective weight and objective weight .
In the formula, is the proportion of the AHM method weight as a part of the combined weight; is the weight of the AHM method of the index; is the proportion of the variation coefficient method weight as a part of the combination weight; and is the weight of variation coefficient method to the index. The objective function was established by calculating the deviation between the combined weight and the AHM weight, and the minimum sum of squares of the deviation between the combined weight and the variation coefficient weight as the objective:
We substitute Equation (5) into Equation (6) to generate:
The derivative of Equation (7) with respect to was calculated, and the first derivative was set as zero. The solution is = 0.5. This was substituted into Equation (5) to generate:
Assume is the weight vector composed of the weights of all indicators. Then:
The derivation results of Equation (8) showed that: in the case of the minimum sum of squares of two deviations between the combined weight and the subjective and objective weight, the optimal combined weight result occurred when the subjective weight accounts for 50% of the total weight and the objective weight accounts for 50% of the total as well.
Finally, the combination weight obtained was the same as the subjective and objective weights, indicating that the subjective and objective were aligned with respect to the importance of the index. The subjective weighting method is the mapping of expert experience; however, expert experience is an intellectual summary of previous problems. Once the weights are determined, they rarely change and cannot reflect new changes in objective conditions. The objective weighting method lacks the knowledge of expert experience; however, the index weight relates to the index value, and the weight changes as the objective environment changes. Therefore, the combined weighting method adopted for this study reflects the experience of experts, and the new changes in objective conditions.
3.4. Grey Multi-Level Evaluation Model to Assess the Ecological Level of Industrial Parks
After establishing the evaluation index system, the next step is to build a mathematical model (evaluation model) to “synthesize” multiple evaluation index values into a comprehensive evaluation value. Using grey system theory, this study constructed the grey multi-level evaluation model to assess the ecological level of industrial parks. The specific steps are as follows:
- (1)
- Specify the evaluation level
For this study, a Five-level scale was used to divide the evaluation index into five grades, assigned as 1, 2, 3, 4, 5 (low to high). When the index grade fell between two adjacent grades, it was assigned a 1.5, 2.5, 3.5, or 4.5 [22].
- (2)
- Establish the evaluation sample matrix
The serial number of evaluation experts was , . That is, there were evaluation experts. According to the grading standard, each evaluation expert evaluated the evaluation index of the item into . The table shows that the evaluation sample matrix of the x project can be obtained as follows:
- (3)
- Determine evaluation grey category and evaluation criteria
This study assumed a serial number of evaluation grey classes was , . There are evaluation grey classes. The grey grade for evaluating the ecological level of industrial parks was set at 5. The five grades were: very poor, poor, general, good and very good, that is, = 5. Table 2 shows the corresponding scoring standards.
Table 2.
Scoring criteria.
To describe the grey classes above, the whitening weight function was assessed to evaluate the grey class [23].
The first grey class was defined as “very poor” ( = 1), the grey number was set to [0,1,2], and the whitening weight function was:
The second grey class was “poor” ( = 2). The grey number was set to [0,2,4], and the whitening weight function was:
The third grey class was “general” ( = 3). The grey number was set to [0,3,6], and the whitening weight function was:
The fourth grey class was “good” ( = 4). The grey number was set to [0,4,8], and the whitening weight function was:
The fifth grey class was “very good” ( = 5). The grey number was set to [0,5,10], and the whitening weight function was:
- (4)
- Calculate the grey evaluation coefficient
For evaluation index , the grey evaluation coefficient of item x, which belongs to the evaluation gray category, was , Similarly, the grey evaluation coefficient of each evaluation gray category was , .
- (5)
- Calculate the weight vector and weight matrix of the grey evaluation
According to the evaluation index , all evaluation experts recorded the grey evaluation weight of the evaluation gray category of item x as , . There were 5 grey categories, e = 1,2,3,4,5. As such, the study established a grey evaluation weight vector of the evaluation index of the evaluated item for each grey category. Thus, the grey evaluation weight matrix of index , which belongs to index of the evaluated item, was generated as follows:
- (6)
- Comprehensive evaluation
For the evaluation index of item x, the comprehensive evaluation result was recorded as .
Similarly, the comprehensive evaluation result of the index of the item to be evaluated was denoted as .
- (7)
- Calculate the comprehensive evaluation value
Assuming that the grade of each evaluation grey class is assigned as a “grey level”, then the evaluation vector C = (1,2,3,4,5). Therefore, the comprehensive evaluation value of the item was calculated as follows:
4. Empirical Study on the Ecological Level Evaluation of Industrial Parks
4.1. Source of Evaluation Object Samples
Data released by the Ministry of Ecology and Environment indicate that 51 industrial parks nationwide had been named as national eco-industrial demonstration parks as of June 2019. Nine of these were located in Jiangsu. There are nearly 7000 industrial parks and concentration areas. For this study, four representative industrial parks were selected for ecological level evaluation, based on park characteristics, operational mode, and areas. The parks selected for evaluation included the Suzhou industrial park, the Tianjin economic and technological development zone, the Dalian economic and technological development zone, and the Fushun mining group. For the rest of this paper, these are referred to as Suzhou industrial park (SZIP), TEDA, Dalian industrial park (DLIP), and Fushun industrial park (FSIP). Figure 3 and Table 3 show the geographical distribution and basic information for each park.
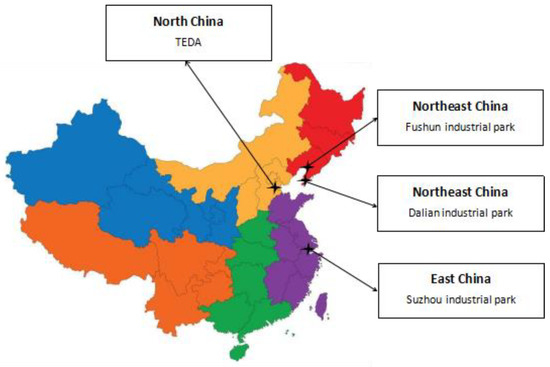
Figure 3.
Geographical location of each park.
Table 3.
Basic information about each park.
In general, mathematical statistics requires there to be a large number of samples, and the data must obey a typical distribution pattern. In contrast, grey system theory solves the problems of “small sample” and “poor information uncertainty.” In the literature on grey multi-level theory, five experts are generally selected to analyze the evaluation objects, yielding objective and reliable evaluation results. Therefore, this study adopted the expert evaluation method to determine the sample matrix. Five eco-industrial park experts were asked to grade the evaluated objects using the grading standards. The experts’ evaluations were used to establish the evaluation sample matrix, to determine the gray evaluation category, and to calculate the gray evaluation weight matrix. This enabled the calculation of the final eco-industrial park evaluation score.
4.2. Determination of Index Weight
The objective weight of each index of eco-industrial park evaluation was determined using the coefficient of variation method. The subjective weight of each index of eco-industrial park evaluation was determined using the AHM method. The comprehensive weight was determined using the determination method of comprehensive weight. Table 4 shows the specific weight values.
Table 4.
Evaluation index system and weight of ecological level for the four industrial parks.
4.3. Ecological Level Evaluation and Analysis of Results for the Industrial Parks
The evaluation index system and model constructed above were applied to evaluate and analyze the ecological level of SZIP, TEDA, DLIP, and FSIP. Table 5 shows the evaluation results.
Table 5.
Ecological evaluation results for the four industrial parks.
- (1)
- Analysis of ecological evaluation results of the eco-industrial parks
Figure 4 shows the ecological evaluation results of the four industrial parks assessed for this study.
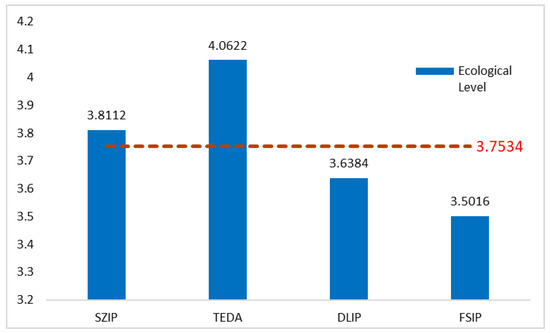
Figure 4.
Ecological level of the four industrial parks.
Figure 4 indicates that the ecological level of the four industrial parks could be ranked as follows: TEDA (4.0622) > SZIP (3.8112) > DLIP (3.6384) > FSIP (3.5016). Of these, the ecological level of the TEDA and SZIP was higher than the average level (3.7534). According to the score criteria set above, the ecological level of TEDA was “very good,” and the ecological level of the other three industrial parks was “good.”
- (2)
- Evaluation result analysis of each criterion layer index
Figure 5 and Figure 6 show that TEDA had the highest economic development evaluation value, indicating a good state of economic development and a solid economic foundation. In contrast, FSIP has the lowest economic development level. In 2017, the GDP of Tianjin was 1859.538 billion yuan, and the added value of its secondary industry was 759.036 billion yuan. The total output value from Fushun was 95.45 billion yuan, and the added value of its secondary industry was 50.59 billion yuan. These two sets of data reflect a large gap between the economic situations of Tianjin and Fushun. The gap in the added value of the secondary industry indicates that the economic foundation and development level of FSIP was relatively weak. As a result of the implementation of the strategy of “Beijing-Tianjin-Hebei integration development,” many companies, mainly science and technology enterprises, have entered TEDA. With them has come significant investments and innovation capabilities, providing industrial advantages. This is an important reason for the high economic strength of TEDA.
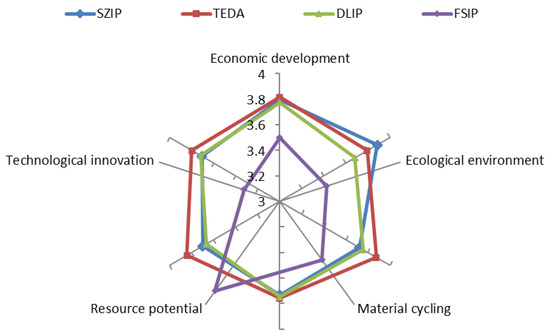
Figure 5.
Index evaluation results of each criterion layer.
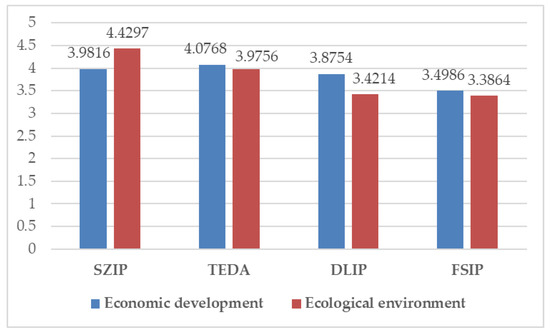
Figure 6.
Evaluation results of economic development and ecological environment criterion layer.
Figure 5 and Figure 6 show that the eco-environmental evaluation value of SZIP was significantly higher compared to the other three industrial parks, which was at a “very good” level. The level is impacted by the fact that SZIP is an important cooperation project between the governments of China and Singapore. The park is being built by drawing on Singapore’s advanced experience in urban planning and construction and the concept of green development. The park has been firmly established as an “environment area” and “ecological zone” development area. In 2017, the energy consumption per unit GDP of SZIP was 0.254 tons of standard coal/ten thousand yuan, significantly exceeding the average level of 0.65 tons of standard coal/ten thousand yuan in the same period of China. In contrast, Table 5 shows that the ecological value of DLIP (3.4214) and FSIP (3.3864) was below the average level (3.8033). This is mainly due to the Liaoning Province is an old industrial base. It has a high proportion of heavy industry, higher structural pollution, and a historical deficit of environment protection. In recent years, Liaoning Province has initiated the ecological construction of its key industrial park, but there remains a big gap between Liaoning and Suzhou in terms of the ecological environment of the industrial parks.
Figure 5 and Figure 7 show that the material cycling assessment value of TEDA was significantly higher compared to the other three industrial parks, at a “very good” level. TEDA has consistently adhered to the concept of sustainable development since its construction, and it has consistently pursued a goal of developing a circular economy to benefit both the economy and environmental protection. TEDA has built the industrial circulation chain around large projects, has built high-end industrial structure, and has improved the development network of circular economy. It has done this by relying on technology-based small and medium-sized enterprises. According to the development strategy of “big projects lead, small giants push,” the park has insisted on using the construction of major projects as a starting point. Scientific and technological progress then serve as the support, to comprehensively improve the utilization efficiency of resources, energy, and waste resources in the park. In addition, in the resource and energy sharing system, the TEDA has constructed a regional integrated water resources utilization system on the 33 square kilometers of natural resources. Using seawater desalination, sewage treatment, and reclaimed water reuse, the park has formed a relatively complete “treatment, regeneration and utilization” mode with respect to water resources. It became the first constructed wetland in China to replenish water with a reclaimed water level.
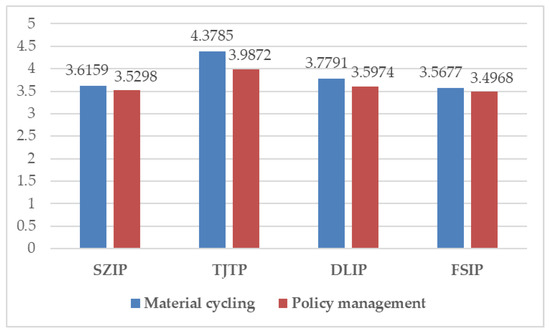
Figure 7.
Evaluation results of material cycling and policy management criterion layer.
Table 4 shows that the weight of policy management in the ecological evaluation index system of the industrial parks is the largest (0.2849). It indicates that policy management has a greater impact on the ecological level of industrial park. Figure 5 and Figure 7 show that the evaluation value of the policy management of TEDA is the highest. This suggests that the government of Tianjin and park management committee have achieved significant advances in policy guidance, regulation, oversight and management of the park. For example, in July 2018, the Tianjin Municipal Government began to comprehensively promote the governance of industrial parks to speed up industrial layout optimization and ecological civilization construction. The government is expected to integrate 35 industrial parks and revoke 10 industrial parks, and plans to revoke 116 industrial parks within three years. This is intended to create innovative, open and ecological industrial parks. In addition, TEDA assigns great importance to the influence of employees and public forces on the ecological construction of the park. For example, the park has established a waste minimization club, and regularly organizes enterprises to carry out waste recycling, cleaner production training, and exchange activities. Non-profit environmental protection organizations, such as the Friends Of Green China Tianjin, and Tianjin Binhai Environmental Advisory Service Center, have carried out ecological management marking activities, which oversees and publicizes the ecological construction of the park, and alleviate environmental contradictions among private enterprises.
The resource potential and technological innovation ability of the industrial park somewhat explain the park’s ecological development potential. First, from the perspective of resource potential in the parks, Figure 5 and Figure 8 show that the four industrial parks differ little with respect to evaluation values and were all at a “good” level. The evaluation value of the resource potential of FSIP was slightly higher compared to the other three industrial parks. Fushun is an important raw material industrial base in China. FSIP has made full use of the resources available from the old industrial base and has attracted many high-level projects at home and abroad. In 2017, it had 74 million tons of coal reserves and 600 million tons of oil shale reserves, with a mining life of 60 years. In addition, Fushun’s renewable resources industrial park has achieved the comprehensive utilization of bulk industrial solid waste, which is an important direction towards industrial transformation and upgrades.
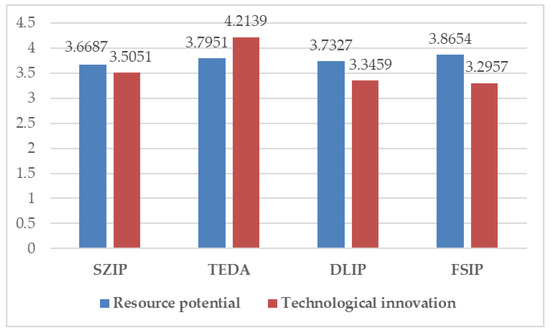
Figure 8.
Evaluation results of resource potential and technological innovation criterion layer.
Second, from the perspective of technological innovation at the park, the evaluation value of TEDA was significantly higher compared to the other three industrial parks. TEDA was rated at a “very good” level, and the other three were rated at a “good” level. Generally, industrial parks improve their independent innovation ability through government support, cooperation with universities, and attracting the entrance of innovative enterprises. With the gradual deepening of the coordinated development between Beijing and Tianjin, TEDA has gained support from the Beijing Municipal Science and Technology Commission in terms of technological innovation, in addition to the above methods. From 2014 to 2017, the transaction volume of technical contracts output from Beijing to Tianjin and Hebei reached 555.28 billion yuan, with an average annual growth rate exceeding 30%. In November 2018, a cooperative agreement to jointly promote the construction of Beijing-Tianjin-Hebei collaborative innovation community (2018–2020) was first signed. This initiated a period of in-depth cooperation between Beijing and Tianjin in the field of technological innovation and further improved the technological innovation level of TEDA.
5. Conclusions and Discussion
The eco-industrial park is a new type of industrial park designed and established based on the concept of a circular economy, the principles of industrial ecology, and clean production requirements. These parks are of great significance when considering effective resource utilization, environmental protection, and sustainable development. However, the ecological construction of most industrial parks are in a poor state. Therefore, establishing a scientific evaluation index system and evaluation model to assess eco-industrial parks is needed to advance the eco-development and construction of industrial parks.
Based on a literature research and expert interviews, this study constructed an evaluation index system to assess eco-industrial parks based on the newly revised National Eco-industrial Demonstration Parks Standard in 2015. The study focused on four representative eco-industrial parks in China for an empirical study. The index weight was determined using a combination of the AHM method and coefficient of variation method. The ecological level of the four eco-industrial parks was evaluated using the grey multi-level evaluation method. The evaluation results revealed the following results.
(1) According to the weight calculations, the order of importance of the criterion layer relative to the target layer were as follows: policy management (0.2849) > economic development (0.2113) > ecological environment (0.1819) > material cycling (0.1394) > technological innovation (0.0924). Of these, policy management had the highest weight; the total weight of policy management and economic development was close to 50%. This demonstrates that at the present stage of eco-industrial park development in China, the following factors play the most important roles in the ecological development of the park: the government’s policy guidance and oversight, the perfection of park regulation and management mechanisms, the public’s participation in the practice of social mechanism of environmental protection, and the ability of the park to develop economically.
(2) TEDA had the highest ecological level and was at a “very good” level. Its evaluation values associated with the four aspects of policy management, economic development, material cycling, and technological innovation were all higher compared to the other three eco-industrial parks. It should work to maintain its current level. The Tianjin government has attached great importance to optimizing the industrial structure and ecological construction of TEDA. As such, it has attracted many technologically innovative enterprises and sources of talent to enter the park through the Collaborative Development of Beijing-Tianjin-Hebei, and has issued a series of policies to support the development of small and medium-sized technology enterprises. This has provided a steady stream of power supporting the economic development of the park, the optimization of the circular system, and the improvement of the industrial chain.
(3) The ecological level of SZIP was ranked second. Although its ecological environmental evaluation value was far ahead of the other industrial parks, the evaluation values associated with material cycling, policy management, and resource potential were lower than the mean value. SZIP can improve its resource utilization efficiency by strengthening the overall industrial layout and planning the formation of a circular economy industrial chain structure, focused on resource waste regeneration. In addition, SZIP should also address the redevelopment of inefficiently used industrial land in the park, and fully tap the potential value of land resources.
(4) The ecological level of DLIP and FSIP ranked third and fourth, respectively. Both are located in Liaoning Province in northeast China. This province is an important old industrial base. It is rich in mineral resources, with a relatively developed assembly manufacturing industry and raw material industry. The two parks have developed their own characteristic industries, based on abundant natural resources. However, they have also negatively impacted the ecological environment. DLIP and FSIP should be guided towards better aligning with the government’s policies, better coordinating science and technology resources, encouraging and attracting innovative enterprises and talents, advancing the improvement of green innovation technology and cleaner production technology, mobilizing and rallying public forces, establishing an eco-environmental protection committee, and organizing a series of environmental protection activities. These actions would enhance the attention of the government and the industrial park management committee on the ecological construction of the park.
This study enriched the theory and practice of conducting ecological evaluations of industrial parks and provided a reference for the ecological construction of traditional industrial parks. However, like all studies, there were some limitations. First, due to the difficulty collecting data and information about industrial parks in the central and western regions, the four industrial parks selected in this study are all located in the eastern part of China. This prevented the exploration of regional differences in the evaluation index system.
Second, most data used in this study were cross-sectional data from 2014 to 2018. This prevented a more dynamic data analysis. Therefore, to further improve the evaluation index system to assess industrial park ecology, follow-up studies should consider the differences between the ecological environment, economic development, characteristic industries, and management modes of industrial parks in different regions. This would support the increased analysis of panel data to make the evaluation results more scientific. Despite these limitations, the study adds value to the field by building an evaluation index system of the ecological level of industrial parks.
Author Contributions
D.L. conducted the experiments, collected, analyzed the data, and wrote the manuscript with B.Q. Technical advice and assistance were provided by B.Q. All authors have read and agreed to the published version of the manuscript.
Funding
This research was funded by National Natural Science Foundation of China, grant number 71874021, National Natural Science Foundation of China, grant number 71974024, and Humanity and Social Foundation of Ministry of Education of China, grant number 18YJA630091.
Institutional Review Board Statement
Not applicable.
Informed Consent Statement
Not applicable.
Data Availability Statement
The data presented in this study are available on request from the corresponding author.
Conflicts of Interest
The authors declare no conflict of interest.
References
- Tessitore, S.; Daddi, T.; Iraldo, F. Eco-Industrial Parks Development and Integrated Management Challenges: Findings from Italy. Sustainability 2015, 7, 10036–10051. [Google Scholar] [CrossRef]
- Shi, L.; Yu, B. Eco-Industrial Parks from Strategic Niches to Development Mainstream: The Cases of China. Sustainability 2014, 6, 6325–6331. [Google Scholar] [CrossRef]
- Liu, Z.; Adams, M.; Cote, R.P.; Geng, Y.; Li, Y. Comparative study on the pathways of industrial parks towards sustainable development between China and Canada. Resour. Conserv. Recycl. 2018, 128, 417–425. [Google Scholar] [CrossRef]
- United Nations. The Rio Declaration on Environment and Development. In Proceedings of the United Nations Conference on Environment and Development, Rio De Janerio, Brazil, 3–14 June 1992. [Google Scholar]
- Ministry of Ecology and Environment. Three Ministries and Commissions Jointly Recruited Technical Consultation Experts from the National Eco Industrial Demonstration Zone to further Strengthen the Management and Technical Support Work of the National Eco-Industrial Demonstration Park. Available online: http://www.mee.gov.cn/xxgk/hjyw/201906/t20190620_707260.shtml (accessed on 20 June 2019).
- Huiling, B. Research on the development status of China eco-industrial park. SAR Econ. 2019, 1, 59–61. [Google Scholar]
- Jinping, T.; Wei, L.; Na, Z.; Lvjun, C. Development status and Prospect of China eco-industrial park. Acta Zool. Sin. 2016, 36, 7323–7334. [Google Scholar]
- Liu, C.; Cote, R. A Framework for Integrating Ecosystem Services into China’s Circular Economy: The Case of Eco-Industrial Parks. Sustainability 2017, 9, 1510. [Google Scholar] [CrossRef]
- Huang, H.; Zhang, H. Evaluation of eco-industrial parks based on grey clustering method. J. zhejiang Univ. Technol. 2005, 4, 379–402. [Google Scholar]
- Yong, Y. Review of Eco-industrial Parks. Econ. Geogr. 2000, 20, 31–35. [Google Scholar]
- Yuan, J. Study on the Evaluation Index System of Eco-industrial Park. Environ. Prot. 2003, 3, 38–40. [Google Scholar]
- Hua, S. Empirical Study on Stability Evaluation of Eco-Industrial Park. Sci. Res. Manag. 2012, 12, 142–148. [Google Scholar]
- Deog-Seong, O.; Kyung-Bae, K.; Sook-Young, J. Eco-Industrial Park Design: A Daedeok Technovalley case study. Habitat Int. 2005, 29, 269–284. [Google Scholar]
- Ying, Q. Study on the Role of Policy Factors in the Effective Management of Eco-industrial Parks. Contemp. Econ. Manag. 2013, 3, 23–29. [Google Scholar]
- Chen, G.; Dai, Y.H. Performance evaluation of eco-industrial park based on fuzzy mathematics. J. Hunan Univ. Sci. Technol. 2016, 4, 82–89. [Google Scholar]
- Ministry of Ecology and Environment. Announcement on Issuing the National Environmental Protection Standard “National Eco-Industrial Demonstration Park Standard”. Available online: http://kjs.mee.gov.cn/hjbhbz/bzwb/other/qt/201512/t20151224_320149.htm (accessed on 6 July 2019).
- Huang, B.; Yong, G.; Zhao, J.; Domenech, T.; Liu, Z.; Chiu, S.F.; McDowall, W.; Bleischwitz, R.; Liu, J.; Yao, Y. Review of the development of China’s Eco-industrial Park standard system. Resour. Conserv. Recycl. 2019, 140, 137–144. [Google Scholar] [CrossRef]
- Zhai, D.S.; Zeng, Q.L. Evaluation index system of comprehensive eco-industrial park effectiveness. J. Hunan Agric. Univ. 2016, 1, 94–99. [Google Scholar]
- Deng, J. Multi-Dimensional Grey Planning; Huazhong University of Science and Technology Press: Wuhan, China, 1989. [Google Scholar]
- Wang, W.; He, Y.; Zhang, D.; Wu, Y.; Pan, D. Multi-Criteria Evaluation of Best Available Treatment Technology for Waste Lead-Acid Battery: The Case of China. Sustainability 2020, 12, 4479. [Google Scholar] [CrossRef]
- Wang, R.; Huston, S.; Li, Y.; Ma, H.; Peng, Y.; Ding, L. Temporal Stability of Groundwater Depth in the Contemporary Yellow River Delta, Eastern China. Sustainability 2018, 10, 2224. [Google Scholar] [CrossRef]
- Wang, Q.; Li, Y. Supplier evaluation based on Grey multilevel evaluation method. Aviat. Manuf. Technol. 2010, 8, 72–75. [Google Scholar]
- Zhang, B.; Chen, J. Supply chain risk assessment based on Grey multi-level evaluation model. Sci. Technol. Manag. 2011, 13, 56–59. [Google Scholar]
Publisher’s Note: MDPI stays neutral with regard to jurisdictional claims in published maps and institutional affiliations. |
© 2021 by the authors. Licensee MDPI, Basel, Switzerland. This article is an open access article distributed under the terms and conditions of the Creative Commons Attribution (CC BY) license (http://creativecommons.org/licenses/by/4.0/).