Article

The Recharge Process and Influencing Meteorological Parameters Indicated by Cave Pool Hydrology in the Bare Karst Mountainous Area

Key Laboratory of Karst Dynamics, MNR/GZAR, Institute of Karst Geology, Chinese Academy of Geological Sciences, Guilin 541004, China
*
Author to whom correspondence should be addressed.
Sustainability 2021, 13(4), 1766; https://doi.org/10.3390/su13041766
Submission received: 30 December 2020 / Revised: 19 January 2021 / Accepted: 31 January 2021 / Published: 6 February 2021
(This article belongs to the Special Issue Karst and Environmental Sustainability)

Abstract

:
Understanding the recharge and runoff processes of the vadose zone is significant for water resource management and utilization in karst mountain areas. Hydrological modeling of the vadose zone in karst caves has provided new methods of evaluating water resources in vadose zones. This paper provides modeling of vadose zone hydrology in a subtropical karst cave. The monitoring was conducted in Yuanyang Cave, Fengshan County, Guangxi Province, Southwest China. By monitoring the water level of a pool recharged by drop water in a cave, a model was established to calculate the natural leakage from the bottom and the infiltrated recharge from the vadose zone above. Combined with meteorological data records, the occurrence of recharge events in the vadose zone was analyzed. The correlation between them was established by multiple linear regression. The results showed that the infiltration ratio of precipitation was 20.88%. Recent rainfall of 4–7 days had shown a greater impact on recharge events than that of 3 days. The effect of evaporation was significant. The regression model in the cave pool was used to understand the hydrological process of the vadose zone, which provided a useful method for water resource management and evaluation in the remote karst mountain area.

1. Introduction

The global karst area accounts for 15% of land area, and about a quarter of the global population depends on karst water [1]. In karst areas, the thick vadose zone can infiltrate and store a large amount of water. Due to the heterogeneity of the karst water system, there are karst fissures and conduit networks, which aggravate the difference in permeability of the karst vadose zone, thus increasing the difficulty of studying the karst water cycle and recharge process [2,3].
The water cycle process in karst mountainous areas covers precipitation, evapotranspiration, surface slope runoff, subsurface runoff in soil, infiltration and percolation in the epikarst zone–vadose zone–saturated zone. Surface runoff occupies less than 5% on karst hillslopes in Southwest China [4]. Subsurface runoff in soil accounts for 9% [5]. The epikarst zone has an infiltration rate of approximately 35 mm h−1 [6]. Rainfall infiltrates from the epikarst zone into karst fissures or conduits mainly in the form of vertical flow, becoming the runoff of the vadose zone as the depth increases [7]. Deep percolation is the main runoff component, accounting for 71% of the total rainfall [5]. The runoff generation process is subject to a rainfall percolation threshold and a rain intensity threshold [8].
Based on different karst media, the infiltration process can be divided into concentrated infiltration and diffuse infiltration [9]. Concentrated infiltration passes through sinkholes and karst conduits to the saturated zone directly and rapidly. Diffuse infiltration mainly passes through the soil layers and karst fissures, and it takes time for water to reach the saturated zone due to vadose zone thickness [10,11]. The thickness of the vadose zone has a very strong influence on residence times [12]. In the karst vadose zone, fissures and conduits are formed after long terms of the karstification processes, providing space for groundwater flow. The vertical infiltration that occurs in the karst fissures or conduits of the vadose zone causes the water table to decrease. The remaining water discharges as vadose seepage slowly and continuously, which could be observed as cave drips if there are caves below [13].
As a kind of vadose runoff, the water flow in the cave can be divided into dripping water and flowing water according to the flow rate. Dripping water generally originates from karst fissures and is characterized by a slow flow rate and a laminar flow state. Flowing water originates from karst fissures or conduits and is characterized by large flow rate changes. Some water flows in a cave are flowing water in the rainy season and dripping water in the dry season, thus becoming composite water flows. Hydrological dynamics in cave water are closely related to rainfall and are sensitive to heavy rainfall [14]. Studies have shown that in the vadose zone above karst caves, there is a coexistence of different flow mechanisms due to the difference in permeability and saturation of different media [15]. The hydrological dynamics of cave water flow are jointly regulated and stored by multiple layers of karst media.
The estimation of rainfall recharge is significant for understanding the water cycle process, pollutant migration and water resource management [16]. Previous studies have been conducted to calculate the recharge of karst areas by monitoring dripping water from karst caves [17,18]. Rainfall on the slope converges into large numbers of small runoffs, which are quickly formed. In order to improve the calculation accuracy, there have been studies using slope-scale rainfall simulation experiments and observations of cave drip water in karst caves under the slope to estimate the recharge amount [19]. Caves above the vadose zone typically have a certain thickness. When vadose runoff discharges, the observed runoff process often lags the rainfall process. The lag can be calculated using Time Series Analysis (TSA) [12,20]. According to the correlation between rainfall and recharge, the recharge process can be simulated by regression models of related parameters [21].
Only a few studies that directly characterized the natural cave flowing water processes of karst cave systems have been conducted [14,15,22,23]. In this paper, through the dynamic monitoring of the water level of a leaking pool in Yuanyang Cave, a recession model was established to calculate the natural leakage and the infiltrated recharge of the vadose zone from above. After determining the infiltrated recharge, combined with meteorological data records, the precipitation infiltration coefficient was estimated and the correlation between recharge and climate factors was established by multiple linear regression.

2. Materials and Methods

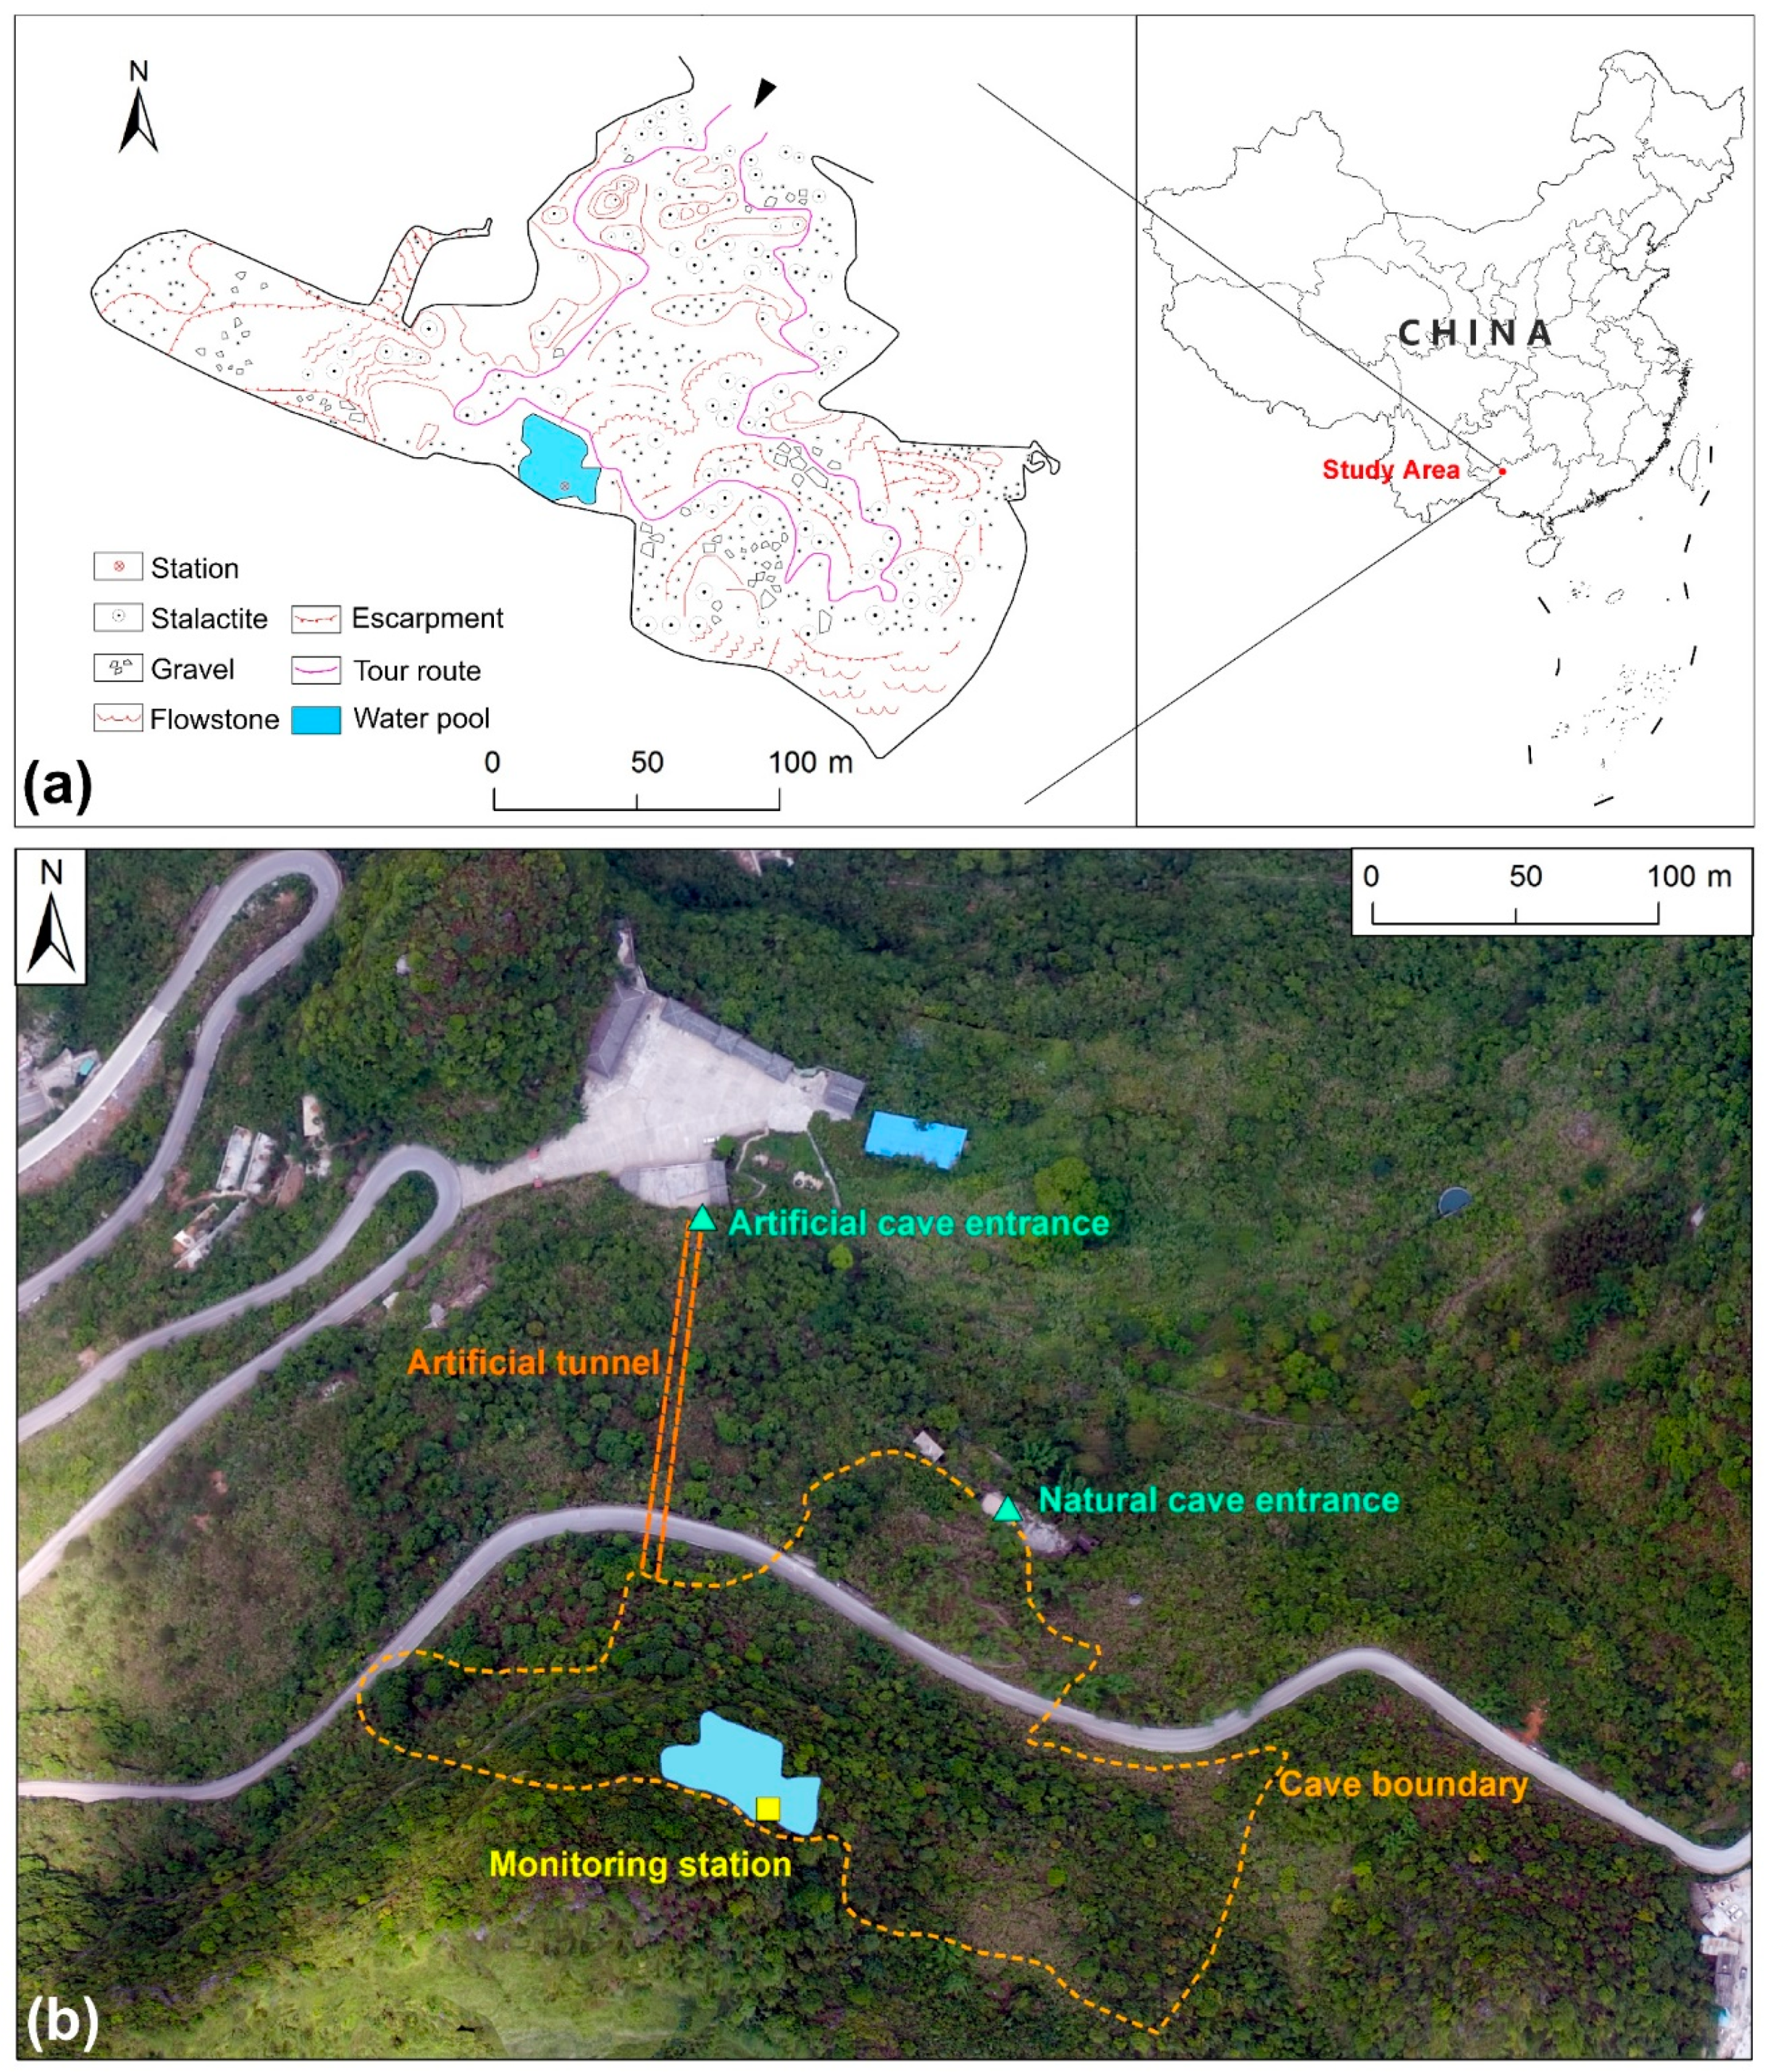
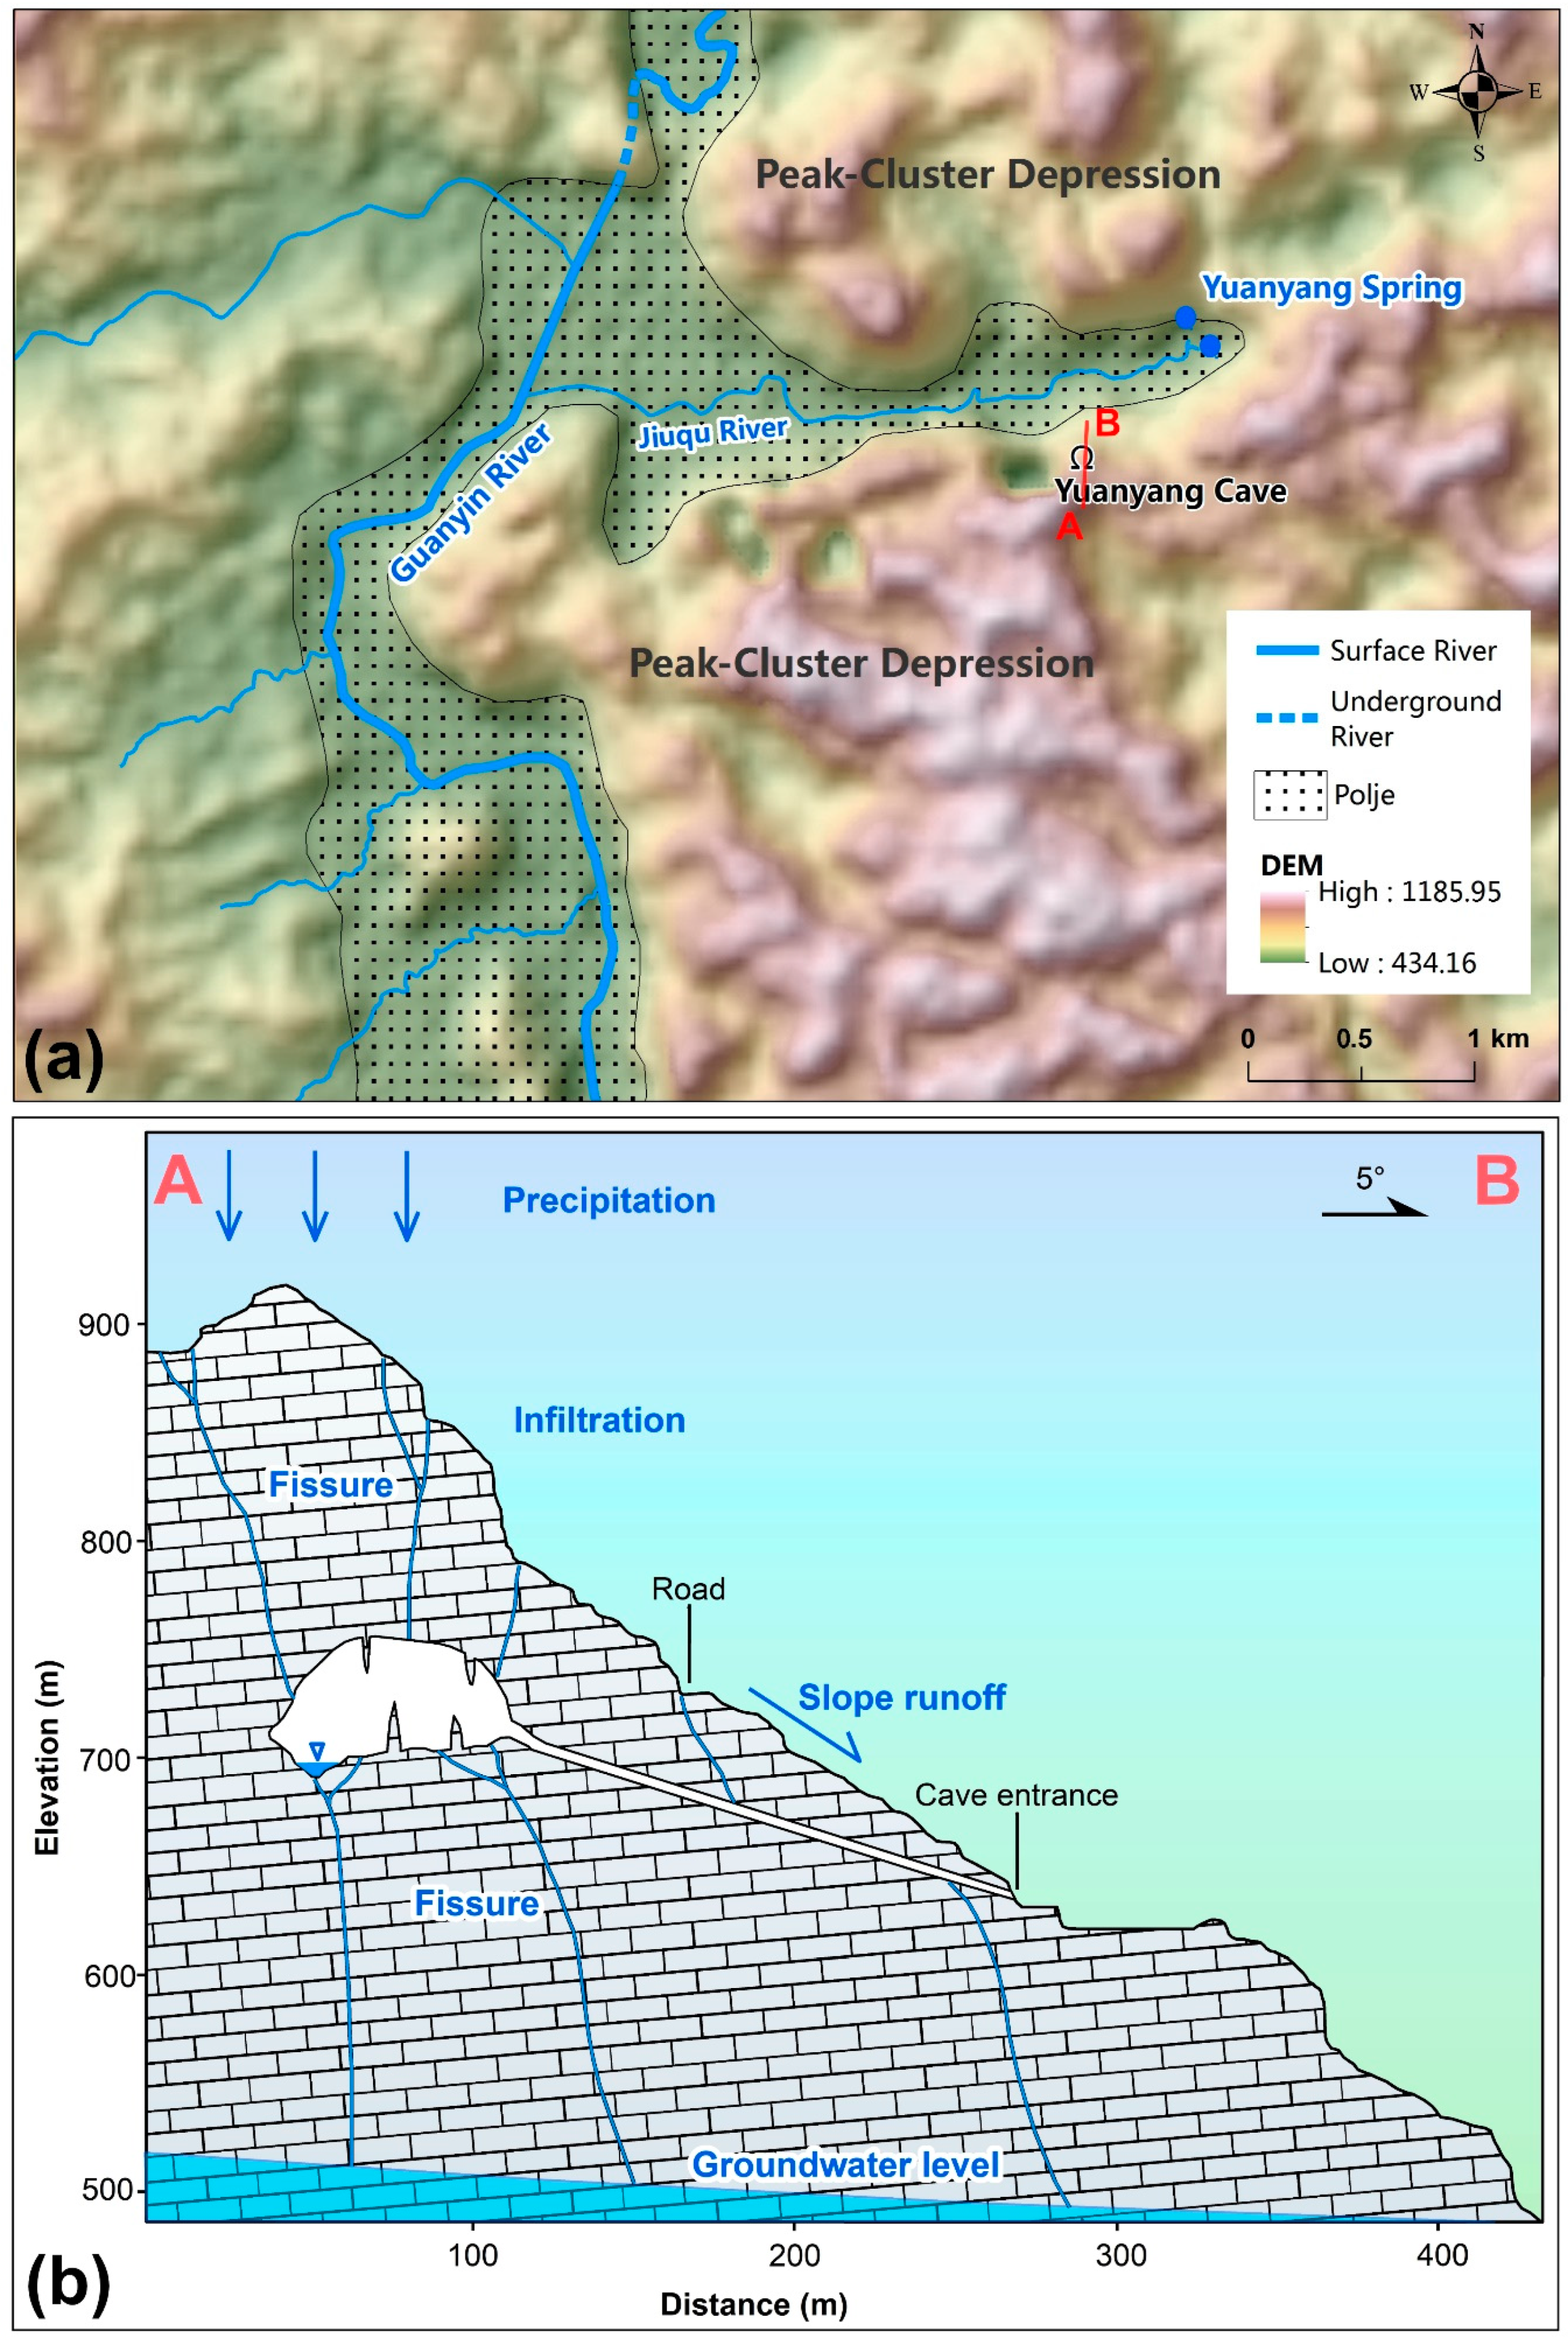
2.1. Description of Study Area
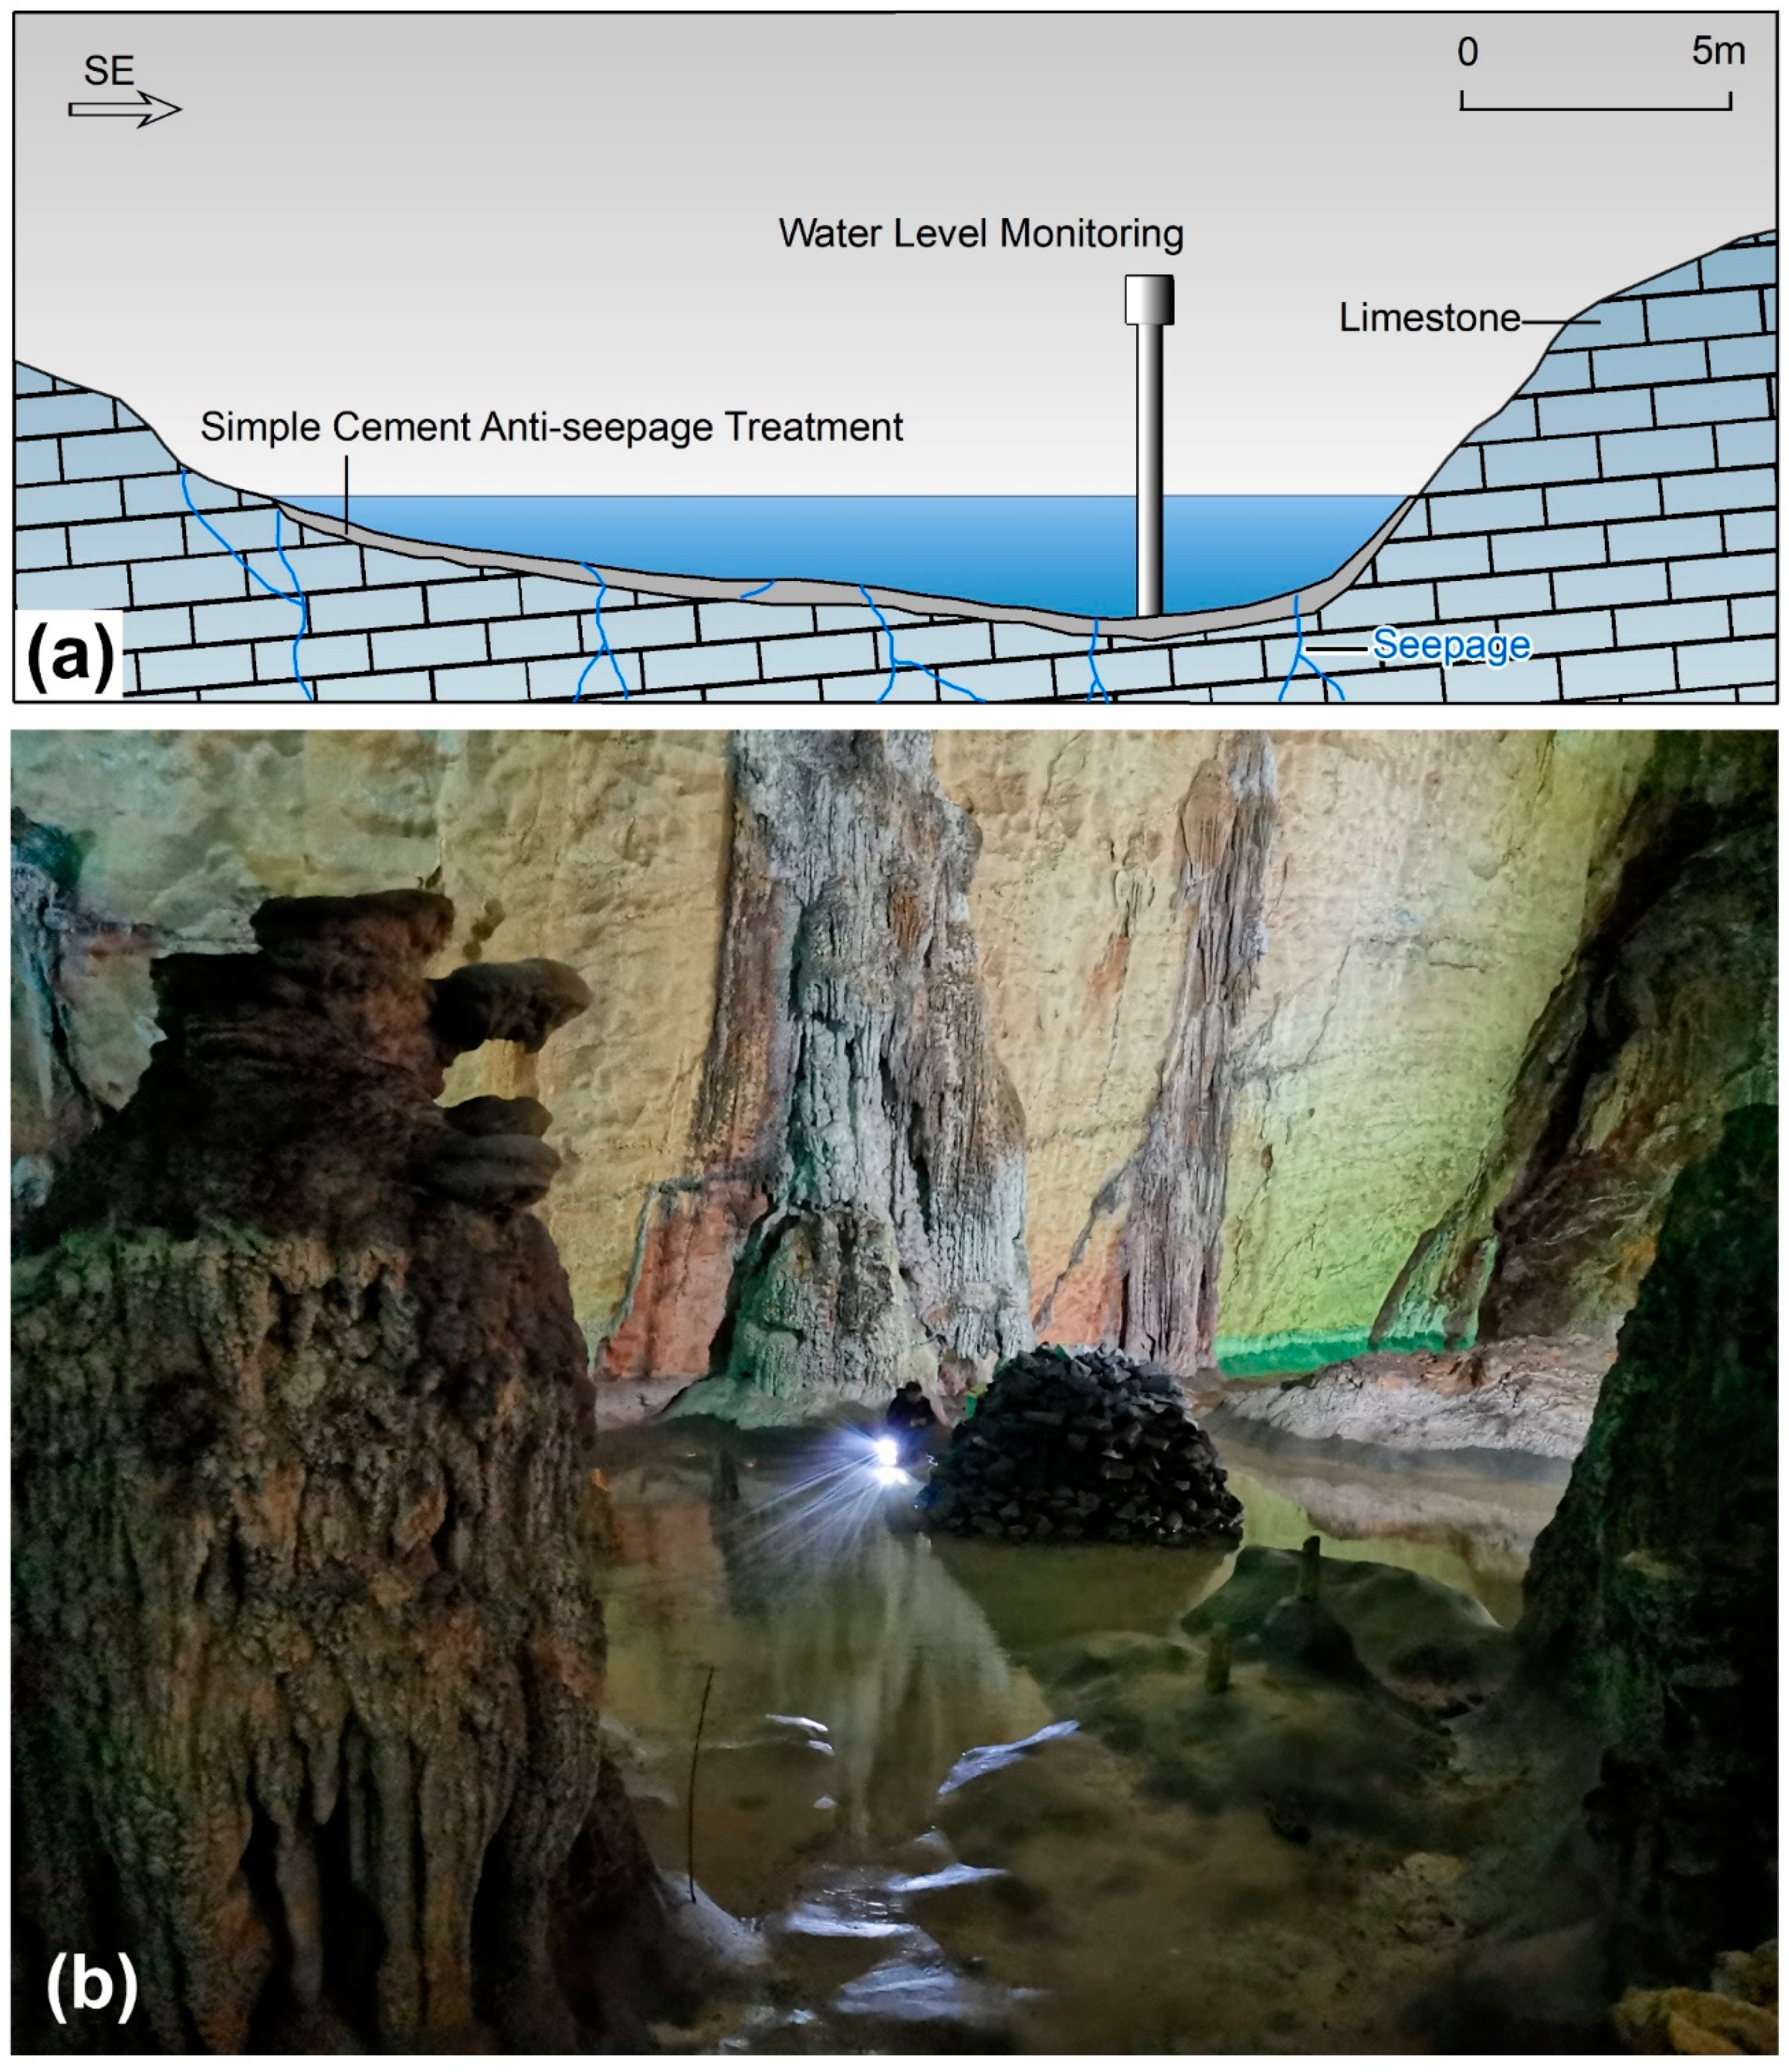
Yuanyang Cave (N 24.539386°, E 107.067041°) is located on a hillside 2.5 km east of Fengshan County, Guangxi Province, China. It is a karst cave located on the edge of a polje. The location and plan view map of Yuanyang Cave are shown in Figure 1a, which was based on the study of Jean Bottazzi and others [24]. Figure 1b is a remote sensing image, which was taken in December 2019 by a DJI Phantom 4 drone with a visible band camera. Except for the construction of a road, there is little impact from human activities above the cave. The landform of the polje below Yuanyang Cave is shown in Figure 2a. There are contiguous karst peaks and depressions to the east. At the east end of the polje, there is a karst spring with two outlets, which is called Yuanyang Spring. The vertical height of the cave and hilltop is about 200 m. A geological and water-cycle section of the slope is depicted in Figure 2b. The cliff above the cave is steep. Carbonate formations provide good conditions for rainfall infiltration.
The cave is a show cave. A tunnel with a length of 200 m was opened to facilitate sightseeing by the tourism management department. Some lights were decorated in the cave and a tour route was built. In the cave, there are stone pillars, stalagmites, stone mantle and other geological and geomorphological features. The natural cave entrance is 7.5 m high and 12 m wide. The highest point of the cave hall is 52 m, and there is only one hall in this cave. Most of the tall stalagmites in the south of the cave have a diameter of 0.5–6 m, the largest diameter is 10 m and the height is mostly 5–15 m, of which 32 stalagmites are over 10 m. The tallest stalagmite in the cave is 36.4 m, ranking as one of the tallest stalagmites in the world. Numerous stalactites provide conditions for cave drip water and flow water.
Fengshan County is in a subtropical monsoon region, with abundant rainfall and a mild and humid climate. The average annual temperature is 19.4 °C, and the average annual rainfall is 1506 mm (1951–2013). Rainfall is unevenly distributed throughout the various months of the year, with the largest proportion of rainfall from April to September. Taking the rainfall data from 2017 to 2018 as an example, the maximum daily rainfall was 678.8 mm and 408.3 mm, both occurring in June, and the minimum daily rainfall was 6.1 mm and 5.5 mm, both occurring in February. The soil is mainly composed of clayey loam. The thickness varies from 0–2 m. The stratum of Yuanyang Cave is the Upper Carboniferous series, which is a medium-thick layer of massive limestone with dolomite. In terms of geological structure, this area was affected by compound folds dominated by anticlines. The squeezing and uplifting produced strong fragmentation, which provided conditions for karst cave development [25].

2.2. Methodology

There is a simple cement anti-seepage treatment at the bottom of the water pool in Yuanyang Cave, which reduces leakage and allows better accumulation of runoff. Since the pool is the lowest point in the cave, parts of flowing water and dripping points in the cave eventually merge there. The water level monitoring station was built in the deepest part of the pool, and a Solinst Levelogger was set to record water level changes. The recording interval was 15 min, and the accuracy was 0.01 cm. The observation period was from January 2017 to December 2019, covering three complete hydrological years. Figure 3a is a schematic diagram of the water level monitoring station. Figure 3b is a photograph of the pool in Yuanyang Cave. Behind the rock pile and in front of the bright light spot in the photo is the monitoring station.
A cave water sample was collected in the pool in December 2018; the main cations were analyzed by ICP-MS, the main anions were determined by spectrophotometry, and HCO3 was determined by acid-base titration. The test and analysis were performed at the Karst Geological Resources Environmental Supervision and Inspection Center of the Ministry of Natural Resources. pH value, dissolved oxygen (DO) and conductivity (EC) were measured in site using a WTW Cond 3420. The rainfall and evaporation data were the daily monitoring data of Fengshan Meteorological Station, which is located about 3.8 km west of Yuanyang Cave. These data were obtained from the China Meteorological Data Website, Data Source: China Meteorological, Data Website http://data.cma.cn/. SPSS Statistics was used for data processing and analysis. ArcMap was used for creating graphs.
Cave water was pooled in low-lying areas inside the cave, while the pool had a natural leakage process because of the karst fissures at the bottom under most circumstances. The cave’s flowing water which was produced by infiltrated vadose runoff could be collected in the cave pool. When the rainfall recharge increased, the water level of the pool rose. Meanwhile, the amount of attenuation varied with water level changes due to the natural leakage. The water level dynamics of the pool could reflect the hydrological dynamics of the vadose runoff above the cave, thereby enabling calculation of the rainfall recharge. For karst springs, the tank model could be used to study the characteristics of spring flow recession [22,26]. The natural leakage process of the cave pool also conformed to the theory of the tank model. The research method of recession analysis was applicable. After obtaining the water level record data, the recession time of each water level was calculated by the deductive equation of the recession equation. Then the recession time was used to calculate the recession water level, which is caused by the natural recession process. Finally, the infiltration recharge was calculated by subtracting the natural recession from the actual water level change.

3. Results and Discussion

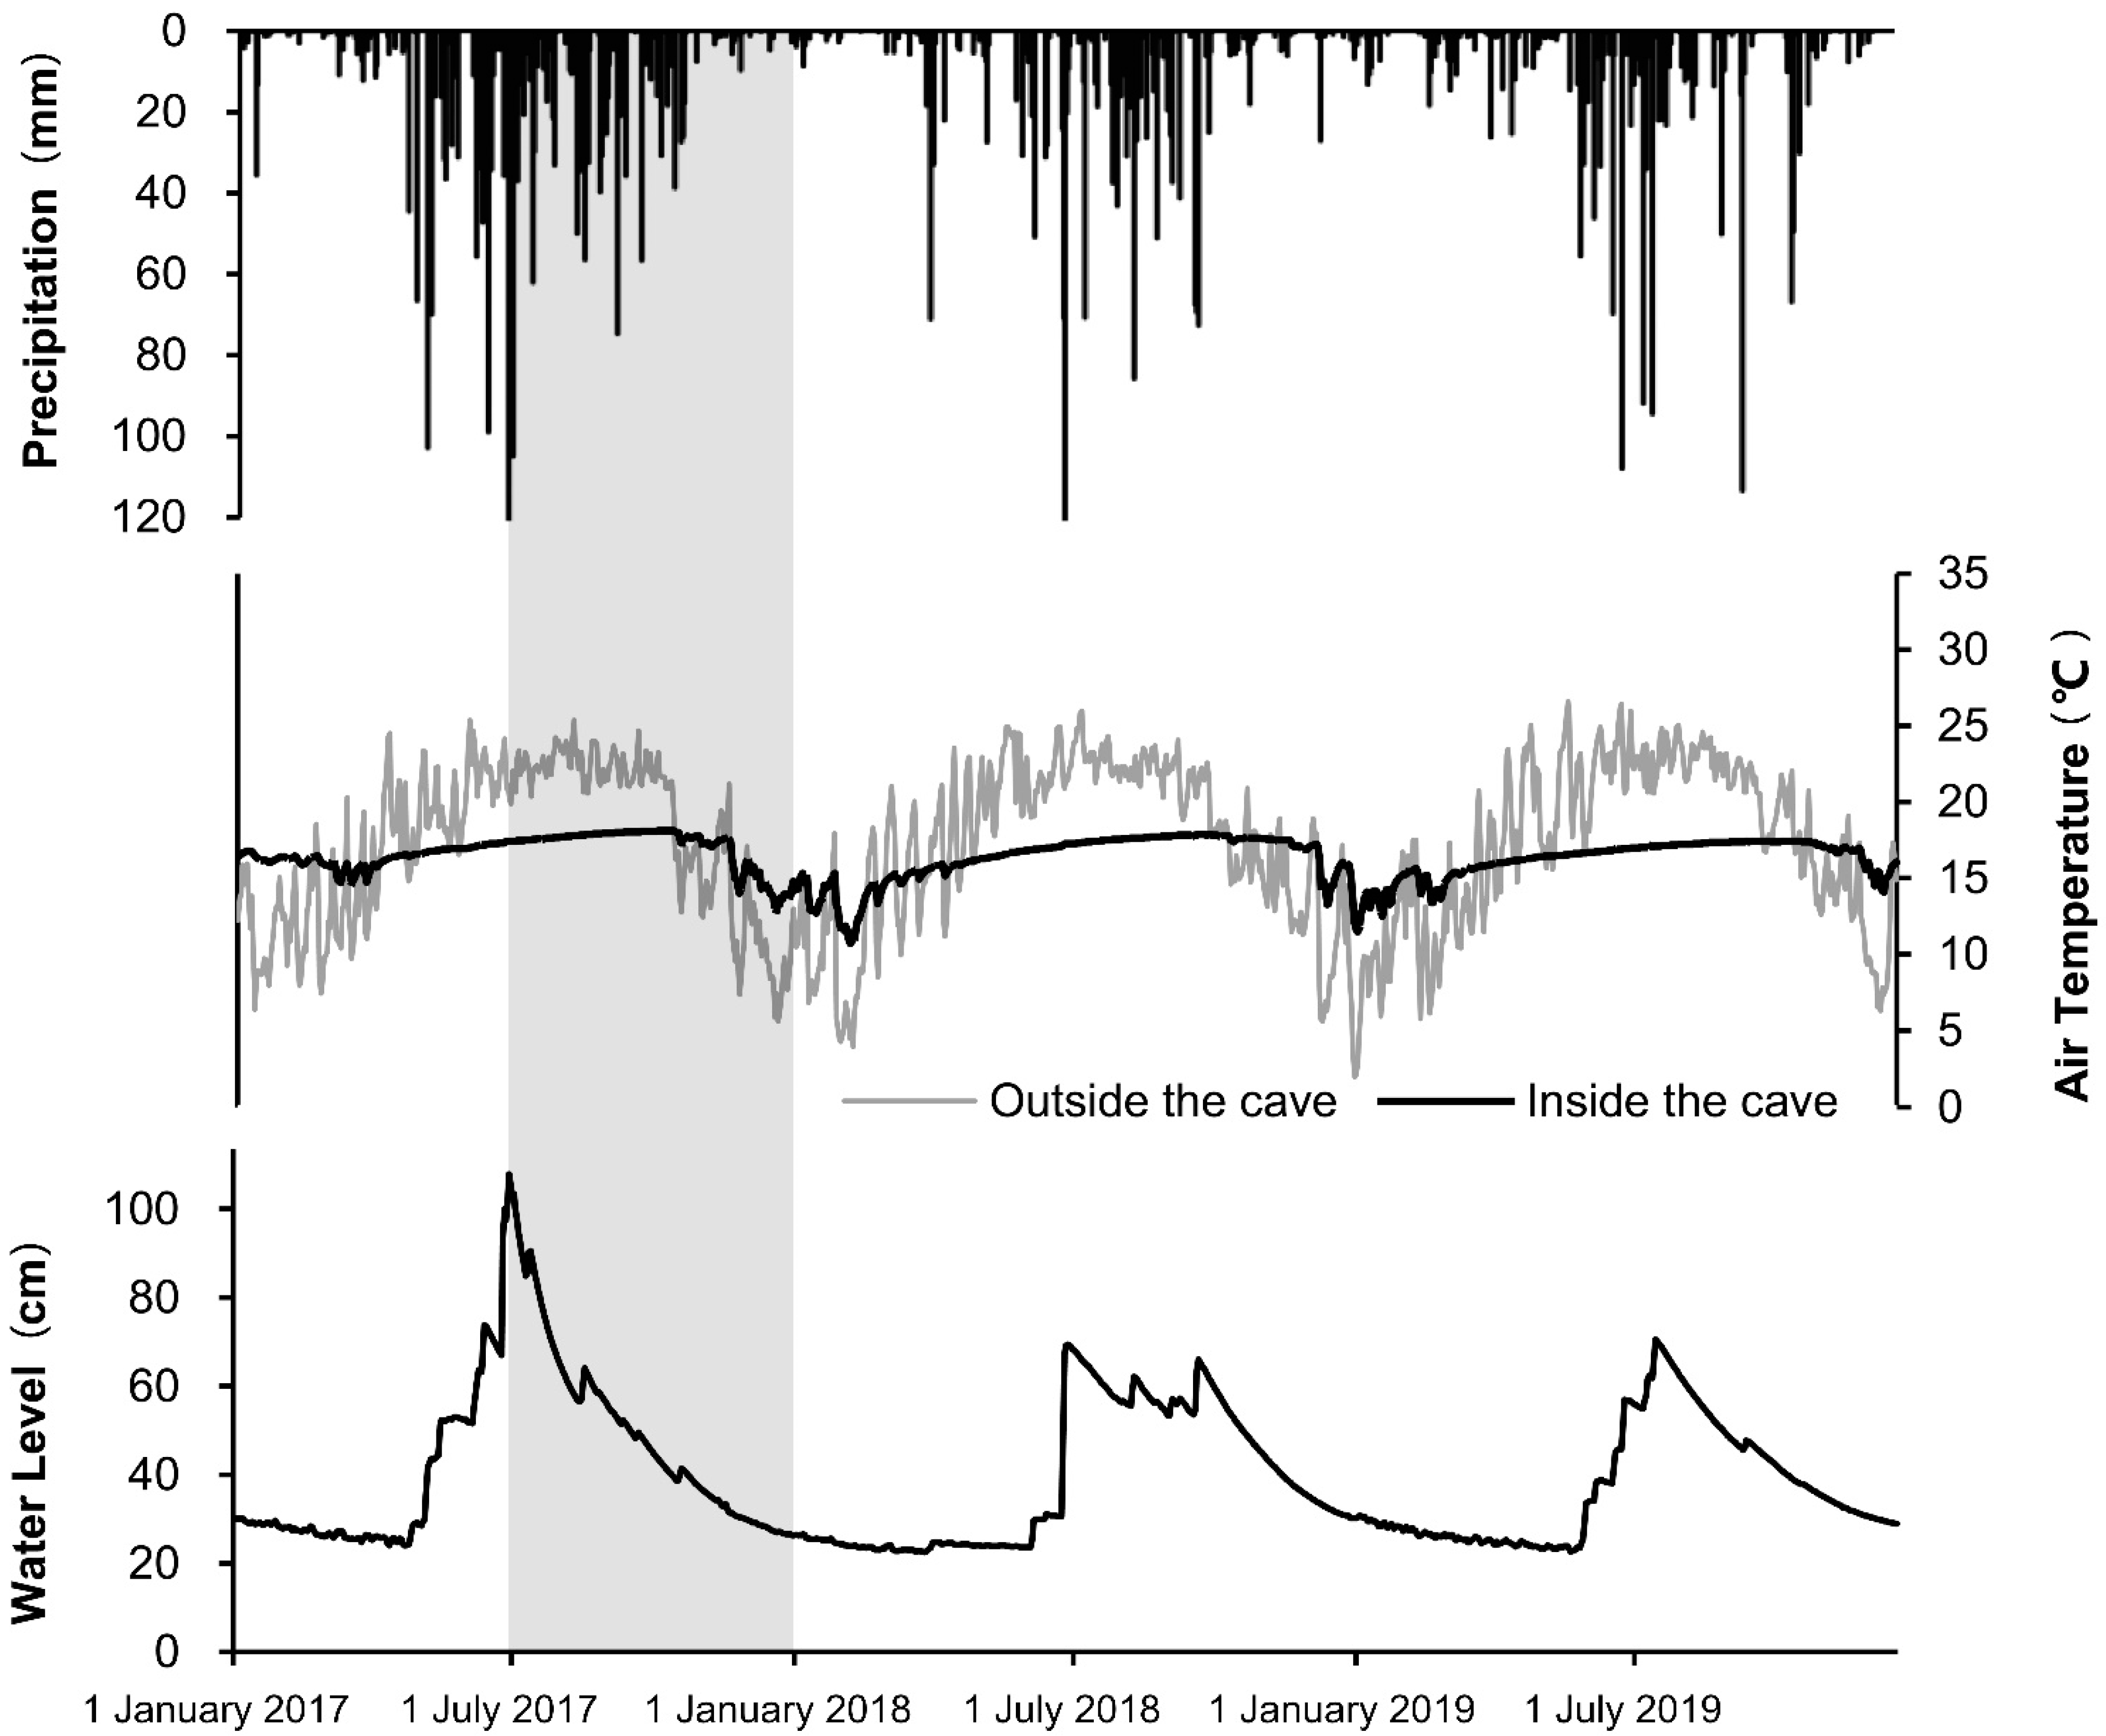
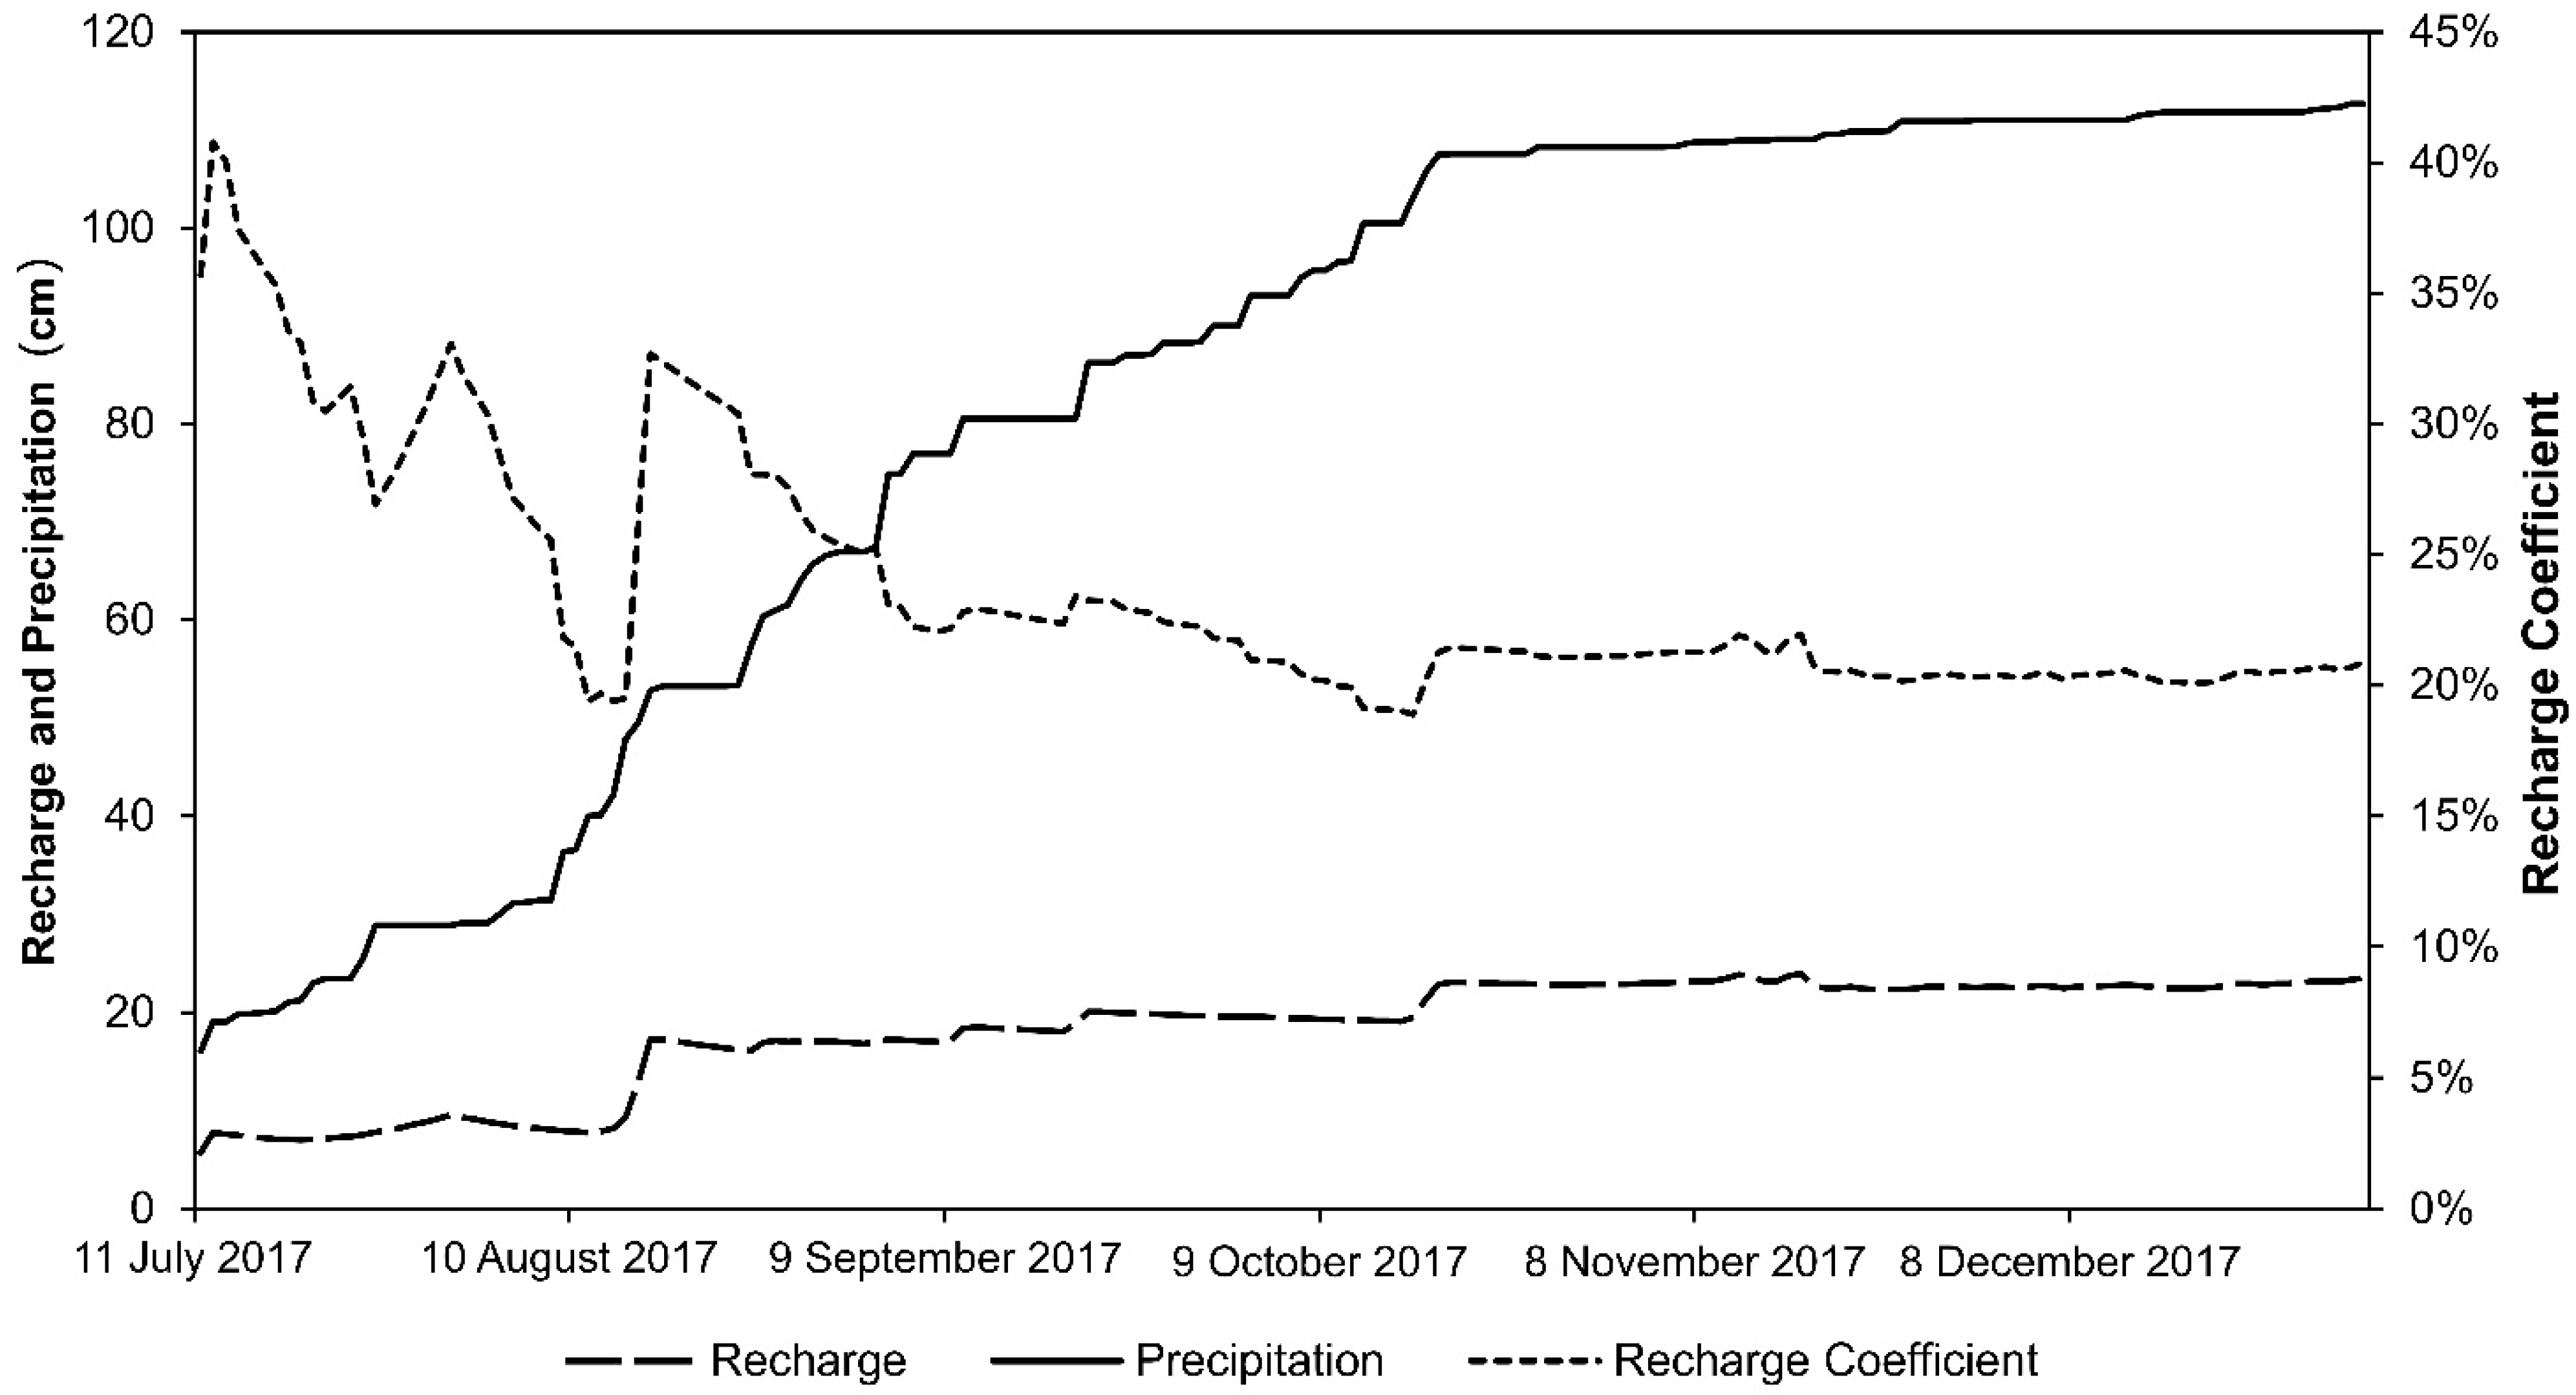
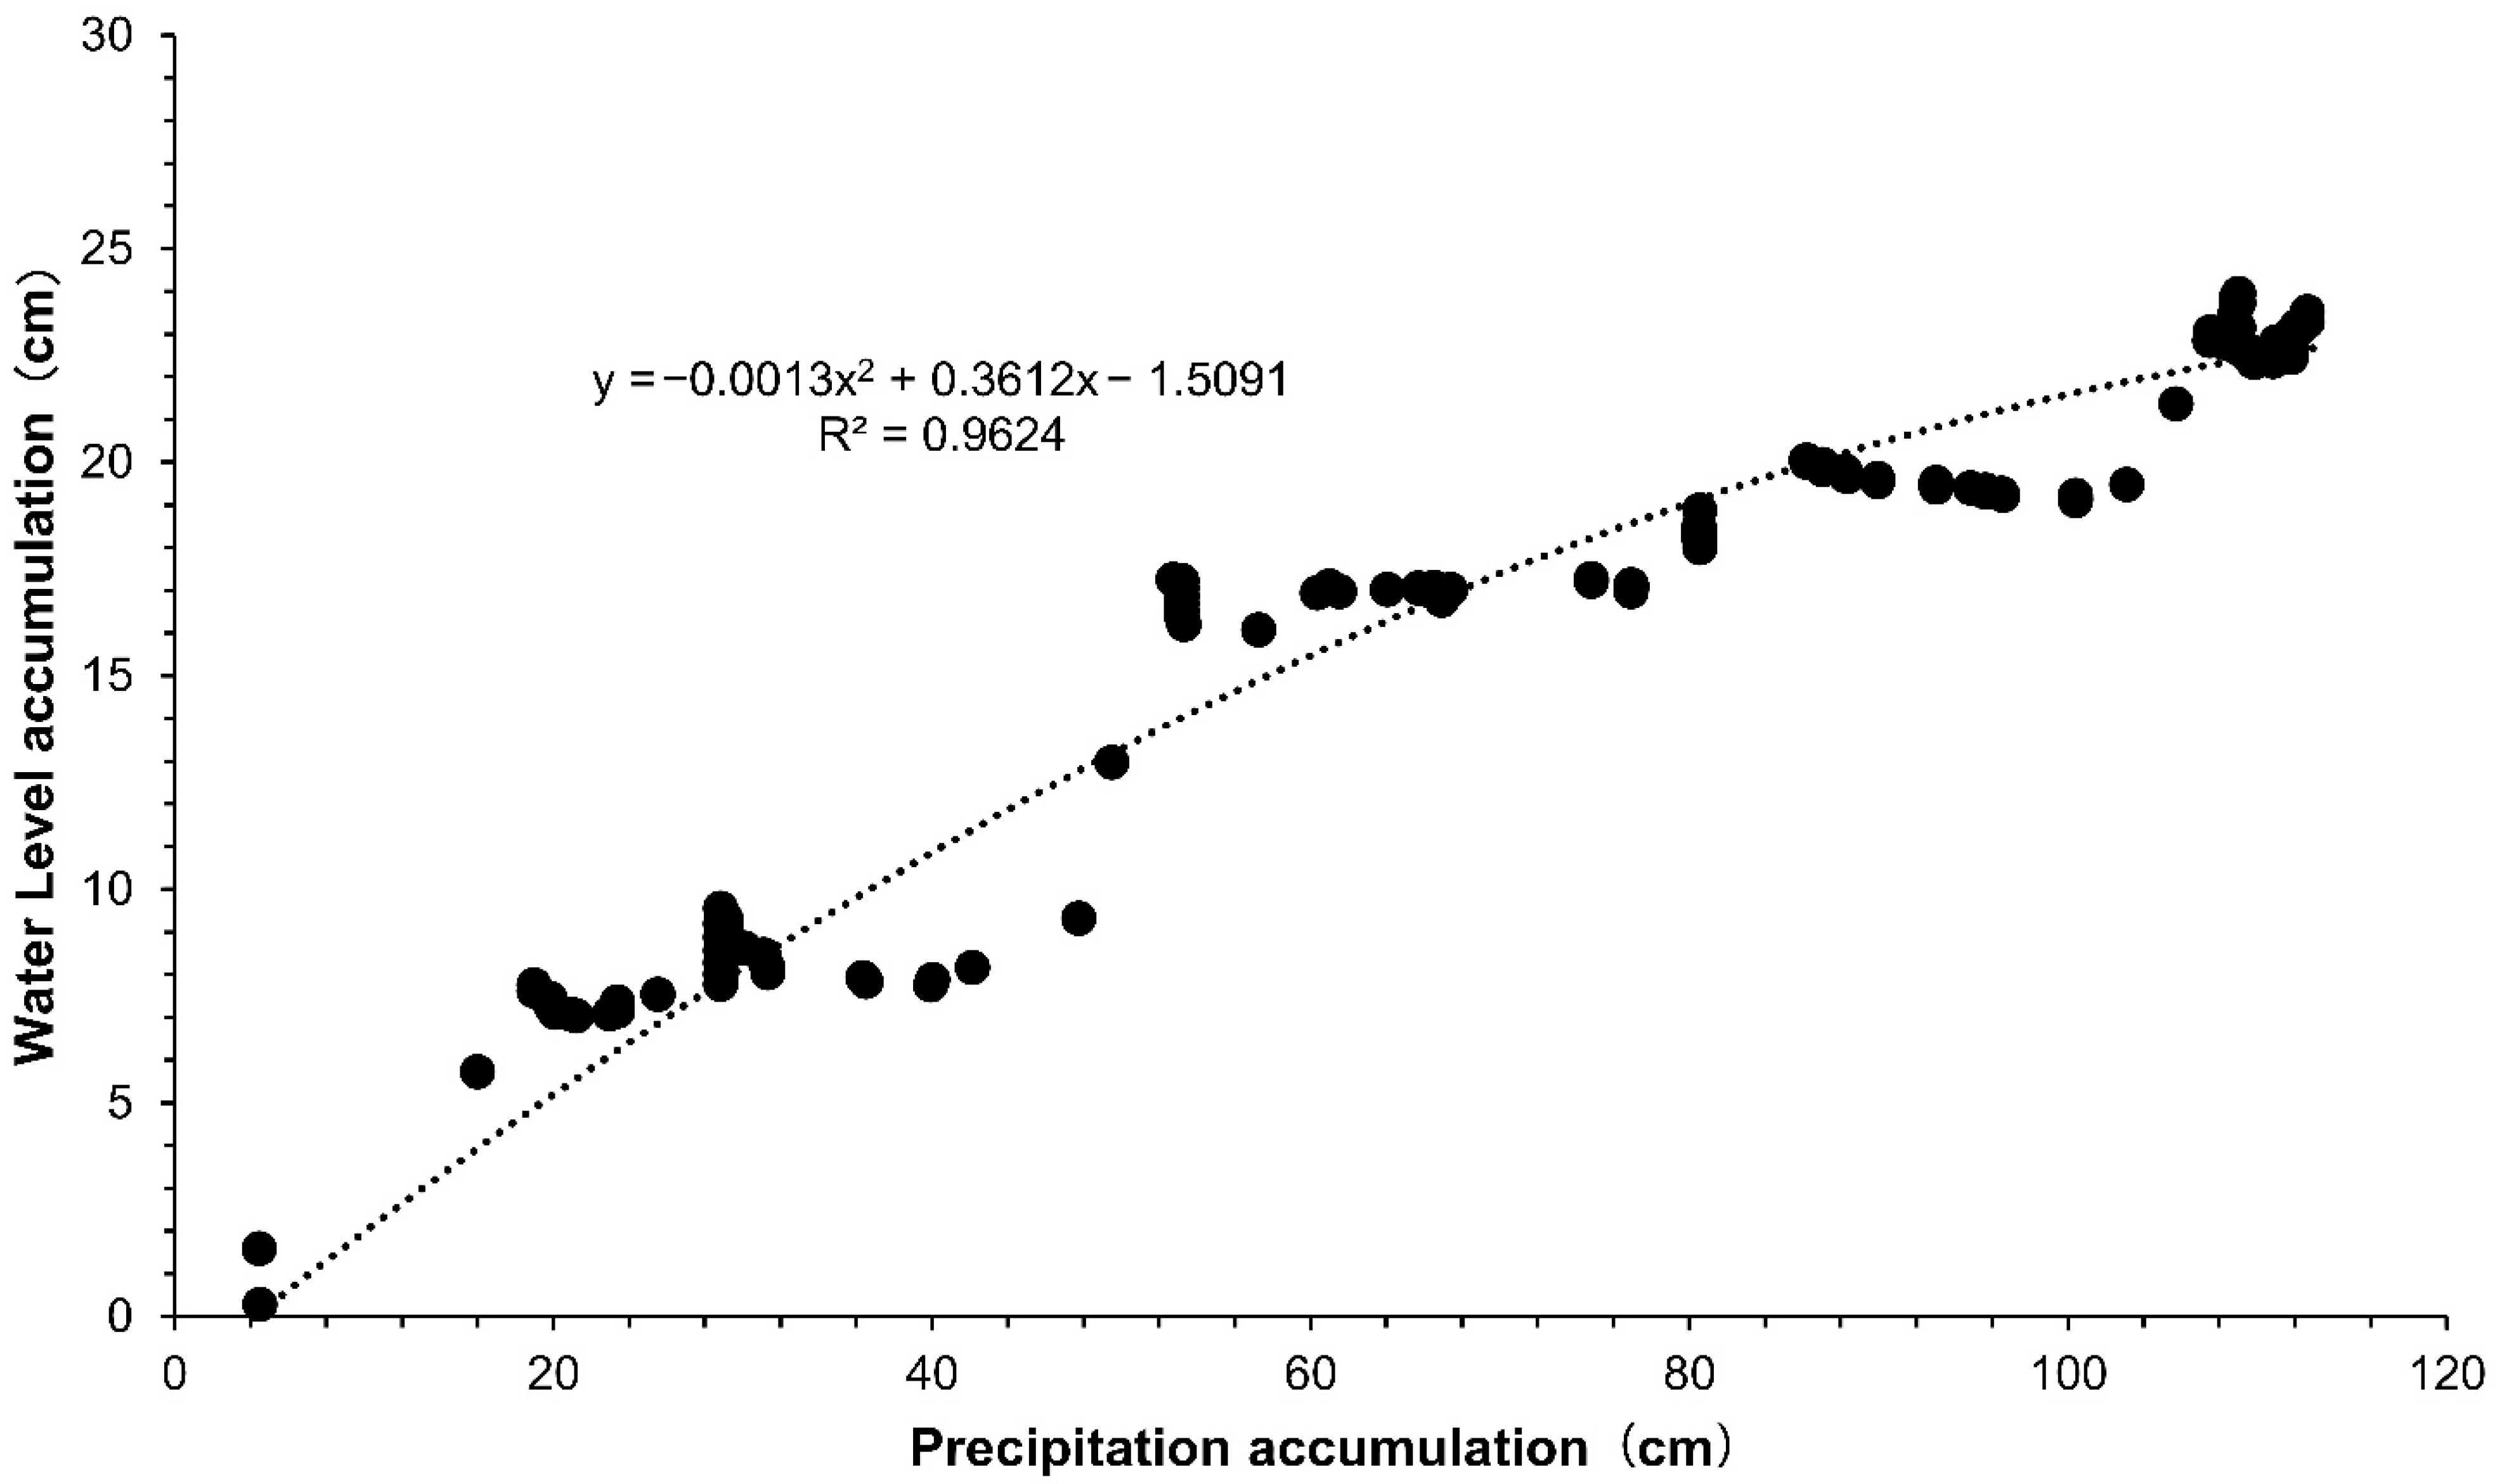
3.1. Monitoring Results of the Cave Pool

Figure 4 is a line chart of the water level monitoring station and meteorological data from January 2017 to December 2019. The interval of presented data is daily.
In general, the difference between wet and dry periods was obvious. The maximum daily rainfall was 155 mm on 25 June 2017, 126.6 mm on 24 June 2018 and 113.2 mm on 10 September 2019. The highest daily water level was 107.83 cm on 29 June 2017, 69.41 cm on 27 June 2018 and 70.5 cm on 14 July 2019. The lowest daily water levels appeared in April 2017, March 2018 and May 2019, respectively. Excluding the periods of water level rise and fluctuation, there were obvious water level recession processes in these three hydrological years, starting in July 2017, September 2018 and July 2019, respectively. In addition, the air temperature fluctuation inside the cave was significantly smaller than outside the cave, indicating a relatively stable environment inside the cave. Especially in the wet season, there was almost no fluctuation in air temperature.
During the field test in December 2018, the water temperature of the pool was 16.6 °C, the pH value was 8.21, the DO was 7.52 mg/L and the EC was 145.5 μS/cm. According to the sampling test results (Table 1), the water chemistry was of HCO3-Ca type, without obvious anthropogenic pollution. It was the groundwater chemistry characteristic of the karst vadose zone in a natural state.

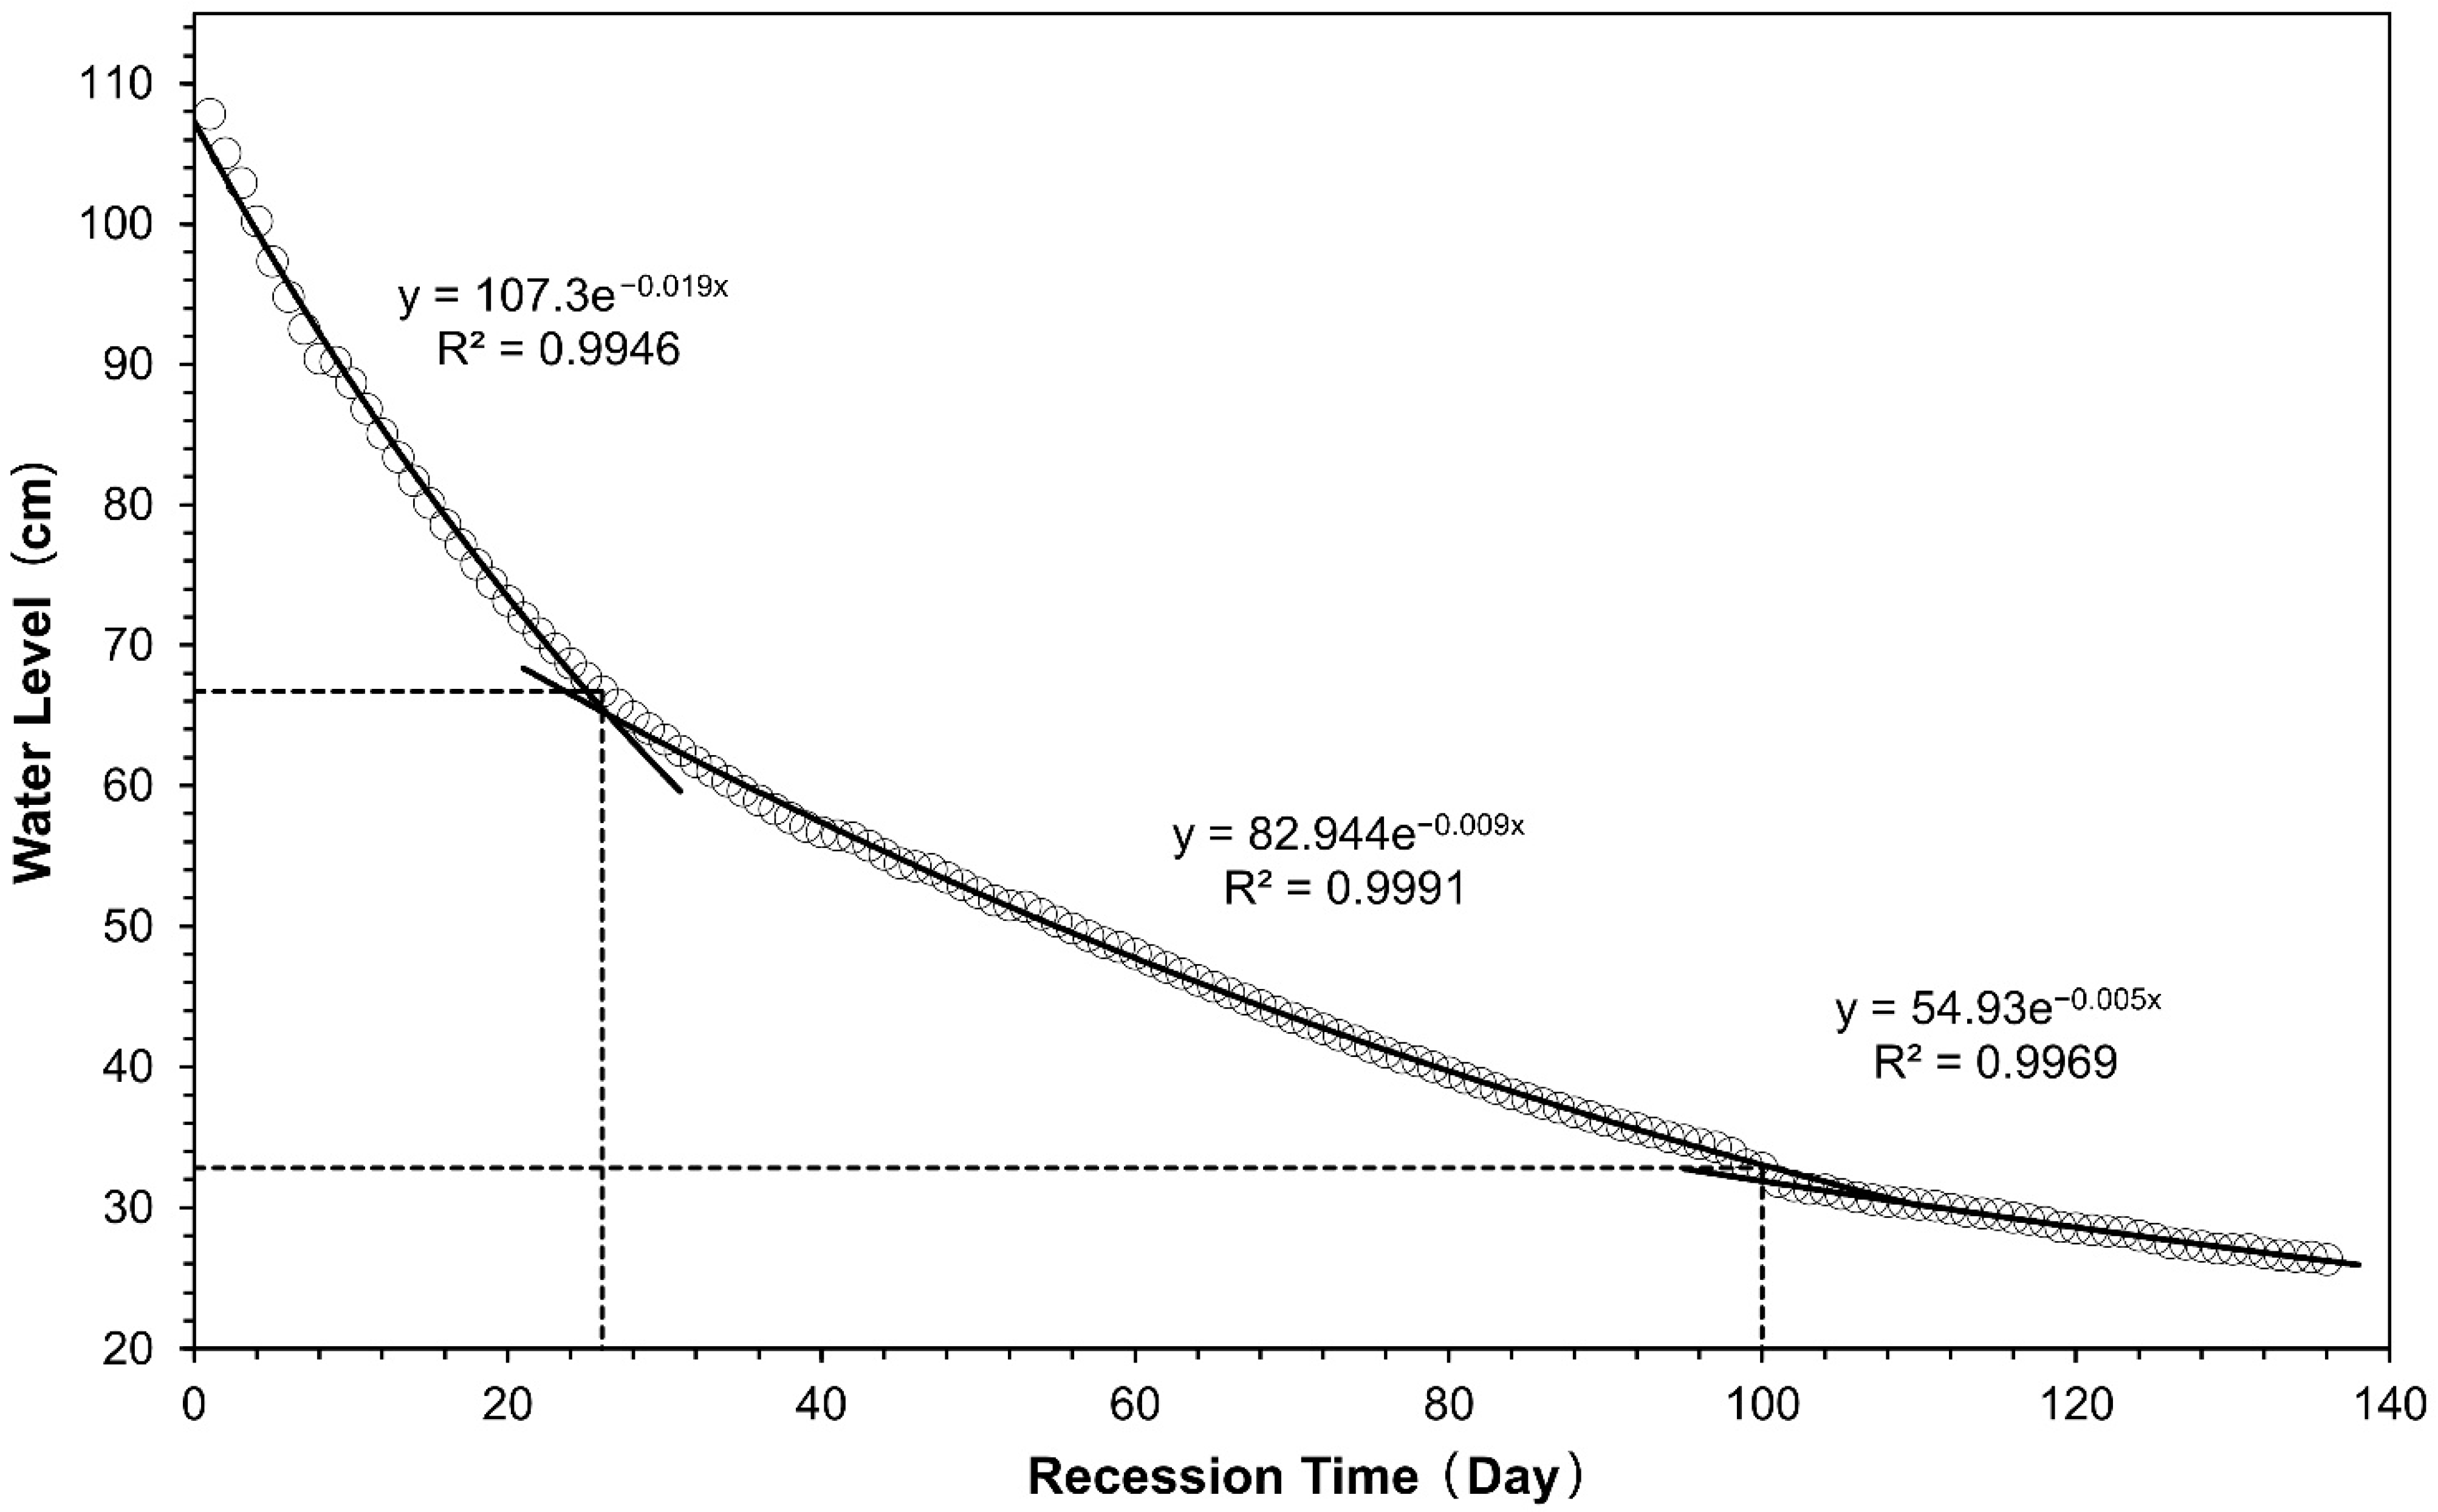
3.2. Runoff Analysis in Cave Vadose Zone Based on Recession Analysis

Monitoring data from 29 June 2017 to 31 December 2017 were used to analyze the natural recession rate of the water level in the pool. The main reason for the water level recession is the leakage at the bottom of the pool. The recession process of the water level conformed to the trend of exponential function attenuation. From the 186 days in the study period, the ideal stage of the water level recession was selected for analysis, and the days where the water level rose due to recharge were excluded. Therefore, the water level recession went from the highest value of 107.8 cm to 26.3 cm, which lasted 136 days. By fitting the recession curve with an exponential function, the recession equation was obtained (Figure 5; Equation (1)).
H ( t ) = { h 1 × e k 1 t ,   1 t 26 ,   r 2 = 0.9946 h 2 × e k 2 t ,   27 t 100 ,   r 2 = 0.9991 h 3 × e k 3 t ,   101 t 136 ,   r 2 = 0.9969
In Equation (1), H was the water level of the pool, and the unit was cm; t was the time, and the unit was days; k was the drainage coefficient of the drain hole at the bottom of the pool, and k1, k2 and k3 were the recession characteristic values of three phases; and h was the initial water level of the pool, and h1, h2 and h3 were the initial water levels of the three recession phases, respectively. The fitting results showed the following: h1 = 107.3 cm, h2 = 82.944 cm and h3 = 54.93 cm; and k1 = 0.019, k2 = 0.009 and k3 = 0.005.
According to the equation of water level recession (Equation (1)), the recession rate could be calculated with Equation (2). The value of h1, h2, h3, k1, k2 and k3 were constants determined by three recession phases. The recession rate ΔHrecession was just a function of recession time t.
Δ H r e c e s s i o n = H ( t ) H ( t 1 )
By logarithmic operation on both sides of Equation (1), the equation of the recession time t(h) could be obtained (Equation (3)).
t ( h ) = { 1 k 1 ( ln h 1 ln h ) ,   65.79 < h 107.83 1 k 2 ( ln h 2 ln h ) ,   31.83 < h 65.79 1 k 3 ( ln h 3 ln h ) ,   26.31 < h 31.83
The actual water level variation between two days, which could be calculated by subtracting the recorded data of two adjacent days, contained two kinds of variables: the first was natural recession which was negative fluctuation and calculated by Equation (2), and the second was positive fluctuation caused by the rainfall recharge process. Accordingly, the increase in water level caused by the recharge process could be written as Equation (4).
Δ H r e c h a r g e = Δ H t o t a l Δ H r e c e s s i o n
In Equation (4), ΔHrecharge was the rate of water level increase caused by the recharge process and ΔHtotal was the actual water level change rate. The calculation of the recharge coefficient by the water level was carried out on the assumption that the recharge area of the pool equals the area of the pool itself. It can be seen from Figure 1 that the projected area of the cave was larger than that of the pool, but the cave only had an anti-seepage treatment at the bottom of the pool, and other areas inside the cave were not anti-seepage treated so that the cave water could leak along the cave floor when it flowed down. In summary, this assumption was reasonable.
The cumulative amount of water level changes caused by the recharge process and the cumulative rainfall changes over time are shown in Figure 6. The recharge coefficient curve represented the local rainfall infiltration recharge coefficient R. In a wet season, the influence of a single heavy rain caused the curve to fluctuate, and the maximum value of R could reach 40.8%. There was a clear downward trend from the wet season to dry season. After entering the dry season, the curve gradually stabilized.
The dynamics of the pool water level in the cave were affected by precipitation recharge. Under the influence of the monsoon climate, rainfall increased significantly in the summer and decreased gradually in autumn and winter. The increase in the water level was much lower than the accumulation of precipitation. During the calculation period, the cumulative precipitation (ΣP) was 112.67 cm, and the cumulative recharge (ΣΔHrecharge) increment of the pool water level was 23.52 cm. The ratio of the cumulative recharge increment to the cumulative precipitation was the local precipitation infiltration coefficient R, which was 20.88%. Based on the saturation excess runoff mechanism, in the wet season with sufficient rainfall, after multiple rainfall accumulations, the slope between the cumulative water level and the cumulative precipitation fitting curve shows a gradually decreasing trend, which results in the descending of R (Figure 6). From the wet season to the dry season, the efficiency of precipitation recharge decreased. The R value in this study is smaller than in a similar study in another cave in the subtropical karst forest area (R = 46.3%) [27]. The steep slope above the cave may be one of the reasons for the low R value. The thick vadose zone combined with the steep terrain makes it possible for some of the infiltrated water to runoff downward in the terrain in the vadose zone.
The fitting curve between ΣΔHrecharge and ΣP was a quadratic function (Figure 7, Equation (5)), and the slope of the curve represented R. By calculating the derivative function of Equation (5), a linear function reflecting the change rate of R was obtained (Equation (6)).
The slope of this linear function was negative, which indicated the trend of R gradually decreasing from the wet season to the dry season. Precipitation recharge was affected by the monsoon climate. According to the characteristics of precipitation recharge reflected in Figure 7, the prediction of R under extreme weather conditions could be simulated. There were two extreme cases: The first case was continuous rainfall during the wet season, where R approached 36.12%, according to the intercept of Equation (6); and the second situation was that the rainfall was completely intercepted on the surface and returned to the atmosphere through evapotranspiration, where R approached 0, which occurred in the dry season.
  Δ H r e c h a r g e = 0.0013 (   P ) 2 + 0.3612   P 1.5091
(   Δ H r e c h a r g e ) = 0.0026   P + 0.3612

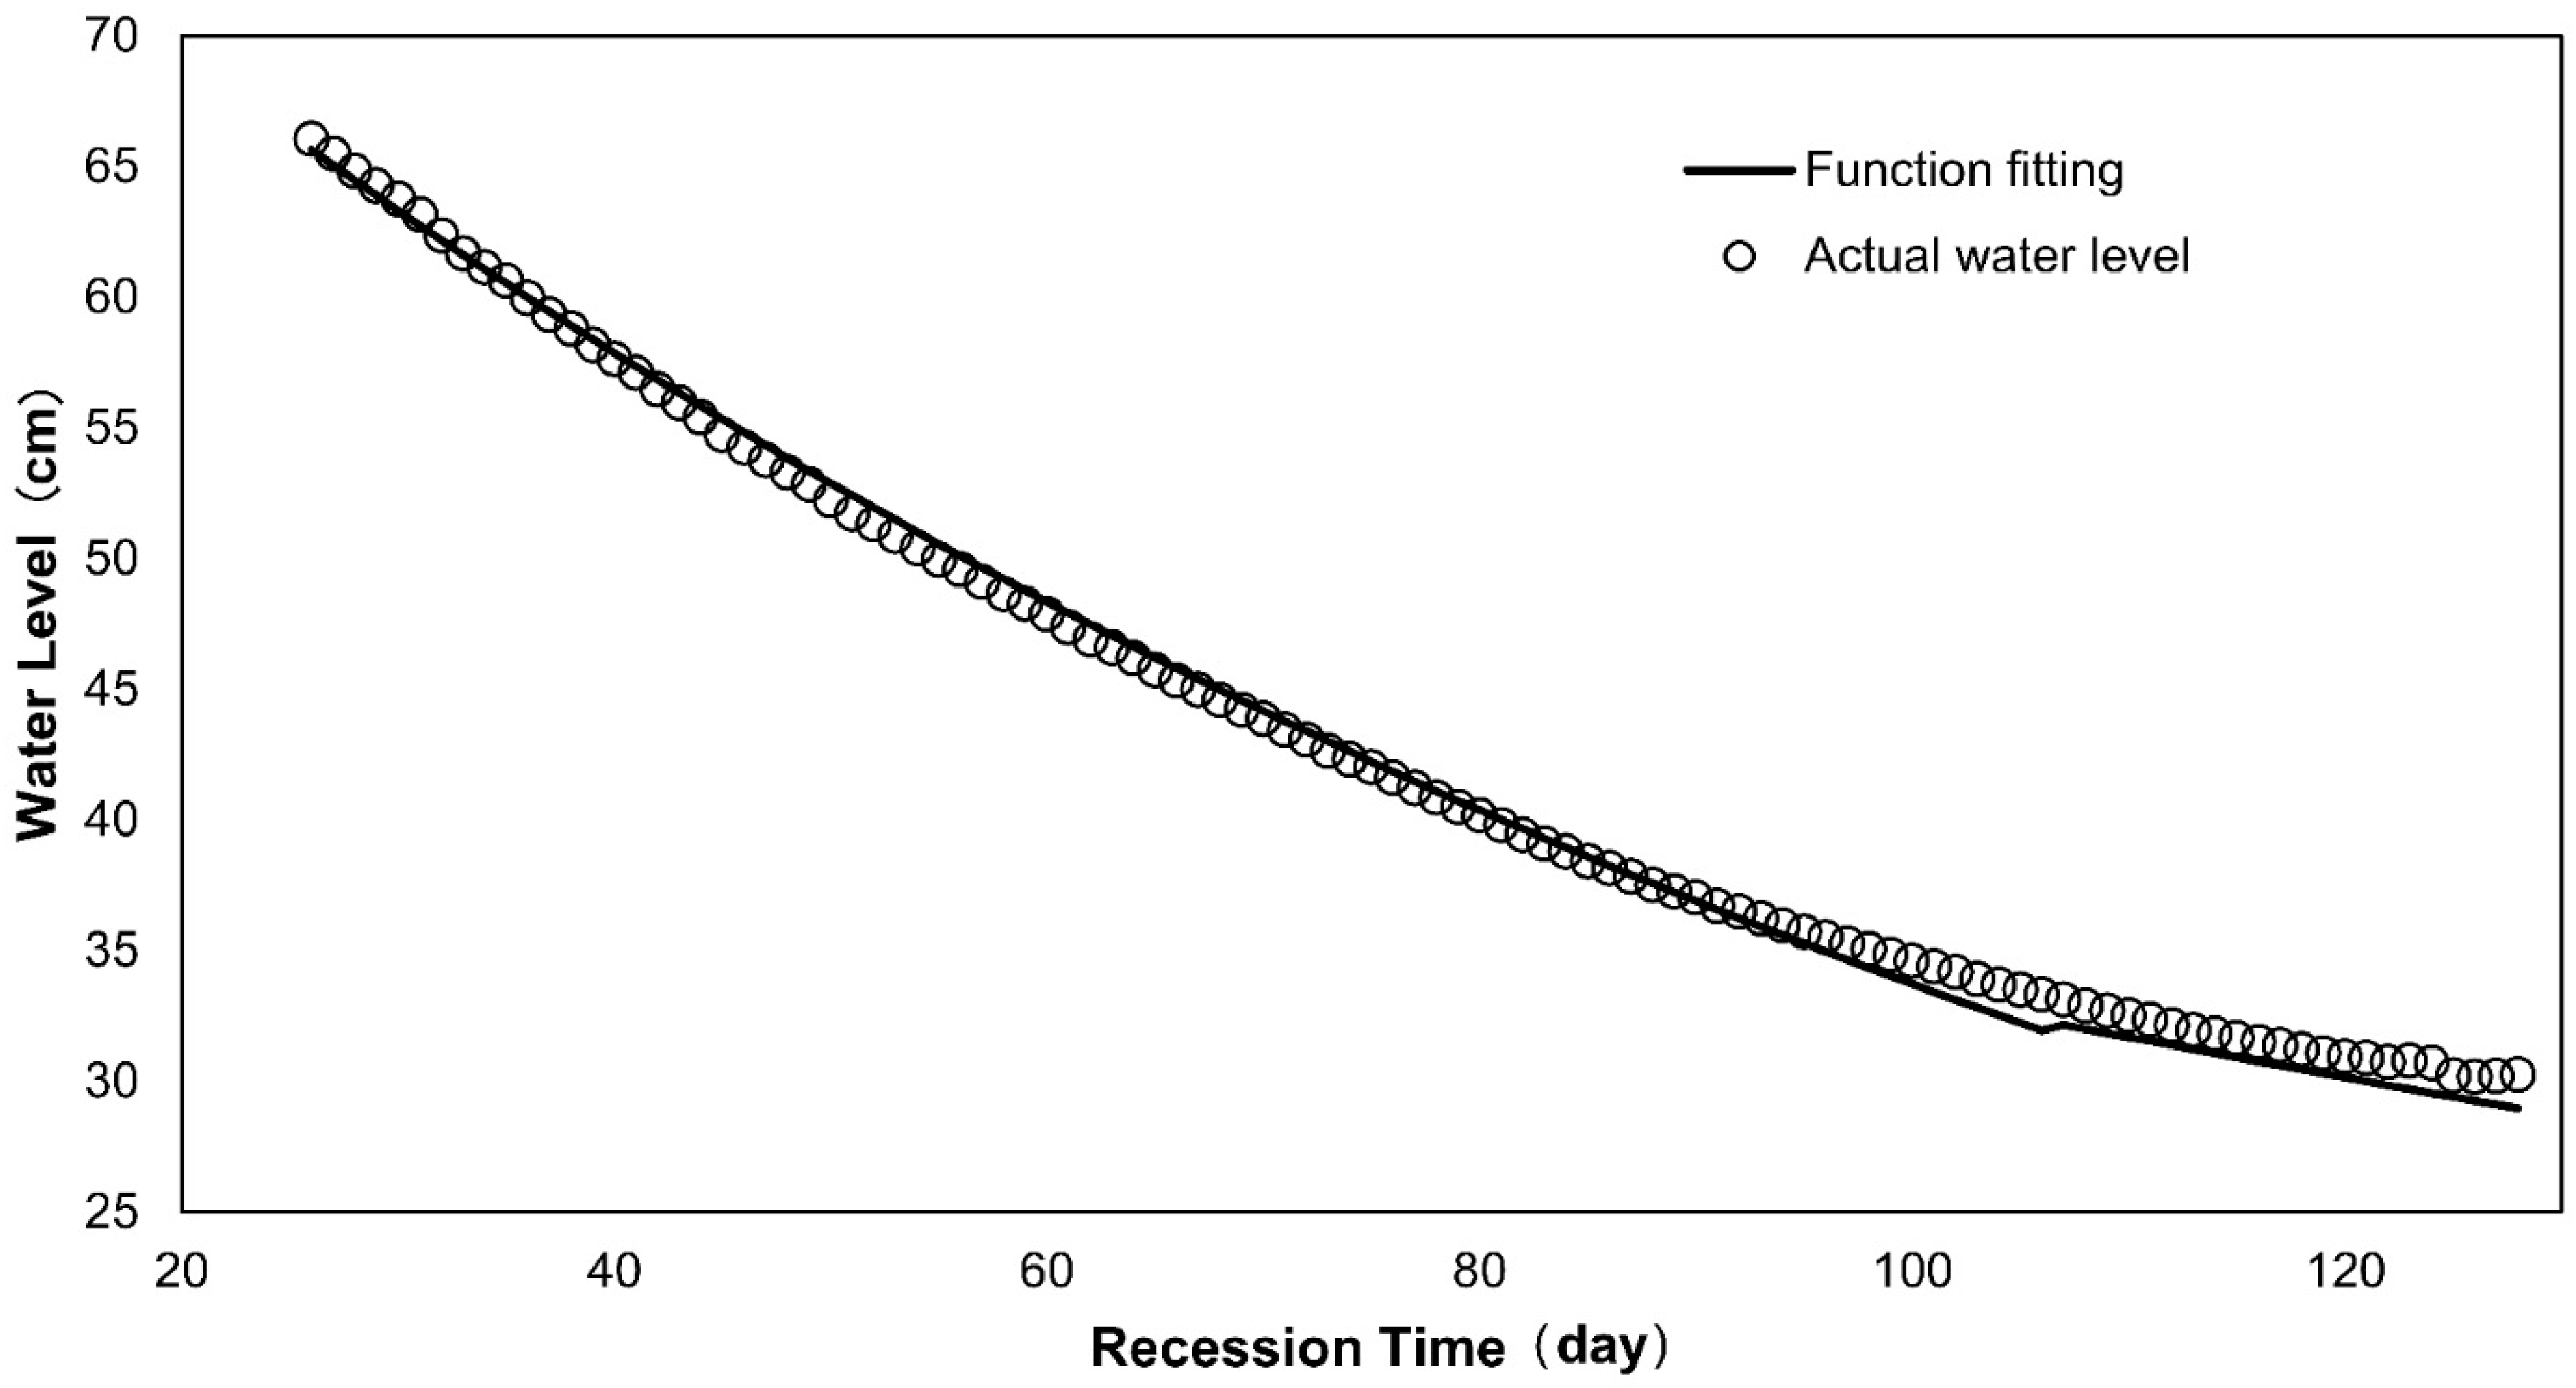
3.3. Recession Model Validation

In order to validate the accuracy of the recession equation, the rainfall data from 28 September 2018 to 7 December 2018 were selected for comparison with the fitted data of the recession equation. The rainfall during this period was relatively small, so there was less interference from a single rainfall event. As a result, the observed water level did not show slight fluctuations and rebounds due to the influence of rainfall, and the actual water level change process was close to the ideal natural recession process. The fitting result is shown in Figure 8.
The correlation coefficient between the actual water level and calculated water level during this period was 0.999. From the perspective of the change trend, the fitting value of the recession equation was slightly lower than the actual observation value in the later stage. The reason was that, affected by the inevitable rainfall event, the recorded water level experienced several small fluctuations and rebounds from July 2017 (Figure 4). When fitting, in order to obtain the ideal recession process, the recession time was reduced from 186 days to 136 days by excluding the water level rising stage caused by rainfall. The reason why this affected stage was selected for the recession analysis was that the selected recession process covered the largest water level change range, which was from 107.8 cm to 26.3 cm. The results could be applied to a wider range of analysis scenarios.

3.4. Multiple Linear Regression

The recharge source of the pool in the cave was the runoff of the vadose zone formed after the infiltration of atmospheric precipitation. Since the thickness of the vadose zone above Yuanyang Cave is about 200 m, the vertical infiltration path of precipitation is long, so the vadose zone runoff has a hysteresis effect. The lag was calculated using TSA. The cross-correlation analysis showed that the maximum correlation coefficient (r = 0.346) corresponded to a delay of 4 days. Therefore, in combination with the principle of water balance, three parameters that affect the runoff recharge were selected for regression analysis, namely rainfall 1–3 days ago, rainfall 4–7 days ago and evaporation 1–7 days ago. To establish the regression equation, it was necessary to select typical recharge events according to the recharge amount of the vadose zone. Frequency statistics analysis of ΔHrecharge data calculated by Equation (4) showed that the upper quartile was 0.075 cm. Based on this, the outliers were filtered out and the actual rainfall was used as a reference for the occurrence of recharge events. In addition, continuous recharge events often occurred during the wet season, which manifested as abnormal values of ΔHrecharge for several consecutive days in a week. In these situations, typical recharge events needed to be selected according to the actual recharge value and rainfall amount, ensuring that there is a time interval of at least one week between the selected typical events.
The results showed that between 28 June 2017 and 31 December 2017, typical effective recharge events occurred 11 times (Table 2). Through statistical analysis of these 11 events, the rainfall 1–3 days ago (R3), the rainfall 4–7 days ago (R4) and the evaporation 1–7 days ago (E7) were used as variables. The method of multiple linear regression was used to establish the relationship equation between the recharge in the vadose zone and the meteorological parameters variables to clarify the influence of the previous meteorological factors on the infiltration and recharge process of the karst vadose zone.
A linear regression equation (Equation (7)) was established based on the above variables. The multiple correlation coefficient of regression analysis was 0.956. The regression analysis coefficients are shown in Table 3.
Δ H r e c h a r g e = 0.178 × R 3 + 0.293 × R 4 0.924 × E 7 + 1.270
As shown in Equation (7), R4 had a greater impact on recharge than R3. Because the thickness of the vadose zone above Yuanyang Cave was about 200 m, the runoff path of precipitation vertical infiltration was long, so the recharge effect of long-term preliminary rainfall was more obvious than that of short-term rainfall. The vegetation coverage in the surrounding karst peak clusters and depressions was relatively high, so the effect of actual evapotranspiration was significant. It is not excluded that some vadose zone runoff percolated on the way and did not enter the pool, which would also increase the influence of evaporation in Equation (7). The formation of effective rainfall recharge needed to meet the rainfall threshold conditions. The event on 21 December 2017 could give an example of the rainfall threshold. In this event, R3 was 0 and R4 was 3.3 mm, which was the lowest rainfall of all involved recharge events. By averaging the rainfall of the last four recharge events in the dry season, it could be concluded that the rainfall threshold for vadose zone recharge was 7.6 mm. However, this study could not determine the impact of previous rainfall, so more in situ monitoring and simulation experiments are needed to determine the precise threshold.

4. Conclusions

During the observation period in Yuanyang Cave, by means of recession curve analysis, the infiltration recharge coefficient was calculated to be 20.88%, which represented the efficiency of precipitation converting to vadose zone runoff in the bare karst mountain area of Southwest China. The predicted maximum value of R is 36.12%. The occurrence of recharge needed to meet the rainfall threshold and was affected by previous rainfall. Through multiple linear regression model analysis, rainfall 4–7 days ago had shown a greater impact on recharge events than 3 days ago. Due to the higher vegetation coverage on the slope, the effect of evapotranspiration was significant. This paper provides a new method for the assessment of the infiltration of the vadose zone in karst caves. The results provided a scientific basis for water resource management and evaluation in the karst mountain area.

Author Contributions

G.J., F.L. and F.G. field investigation and monitoring station construction; G.J. and F.L. sample collection; F.L. writing the original article; G.J. and J.W. completed revision and improvement. All authors have read and agreed to the published version of the manuscript.

Funding

Financial support was provided by Key Research and Development Program of Guangxi (Guike AB18221093), Chinese Academy of Geological Sciences Research Fund 2020019 and the National Key R&D Program (2016YFC0502302).

Institutional Review Board Statement

Not applicable.

Informed Consent Statement

Not applicable.

Data Availability Statement

The data used to support the findings of this study are available from the corresponding author upon request.

Conflicts of Interest

The authors declare no conflict of interest.

References

  1. Goldscheider, N.; Chen, Z.; Auler, A.S.; Bakalowicz, M.; Broda, S.; Drew, D.; Hartmann, J.; Jiang, G.; Moosdorf, N.; Stevanovic, Z.; et al. Global distribution of carbonate rocks and karst water resources. Hydrogeol. J. 2020, 28, 1661–1677. [Google Scholar] [CrossRef] [Green Version]
  2. Aquilina, L.; Ladouche, B.; Dörfliger, N. Water storage and transfer in the epikarst of karstic systems during high flow periods. J. Hydrol. 2006, 327, 472–485. [Google Scholar] [CrossRef]
  3. Bakalowicz, M. Karst groundwater: A challenge for new resources. Hydrogeol. J. 2005, 13, 148–160. [Google Scholar] [CrossRef]
  4. Chen, H.S.; Yang, J.; Fu, W.; He, F.; Wang, K.L. Characteristics of slope runoff and sediment yield on karst hill-slope with different land-use types in northwest guangxi. Trans. Chin. Soc. Agric. Eng. 2012, 28, 121–126. (In Chinese) [Google Scholar]
  5. Zhu, X.F.; Chen, H.S.; Fu, Z.Y.; Wang, K.L.; Zhang, W.; Xu, Q.X.; Fang, R.J. Runoff and nitrogen loss characteristics in soil-epikarst system on a karst shrub hillslope. Chin. J. Appl. Ecol. 2017, 28, 2197–2206. (In Chinese) [Google Scholar]
  6. Fu, Z.Y.; Chen, H.S.; Zhang, W.; Xu, Q.X.; Wang, S.; Wang, K.L. Subsurface flow in a soil-mantled subtropical dolomite karst slope: A field rainfall simulation study. Geomorphology 2015, 250, 1–14. [Google Scholar] [CrossRef]
  7. Jiang, G.; Guo, F.; Lo, K.F.A.; Liu, F.; Guo, Y.; Wu, W.; Polk, J.S. Utilization status of rainwater harvesting and its improvement techniques in bare karst areas for domestic use and ecological restoration. Carbonates Evaporites 2019, 34, 1381–1390. [Google Scholar] [CrossRef]
  8. Wang, S.; Fu, Z.; Chen, H.; Nie, Y.; Xu, Q. Mechanisms of surface and subsurface runoff generation in subtropical soil-epikarst systems: Implications of rainfall simulation experiments on karst slope. J. Hydrol. 2020, 580, 124370. [Google Scholar] [CrossRef]
  9. Gunn, J. Point-recharge of limestone aquifers—A model from New Zealand karst. J. Hydrol. 1983, 61, 19–29. [Google Scholar] [CrossRef]
  10. Fiorillo, F.; Doglioni, A. The relation between karst spring discharge and rainfall by cross-correlation analysis (Campania, southern Italy). Hydrogeol. J. 2010, 18, 1881–1895. [Google Scholar] [CrossRef]
  11. Fiorillo, F.; Pagnozzi, M.; Ventafridda, G. A model to simulate recharge processes of karst massifs. Hydrol. Process. 2015, 29, 2301–2314. [Google Scholar] [CrossRef]
  12. Kovačič, G.; Ravbar, N. Characterisation of selected karst springs in Slovenia by means of a time series analysis. In Karst without Boundaries; Stevanović, Z., Krešič, N., Kukurić, N., Eds.; CRC Press: Boca Raton, FL, USA, 2016. [Google Scholar]
  13. Williams, P.W. The role of the subcutaneous zone in karst hydrology. J. Hydrol. 1983, 61, 45–67. [Google Scholar] [CrossRef]
  14. Guo, X.; Jiang, G.; Gong, X.; Yin, J.; Wu, X. Recharge processes on typical karst slopes implied by isotopic and hydrochemical indexes in Xiaoyan Cave, Guilin, China. J. Hydrol. 2015, 530, 612–622. [Google Scholar] [CrossRef]
  15. Arbel, Y.; Greenbaum, N.; Lange, J.; Inbar, M. Infiltration processes and flow rates in developed karst vadose zone using tracers in cave drips. Earth. Surf. Proc. Land. 2010, 35, 1682–1693. [Google Scholar] [CrossRef]
  16. Sheffer, N.A.; Cohen, M.; Morin, E.; Grodek, T.; Gimburg, A.; Magal, E.; Gvirtzman, H.; Nied, M.; Isele, D.; Frumkin, A. Integrated cave drip monitoring for epikarst recharge estimation in a dry Mediterranean area, Sif Cave, Israel. Hydrol. Process. 2011, 25, 2837–2845. [Google Scholar] [CrossRef]
  17. Ayalon, A.; Bar-Matthews, M.; Sass, E. Rainfall-recharge relationships within a karstic terrain in the Eastern Mediterranean semi-arid region, Israel: δ 18O and δD characteristics. J. Hydrol. 1998, 207, 18–31. [Google Scholar] [CrossRef]
  18. Baker, A.; Brunsdon, C. Non-linearities in drip water hydrology: An example from Stump Cross Caverns, Yorkshire. J. Hydrol. 2003, 277, 151–163. [Google Scholar] [CrossRef] [Green Version]
  19. Gregory, L.; Wilcox, B.P.; Shade, B.; Munster, C.; Owens, K.; Veni, G. Large-scale rainfall simulation over shallow caves on karst shrublands. Ecohydrology 2009, 2, 72–80. [Google Scholar] [CrossRef]
  20. Kurniawan, I.A.; Adji, T.N.; Nurkholis, A.; Haryono, E.; Fatoni, H.; Waskito, W.A.; Cahyadi, A.; Agniy, R.F. Karst aquifer response by time series analysis applications in Jonggrangan Karst, Java Island, Indonesia. Environ. Earth Sci. 2019, 78, 379. [Google Scholar] [CrossRef]
  21. Lorenz, D.L.; Delin, G.N. A regression model to estimate regional ground water recharge. Ground Water 2007, 45, 196–208. [Google Scholar] [CrossRef] [Green Version]
  22. Kogovšek, J.; Petrič, M. Solute transport processes in a karst vadose zone characterized by long-term tracer tests (the cave system of Postojnska Jama, Slovenia). J. Hydrol. 2014, 519, 1205–1213. [Google Scholar] [CrossRef]
  23. Petrič, M.; Kogovšek, J.; Ravbar, N. Effects of the vadose zone on groundwater flow and solute transport characteristics in mountainous karst aquifers—The case of the Javorniki–Snežnik massif (SW Slovenia). Acta Carsologica 2018, 47. [Google Scholar] [CrossRef] [Green Version]
  24. Jean, B.; Bruce, B.; Marc, F. Spelunca Memories N°37: Voyages en Terre Chinoise Tome 4—Inventaire Speleologique du District de Fengshan; Fédération Française de Spéléologie: Lyon, Franch, 2018; pp. 28–29. (In French) [Google Scholar]
  25. Liu, F.; Jiang, G.; Wu, W.; Guo, F.; Guo, Y. Discussion on Hydrogeological Genesis of Yuanyang Spring in Fengshan County, Guangxi. Guangxi Sci. 2017, 24, 623–628. (In Chinese) [Google Scholar]
  26. Fiorillo, F. Tank-reservoir drainage as a simulation of the recession limb of karst spring hydrographs. Hydrogeol. J. 2011, 19, 1009–1019. [Google Scholar] [CrossRef]
  27. Yuan, X. Four-Water Conversion Model and Estimation of Runoff Generation in Banzhai Underground River Watershed; China University of Geosciences: Beijing, China, 2018. (In Chinese) [Google Scholar]
Figure 1. (a) Location and a plan view map of Yuanyang Cave [20]; (b) remote sensing image of the surroundings of the cave.
Sustainability 13 01766 g001
Figure 2. (a) The polje below Yuanyang Cave; (b) cross-sectional profile plotting the surface topography and hydrogeological characteristics of the vadose zone.
Sustainability 13 01766 g002
Figure 3. (a) Schematic diagram of the monitoring station of the cave pool; (b) photograph of the pool.
Sustainability 13 01766 g003
Figure 4. Line chart of water level monitoring station and meteorological data (the light gray area represents the recession calculation period).
Sustainability 13 01766 g004
Figure 5. Fitting curve of water level recession process.
Sustainability 13 01766 g005
Figure 6. Curve of recharge and precipitation accumulation.
Sustainability 13 01766 g006
Figure 7. Fitting curve between water level accumulation caused by recharge and precipitation accumulation.
Sustainability 13 01766 g007
Figure 8. Comparison of the fitted value of the recession equation and the actual observed water level value.
Sustainability 13 01766 g008
Table 1. Analysis results of cave pool samples.
IndicatorsContent
pH8.21
DO7.52 mg/L
EC145.5 μS/cm
Ca2+39.46 mg/L
K+0.64 mg/L
Na+0.32 mg/L
Mg2+0.35 mg/L
NH4+0.06 mg/L
HCO3112.55 mg/L
NO31.85 mg/L
PO43−0.02 mg/L
Cl0.40 mg/L
SO42−9.64 mg/L
SiO24.12 mg/L
Table 2. Statistics of precipitation recharge events.
No.Recharge EventsΔHrecharge (cm)Sum of Rainfall 1–3 Days Ago (R3) (cm)Sum of Rainfall
4–7 Days Ago (R4) (cm)
Sum of Evaporation 7 Days Ago (E7) (cm)
12017 July 122.0277.442.771.51
22017 July 220.1082.391.172.07
32017 July 310.3650.005.442.94
42017 August 164.2809.468.691.46
52017 August 260.1667.130.002.22
62017 September 40.2540.465.411.93
72017 October 171.8952.724.751.92
82017 November 110.4220.180.361.39
92017 November 260.1921.070.241.62
102017 December 210.2110.000.331.45
112017 December 310.2370.610.251.02
Table 3. Regression analysis coefficient table.
CoefficientsStandard errorSignificance
Intercept1.2700.5420.052
R30.1780.0460.006
R40.2930.0560.001
E7−0.9240.2960.017
Publisher’s Note: MDPI stays neutral with regard to jurisdictional claims in published maps and institutional affiliations.

