Abstract
Through the implementation of ecological compensation policy, it is of great significance to protect ecosystems, coordinate regional development, and achieve sustainable development goals. This study selected the carbon sequestration service in Yantai as an example and carried out a study on the measurement of ecological compensation based on the ecosystem services supply and demand. Moreover, this study clarified the whole process of the generation, circulation and social demand docking of ecological benefits from the perspective of “nature-society”, proposed a spatial flow characterization method for carbon sequestration services, and described the “externality” spillover of ecosystem services. The results showed that most areas of Yantai belonged to the ecological surplus area, which were important sources of carbon sequestration services. Ecological compensation was needed, with a total amount of about 2.2 billion yuan. Qixia, Muping and Penglai had greater comparative ecological radiation force (CERF), and the total amount of carbon sequestration services transferred to the external areas was large. Although the carbon sequestration flows of Yantai showed a spatial decay law, there were significant differences in the direction of different districts and cities. The study can provide a reference for achieving sustainable development of Yantai and formulating ecological compensation policy.
1. Introduction
Ecosystems directly or indirectly provided many services to human society, including provisioning, regulating, cultural, and supporting services, which was an important material basis for the development of human society [1,2,3]. Humans consumed many services and products provided by ecosystems to satisfy and enhance their well-being. However, irrational human activities severely damaged the natural environment on which we depended for survival and development, and the sustainable provision of ecosystem services was threatened. According to statistics, 15 major ecosystem services around the world are degrading or not being used sustainably [1]. It is estimated that the total economic loss caused by land degradation will reach 23 trillion US dollars by 2050 [4]. Meanwhile, the formation of ecosystem services depends on the ecosystem structure and process at certain spatial and temporal scales. Affected by climate, topography, land use, biodiversity, and other factors, the spatial distribution of ecosystem services varies greatly, and there is a serious spatial imbalance [5]. As a continuous resource system, ecosystem services have obvious externality [6]. Ecosystem services generated in a specific area have utility outside the area [7]. The ecosystem services enjoyed by the beneficiaries in different regions are different, which also leads to environmental injustice to a certain extent [5,8]. In order to protect the ecosystems and enhance human well-being, the United Nations has articulated “Reduce inequality within and among countries” (SDGs10) and “Protect, restore and promote sustainable use of terrestrial ecosystems, sustainably manage forests, combat desertification, and halt and reverse land degradation and halt biodiversity loss” (SDGs15) as the Sustainable Development Goals (SDGs) [9]. Payments for ecosystem services (PES) provide a flexible approach to problem-solving that can transform uncompensated externalities into economic incentives that are important for protecting ecosystems, coordinating regional development, and achieving the SDGs [10,11,12,13]. PES has been scaled up globally to enable sustainable management of ecosystem services [14,15,16,17,18,19]. As of 2017, there are more than 550 global PES schemes with an annual transaction value of $36–42 billion [20], covering a wide range of ecosystems such as water [21], forests [22,23], agricultural land [24], and oceans [25]. Most of the cases involve biodiversity or single environmental services [26], which mainly include water purification and provisioning [27], wind and sand control [28], air purification [29], carbon sequestration [30], soil retention [28], flood mitigation [29,31], and recreation services [32]. These management practices play an important role in increasing the provision of ecosystem services, maintaining landscape diversity, and effectively enhancing human well-being [33,34].
In contrast to the internationally popular PES, the concept of ecological compensation (EC) is currently used in China [35,36,37,38,39,40]. The concept of EC is essentially the same as that of PES [10]. Currently, China has developed a basic framework for EC, which is led by the government, relying mainly on fiscal transfers and central government subsidies and consists of key ecological protection and construction projects carried out by various levels of government [32,41,42]. China has implemented a number of EC programs at the national and regional levels and has conducted studies to assess their impact. For example, projects such as the Natural Forest Protection Project, Grain for Green Program, Coastal Development and Marine Use Compensation [43,44,45] have achieved good results in key ecological functional areas including forests, grasslands, wetlands, and oceans, as well as in agriculture [32,35,36,46,47,48]. A study by Ouyang [49] also showed that the implementation of the above-mentioned projects greatly improved the supply capacity of ecosystem services in China. At present, the mainstream approach to EC in China is the establishment of EC funds, which are co-financed by stakeholders to implement compensation payments. For example, China’s first cross-provincial watershed EC fund (the Xin’an River Basin Water Environment Compensation Fund) was established with 300 million yuan from the central government and 100 million yuan from each of Anhui and Zhejiang provinces [17]. However, the current EC standard is based on the financial capacity of local governments and is decided by high-level government agencies after a mutual game. The lack of clear EC standards among stakeholders, the lack of sufficient scientific basis for the funding ratio, and the lack of more detailed scientific research on the scope of EC have caused major flaws in the design of the EC scheme for the water environment in the Xin’an River Basin [17,38]. In the existing EC scheme, the ambiguity of the scope and amount of benefits usually leads to conflicts among stakeholders. This is an important reason why the central government is still the main payer of EC in China, despite the long implementation period [38]. Generally speaking, China’s EC system is still in its infancy and has yet to establish a comprehensive system and method to determine the subject and target of compensation, compensation standards, compensation methods, and funding sources [32,50]. There is an urgent need to clarify the supply-conveyance-benefit mechanism between providers and beneficiaries of ecological goods and services, scientifically identify beneficiaries and compensation amounts, and improve China’s EC system.
In recent years, EC based on ecosystem services is gradually emerging with the deepening of research on ecosystem services. Through scientific accounting of the value of ecosystem services, the quantitative goals and tasks of EC can be clearly defined, which can provide a scientific basis for managers at all levels in the development and utilization of natural ecosystems and EC. Currently, ecosystem service research is increasingly emphasizing anthropocentric thinking. Some studies have begun to recognize that ecosystem services study is multidisciplinary (sociocultural, economic, etc.) and needs to be approached from the perspective of ecosystem service supply, delivery, demand, and consumption [5,51]. More recently, the integration of ecosystem services supply and the social demand for these services has become a hot topic in ecosystem services study [52,53,54]. Most of the study that has been done has focused on small and medium scales (cities, watersheds, etc.) [52,55]. These studies focused on provisioning services and lacked research on regulating, cultural, and supporting services [51,53]. The content was mainly focused on the consumption of natural resources, and the spatial coupling of ecosystem services supply and demand was little studied [56]. The time scale of the study was a mostly static snapshot, ignoring the complexity, dynamics, and non-linear correlation of ecosystem services supply and demand, and there were relatively few studies on the distribution patterns, correlation, and aggregation of ecosystem service supply and demand in geographic locations, making it difficult to reveal the spatial characteristics of ecosystem service supply and demand [56,57,58]. At present, many scholars have revealed the spatial mismatch between the ecosystem services supply and demand [52,58]. Moreover, the delivery of ecosystem services from the supply area to the beneficial area requires a medium, namely, the ecosystem service flows [59,60]. By studying ecosystem service flows, it is possible to identify the paths of transfer of ecological goods and services between natural ecosystems and human socio-economic systems and to identify the key locations that influence the transfer of ecosystem services, thus providing a basis for the formulation of reasonable ecosystem management policies and EC schemes. However, the study of ecosystem service flows is still in its infancy, and there are still many deficiencies in theoretical principles, evaluation methods, and applications [61,62]. There is still a lack of case studies on EC that can be implemented.
Since the reform and opening up, China has achieved world-renowned success in economic development. However, behind the economic prosperity, there has been a serious conflict between increased resource consumption and environmental protection. According to statistics, more than 90% of China’s available grasslands have been degraded, and more than one-third of the country’s urban rivers have inferior water quality of category 5 [63]. Since the founding of the People’s Republic of China, China has lost more than 500 lakes, covering an area of 18,600 km2. One-third of China’s land area has experienced soil erosion [64]. China’s capacity to provide ecosystem services is declining, and more stringent and effective protection of the dwindling natural ecosystem is required. In addition, the physical geography and socio-economic development of China’s different regions vary greatly, and the spatial mismatch between ecosystem services supply and demand can lead to a series of environmental justice problems, such as the inequality between eastern and western regions in terms of access to resources and responsibility for environmental protection, and the continuous transfer of urban pollution to rural areas. EC policies must be implemented to address the spillover of “externalities” from ecosystem services through incentives that internalize externalities, reduce the gap in economic development between the supply and benefit areas of ecological goods and services, and thereby increase human well-being. As most of the previous data were interpreted from remote sensing images, the accuracy of the data was relatively poor. This study uses the land change survey data obtained by the land department through field surveys. This data is the most authoritative data in China. In combination with the available data, Yantai, a major city on the Shandong Peninsula, is chosen as the study area for this study. EC is not required as consumers have already purchased provisioning services such as food, water, and raw materials in the form of commodities. Therefore, this study combines the characteristics of Yantai and takes the carbon sequestration services in the region as an example to assess the ecological benefits of carbon sequestration services and measure the amount of EC in the townships, counties, and municipalities of Yantai by combining the physical measurement and monetary measurement from the perspective of ecosystem services supply and demand and clarified the whole process of the generation, circulation, and social demand docking of ecological benefits from the perspective of “nature-society”. The study can provide a reference for the spatial quantitative characterization of ecosystem service flows and quantitative EC, as well as for the formulation of EC policies and landscape planning in Yantai.
2. Materials and Methods
2.1. Description of the Study Area
Yantai is located in the eastern part of the Shandong Peninsula, with a total area of about 13,745 km2, and is an important port city in the Bohai Rim region. Yantai consists of 12 county-level administrative units, as shown in Figure 1. The landscape type is mainly hilly and mountainous, with a variety of ecosystem types and good ecological conditions.
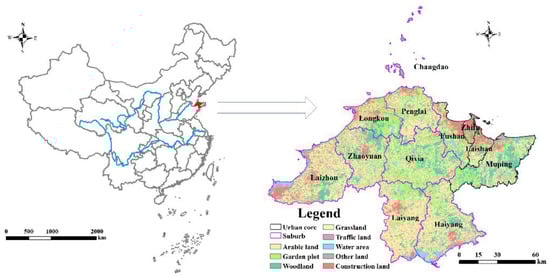
Figure 1.
Location of study area. Note: The boundary data for China were obtained from RESDC (http://www.resdc.cn/), and the boundary and land change survey data for Yantai were obtained from the Yantai Natural Resources Bureau (http://gtj.yantai.gov.cn/).
2.2. Data Sources
The land change survey data of Yantai in 2015 and Yantai administrative boundary data were from the Yantai Natural Resources Bureau (http://gtj.yantai.gov.cn/), including 8 primary types (arable land, garden plot, woodland, water area, construction land, grassland, traffic land, and other land) and 33 sub-class types. Population density data were obtained from the WorldPop dataset (https://www.worldpop.org/) at a resolution of 100 × 100 m [65]. Elevation data was obtained from ASTER GDEMV2 (http://www.gscloud.cn/) at a resolution of 30m [66]. Slope data was obtained using ArcGIS to calculate elevation data. The boundary data for China, NDVI, temperature, rainfall, and other data were obtained from the Data Center for Resource and Environmental Science, Chinese Academy of Sciences (RESDC, http://www.resdc.cn) [67,68,69,70,71]. In order to be consistent with the resolution of population density data, the above data resolution was unified to 100 × 100 m. In addition, the 2015 per capita carbon emissions data was from the Emissions Database for Global Atmospheric Research (EDGAR), which published per capita carbon emissions data for China [72]. The ecological red line was obtained from Yantai Ecological Environment Bureau (http://hbj.yantai.gov.cn/). The software used was ArcGIS 10.6 (Esri, Redlands, CA, USA), InVEST 3.7 (Natural Capital Project, Stanford, CA, USA), Origin 2018 (OriginLab, Northampton, MA, USA) and SPSS 25 (SPSS Inc., Chicago, IL, USA).
2.3. Methods
2.3.1. Supply and Demand of Carbon Sequestration Services
Carbon sequestration (CS) is an important regulating service, and increasing carbon stocks in terrestrial ecosystems can effectively reduce atmospheric CO2 [73,74]. It is one of the most economically viable and ecologically friendly ways to alleviate the greenhouse effect on the global climate [75]. This study used the CS module of the InVEST model to calculate the CS of Yantai in 2015. The CS module used land-use data and stocks in four carbon pools (above-ground biomass, below-ground biomass, soil, and dead organic matter) to estimate the current carbon storage in the landscape, as shown in Table 1. The carbon density data was obtained by consulting the following literature related to the study area [76,77,78], referring to sample data and combining expert opinions. The spatial distribution of CS demand in Yantai was obtained by multiplying per capita carbon emission data with population density data. The specific formula for calculating the supply and demand of CS was as follows.

Table 1.
Carbon pool table in the study area.
Supply:
Demand:
where is the sum of CS of all land-use types; , , , and are the carbon densities of above-ground biomass, below-ground biomass, soil organic matter, and dead organic matter, respectively. S is the area of different land-use types. is CS demand, is carbon emissions per capita, and is population density.
2.3.2. Ecological Compensation
The study used the difference method, that was, supply minus demand, to obtain the difference between supply and demand of carbon sequestration (DSDCS) in the study area in 2015. To better distinguish the supply—demand difference in different areas, this study classified the supply-demand situation of Yantai into 5 levels: serious overload, overload, relative balance, slight surplus, and surplus. Meanwhile, based on the results of DSDCS in Yantai in 2015, this study calculated the EC amount of each township in Yantai according to the domestic pilot market price of carbon emission trading in China (20 yuan/ton) [79]. The specific formula was as follows:
where is ecological compensation amount (unit: yuan), is the difference between supply and demand of carbon sequestration, is the domestic pilot market price of carbon emission trading in China. When the amount was greater than 0, it indicated that the region was an ecological surplus area where the supply was greater than the demand. The CS generated in the area was occupied by other areas, and it was an area that needed EC. On the contrary, the CS supply was less than the demand, and the regional residents enjoyed ecosystem services from other regions. This was an area where PES was required and belonged to an ecological deficit area.
2.3.3. Ecosystem Service Flows
Ecosystem service flows have the tendency to decay with increasing geographic spatial distance, and the influence degree varies with natural conditions such as wind direction, water flow, topography, and the amount of population movement [80]. In order to compare the utility of ecosystem services in different regions on external regions, Chen [81] proposed the concept of comparative ecological radiation force (CERF) by comprehensively considering the influence of distance and relative size of ecosystem service. CERF refers to the influence of the ecosystem services of different regions on the external regions within different distances through spatial flow in a certain region [81]. The concept of CERF is based on the gravity model in physics, using the breaking-point formula to quantitatively study the interaction of ecosystem services between two regions [81,82]. The breaking-point formula for ecosystem services was as follows.
where A is the ecological radiation force between different regions, is the distance between different regions, and and are the ecosystem service values of region i and region j, respectively.
Due to the mobility of ecosystem services, which typically cause them to have utility extraterritorially and decay with distance, is modified here to introduce an exponential distance decay function.
where is the exponential decay distance between different regions and is the maximum distance between different regions, which in this study is the distance between Laizhou and Muping.
Finally, the formula of CERF is obtained. The larger the distance is, and the smaller the CERF is, the smaller the influence of the region on the ecosystem services of the external region is, and the smaller the ecosystem services flows from this region is.
3. Results
3.1. Supply and Demand of Carbon Sequestration Services and Their Difference
The supply and demand of CS in Yantai were calculated according to Equations (1) and (2), respectively. In 2015, the CS supply in Yantai showed obvious characteristics of high in the middle and low in the surrounding areas, as shown in Figure 2. High-value areas were mainly concentrated in and around the city of Qixia, with a maximum value of 240 t/hm2. The terrain in these areas was mostly hilly, with more abundant water resources, dense distribution of forest and parkland, and a greater capacity for CS compared to other land-use types. Laizhou and the urban core (Zhifu, Fushan, Laishan) were the areas with low CS values. These areas were mostly plain, which were the urban spatial gathering place of Yantai, with high population density, developed economy, few types of ecological land, and weak CS capacity. The CS demand showed obvious spatial agglomeration and the high-value areas were distributed in Fushan, Laishan, Zhifu, and Muping, with a maximum value of 5920.92 t/hm2. The demand in urban areas of other counties was also high. The demand was low in non-urban areas due to low population density. There was a clear negative spatial correlation between the supply and demand, with demand being lower in areas of high supply and vice versa. The spatial mismatch between supply and demand was relatively serious. Factors such as population, climate and economic development were important factors that caused the mismatch between supply and demand.
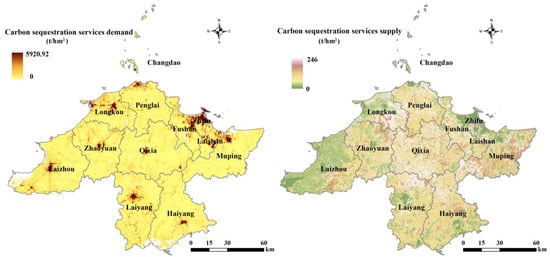
Figure 2.
Spatial distribution of supply and demand of carbon sequestration services. Note: Based on the land change survey data (http://gtj.yantai.gov.cn/), population density data (https://www.worldpop.org/) and per capita carbon emissions data for China [72], Figure 2 was obtained by calculating Equations (1) and (2).
Using the method in Section 2.3.2, the DSDCS in different regions were obtained. The result of the DSDCS in Yantai showed that most of Yantai belonged to the slight surplus and surplus pattern, as shown in Figure 3. The surplus pattern was mainly concentrated in Qixia, Muping, Zhaoyuan, and Longkou, with a total area of more than a quarter of Yantai’s land area. The area of slight surplus pattern was the largest, covering more than 40% of Yantai, and was mainly distributed in the central-eastern part of Yantai. The relative balance pattern was smaller, with most areas concentrated in Laizhou, Haiyang, Longkou, and Zhaoyuan. The core areas of the counties were overload and serious overload pattern, where the CS supply was less than the demand, and the difference was generally more than −40 t/hm2.
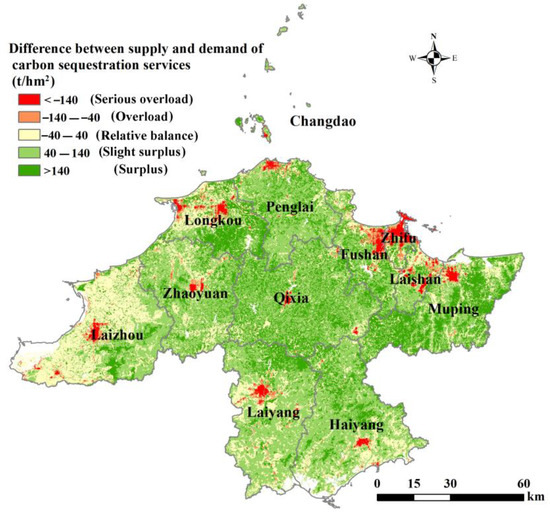
Figure 3.
Spatial distribution of the difference between supply and demand of CS. Note: Figure 3 was obtained from carbon sequestration supply minus carbon sequestration demand.
3.2. Specific Amount of EC
Combining the physical measurement and monetary measurement from the perspective of ecosystem services supply and demand, the method in Section 2.3.2 was used to finally obtain the specific amount of EC or ecological payment for CS for each township in Yantai. In terms of spatial distribution, most areas of Yantai were ecological surplus areas, and there were 129 townships whose supply-demand difference was greater than 0 million yuan, indicating that these areas need EC, as shown in Figure 4. Among them, there were 25 key townships for EC (1 in Laizhou, 2 in Zhaoyuan, 1 in Longkou, 3 in Penglai, 6 in Qixia, 2 in Laiyang, 5 in Haiyang, and 5 in Muping). The CS supply in the above regions exceeded the demand, and the supply-demand difference generally exceeded 30 million yuan. Guanshui Town in Mouping needed the most EC, with a specific amount of 65.55 million yuan. There were a few townships with ecological deficits in Yantai, with a total of 31 townships. Among them, 12 townships were important areas to carry out ecological payment, and the ecological deficit was relatively serious (1 in Laizhou, 1 in Longkou, 2 in Fushan, 5 in Zhifu, 1 in Haiyang, 1 in Laiyang, 1 in Muping). The CS supply was less than the demand, and the supply-demand difference exceeded 5 million yuan. Zhifu Island Sub-district Office was the region that paid the most for EC, with the cost of 22.84 million yuan.
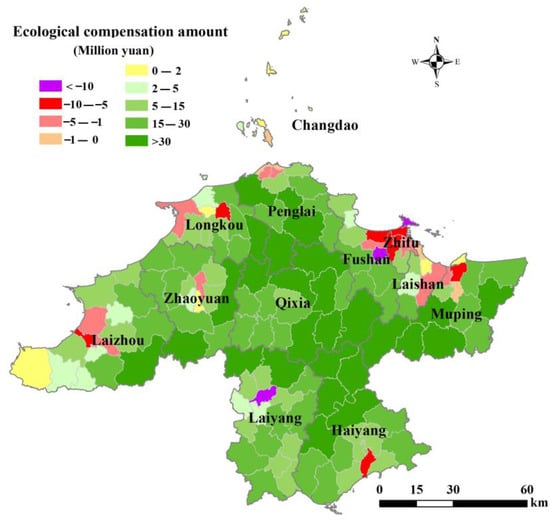
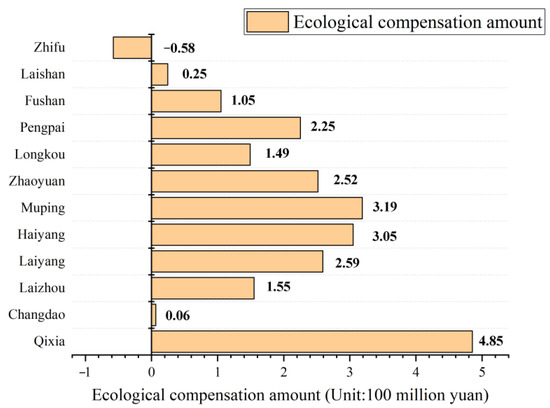
Figure 4.
The amount of EC for each township in Yantai. Note: Figure 4 was obtained by using ArcGIS Scheme 3. and the township boundary data of Yantai (http://gtj.yantai.gov.cn/). The original data is in the Supplementary Files.
This study summarized the compensation amounts for different townships in different counties. The results showed that, except for Zhifu, the CS supply in Yantai was greater than the demand and belonged to the surplus area of CS. The largest amount of EC was in Qixia, which exceeded 480 million yuan, as shown in Figure 5. Penglai, Zhaoyuan, Muping, Laiyang, and Haiyang also had compensation amounts exceeding 200 million yuan. Although Laishan belonged to the urban core of Yantai, the supply-demand situation of CS in the east of Laishan was good, which made it present an ecological surplus pattern on the whole. Zhifu was a core area of Yantai with a high population density and a developed economy. However, the ecological land within the territory was less than 50 km2, and ecosystem services were highly dependent on inputs from other areas, making it a serious ecological overload area. Summarized in Yantai, the total amount of EC for CS was approximately 2.2 billion yuan, and Yantai was the source of CS.
3.3. Carbon Sequestration Service Flow
Figure 6 showed the CERF in different areas of Yantai. In terms of different regions, the CERF of each county to Zhifu was large. This was mainly due to the fact that Zhifu was the core region of Yantai, which had a high population density and a high demand for ecosystem services. Situated in the central part of Yantai, Qixia was a typical ecological surplus area with high vegetation cover, and its CERF to other areas was generally large. Changdao was far from the mainland and had very little CERF to the land counties. Haiyang, Fushan, and Muping had great CERF to Laishan, while their CERF to Laizhou was small. Longkou and Zhaoyuan had relatively small CERF to Muping but relatively large to Changdao. Laizhou and Penglai had great CERF to Changdao. Haiyang and Laiyang also had relatively small CERF to Penglai. On the whole, Qixia, Muping, and Penglai were the areas with higher CERF in Yantai, and the total amount of CS transferred to the external area was also relatively large. Changdao was the area with the smallest CERF, and the CERF of central urban areas such as Zhifu and Laishan was also small, and the total amount of CS transferred to the external area was also small.
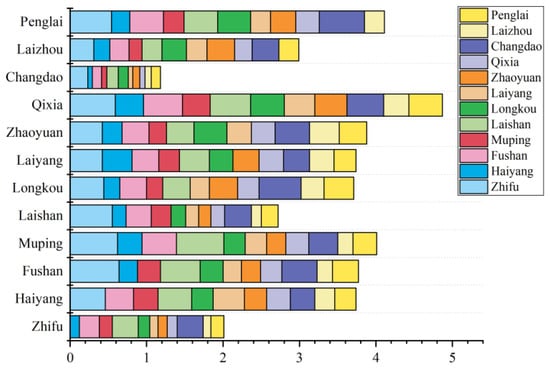
Figure 6.
The CERF of various regions in Yantai. Note: On the basis of the original data obtained by Equations (4)–(6), Figure 6 was obtained using Origin software.
The study also statistically analyzed the proportion of ecosystem services obtained from different regions in each county of Yantai, as shown in Table 2. Zhifu got the most ecosystem services from Fushan and the least from Changdao. Fushan, Zhaoyuan, Penglai, Muping, and Longkou got the most carbon sequestration services from Qixia. Haiyang was from Laiyang. Laiyang was from Muping. Laiyang was from Haiyang. Qixia and Haiyang were from Laiyang. On the whole, the proportion of carbon sequestration services provided by Qixia to other counties exceeded 10%, Penglai exceeded 9%, and Longkou and Zhaoyuan exceeded 8%. The above areas should be considered as key ecological compensation areas.
Table 2.
Proportion of ecosystem services obtained from different regions by counties in Yantai (%).
This study also displayed the contents of Figure 6 and Table 2 in geographic space, as shown in Figure 7. Figure 7 showed the proportion of ecosystem services obtained by each district of Yantai from other areas, and also indicated the spatial flow of CS in different areas of Yantai. The direction of the arrow in Figure 7 is the direction of the CS flow and the width of the arrow is the proportion of the CS flow. The result was a good demonstration of the attenuation law of ecosystem services in space. Here, the case of Laizhou in the west of Yantai was taken as an example. The CS from Laizhou flowed to the nearest Zhaoyuan with the largest proportion, accounting for 12.01%. This was followed by Longkou and Laiyang, with the proportion of CS flowing to both being 9.93% and 9.8%, respectively. The urban core was the farthest away from Laizhou and received the least percentage of CS from Laizhou. The direction of flows also varied across counties. The flow direction of CS was mainly from north to south in Penglai, Changdao, and Longkou. Laiyang and Haiyang was from south to north. Laizhou and Zhaoyuan was from west to east. Moreover, Muping and Laishan was from east to west. Due to its location in the middle of Yantai, the direction of flow in Qixia was not obvious, and the overall effect of the ripple spread was shown. Policymakers can arrange EC according to the amount to be received by different regions, the proportion of CS received, and the direction of spatial flows, thus promoting more coordinated regional development to address environmental equity issues.
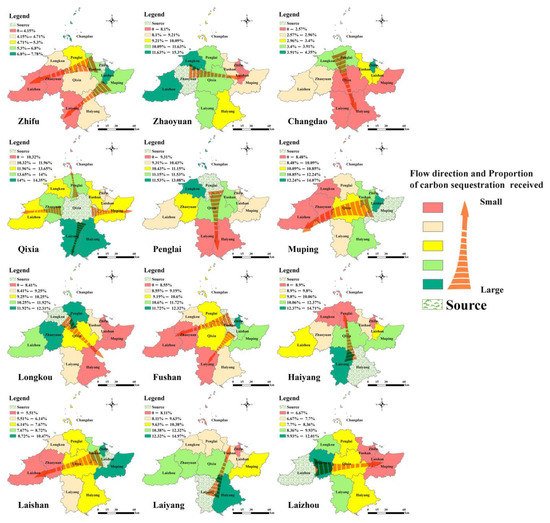
Figure 7.
Carbon sequestration flows in different counties of Yantai. Note: Figure 7 displayed the contents of Figure 6 and Table 2 in geographic space to characterize ecosystem service flows. The direction of the arrow in Figure 7 is the direction of the CS flow and the width of the arrow is the proportion of the CS flow.
4. Discussion
4.1. The Mismatch between Ecosystem Services Supply and Demand and the Relationship between DSDCS and Natural and Social Factors
There was an obvious spatial mismatch between the supply and demand of CS in Yantai. Like previous studies, the mismatch between ecosystem services supply and demand was already a relatively common phenomenon [5,52,57]. The demand for various ecosystem services was high in populated areas, while ecological land was scarce, and the supply capacity of ecosystem services was limited. The map below gave the ecological redline in Yantai, that was, the areas with particularly important ecological functions that must be strictly protected under mandatory conditions, as shown in Figure 8. There was a clear spatial heterogeneity between areas of high demand for ecosystem services and the ecological redline. It was the difference between supply and demand that drove the diversified flow of ecosystem services [83]. With the urbanization of Yantai in recent years, the ecosystem services demand will continue to increase. It will inevitably affect changes in land-use intensity, which in turn will negatively affect ecosystem integrity and ecosystem service supply [1]. Therefore, not only does the management of ecological reserves need to be strengthened to ensure that more ecosystem services can be provided, but measures should also be taken to reduce the unnecessary ecosystem services demand. In fact, it is difficult to precisely match the supply and demand of a certain ecosystem service. Usually, when humans seek to maximize the benefits of service for their own well-being, they do so at the expense of other services, potentially creating trade-offs between different ecosystem services [84]. Moreover, a better match between supply and demand for some services is usually accompanied by a poorer match for others [85]. Land use practices, such as labor, technology, and capital inputs, must be managed artificially to maintain and enhance ecosystems and to reconcile ecosystem service trade-offs in order to meet ever-changing human demand for ecosystem services [5,86].
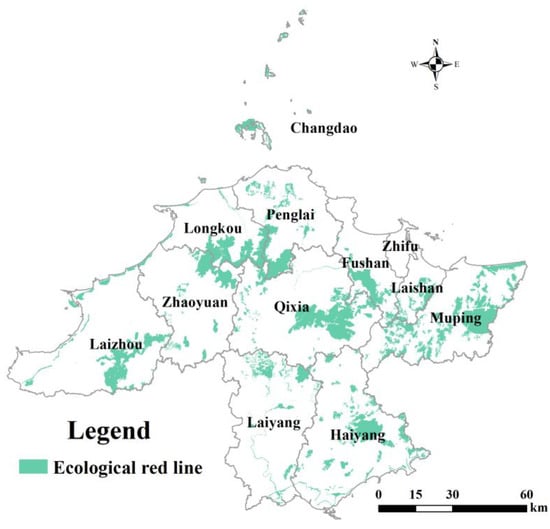
Figure 8.
Spatial distribution of ecological red line in Yantai. Note: Ecological red line data was from Yantai Ecological Environment Bureau (http://hbj.yantai.gov.cn/).
The study also used Pearson correlation coefficient to analyze the relationship between the DSDCS and natural and social factors for land use management in Yantai, as shown in Table 3. The study found that the correlations between different factors and the DSDCS varied significantly. Climate factors and social factors showed negative correlation and others showed positive correlation. The hilly areas with high height and large slope were not conducive to various human development and construction activities, and the intensity of human activities was low [87]. These areas tended to have lush vegetation, better ecological conditions, and a strong capacity to supply ecosystem services. The government should incorporate the protection of hilly areas into the urban green line management, repair mountain damage, and focus on implementing national key ecological protection and restoration projects [49]. Normalized Difference Vegetation Index (NDVI) had a strong positive correlation with the DSDCS, because NDVI can directly reflect the growth condition of vegetation. The larger the NDVI, the greater the vegetation coverage, and the stronger the carbon sequestration capacity. Therefore, it is necessary to strengthen the restoration of natural forests and vegetation, maintain regional biodiversity, and increase the supply capacity of ecosystem services [27,28]. Social factors such as population density and economic density were negatively correlated with the DSDCS. The urban core should optimize the layout of urban green space structure, protect urban green space, combined with green space and water layout, and build a relatively complete urban green space system composed of green space patches–ecological corridors–urban green space, so as to improve the quality and stability of the ecological system [5,8]. As climate factors were difficult to control by humans, this study did not discuss these.
Table 3.
Correlation coefficient between DSDCS and natural and social factors.
4.2. The Direction of Ecosystem Service Flows and Its Policy Response
Currently, most of the studies on ecosystem service flows focus on water ecosystem services, because the spatial flow processes and transfer paths can be better quantitatively analyzed and simulated [88]. There are also some studies that depict the sand control ecosystem service flows [38,81]. In this study, although the CS flows in Yantai showed a decaying pattern in space, the directional differences between counties were significant. This was mainly because the CS was omni-directional and did not show specific directionality. The results of the study were similar to the previous ones. On the whole, the supply area of CS in Yantai was distributed around the urban core and transmitted through carriers. The overall flow direction was from the outer suburbs to the urban core. In the complex network of ecosystem service flows, humans are at the ultimate node of the network. While enjoying the benefits of ecosystem service flows, humans interfere with the flow delivery process through a variety of human activities that have a significant impact on the delivery carrier, flow direction, flow rate, and velocity of the ecosystem service flow, and ultimately, through the cycle, on human well-being. Therefore, actions must be taken to control the negative effects of ecosystem service flows and maintain the positive ones. In Yantai, for example, managers should strengthen greening around the town, enhance the forest landscape, build urban green corridors, form urban forest complex ecosystems with forest and water dependence, forest road dependence, and forest-dwelling dependence, and enhance CS. Meanwhile, inter-regional dependencies reflect ecosystem flows, making cross-regional ecological cooperation necessary. Regional sustainable development is not limited to the local area but is also closely linked to the ecosystem service provisioning areas and ecosystem service flows in the region [89]. Financial flows, such as EC and ecological engineering, are necessary to maintain the balance between regions and ensure the sustainable provision of ecosystem services [43,47].
4.3. The Effect of EC on Human Well-Being
The results of EC in Yantai showed that the DSDCS and its spatial mobility could provide a better understanding of the amount of EC that each region should receive and the proportion that each region should pay. This is of great importance for coordinating regional development and solving environmental equity issues. According to information released by the Yantai Finance Bureau, Yantai received a total of 65.61 million yuan in provincial ambient air quality EC funds from 2014 to 2018, cashing in 106 million yuan in ambient air quality ecological compensation funds for counties and cities. By 2018, ambient air quality had been effectively improved, and urban air quality for the first time fully met the national air quality level 2 standard [90]. This also indirectly proves the effectiveness of the EC policy. In fact, many international researchers have reached a consensus that PES or EC can directly improve the ecological environment and enhance human well-being. For example, the net per capita income of farmers returning farmland to forests in China increased from RMB 1945 in 2000 to RMB 7602 in 2014 [5]. Mangrove carbon PES could contribute an additional 2.3–5.8% of the Income of Pedada and Bugtong-bato fishing villages in Ibajay City, Panay Island, Philippines [22]. Soil conservation measures have reduced soil erosion by a quarter in the Guari Roba River Basin in central and western Brazil [91].
4.4. Methodological Limitations and Challenges for Future Research
This study took CS as an example and assessed the ecological benefits of CS and measured the amount of EC in townships, counties, and municipalities of Yantai by combining the physical measurement and monetary measurement from the perspective of ecosystem services supply and demand. Moreover, this study clarified the whole process of the generation, circulation and social demand docking of ecological benefits from the perspective of “nature-society”. There were two main contributions of this study. First, this study proposed a quantitative method of EC for CS based on the perspective of ecosystem services supply and demand. Second, this study innovated a quantitative method for the spatial flow characterization of CS and explored the difficulties of spatial quantitative characterization of ecosystem service flows and the scientific and rational criteria for quantifying EC.
However, this study was all conducted on specific geographical boundaries, ignoring ecosystem openness and the flowability of ecosystem services between Yantai and other regions. Moreover, there were differences in the ecosystem services enjoyed by the beneficiaries in different areas. Different human activities and natural factors had an impact on the flow direction, flow rate, and velocity of the ecosystem service flows. Ecosystem services demand was also influenced by specific cultural and social contexts (gender, age, marital status, education, income, ethnicity, etc.) and can change over time and spatial scales [5]. This was also a key factor driving changes in the ecosystem service flows. In addition, the EC aspect of this study was deficient regarding conflicts among stakeholders, the timeliness of EC policies, and willingness to pay. Regional differences in EC standards were not taken into account, and there was a degree of “passive” compensation in neighboring areas. Some regions passively accepted ecological radiation, which was also an important issue for policy-makers to consider [73].
Overall, the value and significance of this study is an exploratory discussion of how to integrate the ecosystem services supply and demand, ecosystem service flows, and EC. Research on ecosystem service supply and demand and ecosystem service flows is still in its infancy, and theories are still being explored and refined. As the key to transforming ecosystem services into human well-being, future studies should try to combine geography, meteorology, ecology, economics, and other aspects of knowledge, focusing on the spatial mapping of ecosystem service flows, flow rates, flow directions, cost effects, and losses. Meanwhile, the willingness to pay of different stakeholders, such as residents, government, enterprises, and social organizations, should be taken into account through field visits, to provide support for the scientific development of EC and sustainable regional development.
5. Conclusions
The results showed that (1) there was a significant spatial difference between the supply and demand of CS in Yantai, and supply and demand were negatively correlated, with a serious spatial mismatch. Although the urban core of each county belonged to the overload zone, most areas of Yantai were still ruled by the surplus zone, which covered 80% of the total area of Yantai. (2) Most areas of Yantai (including 129 townships) were ecological surplus areas and required EC. A total of 31 townships belonged to ecological deficit areas and needed to carry out the ecological payment. EC in Qixia exceeded 480 million Yuan, while the amount of compensation in Penglai, Zhaoyuan, Muping, Laiyang, and Haiyang exceeded 200 million Yuan. The amount of EC for CS in Yantai was about 2.2 billion Yuan, which was an important source of CS. (3) Qixia, Muping, and Penglai had greater CERF, and the total amount of CS transferred to external regions was relatively large. Changdao has the lowest CERF. The proportion of carbon sequestration services provided by Qixia to other cities and districts exceeded 10%, Penglai exceeded 9%, Longkou and Zhaoyuan exceeded 8%, and the above areas should be taken as key ecological compensation areas. (4) The CS flows of Yantai showed a spatial decay law. As the distance from a certain area gets farther, the less CS were obtained, and the direction of CS flows varied from county to county. Policymakers can arrange ecological compensation according to the amount of ecological compensation to be obtained in different regions, the proportion of carbon sequestration services to be obtained, and the direction of spatial transfer, so as to promote more coordinated regional development to address environmental equity issues.
Author Contributions
Conceptualization, T.Z. and J.W.; methodology, T.Z. and J.W.; software, T.Z. and L.H.; formal analysis, T.Z. and J.L.; investigation, T.Z.; resources, T.Z. and J.W.; data curation, T.Z. and Y.F.; writing—original draft preparation, T.Z.; writing—review and editing, T.Z. and C.Z.; visualization, T.Z.; supervision, T.Z.; project administration, T.Z.; funding acquisition, J.W. All authors have read and agreed to the published version of the manuscript.
Funding
This research was funded by the National Natural Science Foundation of China, grant number 41871203, special fund for young talents of Henan Agricultural University, grant number 30500956.
Institutional Review Board Statement
Not applicable.
Informed Consent Statement
Not applicable.
Data Availability Statement
No new data were created or analyzed in this study. Data sharing is not applicable to this article.
Conflicts of Interest
The authors declare no conflict of interest.
References
- Millennium Ecosystem Assessment. Ecosystems and Human Well-Being: Synthesis; Island Press: Washington, DC, USA, 2008. [Google Scholar]
- Sanyé-Mengual, E.; Specht, K.; Vávra, J.; Artmann, M.; Orsini, F.; Gianquinto, G. Ecosystem Services of Urban Agriculture: Perceptions of Project Leaders, Stakeholders and the General Public. Sustainability 2020, 12, 10446. [Google Scholar] [CrossRef]
- Roque Guerrero, J.V.; Teixeira Gomes, A.A.; de Lollo, J.A.; Moschini, L.E. Mapping Potential Zones for Ecotourism Ecosystem Services as a Tool to Promote Landscape Resilience and Development in a Brazilian Municipality. Sustainability 2020, 12, 10345. [Google Scholar] [CrossRef]
- UNCCD (United Nations Convention to Combat Desertification). Poor Land Use Costs Countries 9 Percent Equivalent of Their GDP. UNCCD, Bonn, Germany. 2018. Available online: https://www.unccd.int/news-events/poor-land-use-costs-countries-9-percent-equivalent-their-gdp (accessed on 9 May 2018).
- Zhai, T.; Wang, J.; Jin, Z.; Qi, Y.; Fang, Y.; Liu, J. Did improvements of ecosystem services supply-demand imbalance change environmental spatial injustices? Ecol. Indic. 2020, 111, 106068. [Google Scholar] [CrossRef]
- Li, Q.; Long, R.; Chen, H. Differences and influencing factors for Chinese urban resident willingness to pay for green housings: Evidence from five first-tier cities in China. Appl. Energy 2018, 229, 299–313. [Google Scholar] [CrossRef]
- Xu, Z.; Wei, H.; Fan, W.; Wang, X.; Zhang, P.; Ren, J.; Lu, N.; Gao, Z.; Dong, X.; Kong, W. Relationships between ecosystem services and human well-being changes based on carbon flow—A case study of the Manas River Basin, Xinjiang, China. Ecosyst. Serv. 2019, 37, 100934. [Google Scholar] [CrossRef]
- Wolch, J.R.; Byrne, J.; Newell, J.P. Urban green space, public health, and environmental justice: The challenge of making cities ‘just green enough’. Landsc. Urban Plan 2014, 125, 234–244. [Google Scholar] [CrossRef]
- UN. Transforming Our World: The 2030 Agenda for Sustainable Development. In Resolution Adopted by the General Assembly on 25 September 2015. SeventiethSession, Agenda Items 15 and 116. A/RES/70/1. 2015. Available online: http://www.un.org/ga/search/view_doc.asp?symbol=A/RES/70/1&Lang=E (accessed on 25 September 2015).
- Pan, X.; Xu, L.; Yang, Z.; Yu, B. Payments for ecosystem services in China: Policy, practice, and progress. J. Clean Prod. 2017, 158, 200–208. [Google Scholar] [CrossRef]
- Ren, L.; Li, J.; Li, S.; Li, C.; Daily, G.C. Does China’s major Payment for Ecosystem Services program meet the “gold criteria”? Targeting strategies of different decision-makers. J. Clean. Prod. 2020, 275, 122667. [Google Scholar] [CrossRef]
- Yang, Y.; Chen, Y.; Yu, Z.; Li, P.; Li, X. How Does Improve Farmers’ Attitudes toward Ecosystem Services to Support Sustainable Development of Agriculture? Based on Environmental Kuznets Curve Theory. Sustainability 2020, 12, 8655. [Google Scholar] [CrossRef]
- Krozer, Y.; Coenen, F.; Hanganu, J.; Lordkipanidze, M.; Sbarcea, M. Towards Innovative Governance of Nature Areas. Sustainability 2020, 12, 10624. [Google Scholar] [CrossRef]
- Brownson, K.; Anderson, E.P.; Ferreira, S.; Wenger, S.; Fowler, L.; German, L. Governance of Payments for Ecosystem Ecosystem services influences social and environmental outcomes in Costa Rica. Ecol. Econ. 2020, 174, 106659. [Google Scholar] [CrossRef]
- Moros, L.; Corbera, E.; Vélez, M.A.; Flechas, D. Pragmatic conservation: Discourses of payments for ecosystem services in Colombia. Geoforum 2020, 108, 169–183. [Google Scholar] [CrossRef]
- Pfaff, A.; Rodriguez, L.A.; Shapiro-Garza, E. Collective Local Payments for ecosystem services: New local PES between groups, sanctions, and prior watershed trust in Mexico. Water Resour. Econ. 2019, 28, 100136. [Google Scholar] [CrossRef]
- Ren, Y.; Lu, L.; Zhang, H.; Chen, H.; Zhu, D. Residents′ willingness to pay for ecosystem services and its influencing factors: A study of the Xin’an river basin. J. Clean. Prod. 2020, 268, 122301. [Google Scholar] [CrossRef]
- Dang Do, T.; NaRanong, A. Livelihood and Environmental Impacts of Payments for Forest Environmental Services: A Case Study in Vietnam. Sustainability 2019, 11, 4165. [Google Scholar] [CrossRef]
- Marino, D.; Pellegrino, D. Can Payments for Ecosystem Services improve the management of Natura 2000 sites? A contribution to explore their role in Italy. Sustainability 2018, 10, 665. [Google Scholar] [CrossRef]
- Salzman, J.; Bennett, G.; Carroll, N.; Goldstein, A.; Jenkins, M. The global status and trends of Payments for Ecosystem Services. Nat. Sustain. 2018, 1, 136–144. [Google Scholar] [CrossRef]
- Richards, R.C.; Kennedy, C.J.; Lovejoy, T.E.; Brancalion, P.H. Considering farmer land use decisions in efforts to ‘scale up’Payments for Watershed Services. Ecosyst. Serv. 2017, 23, 238–247. [Google Scholar] [CrossRef]
- Thompson, B.S.; Primavera, J.H.; Friess, D.A. Governance and implementation challenges for mangrove forest Payments for Ecosystem Services (PES): Empirical evidence from the Philippines. Ecosyst. Serv. 2017, 23, 146–155. [Google Scholar] [CrossRef]
- Grilli, G.; Fratini, R.; Marone, E.; Sacchelli, S. A spatial-based tool for the analysis of payments for forest ecosystem services related to hydrogeological protection. For. Policy Econ. 2020, 111, 102039. [Google Scholar] [CrossRef]
- Kwayu, E.J.; Sallu, S.M.; Paavola, J. Farmer participation in the equitable payments for watershed services in Morogoro, Tanzania. Ecosyst. Serv. 2014, 7, 1–9. [Google Scholar] [CrossRef]
- Binet, T.; Failler, P.; Chavance, P.N.; Mayif, M.A. First international payment for marine ecosystem services: The case of the Banc d’Arguin National Park, Mauritania. Glob. Environ. Chang. 2013, 23, 1434–1443. [Google Scholar] [CrossRef]
- Maslo, B.; Leu, K.; Pover, T.; Weston, M.A.; Gilby, B.L.; Schlacher, T.A. Optimizing conservation benefits for threatened beach fauna following severe natural disturbances. Sci. Total Environ. 2019, 649, 661–671. [Google Scholar] [CrossRef] [PubMed]
- Ovando, P.; Beguería, S.; Campos, P. Carbon sequestration or water yield? The effect of payments for ecosystem services on forest management decisions in Mediterranean forests. Water Resour. Econ. 2019, 28, 100119. [Google Scholar] [CrossRef]
- Sheng, W.; Zhen, L.; Xie, G.; Xiao, Y. Determining eco-compensation standards based on the ecosystem services value of the mountain ecological forests in Beijing, China. Ecosyst. Serv. 2017, 26, 422–430. [Google Scholar] [CrossRef]
- Campbell, E.; Marks, R.; Conn, C. Spatial modeling of the biophysical and economic values of ecosystem services in Maryland, USA. Ecosyst. Serv. 2020, 43, 101093. [Google Scholar] [CrossRef]
- Muenzel, D.; Martino, S. Assessing the feasibility of carbon payments and Payments for Ecosystem Services to reduce livestock grazing pressure on saltmarshes. J. Environ. Manag. 2018, 225, 46–61. [Google Scholar] [CrossRef]
- Kousky, C.; Olmstead, S.M.; Walls, M.A.; Macauley, M. Strategically placing green infrastructure: Cost-effective land conservation in the floodplain. Environ. Sci. Technol. 2013, 47, 3563–3570. [Google Scholar] [CrossRef]
- Liu, M.; Yang, L.; Min, Q. Establishment of an eco-compensation fund based on eco-services consumption. J. Environ. Manag. 2018, 211, 306–312. [Google Scholar] [CrossRef]
- Jack, B.K.; Kousky, C.; Sims, K.R. Designing payments for ecosystem services: Lessons from previous experience with incentive-based mechanisms. Proc. Natl. Acad. Sci. USA 2008, 105, 9465–9470. [Google Scholar] [CrossRef]
- Bennett, D.E.; Gosnell, H. Integrating multiple perspectives on payments for ecosystem services through a social–ecological systems framework. Ecol. Econ. 2015, 116, 172–181. [Google Scholar] [CrossRef]
- Yu, B.; Xu, L.; Wang, X. Ecological compensation for hydropower resettlement in a reservoir wetland based on welfare change in Tibet, China. Ecol. Eng. 2016, 96, 128–136. [Google Scholar] [CrossRef]
- Yu, B.; Xu, L.; Yang, Z. Ecological compensation for inundated habitats in hydropower developments based on carbon stock balance. J. Clean. Prod. 2016, 114, 334–342. [Google Scholar] [CrossRef]
- Jiang, K.; Merrill, R.; You, D.; Pan, P.; Li, Z. Optimal control for transboundary pollution under ecological compensation: A stochastic differential game approach. J. Clean. Prod. 2019, 241, 118391. [Google Scholar] [CrossRef]
- Su, K.; Sun, X.; Guo, H.; Long, Q.; Li, S.; Mao, X.; Niu, T.; Yu, Q.; Wang, Y.; Yue, D. The Establishment of a cross-regional differentiated ecological compensation scheme based on the benefit areas and benefit levels of sand-stabilization ecosystem service. J. Clean. Prod. 2020, 270, 122490. [Google Scholar] [CrossRef]
- Li, G.; Wang, Q.; Liu, G.; Zhao, Y.; Wang, Y.; Peng, S.; Wei, Y.; Wang, J. A Successful Approach of the First Ecological Compensation Demonstration for Crossing Provinces of Downstream and Upstream in China. Sustainability 2020, 12, 6021. [Google Scholar] [CrossRef]
- He, J.; Wan, Y.; Tang, Z.; Zhu, X.; Wen, C. A Developed Framework for the Multi-District Ecological Compensation Standards Integrating Ecosystem Service Zoning in an Urban Area in China. Sustainability 2019, 11, 4876. [Google Scholar] [CrossRef]
- Dong, J.; Wu, D. An Evaluation of the Impact of Ecological Compensation on the Cross-Section Efficiency Using SFA and DEA: A Case Study of Xin’an River Basin. Sustainability 2020, 12, 7966. [Google Scholar] [CrossRef]
- Zou, C.; Liu, J.; Liu, B.; Zheng, X.; Fang, Y. Evaluating Poverty Alleviation by Relocation under the Link Policy: A Case Study from Tongyu County, Jilin Province, China. Sustainability 2019, 11, 5061. [Google Scholar] [CrossRef]
- Liu, J.; Li, S.; Ouyang, Z.; Tam, C.; Chen, X. Ecological and socioeconomic effects of China′s policies for ecosystem services. Proc. Natl. Acad. Sci. USA 2008, 105, 9477–9482. [Google Scholar] [CrossRef]
- Li, J.; Feldman, M.W.; Li, S.; Daily, G.C. Rural household income and inequality under the Sloping Land Conversion Program in western China. Proc. Natl. Acad. Sci. USA 2011, 108, 7721–7726. [Google Scholar] [CrossRef] [PubMed]
- Yu, H.; Xie, W.; Yang, L.; Du, A.; Almeida, C.M.; Wang, Y. From payments for ecosystem services to eco-compensation: Conceptual change or paradigm shift? Sci. Total Environ. 2020, 700, 134627. [Google Scholar] [CrossRef] [PubMed]
- Liu, M.; Zhang, D.; Min, Q.; Xie, G.; Su, N. The calculation of productivity factor for ecological footprints in China: A methodological note. Ecol. Indic. 2014, 38, 124–129. [Google Scholar] [CrossRef]
- Rao, H.; Lin, C.; Kong, H.; Jin, D.; Peng, B. Ecological damage compensation for coastal sea area uses. Ecol. Indic. 2014, 38, 149–158. [Google Scholar] [CrossRef]
- Le, W.; Leshan, J. How eco-compensation contribute to poverty reduction: A perspective from different income group of rural households in Guizhou, China. J. Clean. Prod. 2020, 275, 122962. [Google Scholar] [CrossRef]
- Ouyang, Z.; Zheng, H.; Xiao, Y.; Polasky, S.; Liu, J.; Xu, W.; Wang, Q.; Zhang, L.; Xiao, Y.; Rao, E. Improvements in ecosystem services from investments in natural capital. Science 2016, 352, 1455–1459. [Google Scholar] [CrossRef]
- Zheng, H.; Robinson, B.E.; Liang, Y.; Polasky, S.; Ma, D.; Wang, F.; Ruckelshaus, M.; Ouyang, Z.; Daily, G.C. Benefits, costs, and livelihood implications of a regional payment for ecosystem service program. Proc. Natl. Acad. Sci. USA 2013, 110, 16681–16686. [Google Scholar] [CrossRef]
- Wang, J.; Zhai, T.; Lin, Y.; Kong, X.; He, T. Spatial imbalance and changes in supply and demand of ecosystem services in China. Sci. Total Environ. 2019, 657, 781–791. [Google Scholar] [CrossRef]
- Burkhard, B.; Kroll, F.; Nedkov, S.; Müller, F. Mapping ecosystem service supply, demand and budgets. Ecol. Indic. 2012, 21, 17–29. [Google Scholar] [CrossRef]
- Wei, H.; Fan, W.; Wang, X.; Lu, N.; Dong, X.; Zhao, Y.; Ya, X.; Zhao, Y. Integrating supply and social demand in ecosystem services assessment: A review. Ecosyst. Serv. 2017, 25, 15–27. [Google Scholar] [CrossRef]
- González-García, A.; Palomo, I.; González, J.A.; López, C.A.; Montes, C. Quantifying spatial supply-demand mismatches in ecosystem services provides insights for land-use planning. Land Use Policy 2020, 94, 104493. [Google Scholar] [CrossRef]
- Larondelle, N.; Lauf, S. Balancing demand and supply of multiple urban ecosystem services on different spatial scales. Ecosyst. Serv. 2016, 22, 18–31. [Google Scholar] [CrossRef]
- Zhai, T.L.; Wang, J.; Jin, Z.F.; Qi, Y. Change and correlation analysis of supply-demand pattern of ecosystem services in the Yangtze River Economic Belt. Acta Ecol. Sin. 2019, 39, 5414–5424. [Google Scholar] [CrossRef]
- Lorilla, R.S.; Kalogirou, S.; Poirazidis, K.; Kefalas, G. Identifying spatial mismatches between the supply and demand of ecosystem services to achieve a sustainable management regime in the Ionian Islands (Western Greece). Land Use Policy 2019, 88, 104171. [Google Scholar] [CrossRef]
- Zoderer, B.M.; Tasser, E.; Carver, S.; Tappeiner, U. Stakeholder perspectives on ecosystem service supply and ecosystem service demand bundles. Ecosyst. Serv. 2019, 37, 100938. [Google Scholar] [CrossRef]
- Bagstad, K.J.; Johnson, G.W.; Voigt, B.; Villa, F. Spatial dynamics of ecosystem service flows: A comprehensive approach to quantifying actual services. Ecosyst. Serv. 2013, 4, 117–125. [Google Scholar] [CrossRef]
- Li, D.; Wu, S.; Liu, L.; Liang, Z.; Li, S. Evaluating regional water security through a freshwater ecosystem service flow model: A case study in Beijing-Tianjian-Hebei region, China. Ecol. Indic. 2017, 81, 159–170. [Google Scholar] [CrossRef]
- Shi, Y.; Shi, D.; Zhou, L.; Fang, R. Identification of ecosystem services supply and demand areas and simulation of ecosystem service flows in Shanghai. Ecol. Indic. 2020, 115, 106418. [Google Scholar] [CrossRef]
- Kleemann, J.; Schröter, M.; Bagstad, K.J.; Kuhlicke, C.; Kastner, T.; Fridman, D.; Schulp, C.J.; Wolff, S.; Martínez-López, J.; Koellner, T. Quantifying interregional flows of multiple ecosystem services–A case study for Germany. Glob. Environ. Chang. 2020, 61, 102051. [Google Scholar] [CrossRef]
- Zhao, Q.G.; Huang, G.Q.; Ma, Y.Q. The ecological environment conditions and construction of an ecological civilization in China. Acta Ecol. Sin. 2016, 36, 10081968. [Google Scholar] [CrossRef]
- Liu, J.H.; Gao, J.X.; Ma, S.; Wang, W.; Zou, C. Evaluation of ecological sensitivity in China. J. Nat. Resour. 2015, 30, 1607–1616. [Google Scholar] [CrossRef]
- WorldPop (www.worldpop.org—School of Geography and Environmental Science, University of Southampton; Department of Geography and Geosciences, University of Louisville; Departement de Geographie, Universite de Namur) and Center for International Earth Science Information Network (CIESIN), Columbia University. Global High Resolution Population Denominators Project—Funded by the Bill and Melinda Gates Foundation (OPP1134076). 2018. Available online: https://www.worldpop.org/doi/10.5258/SOTON/WP00645 (accessed on 1 November 2018).
- Geospatial Data Cloud. ASTER Global DEM Version 2 Data. 2015. Available online: http://www.gscloud.cn/sources/accessdata/421?pid=302 (accessed on 28 January 2021).
- Data Center for Resource and Environmental Science. China’s Provincial Administrative Boundary Data in 2015. Available online: http://www.resdc.cn/data.aspx?DATAID=200 (accessed on 28 January 2021).
- Data Center for Resource and Environmental Science. Spatial Interpolation Dataset of Annual Precipitation in China Since 1980. 2015. Available online: http://www.resdc.cn/data.aspx?DATAID=229 (accessed on 28 January 2021).
- Data Center for Resource and Environmental Science. Spatial Interpolation Data Set of Annual Mean Temperature in China since 1980. 2015. Available online: http://www.resdc.cn/data.aspx?DATAID=228 (accessed on 28 January 2021).
- Xu, X. Spatial Distribution Data Set of Annual Vegetation Index (NDVI) in China Data Registration and Publishing System of Data Center of Resources and Environment Science; Chinese Academy of Sciences: Beijing, China, 2018. [Google Scholar] [CrossRef]
- Xu, X. Kilometer Grid Data Set of Spatial Distribution of China′s GDP. Data Registration and Publishing System of Data Center of Resources and Environment Science; Chinese Academy of Sciences: Beijing, China, 2017. [Google Scholar] [CrossRef]
- Crippa, M.; Oreggioni, G.; Guizzardi, D.; Muntean, M.; Schaaf, E.; Lo Vullo, E.; Solazzo, E.; Monforti-Ferrario, F.; Olivier, J.G.; Vignati, E. Fossil CO2 and GHG Emissions of All World Countries; Publication Office of the European Union: Luxemburg, 2019. [Google Scholar]
- Bu, X.; Cui, D.; Dong, S.; Mi, W.; Li, Y.; Li, Z.; Feng, Y. Effects of Wetland Restoration and Conservation Projects on Soil Carbon Sequestration in the Ningxia Basin of the Yellow River in China from 2000 to 2015. Sustainability 2020, 12, 10284. [Google Scholar] [CrossRef]
- Tcvetkov, P.; Cherepovitsyn, A.; Fedoseev, S. The changing role of CO2 in the transition to a circular economy: Review of carbon sequestration projects. Sustainability 2019, 11, 5834. [Google Scholar] [CrossRef]
- Babbar, D.; Areendran, G.; Sahana, M.; Sarma, K.; Raj, K.; Sivadas, A. Assessment and prediction of carbon sequestration using Markov chain and InVEST model in Sariska Tiger Reserve, India. J. Clean. Prod. 2021, 278, 123333. [Google Scholar] [CrossRef]
- Dai, J.; Yu, C.; Zhang, J.; Ning, Z.; Wang, Z.; Cheng, X. Analysis on soil organic carbon storage and the potential for carbon sequestration in the blue economic zone of Shandong peninsula. J. Jilin Univ. 2014, 44, 1659–1668. [Google Scholar] [CrossRef]
- Fang, J.Y.; Yang, Y.H.; Wenhong, M.A.; Mohammat, A.; Shen, H.H. Ecosystem carbon stocks and their changes in China′s grasslands. Sci. China Life Sci. 2010, 53, 757–765. [Google Scholar] [CrossRef]
- Cong, W.; Sun, X. A Study on Carbon Sequestration Capacity Based on GIS and InVEST Model in Rizhao City. Bull. Soil Water Conserv. 2018, 38, 200–205. [Google Scholar] [CrossRef]
- State Owned assets supervision and Administration Commission of Shandong Provincial People’s Government. Linyi Finance Investment Group Uses Photovoltaic Projects to Help Rural Revitalization and Poverty Alleviation. Available online: http://gzw.shandong.gov.cn/articles/ch00045/202002/457972e2-7400-408a-9689-a436bdccdfd9.html (accessed on 28 January 2021).
- De Groot, R.S.; Wilson, M.A.; Boumans, R.M. A typology for the classification, description and valuation of ecosystem functions, goods and services. Ecol. Econ. 2002, 41, 393–408. [Google Scholar] [CrossRef]
- Chen, J.L.; Xu, M.Y.; Su, X.; Gao, J.L. Spatial transfer of regional ecosystem service in Nanjing City. Acta Ecol. Sin. 2014, 34, 5087–5095. [Google Scholar] [CrossRef]
- Converse, P.D. New laws of retail gravitation. J. Mark. 1949, 14, 379–384. [Google Scholar] [CrossRef]
- Palomo, I.; Martín-López, B.; Potschin, M.; Haines-Young, R.; Montes, C. National Parks, buffer zones and surrounding lands: Mapping ecosystem service flows. Ecosyst. Serv. 2013, 4, 104–116. [Google Scholar] [CrossRef]
- Wang, L.; Zheng, H.; Wen, Z.; Liu, L.; Robinson, B.E.; Li, R.; Li, C.; Kong, L. Ecosystem service synergies/trade-offs informing the supply-demand match of ecosystem services: Framework and application. Ecosyst. Serv. 2019, 37, 100939. [Google Scholar] [CrossRef]
- Kroll, F.; Müller, F.; Haase, D.; Fohrer, N. Rural–urban gradient analysis of ecosystem services supply and demand dynamics. Land Use Policy 2012, 29, 521–535. [Google Scholar] [CrossRef]
- Geertsema, W.; Rossing, W.A.; Landis, D.A.; Bianchi, F.J.; Van Rijn, P.C.; Schaminée, J.H.; Tscharntke, T.; Van Der Werf, W. Actionable knowledge for ecological intensification of agriculture. Front. Ecol. Environ. 2016, 14, 209–216. [Google Scholar] [CrossRef]
- Wang, C.; Maclaren, V. Evaluation of economic and social impacts of the sloping land conversion program: A case study in Dunhua County, China. For. Policy Econ. 2012, 14, 50–57. [Google Scholar] [CrossRef]
- Maragno, D.; Gaglio, M.; Robbi, M.; Appiotti, F.; Fano, E.A.; Gissi, E. Fine-scale analysis of urban flooding reduction from green infrastructure: An ecosystem services approach for the management of water flows. Ecol. Model. 2018, 386, 1–10. [Google Scholar] [CrossRef]
- Xie, G.; Liu, J.; Xu, J.; Xiao, Y.; Zhen, L.; Zhang, C.; Wang, Y.; Qin, K.; Gan, S.; Jiang, Y. A spatio-temporal delineation of trans-boundary ecosystem service flows from Inner Mongolia. Environ. Res. Lett. 2019, 14, 65002. [Google Scholar] [CrossRef]
- Yantai Finance Bureau. Yantai City Uses Ecological Compensation Funds to Promote Continuous Improvement of Air Environment. Available online: http://czj.yantai.gov.cn/art/2019/4/25/art_3295_2417423.html (accessed on 25 April 2019).
- Sone, J.S.; Gesualdo, G.C.; Zamboni, P.A.; Vieira, N.O.; Mattos, T.S.; Carvalho, G.A.; Rodrigues, D.B.; Sobrinho, T.A.; Oliveira, P.T.S. Water provisioning improvement through payment for ecosystem services. Sci. Total Environ. 2019, 655, 1197–1206. [Google Scholar] [CrossRef]
Publisher’s Note: MDPI stays neutral with regard to jurisdictional claims in published maps and institutional affiliations. |
© 2021 by the authors. Licensee MDPI, Basel, Switzerland. This article is an open access article distributed under the terms and conditions of the Creative Commons Attribution (CC BY) license (http://creativecommons.org/licenses/by/4.0/).