Abstract
Under the background of rapid urbanization, the study explored the adaptive relationship between urban spatial development and water landscape in different stages in Caidian District, Wuhan in order to reveal the characteristics and influencing factors of water landscape adaptability of urban spatial development and improve urban sustainability aiming at optimizing spatial development and improving water landscape function. Caidian District was seen as a complex adaptive system formed by the interaction between the base layer and the occupation layer. The assessment system of urban spatial development is constructed based on land use data and landscape pattern indices, and the coupling coordination degree model and correlation analysis were used to describe the characteristics of water landscape adaptability of urban spatial development. The results showed that: (1) the adaptation relationship between urban space and water landscape in Caidian District was becoming tense; (2) different spatial systems have unique adaptation cycles to water landscape; (3) the 1000 m buffer is the main area affected by water landscape adaptability of urban spatial development. This study provides a new perspective for the urban adaptability. Finally, improvement suggestions were put forward by three aspects of water landscape structure control, urban development control, and ecological space demarcation.
1. Introduction
With the acceleration of urbanization in China, the spatial development of the urban area is becoming more and more complex. As a mega-city in central China, Wuhan’s outward-oriented urbanization has also affected its outlying urban areas. Caidian District is a typical region in Wuhan, where water resources are densely distributed, forming water networks of lakes and rivers. Consider the feature of water resources, a long-standing model of polder agriculture with Jianghan Plain characteristics has been formed. However, rapid urban expansion and industrial construction are bringing pressure to bear on the conservation of natural landscape resources and the development of traditional agriculture. A series of changes, such as the modernization of agriculture, the adjustment of industrial structure and the improvement of the livability of urban ecology, will affect the spatial development relationship between the urban development of Caidian District and its water landscape. Moreover, the sustainability of Caidian District will enter a new stage. Therefore, we focused on the adaptation process between urban spatial development and water landscape. Based on the idea of complex adaptive system, the study discussed the systematic changes in the water landscape adaptability of urban spatial development and put forward some ideas and opinions for the urban spatial development to promote the sustainability of regional urban space and natural landscape.
The concept of complex adaptive system (CAS) is taken from systems theory. It considers the object of study as a whole area, which is made up of many subsystems or elements, and it is multifarious, dynamic, and open [1,2,3]. The development of the system forms a process of adaptation through learning and accumulation, constantly adjusting itself according to the current information of the environment and possible future conditions [4]. The CAS theory introduces new views and methods for the study of urban spatial development, regarding urban area composed of several subsystems, adaptability among the elements within the subsystems keeps a whole area in a relatively balanced state [5]. In this study, we consider Caidian District to be a complex adaptive system of the interaction between the base layer and the occupation layer [6]. The “adaptive cycle theory” model proposed by C.S. Holling and the layer-cake model proposed by Ian McHarg also provide theoretical guidance for the study of the adaptability of urban development [7,8]. Besides, scholars have used different methods to study the adaptability of urban spatial development; for example, the analysis model of indices of urban development evaluates the adaptability of urban space or society to reflect its complexity, comprehensiveness, and sustainability [9,10]. The coupled coordination degree model is also widely used to reflect the coordination relationship among urban factors. It can reflect the level of coordinated development between different systems at different scales and is often used to assess the interaction between different systems and the capacity for sustainability, which is of great significance to the sustainability of cities [11,12,13].
The research of water landscape as an element of urban spatial complex adaptive system mainly covers three parts: (1) analysis of spatial form and pattern; (2) assessment of adaptive process and capability; (3) strategies for planning and management [14]. The first part mainly includes the analysis of various spatial systems in water dense area through a historical map, which directly reflects the spatial evolution process and characteristics [15,16]. The second part mainly reflects the change in the relationship between the adaptive development of water landscape by summarizing the experience of spatial development pattern and ecological wisdom of water landscape adaptability [17,18,19,20] and evaluating the coupling of ecological service efficiency and spatial form [21,22], and mapping the water demand map according to the present condition [23]. The third part provides the reference and guidance of sustainability method based on modeling urban and rural space with new technology and concept in the last part [24,25,26,27]. Paul proposes integrated urban water management (IUWM) that integrates the management of urban water supply, water cycle, and urban sanitation to achieve sustainable economic, social, and environmental goals [28].
Based on the above research foundation and content, this study aims to describe the adaptation relationship between urban spatial development of Caidian District and water landscape by coupling coordination degree. The contents mainly include: (1) land use and cover change and landscape pattern change data from 1999–2019 were obtained; (2) construct the assessment system of CCD of spatial development and water landscape and assessed CCD; (3) grey relational analysis (GRA) of the CCD of water buffers and the entire region. The above contents reflect the change in coupling coordination degree (CCD) of urban spatial development and water landscape in Caidian District. In order to promote the healthy and sustainability of the urban landscape, we will discuss the spatial change in water landscape adaptability and provide a view for the transformation and development of the urban space under the current urbanization trend and the guidance of the ecological civilization in order to improve the healthy and sustainability of urban landscape.
2. Materials and Methods
2.1. Study Region
Caidian District belongs to Wuhan City in central China. Situated in the western suburbs of Wuhan, it lies on the eastern edge of the Jianghan Plain at the confluence of the Hanjiang River and Yangtze River. The landform of the entire region is a hilly lake–marsh plain with ridge as the main body, with a total area of 1093.57 km2 [29] (Figure 1). The main features of the study region are as follows: (1) Caidian District is an important part of Wuhan’s urban development strategy and has good development potential: it cannot only maintain Jianghan Plain’s traditional forms of agricultural development but also ease the pressure of central urban construction and develop new industries; (2) it has an important ecological location value and is rich in natural landscape resources, especially dense distribution of water resources. There are 57 lakes in the region. Additionally, to the north, east, and south, they are surrounded by the Hanjiang River, Yangtze River, and Tongshun River. Some lakes and rivers are connected to them. It has 57 lakes of various types, which are partly connected with these rivers. As supporting space of Houguan Lake in the urban ecological framework, it plays an important role in protecting and improving the overall ecological pattern of Wuhan. Therefore, it is typical to study water landscape adaptability of Caidian District’s urban spatial development.
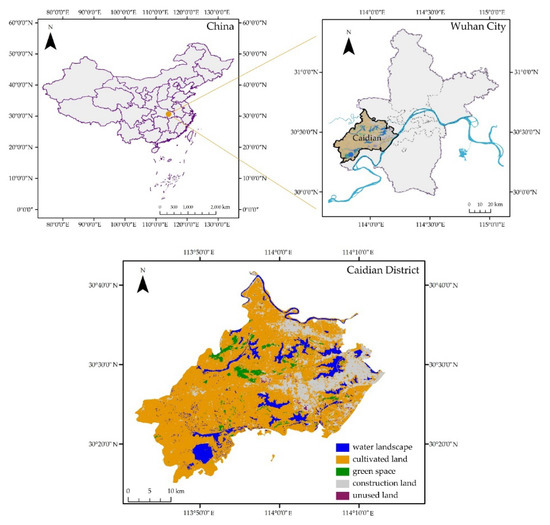
Figure 1.
Location of the study region: Caidian District, Wuhan, China.
2.2. Data Sources and Pre-Processing
2.2.1. Data Sources
The basic data used in the study include remote sensing data and administrative boundary data. Thirty-meter resolution Landsat5 TM images of 27 September 1999, 22 July 2004, and 6 September 2009, and 30 m resolution Landsat8 OLI_TIRS images of 6 October 2014 and 17 August 2019 were selected. Data were available from the United States Geological Survey (https://earthexplorer.usgs.gov/) and Geospatial Data Cloud (http://www.gscloud.cn/). Data were selected based on the principles of similar time, less cloud cover, and complete content of the study region. Data were analyzed in the administrative area and the water buffers. Based on flood control, ecological sensitivity of water and city block scale [30,31,32,33], water buffer was divided into four types: 0–200 m, 200–500 m, 500–1000 m, and 1000–1500 m.
2.2.2. Land Use and Cover Change Analysis
Supervisory classification is the basis of constructing the assessment system of coupling coordination degree (CCD). The classification standards are selected by reference to the land use/cover change (LUCC) classification system. Study region was divided into two kinds of space systems: base layer and occupation layer. The base layer contains cultivated land and green space, and the occupation layer contains construction land and unused land. Figure 2 shows an analysis of land use and cover change in Caidian District, using the supervised classification of remote sensing imagery. The procedure and accuracy are satisfactory. According to the results, the area and proportion of space systems in the entire region and water buffers of Caidian District from 1999–2019 have been calculated.
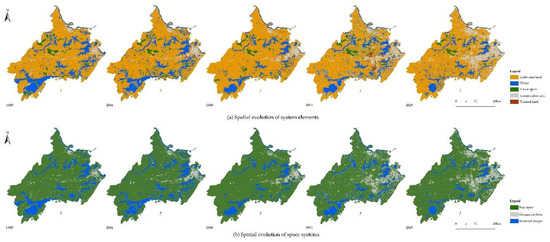
Figure 2.
Analysis result of land use and cover change in Caidian District, (a) spatial evolution of scheme elements, (b) spatial evolution of space systems.
2.2.3. Landscape Pattern Analysis
Landscape pattern analysis reflects changes in landscape structure and influence on ecological functions from a landscape ecology perspective. In order to optimize the assessment system of coupling coordination degree (CCD), landscape pattern change data of Caidian District space system were selected. Six indices were selected to reflect the change in landscape pattern from three aspects: the difference in landscape size and density, the complexity of landscape shape, and the convergence and divergence, including number of patches (NP), patch density (PD), landscape shape index (LSI), landscape fractal dimension index (FRACT), connectance index (CONNECT), and split index (SPLIT). The changes in landscape pattern indices were computed using Fragstats.
2.3. Assessment System Framework
Figure 3 is the framework of the study. According to the content of Section 2.2, the evaluation system is further improved, including index selection and index calculation. Finally, the analysis model is utilized to quantify the landscape adaptability of urban spatial development.
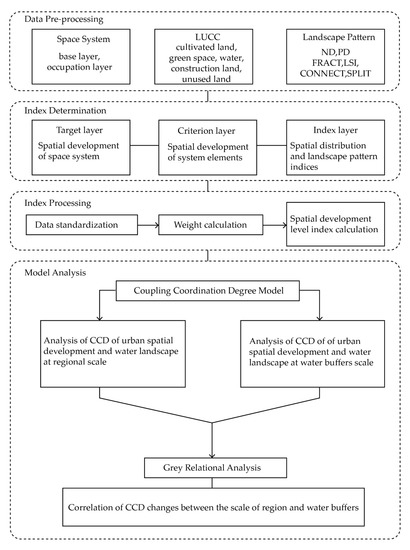
Figure 3.
The study framework.
The assessment system was divided into the assessment of coupling coordination degree (CCD) and the correlation analysis of CCD. The CCD of urban spatial development and water landscape was assessed from two scales of the entire region and water buffers. Table 1 shows the framework of CCD assessment, and Table 2 shows the framework of correlation analysis.

Table 1.
The framework of coupling coordination degree (CCD) assessment.
Table 2.
The framework of correlation analysis.
2.4. Assessment Index Collection and Processing
2.4.1. Index Collection
The indices were selected to reflect the spatial development level of Caidian District, including spatial distribution indices and landscape pattern indices. Depending on the principle of scientific, systematic, and maneuverability, the target layer, criterion layer, and index layer were divided by the analytic hierarchy process (AHP). The data sources of the index layer were the results of pre-processing, and the index attribute was determined as well. Table 3 shows the assessment index system, according to which the entire regional scale and the water buffers scale were evaluated.
Table 3.
The assessment index system.
2.4.2. Index Weighting
The commonly used Delphi method and AHP methods are subjective and affect the accuracy of the results. In order to ensure the objectivity of the study as far as possible, the entropy weight method was selected to calculate the index weight. The method reflects the index weight according to the entropy of the variation degree of each index, reducing the impact of subjective factors [34]. The calculation process is divided into the following steps:
(1) Data standardization:
standardized calculation of positive index:
standardized calculation of inverse index:
standardized calculation of appropriate index:
where is the value, and is the standardized value; i is the number of indices, and j is the year, ranging from 1–5, representing 1999, 2004, 2009, 2014, 2019.
(2) The weight of index j in year i:
(3) Entropy calculation:
where e is the entropy, k = ;
(4) Weight calculation:
where n is the number of indices.
2.5. Assessment Models
2.5.1. Coupling Coordination Degree (CCD) Mode
The concept of coupling is derived from physics and refers to the interaction and influence of two or more systems or forms of motion [35]. It mainly reflects the strength of system interaction, but it cannot reflect the quality of the interaction. Coupling coordination degree (CCD) can further the coordination quality and relationship of the interaction between different systems [36]. CCD of the urban space system and water landscape is calculated as follows:
(1) Calculation of spatial development level index:
spatial development level index of base layer:
spatial development level index of occupation layer:
spatial development level index of water landscape:
where ai, bi, and ci are the weights of index in base layer, occupation layer, and water landscape; they are the index values that describe the characteristics of each index, and they are all dimensionless.
(2) Calculation of CCD:
where Cfh stands for the coupling degree of spatial development between base layer and water landscape; Cgh stands for the coupling degree of spatial development between occupation layer and water landscape:
where Dfh stands for the CCD of spatial development between base layer and water landscape; Dgh stands for the CCD of spatial development between base layer and water landscape; T1 and T2 are the comprehensive assessment indices of CCD development, and α, β, δ are the weights of base layer, occupation layer, and water landscape. It is considered that all subsystems influence each other in this study, so the weights of subsystems are equal, that is, T1 is the sum of Formulas (7) and (9), and T2 is the sum of Formulas (8) and (9).
The calculation of CCD of spatial development of system elements and water landscape is the same as these steps. Based on the value D results, CCD can be divided into 10 coordination levels as showed in Table 4.
Table 4.
Ten coordination levels of CCD.
2.5.2. Correlation Analysis Model of CCD
Based on the previous steps, the assessment of the CCD is to further study the change in coordinate relationship between water buffers of different distances and the entire region. The correlation reflects the impact of the spatial change in water buffers on the entire region and further indicates which spatial change has a greater impact on water landscape adaptability of urban spatial development. Therefore, grey relational analysis (GRA) was chosen as the model of correlation analysis in this study. It is based on the curve geometry shape of each system sequence or factor sequence to judge the similarity between different sequences, and through the quantitative analysis steps to get the degree of grey correlation between the sequences to reflect the level of correlation [37]. GRA is suitable for studying the dynamic process and can clarify the main relations of various factors in the system [38]. The calculation steps are as follows:
(1) Sequence determination and numerical conversion:
The CCD of the regional scale is determined as comparison sequence, and the CCD of the different types of water landscape buffers is determined as reference the sequence. First, the average value and standard deviation of each sequence are calculated, then the original values are subtracted by the average value and divided by the standard deviation. Finally, normalized comparison sequence {y (0)} and the normalized reference sequence {x (i)} are obtained.
(2) Calculate the correlation coefficient:
where ∆max and ∆min are the maximum and the minimum of the absolute difference of all comparison sequences at each time. ρ is the resolution coefficient of which the value is 0.5.
(3) Calculate the correlation degree:
where r0i is the correlation degree between reference sequence and comparison sequence, and N is the amount of data. Then, according to the size of the correlation degree to sort and list the incidence matrix.
3. Results
3.1. Analysis of Coupling Coordination Degree at Regional Scale
Table 5 shows the changes in CCD of urban spatial development and water landscape from 1999–2019. Figure 4 shows the changing trend of CCD of the spatial development of space system, system elements, and water landscape.
Table 5.
CCD of urban spatial development and water landscape in the entire region.
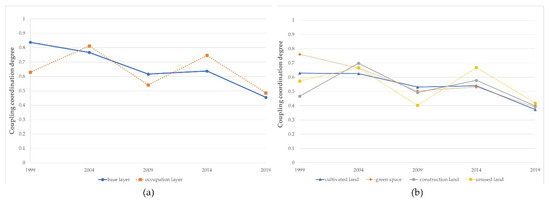
Figure 4.
The changing trend of CCD of urban spatial development and water landscape. (a) The changing trend of CCD of the spatial development of space systems and water landscape, (b) the changing trend of CCD of the spatial development of system elements and water landscape.
For the space system, CCD of the spatial development of base layer and water landscape decreased slowly from 0.837–0.616 in 1999–2009, increased slightly to 0.637 in 2014, then decreased to 0.454 in 2019. The coupling coordination relationship performed well at the beginning of the study but declined continuously with the acceleration of urbanization. The level of CCD has changed from good coordination to near dissonance. CCD of spatial development of occupation layer and water landscape presented the continuous fluctuation change in sharp rise and fall. CCD decreased from 0.629–0.486, and the level decreased from primary coordination to near dissonance. The changing trend reflected the complexity and instability of occupation layer’s spatial development and impacted the coupling coordination relationship with water landscape.
For the system elements, CCD of the spatial development of cultivated land and water landscape reduced from 0.629–0.373, and the level changed from primary coordination to slight dissonance. CCD of the spatial development of green space and water landscape reduced from 0.761–0.39, and the level changed from intermediate coordination to slight dissonance. The change in these two indices increased in 2014, but the overall tendency kept decreasing. CCD of the spatial development of construction land, unused land, and water landscape was unstable. Compared with 1999, CCD of construction land increased in 2004–2014, and the maximum was 0.698 in 2004.
Continuous acceleration of construction land development in 2014–2019 led to the tension of relationship between urban and water. In 2014, the highest CCD of the spatial development of unused land and water landscape was 0.668, but the overall change fluctuated obviously. In the early stage of the study, CCD of the spatial development of occupation layer with its elements and water landscape was mainly due to the low urbanization by the less layout of construction land and unused land, which had a weak spatial relationship with water landscape. The fluctuation of the whole reflected the instability of spatial variation. Unused land accounts for a relatively small proportion in Caidian District. In terms of function, it mainly reserves land for construction land. The change in the layout of unused land was impacted by the development of construction land and, therefore, fluctuated greatly.
The results showed that the change trend of CCD of the spatial development of cultivated land, green space, and water landscape was the same as that of the base layer. The change trend of CCD of the spatial development of construction land, unused land, and water landscape was the same as that of the occupation layer. The coupling coordination relationship was the best in 2004 and the worst in 2019, indicating that the change in quantity, and quality of urban spatial development is the key to the change in CCD. It is a complicated change process, which is influenced by each other and can be discussed in more detail below. In addition, CCD of space systems was preferable to that of system elements, which reflected that system elements emerged a more adaptive and coordinated spatial development relationship under the aggregation effect.
3.2. Analysis of Coupling Coordination Degree at Water Buffers Scale
In order to strengthen the correlation between urban spatial development and water landscape and weaken the impact of external environmental factors on the interaction between urban space and water landscape, CCDs of urban spatial development and water landscape in 0–200, 200–500, 500–1000, and 1000–1500 m water buffers were assessed. Table 6 and Table 7 show the CCD change in space systems and system elements in water buffers from 1999–2019. Figure 5 shows the change trend of CCD of the spatial development of space system, system elements, and water landscape. The correlation between the change in CCD and the change in buffer distance was not obvious in each year. However, compared with the change trend of CCD in each buffer, CCD of the spatial development of space systems and water landscape showed a decreasing trend, and the level changed from primary coordination and barely coordination to near dissonance and slight dissonance. CCDs in three buffers in the range of 0–1000 m had a similar tendency. The CCD in 1000–1500 m buffer has a noticeable difference with other areas.
Table 6.
CCD of the spatial development of space system and water landscape in different buffers.
Table 7.
CCD of the spatial development of systems elements and water landscape in different buffers.
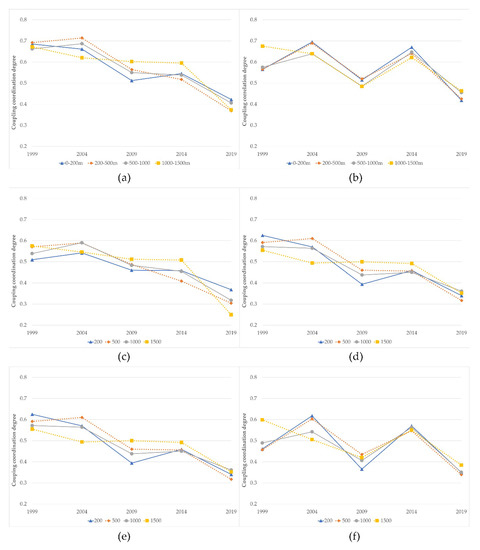
Figure 5.
The changing trend of CCD of urban spatial development and water landscape in different buffers. (a) The changing trend of CCD of the spatial development of space systems and water landscape. (b) The changing trend of CCD of the spatial development of system elements and water landscape. (c) The changing trend of CCD of the spatial development of cultivated land and water landscape. (d) The changing trend of CCD of the spatial development of green space and water landscape. (e) The changing trend of CCD of the spatial development of construction land and water landscape. (f) The changing trend of CCD of the spatial development of unused land and water landscape.
For the spatial development of cultivated land and water landscape, CCDs in 0–200 and 500–1000 m buffers were similar to each other, and CCD in 200–500 m buffer continued to decrease greatly. CCDs in these three buffers increased in 1999–2004 and then declined. The change trend of CCD in 1000–1500 m buffer was the same as that of the base layer in the regional scale. For the spatial development of green space and water landscape, CCD in 0–200 m buffer changed violently and unsteadily, and the trends of 200–500 and 500–1000 m buffer were similar. The decreasing trends in CCDs in these three buffers were obvious in 2004–2009 and 2014–2019. CCD in 1000–1500 m buffer varied greatly, which was the lowest from 1999–2004. The change in 2004–2014 was slight and then decreased obviously.
For the spatial development of construction land and water landscape, CCD in 0–200 m buffer changed slightly from 1999–2014. The index rose to the maximum value of 0.556 from 2009–2014, but it was still barely coordinated. CCDs in 200–500 and 500–1000 m buffers fluctuated, and the change trends were similar. However, the index dropped sharply from 2014–2019 to the minimum value of 0.374, which belonged to a level of slight dissonance. The change trends of CCDs in 200–500 and 500–1000 m buffers were fluctuated and similar. However, before 2014, the change in CCD in 200–500 m was better than that in 500–1000 m, and the reverse was true in 2014–2019. CCD in 1000–1500 m buffer was greater than other areas with the index of 0.530 being reluctant coordination in 1999. It was accompanied by a dramatic change from 2004–2014, with CCD declining to a lower level than in other areas. For the spatial development of unused land and water landscape, CCD in 0–200 m buffer fluctuated the most, which showed that CCD reduced from the highest to the lowest and then returned to the highest from 2004–2014. Its dramatic change was related to the intensity of unused land change. The change trend of CCD in 200–1000 m buffer was like the trend of construction land in the same area, while CCD in 1000–1500 m buffer was decreasing continuously from 1999–2009.
3.3. Correlation Analysis of Coupling Coordination Degree
Table 8 shows the results of GRA of coupling coordination degree between regional scale and water buffer scale.
Table 8.
Grey relational analysis (GRA) results of CCDs in regional scale and water buffer scale. X1, X2, X3, X4 stand for CCDs in 0–200, 200–500, 500–1000, 1000–1500 m buffers. Y1, Y2, Y3, Y4 stand for CCDs of base layer, occupation layer, cultivated land, green space, construction land, and unused land in regional scale.
Compared with the previous results, the changing trend of CCD in 0–1000 m buffers was similar to that of the regional scale, but CCD in 1000–1500 m buffer had no obvious correlation with that of the regional scale. This feature is also illustrated by the sorting of correlation degrees according to the results in Table 8. In addition to CCD of the spatial development of construction land and water landscape, the 1000–1500 m buffer had the lowest correlation degree among all the other comparisons. It showed that the change in CCD of the entire region was less affected by the change in this buffer.
The correlation sorting of CCD of the spatial development of base layer and cultivated land was the same. The correlation degrees of 500–1000 and 0–200 m buffers were in the first and second place, and the indices were similar in the correlation sorting of CCD of the spatial development of green space and water landscape, which reflected that the spatial development of base layer and its system elements in these two buffers had great influence on the entire region. The result of correlation sorting also showed that the spatial development of occupation layer and construction land had the greatest influence on CCD in 200–500 m buffer. Additionally, the correlation between 0–200 m buffer scale and regional scale was the lowest, but CCD of the spatial development of occupation layer and water landscape in the regional scale was influenced by the changes in CCDs in 0–200 and 500–1000 m buffers.
4. Discussion
Base on the analysis results, the influencing factors of water landscape adaptability, and the correlation between adaptability and spatial distribution are further discussed.
Compared with the central urban, the urbanization construction in Caidian District started late and remained at a lower development level. According to the CCD of the spatial development of base layer and water landscape in 1999, the agricultural farming layout had maintained a long-term stable structure with the natural landscape, which suggested a good adaptability of the base layer to the water landscape. However, from 1999–2019, with the acceleration of urbanization and the transformation of the regional industrial structure, in which the proportion of the primary industry decreased from 14.7–11.4%, the secondary industry as the leading industry was adjusted from 51.5–45.5%, and the tertiary industry continued to strengthen from 33.8–43.1% [39,40,41,42,43]; the rising proportion of the secondary industry and the tertiary industry increases the spatial development pressure of the base layer, which leads to the occupation of base layer and fragmentation of the landscape. It also blocks the spatial connection and material circulation between cultivated land, green land, and water landscape, thus making the relationship between the base layer and water landscape tense. At the same time, the pattern of urban construction has been gradually formed, which extends from the inner urban area to the north along Hanyang Avenue and to the west along Dongfeng Avenue [44]. In the aspect of planning policy, the basic ecological control line of Wuhan has been delimited, and the ecological framework of Houguan Lake and other major lakes has been formed [45,46], showing the disorder of urban spatial development restrictions. The increase in CCD in 2004 and 2014 reflects that the spatial development of occupation layer has the potential to adapt to the water landscape and develop the coordination relationship under the control of urban ecological pattern. However, we found that the spatial development of the study region reflects the instability of the adaptability of the water landscape. It shows that the spatial development of the occupation layer is vulnerable to the external environment, such as various planning policies, project construction, social events, and other uncertainties. Under the driving force of these factors, an unstable change in occupation layer affects the interaction with the water landscape and causes some development pressure, which can lead to the continuous adjustment of spatial development and the change in coupling coordination degree.
Grey relational analysis confirmed that there are different regional changes in the interaction of spatial development with water landscape. The higher the correlation degree of water buffer is, the closer the spatial development is on the coupling coordination of water landscape and the greater the impact is on the adaptability. We found that, in the results, CCD of urban spatial development and water landscape within 1000 m buffer has a great influence on the regional scale change. It suggests that the spatial scale of 1000 m away from the water landscape is the main function scope of adaptation between urban space and water landscape. Adaptability and interaction of various space systems and system elements to the water landscape beyond 1000 m are low and not obvious, and they are easily influenced by other external environmental factors [47].
We also found that for different system elements, the range of adaptation to the water landscape also varies. The change in the spatial development of cultivated land and green space in 0–200 and 500–1000 m buffers has great influence on the overall coupling coordination relationship, reflecting that the water landscape adaptability of cultivated land and green space is not only related to the correlation with water landscape, but the better the connectivity is, the better the coupling coordination relationship is. However, the layout and spatial structure of cultivated land and green space in different buffers are also crucial to the improvement of water landscape adaptability. In order to improve the coupling coordination relationship, it is necessary to adjust the land layout and landscape structure of these areas. Han Meyer et al. proposed that a certain free environment or “soft space” should be constructed in the space system, which is called “redundancy”, to improve the interaction between planning, design, management, and adaptive subject [48]. Cultivated land and green space are the most suitable land use types as redundant space, so we can optimize the layout of these two types of system elements in improving coupling coordination degree and water landscape adaptability. The development of construction land in 200–1000 m buffer and the drastic change in unused land in 0–200 m buffer destroy the integrity of the regional ecosystem. Additionally, the closer to water landscape, the more problematic the relationship between urban space and water. Although land expansion is inevitable, the development of water landscape adaptability can be optimized from the inside to improve the spatial structure and landscape quality of the occupation layer, through the thoughts of the complex adaptive system to understand the complexity, openness, and dynamics of regional development, to establish a comprehensive planning framework [49].
In summary, the water landscape adaptability of urban spatial development in Caidian District has the following characteristics:
- −
- CCD of urban spatial development and water landscape in Caidian District is decreasing, which indicates that the relationship between them is becoming tense.
- −
- Different space systems have unique adaptation periods to water landscape. The layout of urban space can be adjusted according to the characteristics of the adaptive cycle of specific system elements.
- −
- A thousand meters is the main range of adaptive adjustment for the coordinated development of urban space and water network landscape. The protection of water network landscape and the regulation of urban spatial development need to focus on the buffer zone within the scope of land use adjustment and improvement.
For the development of the base layer, it is necessary to improve its connection and landscape quality with water network, to form a connected landscape corridor, and to play a better ecological benefit in coordination. For the development of the occupation layer, it requires continued management control over land development. Due to the abstraction of adaptability and the lack of measurement standards, the methods of monitoring, assessment, and learning adaptability are not mature enough at present, which impact its guidance in planning and implementation [50,51,52]. Olazabal et al. assessed the implementation of adaptive planning in several cities around the world and concluded that existing methods and frameworks are not applicable to the need for adaptive governance [53]. Whether the relationship between the future urban spatial development and water landscape in Caidian District will continue to be tense, or whether the coordinated development will be achieved through self-study is a process influenced by many complicated factors. Numerous factors such as climate change, natural disasters, and social development should be included in the discussion of water landscape adaptation as well [54,55].
5. Conclusions
The relationship between urban spatial development and the adaptation of water landscape has changed from passive adaptation to active adaptation, even causing pressure on the maintenance of water landscape structure. The development of the relationship between urban area and water landscape needs to be transformed. The water landscape adaptability of urban spatial development refers to the ability of coordination and symbiosis between urban spatial development and water landscape under the influence of various uncertain factors. The purpose of this study is to provide a new perspective of thinking about the research process and method of this ability. First, the systematization of the spatial system and system elements of the study region is helpful to clarify the interaction of urban interior elements. In the more complicated areas, we can first clarify or sort out the relationship between adaptive subjects before proceeding to the next step. Secondly, the study showed that the coupling coordination model (CCD) can characterize the interaction of various elements in urban space so that we can infer the development state of adaptability by the change in indices. Correlation analysis of CCD can also help us to infer the change trend of adaptability in different space-time evolution. This study process enriches the perspective in the field of adaptability, but we think that in the future, it still will need to be explored how coupling degree or coordination degree can express adaptability more accurately.
To sum up the above conclusions, we make the following strategic advice, hoping to provide help for planners and relevant practitioners in the future construction of water dense areas. In our opinion, future urban spatial development will need to strengthen the water landscape remediation. The improvement and optimization of water system structure is the inevitable choice to achieve the healthy development of the water landscape and the sustainability of urban space [56]. In addition, controlling the expansion of urbanization requires a comprehensive land use planning and management system that can be constructed at the regional strategic level and local action level [57]. In the end, the regional ecological space should be delineated. The water landscape adaptability of urban spatial development is a continuous process, and the analysis and prediction of the process can provide a reference for the delimitation of ecological space. Flexible planning and management of ecological space is then required, and adaptive management methods can be introduced, and a series of flexible participation measures can be carried out through adaptive management [58].
Author Contributions
Conceptualization, M.W. and K.W.; methodology, M.W. and K.W.; formal analysis, K.W.; writing—original draft preparation, M.W. and K.W.; writing—review and editing, M.W.; visualization, K.W.; supervision, M.W. Both authors have read and agreed to the published version of the manuscript.
Funding
This research was funded by the Fundamental Research Funds for the Central Universities, grant number 2662020YLPY013, and China Scholarship Funding, grant number CSC2018.
Institutional Review Board Statement
Not applicable.
Informed Consent Statement
Not applicable.
Data Availability Statement
Not applicable.
Acknowledgments
We would like to express our sincere gratitude to our studio members for their assistance in the study and to the reviewers for their valuable suggestions and comments.
Conflicts of Interest
The authors declare no conflict of interest.
References
- Yu, C. Introduction to Systems Science and Methods; China Renmin University Press (CRUP): Beijing, China, 2006. [Google Scholar]
- Holland, J.H. Hidden Order: How Adaptation Builds Complexity; Basic Books: New York, NY, USA, 1995; p. 29. [Google Scholar]
- Holling, C.S. Understanding the Complexity of Economic, Ecological, and Social Systems. Ecosystems 2001, 4, 390–405. [Google Scholar] [CrossRef]
- Qiu, F.; Tong, L.; Jiang, M. Adaptability assessment of industrial ecological system of mining cities in Northeast China. Geogr. Res. 2011, 30, 243–255. [Google Scholar]
- Xu, J. A Methodology of Wisdom City Planning: Spatial Analysis Models in Perspective of Adaptability; Southeast University Press: Nanjing, China, 2016; pp. 7–13. [Google Scholar]
- Qiu, B. Methods and Principles of Designing Resilient City Based on Complex Adaptive System Theory. Urban Dev. Stud. 2018, 25, 1–3. [Google Scholar]
- Gunderson, L.; Holling, C.S. Panarchy: Understanding Transformations in Human and Natural Systems; Island Press: Washington, DC, USA, 2001; pp. 25–62. [Google Scholar]
- McHarg, I. Design with Nature; American Museum of Natural History: New York, NY, USA, 1969. [Google Scholar]
- Araya-Muñoz, D.; Metzger, M.J.; Stuart, N.; Wilson, A.M.W.; Alvarez, L. Assessing urban adaptive capacity to climate change. Environ. Manag. 2016, 183, 314–324. [Google Scholar] [CrossRef] [PubMed]
- Giacomoni, M.H.; Kanta, L.; Zechman, E.M. Complex Adaptive Systems Approach to Simulate the Sustainability of Water Resources and Urbanization. Water Res. Plan. Man. 2013, 139, 554–564. [Google Scholar] [CrossRef]
- Wang, C.; Tang, N. Spatio-temporal characteristics and evolution of rural production-living-ecological space function coupling coordination in Chongqing Municipality. Geogr. Res. 2018, 37, 1100–1114. [Google Scholar]
- Li, Y.; Li, X.; Li, Q.; Wang, J. Temporal and Spatial Changes in Coupling and Coordinating Degree of New Urbanization and Ecological-Environmental Stress in China. Sustainability 2019, 11, 1171. [Google Scholar] [CrossRef]
- Ji, X.; Wang, K.; Ji, T.; Zhang, Y.; Wang, K. Coupling Analysis of Urban Land Use Benefits: A Case Study of Xiamen City. Land 2020, 9, 155. [Google Scholar] [CrossRef]
- Zhang, J. Cognition and Research Framework of Water Adaptive Landscapes with the Case Study on Mentougou District, Beijing. Landsc. Archit. Front. 2020, 8, 56–72. [Google Scholar]
- Nijhuis, S.; Liang, X.; Cannatella, D. Towards a Landscape-based Regional Design Approach for Adaptive Transformation in Urbanizing Deltas. Landsc. Archit. 2019, 26, 8–22. [Google Scholar] [CrossRef]
- Xiong, L.; Nijhuis, S. Exploring spatial relationships in the Pearl River Delta. In Cities as Spatial and Social Networks; Springer: Cham, Switzerland, 2019; pp. 147–163. [Google Scholar]
- Sun, C.; Nijhuis, S.; Bracken, G. Learning from Agri-Aquaculture for Multiscale Water-Sensitive Design in the Pear River Delta. Landsc. Archit. 2019, 26, 31–44. [Google Scholar] [CrossRef]
- Li, A.; Wang, S.; Yuan, D.; Li, H. Performance characteristics and influence factors of water adaptive landscape in urban and rural under the threat of droughts and floods-the Case study in Jingzhong area. J. Arid Land Resour. Environ. 2018, 32, 183–188. [Google Scholar] [CrossRef]
- Peng, Y. Landscape Analysis of Traditional Villages and Towns Settlement; China Architecture & Building Press: Beijing, China, 1994. [Google Scholar]
- Xiao, Y. The Optimization of Spatial Analysis Model in Complex Urban Conditions. Ph.D. Thesis, Dalian University of Technology, Dalian, China, 2015. [Google Scholar]
- Wang, J.; Liu, B. Restoration of Degraded Water System in the Yangtze River Delta by Effective Provision of Water-Related Ecosystem Services. Chin. Landsc. Archit. 2017, 33, 68–73. [Google Scholar]
- Wang, J.; Chen, S.; Wang, M. How Do Spatial Patterns Impact Regulation of Water-Related Ecosystem Services? Insights from a New Town Development in the Yangtze River Delta, China. Sustainability 2019, 11, 2010. [Google Scholar] [CrossRef]
- Panagopoulos, G.P.; Bathrellos, G.D.; Skilodimou, H.D.; Martsouka, F.A. Mapping Urban Water Demands Using Multi-Criteria Analysis and GIS. Water Resour. Manag. 2017, 26, 1347–1363. [Google Scholar] [CrossRef]
- Du, N.; Tang, W. Analysis on the Spatial Planning Based on the Concept of Water Adaptive City. Mod. Urban Res. 2015, 2, 27–32. [Google Scholar]
- Paul, K.; Semra, A.; Jory, H.; Andrew, W.; David, B.; Stephen, J.; Neil, F.; Renee, B.; Lorilee, M. Integrated urban water management applied to adaptation to climate change. Urban Clim. 2018, 24, 247–263. [Google Scholar] [CrossRef]
- Caidian District Profile Information, Caidian District People’s Government of Wuhan. Available online: http://www.caidian.gov.cn/zwgk/xxgkml/jggk/cdjj/202004/t20200416_1017758.shtml (accessed on 1 May 2020).
- Wang, S. Adaptive Urban-Water Planning Analysis of Mountainous Cities from the Perspective of the Harmony between City and Wate—Based on New Hakka City Planning of Shanghang in Fujian Province. Master’s Thesis, Nanjing University, Nanjing, China, 2014. [Google Scholar]
- Nijhuis, S.; Jauslin, D. Urban landscape infrastructures. Designing operative landscape structures for the built environment. Res. Urban. Ser. 2015, 3, 13–34. [Google Scholar] [CrossRef]
- Meyer, H.; Nijhuis, S.; Pouderoijen, M.; Campanella, R.; Zagare, V.; Dijk, W.V.; Broesi, R.; Marchand, M.; Dieu, P.Q.; Le, T. Urbanized Deltas in Transition; Techne Press: Amsterdam, The Netherlands, 2014. [Google Scholar]
- Shen, Z.; Hou, X.; Li, W.; Aini, G.; Chen, L.; Gong, Y. Impact of landscape pattern at multiple spatial scales on water quality: A case study in a typical urbanised watershed in China. Ecol. Indic. 2015, 48, 417–427. [Google Scholar] [CrossRef]
- Hwang, S.; Lee, S.; Son, J.; Park, G.; Kim, S. Moderating effects of the geometry of reservoirs on the relation between urban land use and water quality. Landsc. Urban Plan. 2007, 82, 175–183. [Google Scholar] [CrossRef]
- Li, K.; Chi, G.; Wang, L.; Xie, Y.; Wang, X.; Fan, Z. Identifying the critical riparian buffer zone with the strongest linkage between landscape characteristics and surface water quality. Ecol. Indic. 2018, 93, 741–752. [Google Scholar] [CrossRef]
- Wang, M.; Duan, L.; Wang, J.; Peng, J.; Zheng, B. Determining the width of lake riparian buffer zones for improving water quality base on adjustment of land use structure. Ecol. Eng. 2020, 158, 106001. [Google Scholar] [CrossRef]
- Hong, H.; Liao, H.; Li, T.; Yang, J.; Xie, D. Analysis of spatio-temporal patterns of rural space function based on entropy value method and Dagum Gini coefficient. Trans. Chin. Soc. Agric. Eng. 2016, 32, 240–248. [Google Scholar]
- Liu, B.; Liu, S. Coupling Analysis between Urban Green Space and Urban Development: A Case Study of Wuxi. Chin. Landsc. Archit. 2010, 26, 14–18. [Google Scholar]
- Xu, D.; Hou, G. The Spatiotemporal Coupling Characteristics of Regional Urbanization and Its Influencing Factors: Taking the Yangtze River Delta as an Example. Sustainability 2019, 11, 822. [Google Scholar] [CrossRef]
- Liu, S.; Cai, H.; Yang, Y.; Cao, Y. Advance in grey incidence analysis modelling. Syst. Eng. Theory Pract. 2013, 33, 2041–2046. [Google Scholar]
- Tang, Q. DPS Data Processing System Experimental Design, Statistical Analysis and Data Mining; Science Press: Beijing, China, 2010; pp. 1075–1085. [Google Scholar]
- National Bureau of Statistics. The main socio-economic indicators of Hubei Province. In China Country Statistical Yearbook; China Statistics Press: Beijing, China, 2000; pp. 526–562. [Google Scholar]
- Yao, C. Appendix Caidian District, Wuhan, 2004 National Economic and Social Development Statistical Bulletin; Caidian Almanac: Wuhan, China, 2005; pp. 219–221. [Google Scholar]
- Yao, C. Appendix Caidian District, Wuhan, 2009 National Economic and Social Development Statistical Bulletin; Caidian Almanac: Wuhan, China, 2010; pp. 235–237. [Google Scholar]
- Yao, C. Appendix Caidian District, Wuhan, 2014 National Economic and Social Development Statistical Bulletin; Caidian Almanac: Wuhan, China, 2015; pp. 309–317. [Google Scholar]
- Statistical Bulletin on the 2019 National Economic and Social Development of Caidian District, Wuhan. Available online: http://www.caidian.gov.cn/zwgk/xxgkml/tjxx/jjsj/202006/t20200612_1376214.shtml (accessed on 24 August 2020).
- Huang, X. The Dynamic Mechanism of Industry of Caidian City Spatial Form, Wuhan. Planners 2015, 31, 236–240. [Google Scholar]
- Luo, B. Exploration and Consideration on Wuhan Basic Ecological Control Line Management System. Urban Dev. Stud. 2018, 25, 43–49. [Google Scholar]
- Xia, W.; Liu, J.; Lu, J.; Chen, M. Exploration on the Management and Control Model of Urban Ecological Spatial Planning: A Case Study of Wuhan Ecological Control Action Planning. Urban Rural Plan. 2018, 2, 113–119. [Google Scholar]
- Zhang, J. Study on the Influence of Chengdu Urban Landscape Pattern from Water System. Ph.D. Thesis, Southwest Jiaotong University, Chengdu, China, 2016. [Google Scholar]
- Meyer, H.; Bregt, A.K.; Dammers, E.; Edelbos, J.; van den Berg, J.; van den Born, G.J.; Broesi, R.; van Buuren, A.; van den Burg, L.; Duijn, M.; et al. New Perspectives for Urbanizing Deltas: A Complex Adaptive Systems Approach to Planning and Design: Integrated Planning and Design in the Delta (IPDD); MUST Publishers: Amsterdam, The Netherlands, 2015; pp. 137–189. [Google Scholar]
- Dammers, E.D.; Bregt, A.K.; Edelenbos, J.; Meyer, H.; Pel, B. Urbanized deltas as complex adaptive systems: Implications for planning and design. Built Environ. 2014, 40, 156–168. Available online: http://www.jstor.org/stable/43296884 (accessed on 10 January 2020). [CrossRef]
- Biesbroek, R.; Berrang-Ford, L.; Ford, J.D.; Tanabe, A.; Austin, S.E.; Lesnikowski, A. Data, concepts and methods for large-n comparative climate change adaptation policy research: A systematic literature review. Wiley Interdiscip. Rev. Clim. Chang. 2018, 9, e548. [Google Scholar] [CrossRef]
- Berrang-Ford, L.; Biesbroek, R.; Ford, J.D.; Lesnikowski, A.; Tanabe, A.; Wang, F.M.; Chen, C.; Hsu, A.; Hellmann, J.J.; Pringle, P. Tracking global climate change adaptation among governments. Nat. Clim. Chang. 2019, 9, 440–449. [Google Scholar] [CrossRef]
- Ford, J.D.; King, D. A framework for examining adaptation readiness. Mitig. Adapt. Strateg. Glob. Chang. 2015, 20, 505–526. [Google Scholar] [CrossRef]
- Olazabal, M.; Ruiz, D.G.M. Adaptation planning in large cities is unlikely to be effective. Landsc. Urban Plan 2021, 206, 103974. [Google Scholar] [CrossRef]
- Eriksen, S.H.; Kelly, P.M. Developing Credible Vulnerability Indicators for Climate Adaptation Policy Assessment. Mitig. Adapt. Strateg. Glob. Chang. 2007, 12, 495–524. [Google Scholar] [CrossRef]
- Jiao, W.; Fuller, A.M.; Xu, S.; Min, Q.; Wu, M.; Rosen, M.A. Socio-Ecological Adaptation of Agricultural Heritage Systems in Modern China: Three Cases in Qingtian County, Zhejiang Province. Sustainability 2016, 8, 1260. [Google Scholar] [CrossRef]
- Wang, M. The Research on Controlling Strategy of Rural Settlement Space in the Area Crisscrossed with Rivers of the Jianghan Plain. In 2016 International Conference on Civil, Structure and Environmental Engineering; Atlantis Press: Paris, France, 2016; pp. 143–146. [Google Scholar] [CrossRef]
- Du, N.; Ottens, H.; Sliuzas, R. Spatial impact of urban expansion on surface water bodies—A case study of Wuhan, China. Landsc. Urban Plan 2010, 94, 175–185. [Google Scholar] [CrossRef]
- Stringer, L.C.; Dougill, A.J.; Fraser, E.; Hubacek, K.; Prell, C.; Reed, M.S. Unpacking “participation” in the adaptive management of social-ecological systems: A critical review. Ecol. Soc. 2006, 11. Available online: http://www.jstor.org/stable/26266023 (accessed on 15 December 2019). [CrossRef]


Publisher’s Note: MDPI stays neutral with regard to jurisdictional claims in published maps and institutional affiliations. |
© 2021 by the authors. Licensee MDPI, Basel, Switzerland. This article is an open access article distributed under the terms and conditions of the Creative Commons Attribution (CC BY) license (http://creativecommons.org/licenses/by/4.0/).