Abstract
With the rapid industrialization and urbanization, suburban areas have been developed to accommodate the sudden demand of the population. However, recent problems such as low fertility and aging induces urban shrinkage by reducing the urban population and the economy in old areas around the suburbs. As urban shrinkage causes inequality among residents in terms of the opportunities to access public services, the enhancement of the accessibility of public services is crucial to achieve inclusive growth. This paper proposes a framework for supplying public services based on the transit-oriented development (TOD) concept with geographic information system (GIS) analysis technique. A total of 24 indices, 4 criteria for 6 public services, are measured and weighted by the entropy method to find vulnerable residential buildings with a poor environment in Jung-nang district, Seoul. With a spatial analysis based on this weight value of residential buildings and the TOD concept, old commercial buildings are selected as candidate buildings for public services. According to the derived results, one candidate building as a public service can improve the environment of 3% to 8% of vulnerable residential buildings. The proposed decision-making methods can provide a valuable reference for selecting the location of public services by computational analysis with GIS.
1. Introduction
Since the industrial revolution, megacities in most developed countries have expanded with urbanization and industrialization, accompanied by an increase in population and economic development in urban areas [1]. Owing to the economic and population growth of megacities, several suburban areas have been developed to accommodate the sudden demand of the population. Thus, suburban areas generally have better infrastructure, environmental conditions, and city operating systems compared with the downtown areas of megacities. Although these suburban areas may control the population density of megacities, they cause important issues regarding the environmental and sustainable aspects of the city. One of the most critical problems of megacities and their suburban areas is urban shrinkage, which denotes a reduction in urban population and the economy in old areas of the megacity around the suburbs [2]. Urban shrinkage can be explained by continuous low fertility and aging and induces the deterioration of residential areas and public services [3].
Urban shrinkage is mainly caused by social (suburbanization, low fertility rate, demographic aging, epidemics, hunger), economic (economic decline), industrial (de-industrialization resulting in deurbanization, de-corporatization, weak innovation systems), environmental (environmental disasters, climate change), and political reasons, along with a continuously low birthrate and suburbanization [4]. Urban shrinkage in certain old cities causes inequality among residents within the city in terms of the opportunities to access local services such as education, health care, and other public services. Recently, international organizations have been actively discussing inclusive growth as an alternative to address economic inequality or social exclusion. As one of several tasks to achieve the goal of inclusive growth or the creation of an inclusive city, emphasis has been placed on the need to enhance the accessibility of public services [5,6,7]. Spatial planning for this inclusion has the potential to innovate by introducing a new spatial form, especially in countries and cities where urbanization has progressed rapidly or indiscriminately. This spatial planning, which considers public service accessibility, can provide a pathway to countries and cities to form an environment that reduces poverty and increases the well-being and equality of communities [6].
Existing urban regeneration projects are undertaken to revitalize the old towns of the entire city and large cities [8]. However, the progress of urban regeneration based on the commercial economy has led to problems such as the occurrence of regional imbalances caused by the zero-sum principle, due to the activation of specific regions. Urban regeneration through large-scale projects cannot meet all the needs of the citizens. In the case of Korea, Seoul has been largely developed and has quantitatively expanded since the 1950s owing to a growth-oriented urban policy [9]; however, the environmental infrastructure has been weakened, and urban decline has occurred. In addition, low birthrate and aging, which are the main causes of urban communalization in developed countries, are also currently occurring in Korea. Currently, Korea has the lowest birth rate in the world (0.98 in 2019), and Seoul, with a birth rate of 0.69, ranks first among the lowest [10]. Korea also entered an aging society in the 2000s and is expected to enter a super-aged society in 2026 [11]. As such, urban shrinkage in Seoul is expected to increase, causing inequality within the megacity and resulting in a decrease in the quality of life of old cities.
Thus, the addition of new functions to a shrinking city has been proposed as a solution for urban regeneration. Moreover, research has been conducted and policies have been developed from various perspectives, such as the analysis of urban shrinkage, the improvement of infrastructure by transit, and public service improvement based on data analysis. Fol and Herrmann analyzed the decline in the urban population and shrink phenomena and emphasized the importance of sustainable urban regeneration rather than typical growth-centered urbanization [2,3]. Großmann emphasized the necessity of research on geographic and spatial planning for solving urban shrinkage and the importance of policy reflection [12]. In addition, urban regeneration methods such as smart growth, new urbanization, people-oriented transportation, various hosing choices, and land management have been proposed as urban regeneration methods to overcome urban shrinkage [13]. Unlike the existing urban redevelopment, which expects many effects within a short time in the process of urban regeneration, the sustainable development of cities takes into account the economic, physical, social, and environmental requirements of the city, leading to the solution of problems through continuous improvement [14]. Lucchi emphasized the importance of a user-centered approach to social architecture in the sustainable development of cities and conducted a study on urban regeneration based on the connection of people, energy, use of resources, and transportation considering socio-ecological factors through the Milan Off-Site Campus [15]. To achieve a successful sustainable urban regeneration, the latter must be centered around people and buildings, which are the most basic elements of a city, and urban regeneration methods that connect humans and buildings are important.
Transit-oriented development (TOD) is a method of infrastructure improvement that is expected to solve urban shrinkage. TOD is a type of urban development technique that reduces car use and promotes sustainable urban growth by developing mixed-use residential and commercial areas within walking distance of public transportation [16]. Public transportation, which serves as a multi-purpose node connecting people and buildings (infrastructure), a key element of a city, plays a very important role in sustainable development, that solves problems through a continuous improvement of the city’s economic, physical, and social dimensions [17]. In addition, through high-density development centered on land use and public transportation, it has become a solution for the sustainable development of cities and has the potential to improve urban form and quality [18]. Recently, TOD has been used as a new urban regeneration method for urban shrinkage, with an emphasis on development density, land-use and infrastructure diversity, and innovative design and customization for various national situations. Existing project case studies show the successful introduction of TOD using QRS Nvivo, Tableau, ArcGIS, etc. [19]. However, the research on practical TOD-based urban regeneration methods is insufficient. Therefore, for sustainable urban regeneration based on TOD, research from the architectural and land management stages is required, which are geographic indicators for urban regeneration, as defined by Hempill [20].
Geographic urban analysis techniques for sustainable urban regeneration were analyzed in a study on urban regeneration utilizing GIS-MCDA, P-GIS, etc., based on a GIS analysis of public infrastructure and green spaces in the case study [21,22,23]. Gullino emphasized the importance of information and communication technology (ICT) in urban regeneration and insisted that GIS in ICT is the core system for urban regeneration for three reasons (sustainability, structure, and flexibility) [24]. Moore-Cherry qualitatively studied the convergence of GIS with the help of stakeholder decision-making in the urban regeneration process using the visual representation of GIS [25]. Lee conducted a GIS analysis of Gwangju based on population movement and public land prices of buildings and focused on the direction of urban regeneration according to regional characteristics [26]. In addition, the Urban Regeneration Project Planning Group of Korea conducted a city analysis by apprehending public service facilities into cells (200 m × 200 m) based on population data represented by location. As mentioned above, many studies on urban analysis for urban regeneration using GIS have been conducted; however, existing studies conducted urban cell or region/district unit analysis when GIS analysis was performed in common. However, grid-type urban analysis, such as urban cell and regional/district GIS analysis, makes it difficult to perform detailed resident-centered analysis because it uses a macroscopic unit. Thus, it is necessary to microscopically analyze the detailed stages of buildings, which are classified as the most basic items of urban regeneration.
This study aims at sustainable urban regeneration in declining cities by establishing a transit-oriented development (TOD)-based living infrastructure provision framework for the building sector with the geographic information system (GIS) analysis technique. This method identifies residential buildings that are in the blind spot of public services and that require maintenance and improvement in terms of the living environment. To improve the living environment of such residential buildings, this study assumes that aged commercial buildings can be regenerated as public services to improve the environments of deteriorated residential areas. This enables the initial decision of the supply of public services in the process of urban regeneration of areas where land is saturated and cannot accommodate new buildings.
2. Research Background
2.1. The Study Region
Seoul is one of the major cities in the world, with a history of over 600 years [27]. It has an area of 605 km and 25 districts [28]. Since the 1960s, Seoul has experienced rapid economic growth. Seoul offers its 10 million inhabitants a relatively higher quality of public services, including education, health, and public transport, than other megacities in developed countries. These services provide a strong foundation for inclusive growth for all residents. However, this rapid growth has brought about problems related to urbanization and industrialization [29]. The city faces the problem of inequality, and nearly half of the population is living below the poverty line. Numerous pressing challenges remain in old regions not selected for development, particularly for certain social groups that live in poverty. This low-income group, seniors, and migrants are more likely to live in low-quality housing and the surrounding environment [30].
In countries like Korea, as industrial development took place in a very short period, the process of shrinking occurred exceptionally fast [31]. Recently, Seoul has experienced a rapid decline and aging in its population. The population of Seoul, which is a megacity with more than 10 million people, has decreased over 10 years from 1,031,300 to 972,900 [32]. The percentage of people over the age of 65 has increased nearly three times from 5.4% in 2000 to 14.9% in 2019 [28].
In addition, traffic congestion is one of the major problems that Seoul faces. This causes massive CO2 emissions and a decrease in the quality of life. Seoul’s transportation is operated by the Seoul Metropolis Area (SMA), which includes the regions of Seoul, Gyeonggi, and Incheon [33]. In SMA, 10.5 million vehicles are registered—3.1 million in Seoul, 1.6 million in Incheon, and 5.8 million in Gyeonggi. The land areas of Seoul, Incheon, and Gyeonggi are 605 km, 1063 km, and 10188 km, respectively. SMA accounts for 50% of the population of South Korea and 44% of registered vehicles, but it accounts for only 11.8% of the country’s land [32].
This study takes one of the 25 districts in Seoul as an example to explain the method in detail. We selected the Jungnang-gu district, one of the most aged districts in Seoul. Jungnang-gu is located on the outskirts of the northeastern end of Seoul (Figure 1) and has an area of 18.50 km2; moreover, it has 16 sub-regional administrative areas. The percentage of buildings over 20 years accounts for 80% of all buildings, and 43% are over 30 years old. The population of Jungnang-gu has decreased from 427,964 in 2010 to 397,015 in 2019, with those aged 65 or older accounting for about 16% of the total population [34].
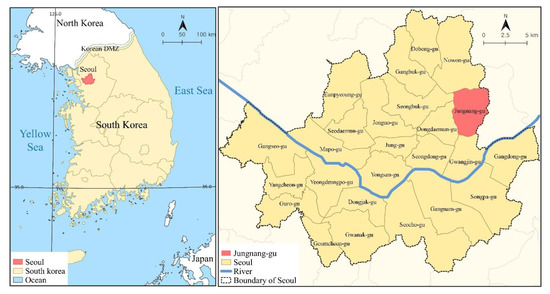
Figure 1.
Location of Jungnang-gu in Seoul.
2.2. Data
In this study, we used vector data with spatial information of building types, built year, parking lots, bus stops, and rail stations in Seoul. Spatial information of building types, built year, parking lots, and parks are represented by data in the polygon format, whereas bus stops, subway, and rail stations are represented by data in the point format. Building type information includes data from the register of the building and provides the purpose for which the building is being used and the location. It also provides information regarding the principal usage and occupied area of the building. The occupied area is calculated by measuring the floor information of the building register and the ratio of the occupied area and by extracting the largest area as the representative occupied area of the building. The built year information provides the elapsed years from the date of the building register’s approval and the location of the building. Building types, built year, parking lot, and park information come from the National Spatial Data Infrastructure Portal (NSDI) [35]. Bus stops and rail stations indicate the locations of transit centers in the form of points. Spatial information regarding bus stops and subway in Seoul is provided by TOPIS [36]. We used QGIS 3.8.3-Zanzibar to create the format of the shp file and conducted the study using various analysis tools embedded in QGIS and coding via a Python plug-in called pyQGIS [37].
2.3. Research Criteria for Supplying Public Service
Before setting the research criteria, three assumptions must be considered based on the role of buildings that affect urban areas in terms of the key issues of TOD and urban regeneration. First, local services should be located around transit centers, such as rail stations and bus stations, based on the concept of TOD and to achieve high-density development. In addition, the areas in which local services are located around transit centers should be within walking distance to provide a pedestrian-friendly urban environment. Second, residential buildings cannot change their usage. Third, commercial buildings can change their usage or add various other forms of usage. To create a mix-used land environment, it is recommended that commercial buildings be used for multi-functional purposes. However, it is not easy to change the usage of residential buildings. We assume that the purpose of residential buildings populated by people cannot be tampered with.
In this study, the criteria for determining residential buildings were selected to judge the urgency of supplying public services or improving the surrounding environment. Criteria that can be generalized and applied to 25 districts of Seoul in the initial decision-making stage were selected. In addition, the criteria for commercial buildings were selected by identifying factors to consider when supplying public services in deteriorated residential areas.
2.3.1. Criteria to Define Vulnerable Residential Buildings
Accessibility to Public Services
The accessibility of public services is a key pillar of inclusive growth in cities. Improved spatial connection establishes a link between land use and accessibility, eliminates or reduces the imbalances between residential and working areas, and reduces the gap between slums and consolidated neighborhoods. It facilitates the access to areas in which job opportunities, equipment, and public services are located, thereby limiting territorial inequality [38].
A list of the basic services and the national minimum standard for accessibility is suggested by the Ministry of Land, Infrastructure, and Transport in Korea (MOLIT). It calls those basic services/facilities “public services” (Table 1). We estimated the accessibility of public services by measuring the distance to each public service from residential buildings.

Table 1.
Urban code for the minimum accessibility distance between residential buildings and public services [39].
Built Year
Building performance continues to deteriorate with time once the building begins to be used and is affected by differing conditions such as climate, use, and the quality of the building itself [1]. Several studies regard building age as an important indicator of the deterioration of buildings and their components [40,41,42]. The performance level of the building decreases over time, while the supplied performance level increases. “Overperformance” is a period when the supplied performance level is higher than the required performance level. This overperformance period becomes the life span of the building (Figure 2). The building age must be measured to examine how close the building is to its life span. This serves as an important indicator of which areas are underdeveloped.
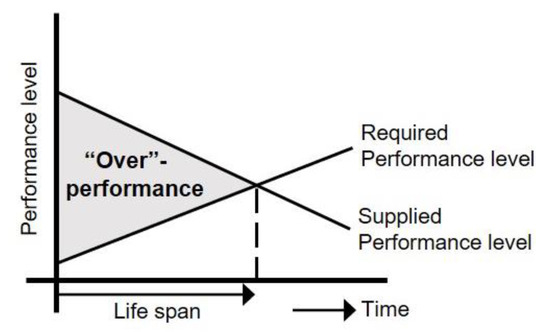
Figure 2.
“Over”-performances as a part of balancing supply and demand [40].
Accessibility to Transit
In TOD planning, estimating transit accessibility is necessary for pedestrian-friendly urban areas [43,44,45]. Subway/rail stations and bus stops are considered as transit centers in this study. In this study, based on previous research in Seoul, we estimated the walking distance of the subway/rail station to be 500 m [46] and that for bus stops to be 400 m [47].
In addition, accessibility to public transportation means that even if there is a lack of infrastructure around it currently, the possibility of using public transportation to go to other local areas and using infrastructure facilities around them exists. Therefore, poor accessibility to public transportation can be interpreted as a bad possibility for the potential availability of infrastructure facilities in other local areas. The selected research criteria considered for each type of infrastructure are given in Table 2.

Table 2.
Research criteria for residential areas.
2.3.2. Criteria for Remodeling Commercial Infrastructure as a New Public Service
Commercial buildings are considered as buildings capable of supplying public services to improve the environment of residential buildings. Building age is also used for commercial buildings to identify buildings that can be regenerated. In Korea, a building can be repaired or rebuilt once it is defined as a deteriorated building [48]. The Korean government defines deteriorated buildings as buildings that have been in use more than 2–30 years [48]. In this study, deteriorated commercial buildings are buildings that have the possibility of regeneration.
When selecting commercial buildings that are regenerated as public services, it is necessary to consider the circumstances of the surrounding residential buildings that use these public services. Based on the weights of residential buildings allocated in the previous process, higher weights are assigned to commercial buildings that include the most vulnerable commercial services. Furthermore, according to the TOD concept, public services should be available within walking distance of the transit center (Figure 3). There is also the possibility that several candidates for public services will overlap in a commercial building. In preparation for this situation, this study sets priorities among public services. A priority is calculated by comparing the current supply situation of a particular infrastructure between 25 autonomous districts in Seoul and each infrastructure within one autonomous district.
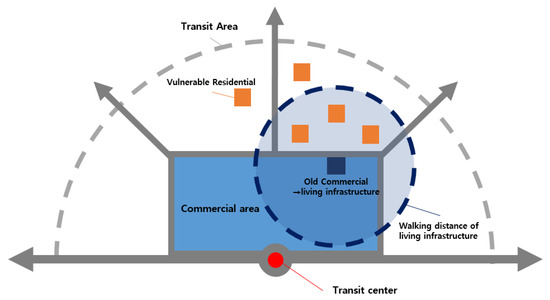
Figure 3.
Concept of supplying public services based on research criteria.
3. Methodology
3.1. Approach for Estimating the Vulnerability of Residential Buildings and Selecting the Potential for Remodeling Commercial Buildings
The GIS-MCDA process is mainly conducted through the utilization of geographical data and a subjective process that reflects the preference of the decision-maker [49]. In recent years, many previous studies have been conducted using a subjective method called analytic hierarchy process (AHP) [50,51]. They also suggested a combination of objective and subjective methods to give a more accurate weight in the GIS analysis, such as AHP-Entropy [52,53]. However, many real-world decisions are uncertain because they involve some unknown variables of decision-making by human judgment [54]. This study uses an objective method that computes the weight factor only by using a quantitative measure of geographical data to minimize the uncertainties of subjective judgment.
For residential buildings, Shannon’s entropy method is used to calculate the relative difference in the index value of buildings in the district, which is the quantified value of each criterion corresponding to a building, to measure how vulnerable the building is for each criterion. If a certain building has a higher index value than other buildings, a higher weight is calculated. Then, the value of the criterion can be measured by multiplying the index value by the weight value. In addition, the summation of the criterion value of residential buildings can generate vulnerability maps after normalizing and becomes an indicator to determine the criterion value of a commercial building. It can calculate how many residential buildings have a high value of weight around a commercial building. Then, a commercial building that includes the highest criterion value of a residential building is selected as a suitable building to provide public services. This process is applied to each public service. If the selected commercial building has the possibility of supplying more than one public service, the weight is also assigned to eight public services. To calculate the weight of public services, we investigated residential buildings that do not satisfy the minimum standard of accessibility to the eight public services, and this approach was applied to 25 districts in Seoul. The value was represented by the number of residential buildings that lack public services for each infrastructure type and district. Simpson’s index was then used to assign priority to each public service (Figure 4).
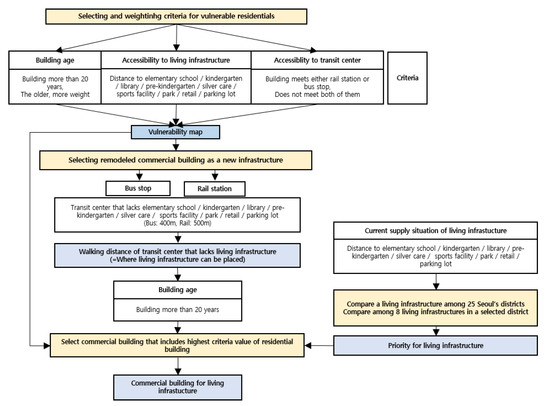
Figure 4.
Flow chart of this study.
3.2. Weighting Criteria for Vulnerable Residential Buildings
This study highlights the importance of criteria by measuring the relative difference of index values among buildings in a district. The value is compared by applying the criteria to whole buildings in the district and quantifying the value of each building. To obtain this value, we measured the Euclidean distance of the residential buildings selected from the criteria to the corresponding public service. If a building has a higher distance, a higher weight is given. Then, buildings that are older than 20 years after the approval date of use are separated and marked to determine the deteriorated residential buildings. Among the buildings aged more than 20 years, a higher weight is assigned to older buildings. To investigate the accessibility to transit centers from residential buildings, residential buildings that are not within walking distance of public transportation are identified. These residential buildings are regarded as blind spots of public transportation, and the distance to public transportation is measured. In addition, for a longer distance, a higher weight is given.
As a method for calculating weight, Shannon’s entropy has been applied to this study. The concept of “entropy” is originally derived from the principle of thermodynamics, which Shannon later introduced into information theory [55]. Entropy means that everything in the universe changes from an ordered state to a disordered state over time and denotes the measurement of this change, defined as the degree of disorder [56]. In information theory, entropy can predict the trend of systems by quantitatively measuring the imbalances and uncertainties. While determining weights, entropy can be used to analyze the difference between the index values. If the value of a certain criterion differs clearly among the evaluation objects, it is judged that the criteria have a higher importance than others in the decision-making evaluation [49].
To apply this method, the alternative-index matrix is constructed using district data and corresponding feature classes, as shown in Equation (1):
where is the index value of n criteria for m districts. If the index values are not the same in terms of their scales and units, standardization must be performed using Equation (3) to eliminate the anomalies between the criteria.
The probability density function is given as follows:
The entropy value can be calculated as follows:
where , which is an entropy constant, is given as follows:
where is a weight.
3.3. Selecting Remodeled Commercial Building as a New Infrastructure
To find a commercial building that can accommodate public services, the first step is to find the location where the public service can be placed. In this step, we investigated transit centers that lack public services. In the first step, the radius of walking distance of the transit center is expressed, and whether it overlaps with the public service is checked. Thus, transit centers that lack public services can be identified, and public services can be located at their walking distances. Next, a layer is created by interpolating the radius of the walking distance of the transit center that lacks public services, and a map of commercial buildings is developed. To select a deteriorated building that requires regeneration, the criteria of building age are also applied to commercial buildings. Deteriorated commercial buildings within the walking sphere of the transit center are buildings that can be regenerated and can accommodate public services for residential buildings.
Then, the number of residential buildings with a high weight around the commercial building is investigated (Figure 5). Based on the weight values of each residential building, the sum of the weights of the residential buildings located within the radius of the commercial building is obtained. Here, the radius refers to the minimum standard corresponding to each infrastructure. Then, a commercial building that includes the highest weight values of a residential building is selected as a suitable building to provide public services. This process is performed separately for each public service.
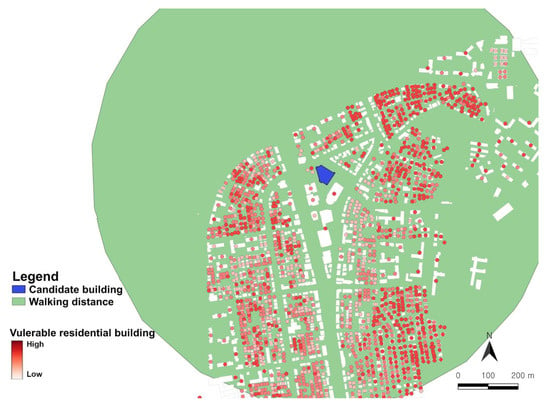
Figure 5.
Investigating the sum of criterion values of residential buildings that commercial buildings include.
Finally, the commercial buildings selected as candidate buildings for each infrastructure are integrated into one layer. If a building overlaps with multiple public service candidates, a more necessary public service must be provided in the district. In addition, the order of the decision-making process needs to be determined among public services. Thus, the number of residential buildings with poor accessibility for each public service is measured for 25 districts in Seoul, and the priority of supplying public services is set through comparison among districts for each public service and among public services within the selected district. This measurement was quantified using the Simpson index.
Simpson Index Method
A diversity index is a key tool for analyzing community statistics and characterizing them as quantitative indicators [57]. The measure of the diversity index reflects how many different types of data are distributed in a dataset and can simultaneously consider the phylogenetic relationships, such as richness, divergence, or evenness, among the individuals in those types [58]. Numerous diversity indices exist that can be used to determine the richness, divergence, or evenness of diverse communities, such as Shannon and Simpson indices [55,58]. We used Simpson’s dominance index, which determines how much a value is dominant over other values within a dataset. In addition, the Shannon index was used to analyze the difference between the values of each index.
Simpson’s dominance index is widely used for computing richness. The measure of Simpson’s dominance index equals the probability that two entities randomly extracted from a dataset are of the same type [59]. Thus, Simpson’s diversity index used here indicates the relative importance of components in the decision-making process.
To apply the method, the district-index matrix is constructed using the number of m districts for n feature classes:
For a comparison of the first group, each column is separated from the district-index matrix. Here, the k-th column represents a certain index value of the districts:
If the index values are not the same in terms of their scales and units, standardization must be performed to eliminate anomalies between criteria. The probability density function () is calculated as follows:
The Simpson’s dominance index can be calculated as follows:
To estimate the relative dominance of the index value of a certain district over another, each probability is divided by Equation (13).
Each column goes through this process, , in the l-th district. Then, the entropy values of the l-th district are collected as follows:
For the second group, the l-th district is selected from matrix (1).
The Simpson’s dominance index can be calculated as follows:
To estimate the relative dominance of the value of a certain index over another, each probability is divided by Equation (17).
Then, Simpson’s dominance index of indices in the l-th district is collected as follows:
The final weights are calculated using Equation (20).
where is a weight of the criteria.
4. Result
In this study, the data used in the entropy method were collected by analyzing and quantifying GIS spatial information. This was implemented using the Jupiter Notebook software. The entropy analysis results for all influencing factors are shown in Table 3.

Table 3.
Results of entropy analysis of all influencing factors.
Multiplying the weight value by the normalized index value gives the criterion value, and its summation value for each building can be used to generate maps of vulnerable residential buildings for each public service (Figure 6). The summation of the criterion value is also normalized to the scale 0–1 using Equation (3). This value indicates how vulnerable the residential buildings are in accordance with the criteria set in this study.
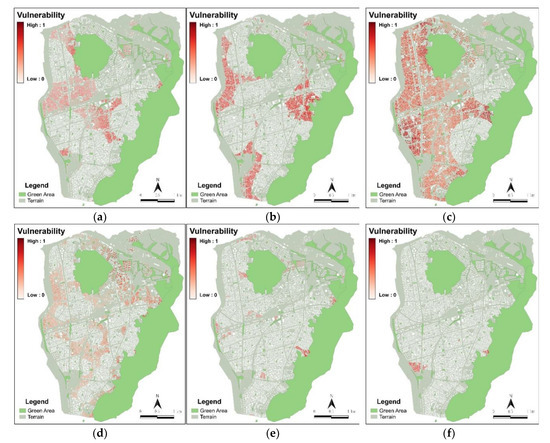
Figure 6.
Vulnerability map of residential buildings in Jungnang district: (a) elementary school, (b) kindergarten, (c) library, (d) pre-kindergarten, (e) social welfare, and (f) sports.
In this study, a commercial building had to be prioritized to prepare multiple infrastructure candidates. Simpson’s index can be used to set priorities among infrastructure. A higher ranking means that a particular infrastructure has a small number compared to other regions and compared to the number of other infrastructures within the same region. The results show that the number of libraries is the lowest among all public services in the district (Table 4).

Table 4.
Priority for public services estimated using Simpson’s index for Jungnang district.
Using the vulnerability value maps of residential buildings, the final suitability map of commercial buildings candidate for public services was drawn, as shown in Figure 7. The higher suitability values of commercial buildings indicate that they cover a higher number of residential buildings that lack public services, which means that commercial buildings have a greater possibility of being candidates for supplying public services. The final map was classified into five categories—very suitable, suitable, moderate, unsuitable, and very unsuitable—using a natural breaks classification. The rate of five categories for each public service was measured to select suitable candidate buildings. The number of each category is shown in Figure 8.
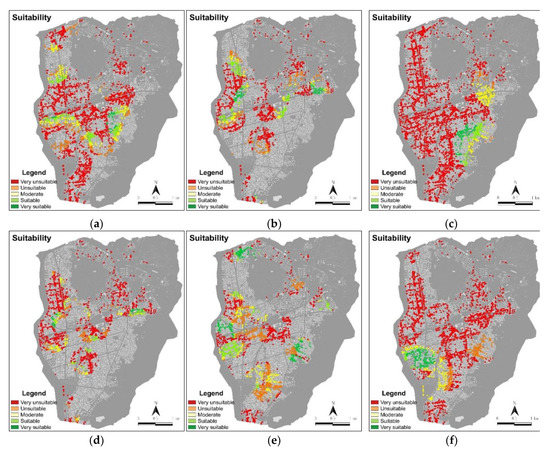
Figure 7.
Suitability map of residential buildings in Jungnang district: (a) elementary school, (b) kindergarten, (c) library, (d) pre-kindergarten, (e) social welfare, and (f) sports.
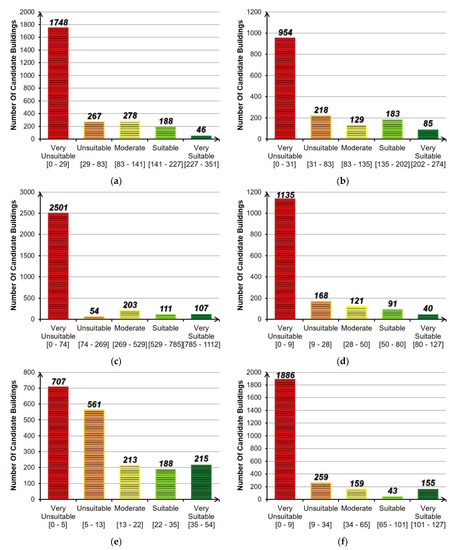
Figure 8.
Histogram of the calculated suitability map showing the relative areas for each suitability class: (a) elementary school, (b) kindergarten, (c) library, (d) pre-kindergarten, (e) social welfare, and (f) sports.
Next, results were obtained by generating a layer of very suitable candidates among commercial buildings for each public service. If the decision-maker wants to narrow down the candidate building, a natural break can be applied among very suitable buildings for each infrastructure. A total of 17 commercial buildings were selected as the final candidates for public services (Table 5). This table shows the candidates for each public service, the number of residential buildings that the candidate building covers, and the percentage of diminution of blind spots of public services. Each program for public service has candidate buildings, and a building number is assigned to each candidate building. The number of residential buildings shows the number of vulnerable residential buildings that the candidate buildings cover without consideration of the weight value. When candidate buildings are supplied, the environment of vulnerable residential areas till the area within walking radius is improved. The percentage of diminution of vulnerable residential buildings shows the ratio of improved residential buildings to the overall vulnerable residential buildings. The number of residential buildings that a candidate building covers with consideration of the weight value is represented as the summation of the weight value. According to the summation of the weight value, the priority of the candidate buildings is assigned. The order of the decision-making process is conducted by the priority of each infrastructure.

Table 5.
Commercial buildings selected as the final candidates of public service.
5. Conclusions and Discussion
Urban regeneration is the important task of preventing urban shrinkage and improving infrastructure. Although previous researches using TOD focus only on living environment with residential buildings, this research broadens the range of regeneration, including aged commercial buildings to improve the environments of entire building areas. Specifically, this research applies an objective method, computing the weight factor with a quantitative measure of geographical data to minimize the uncertainties derived from subjective judgment. There are other regions near Seoul, like Incheon and Gyeong-gido, which have been developed almost at the same pace as Seoul, and with similar problems of urban planning. This research might provide those regions with a sustainable redevelopment solution involving commercial building.
As the result of calculating weights with using the Entropy method, it is found that the distances between the subway and each infrastructure are the most affected. In other words, if access to living infrastructure is poor but public transportation is less accessible, there are fewer opportunities to provide life infrastructure. Thus, this can be interpreted as meaning that living infrastructure should be supplied mainly in this area.
As the distance to the library was a bigger factor than the distance to the subway, this means that the library’s infrastructure is very scarce. This result can also be confirmed in the comparison results with other districts using the Simpson method, where the library is the infrastructure which is most supplied.
After applying the weights to all residential buildings, building candidates are selected from the range of 1 to 4 by selecting most vulnerable residential buildings with using Natural Break. If living infrastructure is supplied, at least 3% to 8% of vulnerable residential buildings could be substituted.
Although, this research has not considered social-economic factors like population densities, economic analysis, and preferences of the members of society, there is room for qualitive analysis considering social-economic factors in early-stage decision making and the improvement of organizational integration with a systematic database. Moreover, using the GIS multi-criteria decision analysis (MCDA) method, more potential environmental issues of urbanizations could be considered.
Author Contributions
Conceptualization, J.S.C. and J.H.O.; methodology, J.S.C. and D.L.; software, J.H.O. and J.S.C.; investigation, C.H.C., J.H.O., and J.S.C.; writing—original draft preparation, J.S.C., C.H.C., and D.L.; writing—review and editing, J.S.C., C.H.C., D.L., Y.T.C., and J.-W.J. All authors have read and agreed to the published version of the manuscript.
Funding
This research received no external funding.
Institutional Review Board Statement
Not applicable.
Informed Consent Statement
Not applicable.
Data Availability Statement
Data available in a publicly accessible repository. The data presented in this study are openly available in [35,36,37].
Acknowledgments
In this section you can acknowledge any support given which is not covered by the author contribution or funding sections. This may include administrative and technical support, or donations in kind (e.g., materials used for experiments).
Conflicts of Interest
The authors declare no conflict of interest.
References
- Mumford, L. The City in History: Its Origins, Its Transformations, and Its Prospects; Houghton Mifflin Harcourt: Boston, MA, USA, 1961; Volume 67. [Google Scholar]
- Fol, S.; Cunningham-Sabot, E. Urban decline and shrinking cities: A critical assessment of approaches to urban shrinkage. Ann. Géogr. 2010, 4, 359–383. [Google Scholar] [CrossRef]
- Herrmann, D.L.; Shuster, W.D.; Mayer, A.L.; Garmestani, A.S. Sustainability for Shrinking Cities. Sustainability 2016, 8, 911. [Google Scholar] [CrossRef]
- Lima, M.F.; Eischeid, M.R. Shrinking cities: Rethinking landscape in depopulating urban contexts. Landsc. Res. 2017, 42, 691–698. [Google Scholar] [CrossRef]
- Organisation for Economic Co-operation and Development. All on Board: Making Inclusive Growth Happen; Organisation for Economic Co-operation and Development: Paris, France, 2014. [Google Scholar]
- UN Habitat. Habitat III Issue Paper 1—Inclusive Cities; UN Habitat: New York, NY, USA, 2015. [Google Scholar]
- Hanson, J. The inclusive city: Delivering a more accessible urban environment through inclusive design. In Proceedings of the RICS Cobra International Construction Conference: Responding to change, York, UK, 7–8 September 2004. [Google Scholar]
- Lee, B.D.; Shim, J.S. A study on regeneration of derelict urban areas throughout resident’s participation: Focusing on the comparison of case studies from Japan, England and the US. J. Korean Cadastre Inf. Assoc. 2012, 14, 183–206. [Google Scholar]
- Shim, S.H.; Koo, J.H. A Study on the Integrated Evaluation Indexes and Weights in View of Urban Regeneration and Industrial Support of Urban Industry Concentrated Area–Focused on the Urban Regeneration Project in Seongsu-dong, Seoul. J. Urban Des. Inst. Korea Urban Des. 2019, 20, 89–100. [Google Scholar] [CrossRef]
- KOSIS. Available online: http://kosis.kr/statHtml/statHtml.do?orgId=101&tblId=DT_1YL20621&conn_path=I3 (accessed on 20 January 2020).
- Jo, H.Y.; Kim, J.S. Elderly poverty and Korean politics in an aging society. J. Democr. Soc. Policy Res. 2016, 30, 11–48. [Google Scholar]
- Großmann, K.; Bontje, M.; Haase, A.; Mykhnenko, V. Shrinking cities: Notes for the further research agenda. Cities 2013, 35, 221–225. [Google Scholar] [CrossRef]
- Dieleman, F.; Wegener, M. Compact city and urban sprawl. Built Environ. 2004, 30, 308–323. [Google Scholar] [CrossRef]
- Roberts, P. The evolution, definition and purpose of urban regeneration. In Urban Regeneration; SAGE Publications Ltd.: London, UK, 2000; pp. 9–36. [Google Scholar]
- Lucchi, E.; Delera, A.C. Enhancing the Historic Public Social Housing through a User-Centered Design-Driven Approach. Buildings 2020, 10, 159. [Google Scholar] [CrossRef]
- Cervero, R. Transit-Oriented Development in The United States: Experiences, Challenges, and Prospects; Transportation Research Board: Washington, DC, USA, 2004; Volume 102. [Google Scholar]
- Al-Harami, A.; Furlan, R. Qatar National Museum-Transit oriented development: The masterplan for the urban regeneration of a ‘green TOD’. J. Urban Manag. 2020, 9, 115–136. [Google Scholar] [CrossRef]
- Kong, X.; Xia, F.; Ma, K.; Li, J.; Yang, Q. Discovering Transit-Oriented Development Regions of Megacities Using Heterogeneous Urban Data. IEEE Trans. Comput. Soc. Syst. 2019, 6, 943–955. [Google Scholar] [CrossRef]
- Mafame, T. Transit-Oriented Development (TOD) as a Facilitator for Urban Development Integration: Case Study: Du Toit Train Station Precinct, Stellenbosch. Doctoral Dissertation, Stellenbosch University, Stellenbosch, South Africa, 2017. [Google Scholar]
- Hemphill, L.; Berry, J.; McGreal, S. An indicator-based approach to measuring sustainable urban regeneration performance: Part 1, conceptual foundations and methodological framework. Urban Stud. 2004, 41, 725–755. [Google Scholar] [CrossRef]
- Dogru, A.O.; Kahraman, A.; Seker, D.Z.; Sivri, N. GIS based evaluation of social determinants of children’s health in Turkey: Case study of Istanbul. Environ. Res. 2017, 179, 108753. [Google Scholar] [CrossRef] [PubMed]
- Cinderby, S. How to reach the ‘hard-to-reach’: The development of Participatory Geographic Information Systems (P-GIS) for inclusive urban design in UK cities. Area 2010, 42, 239–251. [Google Scholar] [CrossRef]
- Noor, N.M.; Asmawi, M.Z.; Abdullah, A. Sustainable Urban Regeneration: GIS and Hedonic Pricing Method in determining the value of green space in housing area. Procedia Soc. Behav. Sci. 2015, 170, 669–679. [Google Scholar] [CrossRef]
- Gullino, S. Urban regeneration and democratization of information access: CitiStat experience in Baltimore. J. Environ. Manag. 2009, 90, 2012–2019. [Google Scholar] [CrossRef]
- Moore-Cherry, N.; Crossa, V.; O’Donnell, G. Investigating urban transformations: GIS, map-elicitation and the role of the state in regeneration. Urban Stud. 2015, 52, 2134–2150. [Google Scholar] [CrossRef]
- Lee, M.S. A Basic study on urban regeneration in Gwangju-city using GIS. J. Korean Hous. Assoc. 2015, 26, 99–107. [Google Scholar] [CrossRef]
- Kim, H.M.; Han, S.S. Seoul. Cities 2012, 29, 142–154. [Google Scholar] [CrossRef]
- Seoul Metropolitan Government. Statistics on Seoul Senior Citizens. 2011. Available online: http://stat.seoul.go.kr (accessed on 3 February 2020).
- Pitts, A.; Kim, K. Planning and Design Strategies for Sustainable Low Energy Development in Seoul, Korea. In Proceedings of the International Conference Passive and Low Energy Cooling for the Built Environment, Santorini, Greece, 19–21 May 2005. [Google Scholar]
- Organisation for Economic Co-operation and Development. Inclusive Growth in Seoul, Korea; OECD Publishing: Paris, France, 2018. [Google Scholar]
- Cunningham-Sabot, E.; Audirac, I.; Fol, S.; Martinez-Fernandez, C. Theoretical approaches of “shrinking cities”. In Shrinking Cities. International Perspectives and Policy Implications; Routledge: Abingdon, UK, 2013; pp. 14–30. [Google Scholar]
- Korean Statistical Information Service (KOSIS). Available online: http://kosis.kr/index/index.do (accessed on 10 February 2020).
- Ko, J.; Park, D.; Lim, H.; Hwang, I.C. Who produces the most CO2 emissions for trips in the Seoul metropolis area? Transp. Res. Part D 2011, 16, 358–364. [Google Scholar] [CrossRef]
- Jungnang-Gu Office. Available online: https://www.jungnang.go.kr/ (accessed on 10 February 2020).
- National Spatial Data Infrastructure Portal (NSDI). Available online: http://www.nsdi.go.kr/ (accessed on 2 December 2019).
- Seoul Transport Operation & Information Service (TOPIS). Available online: http://topis.seoul.go.kr/ (accessed on 3 February 2020).
- QGIS. Available online: https://qgis.org/ (accessed on 2 December 2019).
- Hermans, M.H. Building performance starts at hand-over: The importance of life span information. In Proceedings of the Eighth International Conference on Durability of Building Materials and Components, Vancouver, BC, Canada, 31 May–3 June 1999. [Google Scholar]
- Ministry of Land, Infrastructure and Transport. Introduce Living Infrastructure Standards and Study on Application Plan; Ministry of Land, Infrastructure and Transport: Sejong-si, Korea, 2018.
- Hermans, M.H. Deterioration Characteristics of Building Components: A Data Collecting Model to Support Performance Management. Doctor of Philosophy, Technische Universiteit Eindhoven, Eindhoven, The Netherlands, 24 January 1995. Available online: https://research.tue.nl/en/publications/deterioration-characteristics-of-building-components-a-data-colle (accessed on 15 February 2020).
- Sjöström, C. Overview of methodologies for prediction of service life. In Problems in Service Life Prediction of Building and Construction Materials; Springer: Berlin/Heidelberg, Germany, 1985; pp. 3–20. [Google Scholar]
- Prieto, A.J.; Silva, A. Service life prediction and environmental exposure conditions of timber claddings in South Chile. Build. Res. Inf. 2020, 48, 191–206. [Google Scholar] [CrossRef]
- Kidokoro, T. Transit Oriented Development (TOD) Policies and Station Area Development in Asian Cities. In IOP Conference Series: Earth and Environmental Science; IOP Publishing: Bristol, UK, 2020. [Google Scholar]
- Nasri, A.; Zhang, L. The analysis of transit-oriented development (TOD) in Washington, DC and Baltimore metropolitan areas. Transp. Policy 2014, 32, 172–179. [Google Scholar] [CrossRef]
- Papa, E.; Bertolini, L. Accessibility and transit-oriented development in European metropolitan areas. J. Transp. Geogr. 2015, 47, 70–83. [Google Scholar] [CrossRef]
- Sung, H.; Oh, J.T. Transit-oriented development in a high-density city: Identifying its association with transit ridership in Seoul, Korea. Cities 2011, 28, 70–82. [Google Scholar] [CrossRef]
- Sun, S.N.; Her, J.; Lee, S.-Y.; Lee, J.S. Meso-Scale Urban Form Elements for Bus Transit-Oriented Development: Evidence from Seoul, Republic of Korea. Sustainability 2017, 9, 1516. [Google Scholar] [CrossRef]
- Seoul Special Metropolitan City Ordinance on the Maintenance and Improvement of Urban Areas and Dwelling Conditions for Residents. 2019. Available online: https://www.law.go.kr/%EC%9E%90%EC%B9%98%EB%B2%95%EA%B7%9C/%EC%84%9C%EC%9A%B8%ED%8A%B9%EB%B3%84%EC%8B%9C%EB%8F%84%EC%8B%9C%EB%B0%8F%EC%A3%BC%EA%B1%B0%ED%99%98%EA%B2%BD%EC%A0%95%EB%B9%84%EC%A1%B0%EB%A1%80 (accessed on 12 February 2020).
- Zeleny, M. Multiple Criteria Decision Making Kyoto 1975; Springer Science & Business Media: Berlin/Heidelberg, Germany, 2012; Volume 123. [Google Scholar]
- Aksoy, E.; San, B.T. Geographical information systems (GIS) and multi-criteria decision analysis (MCDA) integration for sustainable landfill site selection considering dynamic data source. Bull. Eng. Geol. Environ. 2019, 78, 779–791. [Google Scholar] [CrossRef]
- Abd El Karim, A.; Awawdeh, M.M. Integrating GIS Accessibility and Location-Allocation Models with Multicriteria Decision Analysis for Evaluating Quality of Life in Buraidah City, KSA. Sustainability 2020, 12, 1412. [Google Scholar] [CrossRef]
- Nyimbili, P.H.; Erden, T. A Hybrid Approach Integrating Entropy-AHP and GIS for Suitability Assessment of Urban Emergency Facilities. ISPRS Int. J. Geo Inf. 2020, 9, 419. [Google Scholar] [CrossRef]
- Vanolya, N.M.; Jelokhani-Niaraki, M. The use of subjective–objective weights in GIS-based multi-criteria decision analysis for flood hazard assessment: A case study in Mazandaran, Iran. GeoJournal 2019, 1–20. [Google Scholar] [CrossRef]
- Comber, A.; Carver, S.; Fritz, S.; McMorran, R.; Washtell, J.; Fisher, P. Different methods, different wilds: Evaluating alternative mappings of wildness using fuzzy MCE and Dempster-Shafer MCE. Comput. Environ. Urban Syst. 2010, 34, 142–152. [Google Scholar] [CrossRef]
- Shannon, C.E. A mathematical theory of communication. Bell Syst. Tech. J. 1948, 27, 379–423. [Google Scholar] [CrossRef]
- Karmeshu, J. Entropy Measures, Maximum Entropy Principle and Emerging Applications; Springer Science & Business Media: Berlin/Heidelberg, Germany, 2003; Volume 119. [Google Scholar]
- Van Strien, A.J.; Soldaat, L.L.; Gregory, R.D. Desirable mathematical properties of indicators for biodiversity change. Ecol. Indic. 2012, 14, 202–208. [Google Scholar] [CrossRef]
- Tucker, C.M.; Cadotte, M.W.; Carvalho, S.B.; Davies, T.J.; Ferrier, S.; Fritz, S.A.; Pavoine, S. A guide to phylogenetic metrics for conservation, community ecology and macroecology. Biol. Rev. 2017, 92, 698–715. [Google Scholar] [CrossRef] [PubMed]
- Simpson, E.H. Measurement of diversity. Nature 1949, 163, 688. [Google Scholar]
Publisher’s Note: MDPI stays neutral with regard to jurisdictional claims in published maps and institutional affiliations. |
© 2021 by the authors. Licensee MDPI, Basel, Switzerland. This article is an open access article distributed under the terms and conditions of the Creative Commons Attribution (CC BY) license (http://creativecommons.org/licenses/by/4.0/).