Article

Overcapacity Risk of China’s Coal Power Industry: A Comprehensive Assessment and Driving Factors

School of Economics and Management, China University of Mining and Technology, Xuzhou 221116, China
*
Author to whom correspondence should be addressed.
Sustainability 2021, 13(3), 1426; https://doi.org/10.3390/su13031426
Submission received: 15 December 2020 / Revised: 14 January 2021 / Accepted: 18 January 2021 / Published: 29 January 2021

Abstract

:
The comprehensive and accurate monitoring of coal power overcapacity is the key link and an important foundation for the prevention and control of overcapacity. The previous research fails to fully consider the impact of the industry correlation effect; making it difficult to reflect the state of overcapacity accurately. In this paper; we comprehensively consider the fundamentals; supply; demand; economic and environmental performance of the coal power industry and its upstream; downstream; competitive; and complementary industries to construct an index system for assessing coal power overcapacity risk. Besides; a new evaluation model based on a correlation-based feature selection-association rules-data envelopment analysis (CFS-ARs-DEA) integrated algorithm is proposed by using a data-driven model. The results show that from 2008 to 2017; the risk of coal power overcapacity in China presented a cyclical feature of “decline-rise-decline”, and the risk level has remained high in recent years. In addition to the impact of supply and demand; the environmental benefits and fundamentals of related industries also have a significant impact on coal power overcapacity. Therefore; it is necessary to monitor and govern coal power overcapacity from the overall perspective of the industrial network, and coordinate the advancement of environmental protection and overcapacity control.

1. Introduction

Electric power is the cornerstone of modern economic development. Due to the limitation of energy resource endowment, the coal power industry has played a dominant role in China’s power system. By the end of 2018, the installed capacity of coal power in China reached 1.01 billion kW, accounting for 53% of the total installed power capacity. Coal power generation in China reached 445 million kilowatt-hours, accounting for 64% of total power generation. As an important national basic energy industry, the industrial linkage of the coal power industry is very complex. It not only has a direct impact on the upstream coal industry and the downstream capital-intensive industries such as steel and building materials, but it also relates to the development of a national strategic new energy industry such as wind power and photovoltaic power generation. Therefore, it has a significant, strategic position in the national economy. However, in recent years, the coal power industry has encountered a severe overcapacity problem due to factors such as the slowdown of economic growth, environmental constraints, the transformation of the energy structure, and the untimely adjustment of coal power planning [1,2]. By the end of 2017, the utilization hours of coal-fired power units had declined by 16% compared to that of 2010, while the profits of the coal power industry were only 20.7 billion yuan, which was 83% lower than that of 2016. Coal power overcapacity has caused a series of problems such as tremendous waste of resources, serious environmental pollution, vicious market competition and may further increase the risk of economic fluctuation and affect the development of the national economy [3].
In order to resolve the risk of overcapacity in the coal power industry, the Chinese government has announced a series of policies and measures. For example, in 2017, Opinions on Preventing and Resolving the Risk of Coal Power Overcapacity was announced, which clearly put forward the goal of reducing the installed capacity of coal power to within 1.1 billion kW by 2020. In 2018, the Key Points of Coal-fired Power Overcapacity Elimination stipulated that coal-fired power units below 300,000 kW that failed to meet standards should be eliminated, and illegal construction projects should be discontinued. In 2019, the National Development and Reform Commission issued the Notice on Solving Excess Capacity in Key Areas, which pointed out that the government would be fully involved in market regulation and promote the optimization and upgrading of the coal power industry. However, in practice, China’s coal power overcapacity has not been effectively curbed, and investment growth is still at a relatively high level, which has led to serious industry losses. According to a report released by the Global Energy Monitor (GEM), from January 2018 to June 2019, China’s installed capacity of coal power increased by 42.9 GW while the total installed capacity of global coal power generation outside China decreased by 8.1 GW. The governance failure highlights the deep-seated contradictions in the existing mechanism, and the incomplete information available in the decision-making process is considered as the main cause. Accurately assessing the overcapacity risk will help policymakers grasp the evolution law of overcapacity and its driving mechanism. It is not only the key link of overcapacity prevention, but also the important foundation of overcapacity governance. Therefore, there is an urgent need to study the risk assessment system of coal power overcapacity.
Many scholars have researched on the coal power overcapacity, including its causes and formation mechanisms [4,5,6], measurement methods [7,8] and governance strategies [9,10]. However, there are still some gaps in the research on the risk assessment system of coal power overcapacity. Some scholars have made a preliminary exploration of the comprehensive assessment of other industries’ overcapacity, but there are still many deficiencies involved. On the one hand, from the perspective of selecting evaluation indicators, the existing research relies too much on a small number of outcome indicators such as capacity utilization rate. Such an index system is easily affected by external random disturbance, thus having certain randomness and instability. In addition, due to the neglect of the influence of inter- industry correlation and information transmission effect, the logic of the multi-index system is not clear and comprehensive, and the selected indicators are insensitive to overcapacity, which seriously weakens the scientificity of subsequent modeling and the reliability of the results. On the other hand, from the perspective of the research paradigm, the existing literature is still limited to knowledge or model-driven methods [11]. Although these methods can analyze or quantitatively evaluate the risk of events, they lack the strength to dig out potentially valuable relationships from the data facts, which may increase redundant and irrelevant features in the variable space, leading to model overfitting. Besides, some important latent variables are prone to be excluded from the variable combination of traditional models. This often leads to poor adaptability between the assumptions of the traditional model and the data, diminishing the explanatory power of the model.
Based on the perspective of industry correlation, this study proposes an assessment index system and model of coal power overcapacity risk. This study contributes to the literature in three ways. First, through systematic identification of the industry correlation effect, this paper constructs an index system for assessing coal power overcapacity risk. The index system makes up for defects on the one-sidedness of the existing selected indicators. This helps to improve the reliability of evaluation result and provides an important theoretical basis for the monitoring and early warning of overcapacity. Second, this study adopted the data-driven paradigm to construct an evaluation model based on the correlation-based feature selection-association rules-data envelopment analysis (CFS-ARs-DEA) integrated algorithm. This model reduces the redundancy and computational complexity of the index system by distinguishing the characteristics of data change, and enhances the association between the evaluating indicators and target variables. Moreover, through the identification of the optimal variable combination relationship, it automatically weights each index, which reduces the uncertainty caused by prior knowledge and ensures the accuracy of the evaluation results. This model has been proven to be a practical and effective tool to assess the risk of coal power overcapacity in China. Third, on the basis of ensuring the comprehensiveness of the index system, this paper uses association rules to explore the relationship patterns of specific variables and new variable influence mechanism hidden in data facts, which not only enhances the explanatory power of the evaluation model, but also successfully identifies the crucial and ignored factors and their influence mechanism on coal power overcapacity. These factors include environmental benefits and industry fundamentals of related industries of the coal power industry.
The remainder of this study is structured as follows. Section 2 reviews the relevant literature. Section 3 introduces the comprehensive index system and the CFS-ARs-DEA model for assessing coal power overcapacity risk. Section 4 reports the empirical results and discusses them. Section 5 summarizes the key conclusions and policy implications.

2. Literature Review

2.1. Causes of Coal Power Overcapacity

Overcapacity is a phenomenon that has caught the attention of many scholars. Western scholars mostly discussed the causes of overcapacity from the perspective of market operation mechanisms. Pindyck [12] put forward that the uncertainty of demand forces enterprises to keep the flexibility of production capacity. Fusillo [13] believed that the compromise on sunk costs eventually leads to invalid expansion. Nishimori and Ogawa [14] proposed that the formation of excess capacity is the competitive strategy adopted by enterprises to maintain market share. Due to the difference in the market system, domestic scholars have mostly discussed the formation mechanism of China’s industry overcapacity based on unique national conditions and established the mainstream hypotheses of market failure, institutional distortion, and weak demand. For example, Lin et al. [15] proposed that in the process of China’s rapid economic growth and accelerated industrialization, due to incomplete and asymmetric market information, enterprises had a strong positive perception of coal, power, and other promising industries. The influx of a large quantity of capital forms a “wave phenomenon” of investment, which eventually leads to overcapacity. Qin et al. [16] believed that China’s fiscal and tax policy system and the evaluation system of local officials strengthen the motivation of local governments to intervene in enterprise activities. Improper intervention distorts the market price of production factors in the coal power industry and induces blind investment and an increase in the number of coal-related enterprises. Once power demand declines, the serious problem of overcapacity is inevitable. Other scholars have discussed the causes of coal power overcapacity from the perspective of weak demand. They believed that the fundamental change of power demand from high-speed growth to medium high-speed growth is an important reason for coal power overcapacity [17].
There has been a systematic review of the causes of overcapacity in the coal power industry in academic circles. Existing research results provide a theoretical basis for the identification of the risk factors of overcapacity in the coal power industry. However, few scholars analyze the formation mechanism of coal power overcapacity from the perspective of industrial linkage. With the increasingly clear division of labor and close interdependence of industries, will associated industries have an impact on each other’s capacity utilization? What are the strengths and directions of influence? These questions remain unanswered and will play an important role in the accurate assessment of coal power overcapacity risk. Therefore, this study examines industry features and industry correlation effects to evaluate the influencing factors and driving mechanism of coal power overcapacity risk.

2.2. The Judgment of Coal Power Overcapacity

Prior research has been conducted to judge industrial overcapacity based on different theories and perspectives. Presently, measuring capacity utilization is the most popular method used to judge whether there is the excess capacity [18,19], which is relatively simple and intuitive. However, due to the influence of external random disturbance, capacity utilization has certain randomness and instability, and thus, it is difficult to accurately reflect the industry’s overcapacity state. Moreover, there is a certain time lag in the statistics related to capacity utilization. Therefore, enterprises can hardly rely on it to avoid the risk of overcapacity. Further, in a market environment characterized by increasingly perfect mechanisms and refined division of labor, where excess capacity occurs in an industry, its related industries are also affected. Currently, it is unscientific to measure the degree of industry overcapacity simply by relying on capacity utilization. Therefore, it is necessary to put forward a systematic assessment index system and model of coal power overcapacity risk. This will provide a quantitative tool for policymakers to accurately identify the risk of overcapacity, so as to carry out macro-control and policy guidance as soon as possible. In addition, it can also provide a scientific strategical basis for enterprises, preventing them from blind investment.
The existing literature scarcely covers the comprehensive assessment of overcapacity risk in the coal power industry. Han and Wang [20] selected 11 economic indicators, such as fixed-asset investments, production and demand, inventory, and industry benefits, to build an assessment system of overcapacity and quantitatively analyze the capacity utilization level of the steel industry. Shi et al. [21] selected six indicators reflecting the characteristics of wind resources, types of wind power equipment and wind power output, and used the improved analytic hierarchical process (AHP) and fuzzy evaluation method to evaluate the capacity utilization level of the wind power industry in Xinjiang, China. These studies have value, but their defects are also obvious. On the one hand, existing research on the comprehensive evaluation of industrial overcapacity seldom considers the correlation effect between industries, which leads to limitations in the establishment of the assessment index system. On the other hand, existing weighting methods for composite index are mostly subjective expert opinion-based methods, which greatly reduce the scientificity and accuracy of the assessment results.
To improve the above problems, we combined three data-driven algorithms to establish a CFS-ARs-DEA model for the assessment of coal power overcapacity risk, trying to measure the risk level of coal power overcapacity by constructing a composite assessment index. The composite index can quantitatively reflect the real problems with multi-dimensional attributes based on less information loss. This method has been widely used in evaluation and decision-making processes in many fields, such as business competitiveness [22], ecological vulnerability [23], and energy security [24]. In the comprehensive assessment model proposed in this study, correlation-based feature selection (CFS) algorithm has been proven to be able to effectively reduce the high-dimensional feature system, which helps to improve the reliability of the research results. For example, Cigdem and Demirel [25] fused CFS feature selection with multiple classifiers and successfully improved the detection accuracy of Parkinson’s disease magnetic resonance imaging. Kushal and illindala [26] proposed a resilience characteristic analysis method of ship power system (SPS) based on CFS algorithm, which was used to distinguish the best predictor of performance during contingencies and optimized the evaluation results of SPS performance. At the same time, after a series of optimization, association rules can also efficiently and accurately mine the potential risk causality and hidden key information from the data facts. Czibula et al. [27] proposed a classification model based on relational association rules to assist software developers to identify defective software modules. Therefore, this paper combines the two algorithms to obtain a more objective and comprehensive understanding of the risk level of industry overcapacity and its causes.

3. Risk Assessment Model Construction of Coal Power Overcapacity
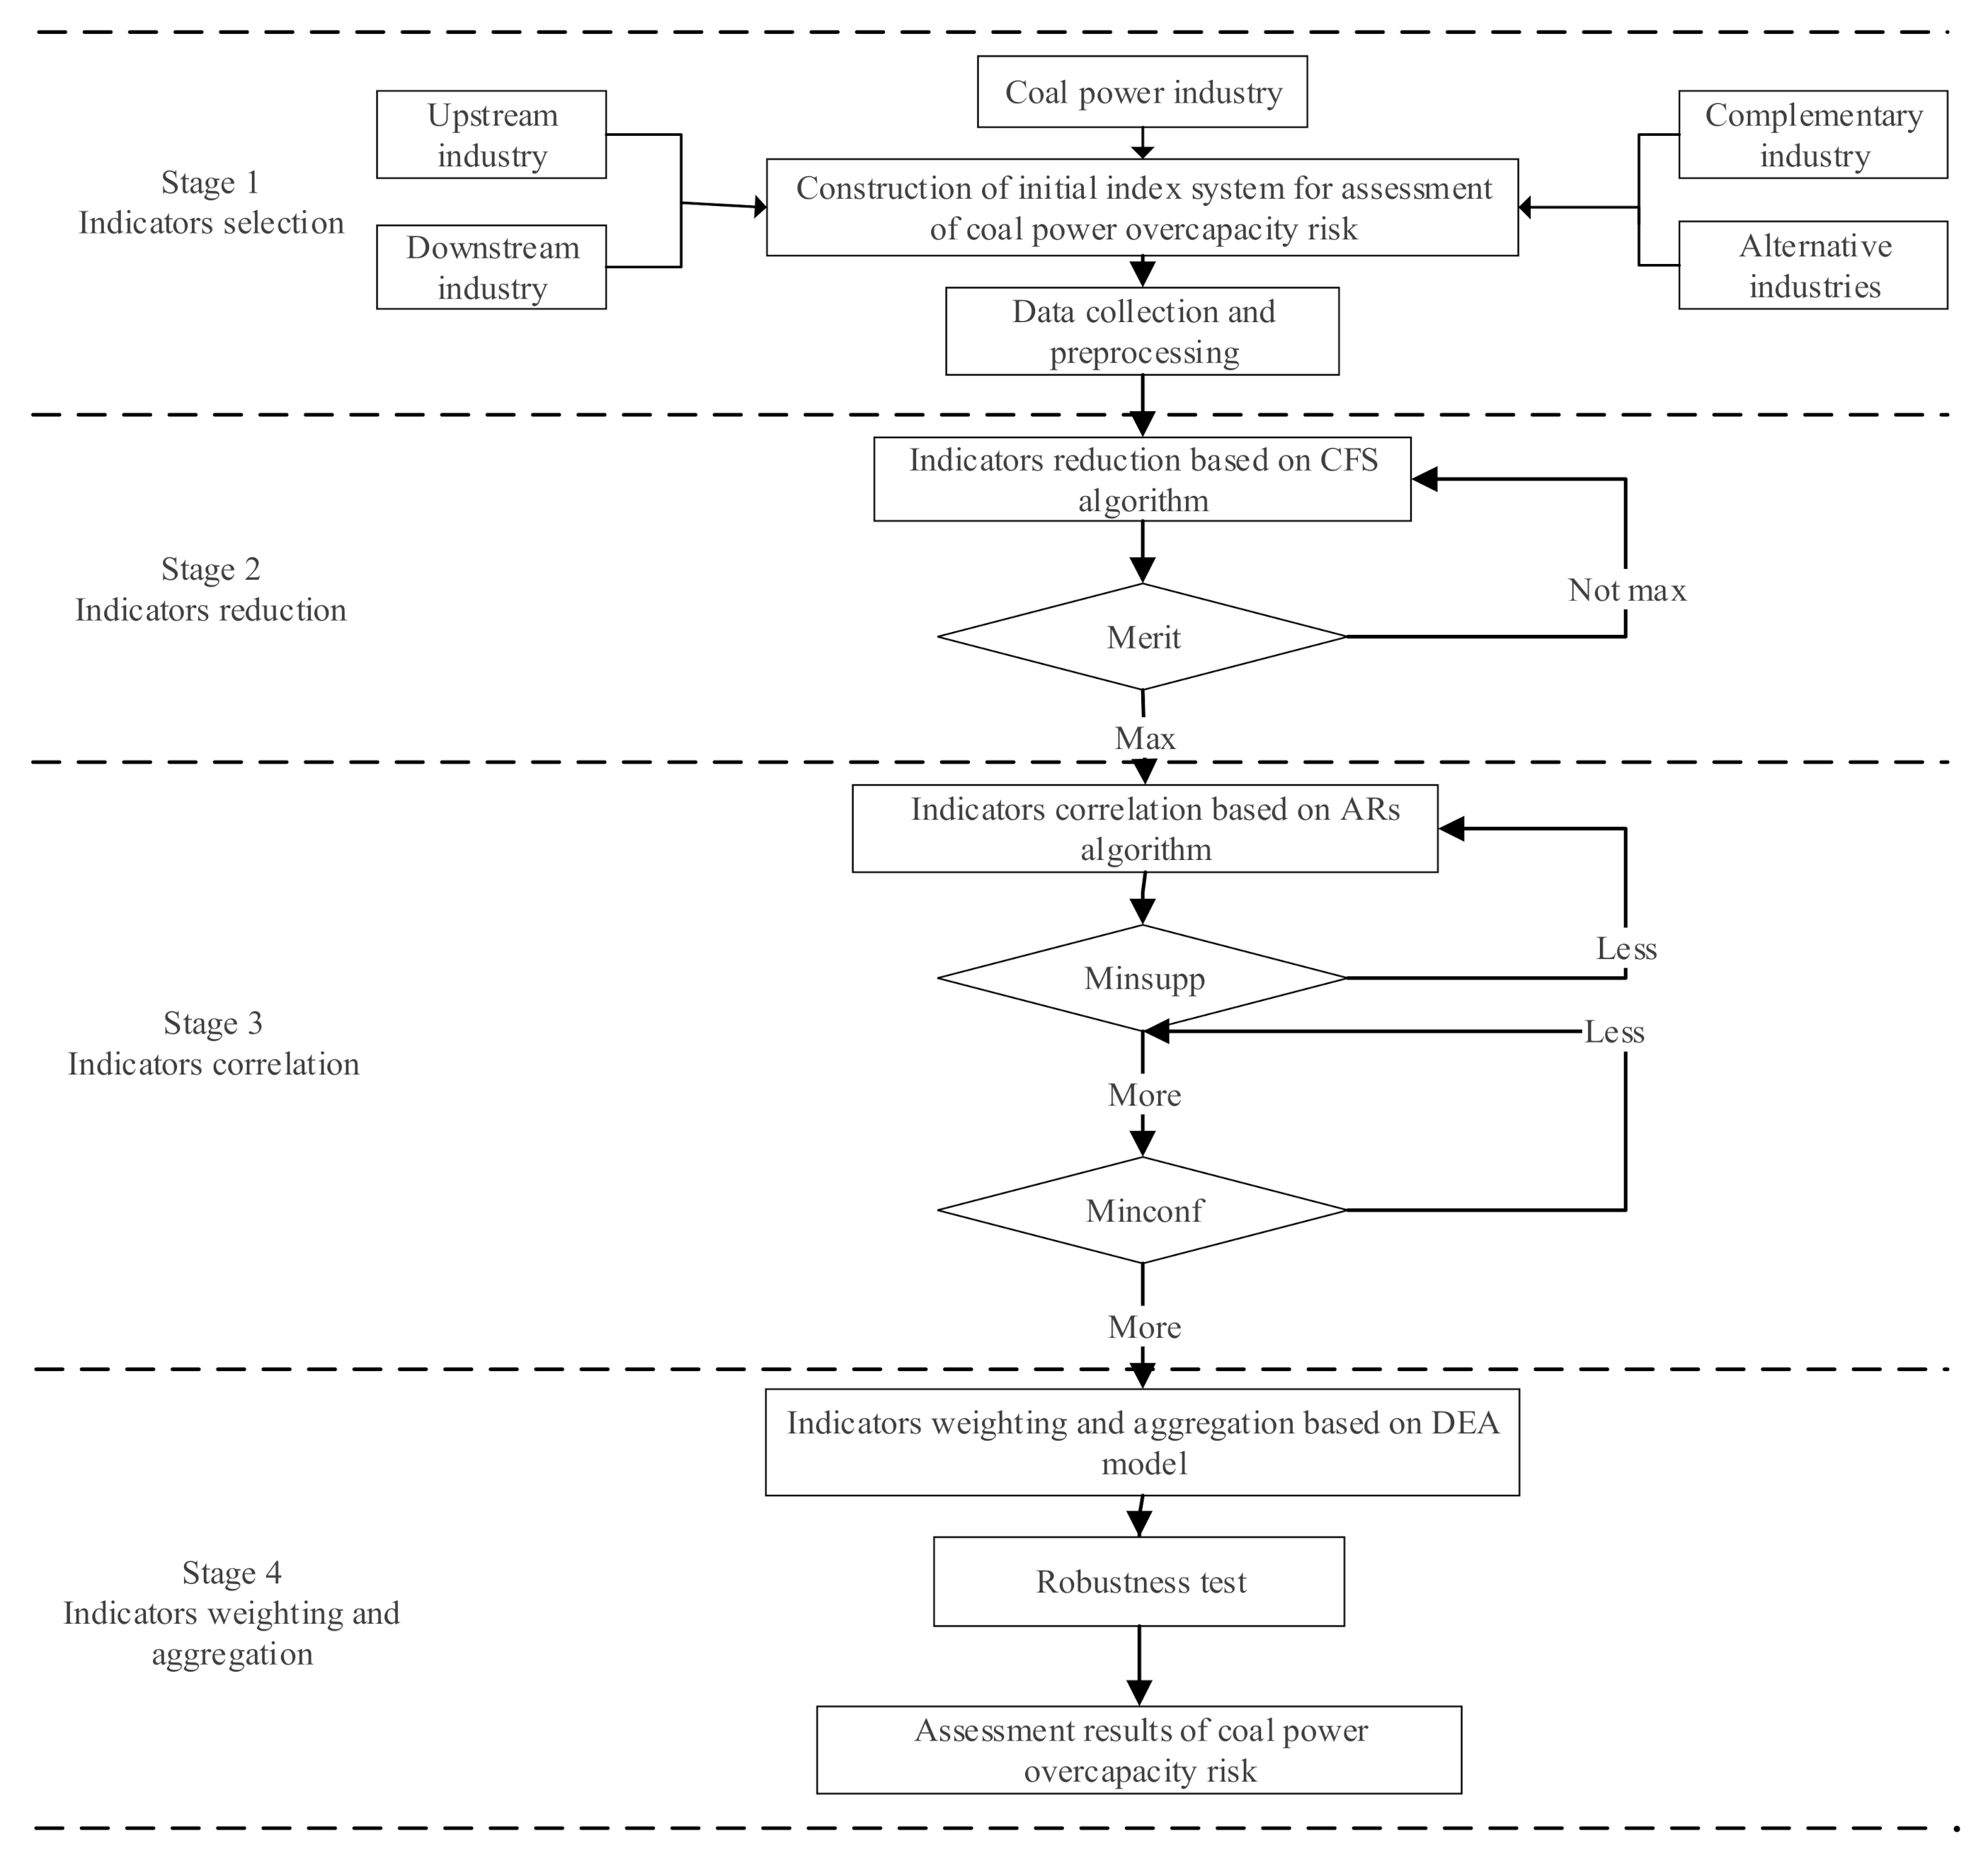
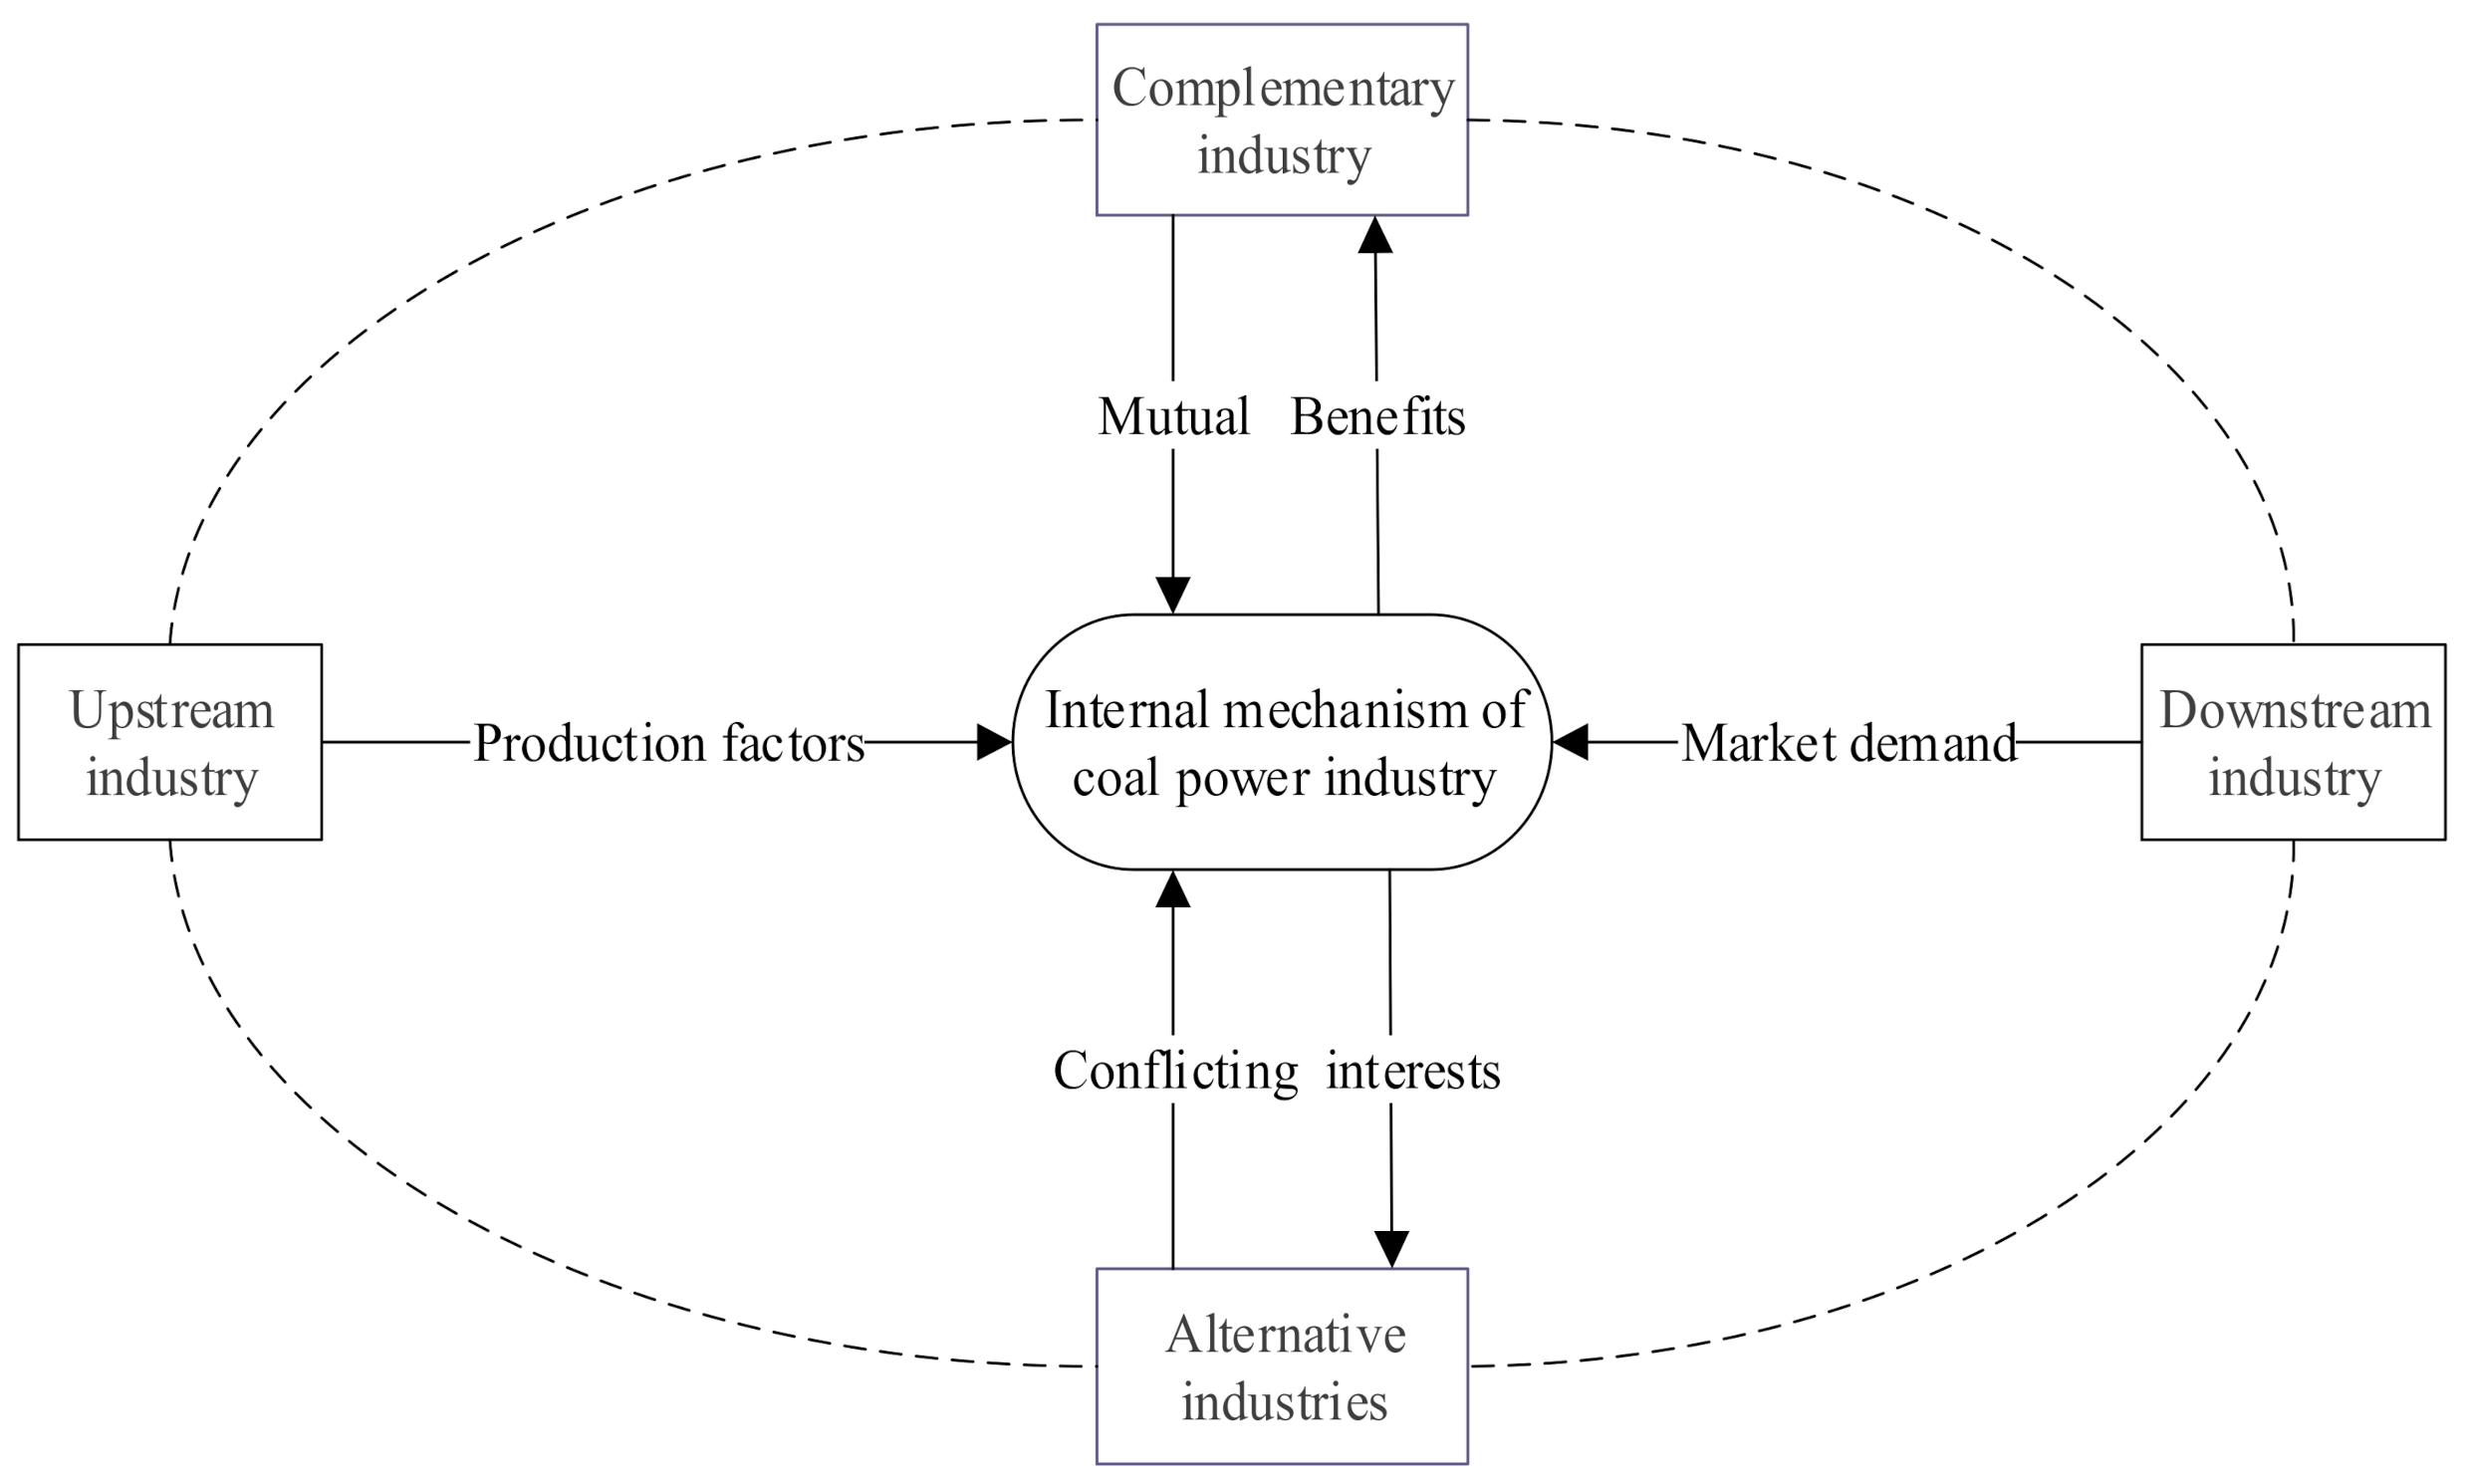
3.1. Framework

Based on the idea of data-driven analysis and the perspective of industry correlation, this study established an index system and constructs a CFS-ARs-DEA integration model to assess coal power overcapacity risk, as shown in Figure 1. The details are as follows. First, considering the production and operation mechanism of the coal power industry and its related industries, we establish a systematic initial index system for assessing coal power overcapacity risk. Second, we used the CFS algorithm to reduce the redundancy among the initial indicators. Third, to eliminate indicators with a weak association with coal power overcapacity, the association rules (ARs) algorithm was used to perform association analysis on the index system after the previous reduction. Finally, the data envelopment analysis (DEA) model was used to weight the final index system and generate the composite index of coal power overcapacity risk. Then, we tested the robustness of the weighting scheme and further analyze the assessment result of coal power overcapacity risk.

3.2. Indicators Selection

The industry correlation effect is essentially the relationship between demand and supply and the resulting technological and economic ties [28]. This effect inevitably influences the industry capacity utilization, which has been ignored in previous studies on overcapacity. As shown in Figure 2, related industries include not only the upstream and downstream industries linked by intermediate product input in the vertical industrial structure, but also the complementary industries engaged in complementary production and alternative industries engaged in the production of substitutes in a horizontal industrial structure [29]. Inspired by such effects, this study considered upstream and downstream industries, complementary industries, and alternative industries of the coal power industry in the scope of evaluation while constructing the initial index system of overcapacity risk assessment.
By examining the industry linkage of the coal power industry, we can conclude that the upstream part is mainly the coal industry, and the downstream part mainly includes four industries, namely steel, non-ferrous metals, building materials, and chemical industries. The substitution part of the coal power industry mainly includes hydropower, nuclear power, and other industries. In this study, they are collectively referred to as the new energy power industry. The complementary part of the coal power industry is mainly the power equipment manufacturing industry.
Based on existing research on the formation mechanism of overcapacity, we build the initial index system for assessing coal power overcapacity risk by combining four dimensions, namely industry performance, supply, demand, and industry fundamentals.
  • The industry fundamentals refer to the inherent heterogeneity among industries that makes each industry flexible in coping with excess capacity in different ways. Therefore, it is an important dimension to be examined. Such fundamentals mainly include industrial concentration, marketization level, capital intensity, opening degree, and employment elasticity. These indicators have significant differences in how they influence the production and operation of each industry. High industrial concentration can reduce the blind follow-up and disorderly expansion of a large number of small and medium-sized enterprises, which helps enterprises grasp a higher share of market investment. We used the concentration ratio (CR-5) index to measure industrial concentration. The improvement of the level of marketization can make the industry allocate resources through the mechanism of survival of the fittest in competition more reasonably. Non-state-owned enterprises’ share of total industrial sales value is used to represent the marketization level. The higher the concentration of capital, the higher is the number of industry exit barriers. As a result, when market demand falls, a large number of enterprises may fail to reduce their production capacity. We use the ratio of the net value of fixed assets to total industrial sales value to measure capital intensity. Higher employment elasticity indicates that enterprises can adjust their variable costs and control their capacity according to the market changes. We measure employment elasticity by the elasticity value of employees to the sum of the inventory and accounts receivable. The level of opening up reflects the ability of enterprises to explore overseas markets. Enterprises can resolve excess capacity through export when domestic demand is insufficient. We use the ratio of the export value to total industrial sales value to represent the degree of openness.
  • The matching of supply and demand is the basis for measuring industry overcapacity [30]. Supply refers to the input of production factors and is the main source of overcapacity in China. Among the various supply factors, we selected indicators from four sub-dimensions, namely fixed assets, labor, technology, and credit. At the demand level, this study used four indicators to examine the changing trend of market demand, namely the growth rate of the industrial sales output value, the turnover rate of inventory, the growth rate of inventory, and the ratio of production to sales.
  • This study examines industry performance from two perspectives of economic and environmental benefits. When the industry has serious overcapacity, the overall economic benefits will decline significantly, such as price decline and deficit increase. These indicators can most intuitively reflect the degree of overcapacity. However, the negative effects of overcapacity are reflected not only in economic benefits, but also in the deterioration of environmental benefits. The real problem is that many local governments in China have relaxed their environmental protection standards and pollution control of coal power enterprises in exchange for more investment. This behavior externalizes the production cost of enterprises, intensifies over investment and repeated construction, and, finally, inhibits capacity utilization [31]. In this study, pollution emission intensity is used to represent environmental benefits.
Finally, the initial index system of coal power overcapacity risk assessment was established from four dimensions, namely performance, supply, demand, and industry fundamentals, and includes eight evaluated industries. It should be noted that due to the common features of coal, steel, power equipment, and other industries, the same indicator system applied to the upstream and downstream industries and complementary industries. The power industry is relatively special. For example, there is no inventory in the power industry. Therefore, the coal power industry and the new energy power industry belong to an independent indicator system. In sum, after systematic investigation and preliminary screening, we have obtained the initial index system with a total of 169 indexes, as shown in Table 1.
Considering the availability and integrity of data, data from 2008 to 2017 is selected to assess the risk of coal power overcapacity. Specifically, among the data of coal, iron and steel, non-ferrous metals, building materials, chemical industry and power equipment manufacturing industry, L1, L2, L3 and L5 are from China Industrial Statistical Yearbook, L4 and L9-L24 are from China Statistical Yearbook, L6-L8 are from Statistical Yearbook of the Chinese Investment in Fixed Assets, and L25 is from China Environmental Statistical Yearbook. In coal power industry and new energy power industry, H1, H2 and J1, J2 are from China Industrial statistical Yearbook, H3~H10 and J3~J8 are from China Electric Power Yearbook and China Hydropower Yearbook, and H11 is from China Environmental Statistical Yearbook. In addition, the smooth index method and the Newton interpolation method are used to make up the missing values of data.

3.3. Indicators Reduction

Indicators reduction can not only effectively reduce the information redundancy in the initial index system, but it can also reduce the calculation complexity. The CFS algorithm is a filtering algorithm for feature reduction based on feature correlation [32]. Unlike traditional feature reduction algorithms such as the genetic algorithm and decision tree, the CFS algorithm can evaluate and rank each feature subset rather than a single feature so as to mine and capture the feature correlation through data analysis, and its computational complexity is relatively small [33]. The principle of index reduction is that the optimal feature subset should contain features that are highly correlated with their relevant classes and are not correlated with other features in the dataset. The calculation equation of the feature subset correlation is:
M e r i t s = k r ¯ c f k + k ( k - 1 ) r ¯ f f
where M e r i t s represents the correlation value of feature subset s containing k features. r ¯ c f   is the average feature-class correlation, r ¯ f f is the average feature-feature intercorrelation. The correlation is measured using the Pearson correlation coefficient, and all variables need to be standardized before calculating the correlation coefficient. The search process for the optimal feature subset is as follows.
Step 1: Add single features successively from the empty set to generate n single features of M 1 i ;
Step 2: Calculate the M e r i t value of feature n sets;
Step 3: Select the feature with the largest M e r i t value and the second largest M e r i t value in M 1 i to form a new feature set M 2 i ;
Step 4: If the M e r i t value of the new feature set is less than the maximum M e r i t value in M 1 i , then the feature with the second largest M e r i t value is replaced by the feature with the third-largest M e r i t value to form a new feature set;
Step 5: Repeat the iteration until the feature set with the highest M e r i t value is found.

3.4. Indicators Correlation

Since the reduction of indicators in the previous stage may reduce the correlation between some indicators and the coal power overcapacity, we used ARs to analyze the correlation between the retained indicators and coal power capacity utilization so as to remove indicators that are weakly related to coal power overcapacity. The ARs algorithm aims to mine the relationship of X Y ( X represents the antecedent of the rule, Y represents the consequent of the rule and X Y = ). It reflects the rule that the items in the antecedent will also appear when the items in the consequent appear. There are two main criteria to judge the association rules: S u p p o r t and C o n f i d e n c e . The mathematical expressions are as follows:
S u p p o r t ( X Y ) =       s u m   o f     X Y   overall   records   in   the   database   D C o n f i d e n c e X Y = s u m   o f     X Y s u m   o f     X
when the S u p p o r t and C o n f i d e n c e of a rule meet the criteria of minimum support (minsupp) and minimum confidence (minconf), it is the required strong association rule.
It should be noted that traditional ARs algorithms such as the Apriori and Frequent Pattern (FP)-growth are aimed at mining the strong association between items in each event [34]. To explore the relationship between indicators, we look for indicators that change in the same or reverse direction with coal power capacity utilization. When the number of years in which an indicator changes in the same (reverse) direction with capacity utilization reaches the threshold of minsupp and minconf, it has a strong (weak) correlation with coal power overcapacity. If the number of years in the same direction reaches the threshold, it is positively related to capacity utilization, that is, it is negatively related to overcapacity. Otherwise, it is positively related to overcapacity. In this process, we removed the indicators that are weakly related to coal power capacity utilization. Next, we used the Apriori algorithm to find all indicators that have a strong correlation with capacity utilization. This algorithm can dig out strong association relations between item sets from various events Its principle is that if the item set X is a frequent set, then its non-empty subsets are all frequent sets. The steps are as follows.
Step 1: Given the minimum support threshold and the minimum confidence threshold;
Step 2: Scan database D to generate candidate item set I1 and then prune frequent 1-item sets according to the minimum support to get the 1-frequent set L1;
Step 3: Get the candidate 2-term set C2 according to L1 and then prune C2 according to the minimum support to get the 2-frequent set;
Step 4: Repeat iterations until higher order frequent sets cannot be generated;
Step 5: Mine all strong association rules that are not less than the minimum confidence from all frequent sets.

3.5. Indicators Weighting and Aggregation

In recent years, the DEA weighting method has evolved from the application of traditional nonparametric efficiency evaluation to the construction of composite index. Unlike the expert opinion-based weighting method, this method does not require prior information of weights and can automatically select the most favorable set of weights for each entity to measure the relative performance between entities in the best case scenario [35]. Translating the original DEA context to determine the weights implies that we do not consider inputs and refer to each indicator as an output. Suppose that we have m entities and n indicators. I i j shows the value of indicator j for entity i , and w i j represents the weight of indicator j for entity i . The implementation steps of the weighting model are as follows.
Step 1: Calculate the most favorable weight for each entity to maximize the index value. The linear programming model is as follows:
g I i     = max j = 1 n w i j I i j                           s . t . j = 1 n w i j I k j 1                               k = 1 , 2 , m w i j 0                                                                     j = 1 , 2 , n
Step 2: Calculate the most unfavorable weight for each entity to minimize the index value. The linear programming model is as follows:
b I i     = min j = 1 n w i j I i j   s . t . j = 1 n w i j I k j 1                         k = 1 , 2 , m w i j 0                                                               j = 1 , 2 , n
Step 3: Set an adjustment parameter λ to combine g I i and b I i to get the composite index C I i :
C I i = λ g I i g I g I * g I + ( 1 λ ) b I i b I b I * b I
where g I * and g I represent the maximum and minimum values of g I , while b I * and b I represent the maximum and minimum values of b I respectively.
It is observed that the linear programming model is of great importance in the generation of weights. However, this model has some disadvantages. First, the adjustment parameters λ are set artificially and have strong subjectivity. Second, for each entity, the model assigns different weights to each indicator, which makes the weighted values of indicators in different years, not comparable. Third, this model does not limit the scope of the weight, and the index weight may be zero. To overcome the above defects, this study used the approach of Hatefi et al. [36] to make the following adjustments to the aforementioned method.
min M M d i 0                         i = 1 , 2 , m s . t . j = 1 n w j I i j d i = 1                         i = 1 , 2 , m w j ε , d i 0                     i = 1 , 2 , m , j = 1 , 2 , n
First, we introduced a variable d i , that is greater than zero to change the inequality into equality. In this way, the composite index value is converted to C I i = 1 + d i . To achieve the best performance of the annual assessment, we look for a set of weights that make C I i as small as possible, which is equivalent to minimizing d i . Second, to adjust the variable weight to the common weight, we used the min–max method to set M as the maximum of all d i and then adjust the objective function to min M . Finally, to make each index weight not equal to zero, we introduced an infinitesimal positive number ε as the lower limit of the constant weight. Based on the above adjustments, the optimized DEA model can endogenously obtain the composite index of coal power overcapacity risk.

4. An Empirical Analysis of the Risk of Overcapacity in the Coal Power Industry

4.1. Results of the Indicators’ Reduction and Correlation

Before indicators’ reduction and correlation, the min–max method was used to standardize the data. Then the CFS algorithm and the ARs algorithm were used to reduce and correlate, respectively, the indicators for assessing coal power overcapacity risk using the Python 3.7 software. In previous cases of research on association rules, the minimum support and minimum confidence were often set at around 0.4 and 0.6 [37]. In this study, we set the minimum support to 0.55 and the minimum confidence to 0.8 so as to retain the indicators that are strongly related to coal power overcapacity and judge the influencing direction of each indicator. As shown in Table 2, after the indicators reduction and correlation, 45 indicators are retained. Specifically, the CFS algorithm removes about 60% of indicators for each industry, and the results are in line with the normal reduction range of the CFS algorithm.
The retained indicators shown in Table 2 basically cover four dimensions, namely industry fundamentals, supply, demand, and industry performance. It is worth noting that the indicators of industry fundamentals are removed from the index system of the coal power industry and the new energy power industry. This is because the industry fundamentals do not have a direct and rapid impact on coal power capacity utilization. Besides, due to the state’s intervention and regulation in recent years, the fundamental change of the power industry is very limited. In sum, through index reduction and association, the redundancy between indicators is effectively reduced, which helps to improve the scientificity and rationality of the evaluation results.

4.2. Results of Indicators’ Weighting and Aggregation

The adjusted DEA model was used for indicators weighting and aggregation. Before calculating the composite index, we first took the opposite number of indicators that change inversely to the risk of overcapacity and homogenize it. This was achieved with the Lingo 12.0 software. Finally, the composite index of coal power overcapacity risk in 2008–2017 was obtained, as shown in Figure 3.
It is observed in Figure 3 that the composite index of coal power overcapacity risk fluctuated significantly from 2008 to 2017, and this fluctuation trend can be divided into four stages. Specifically, during the period between 2008 and 2011, the index shows a downward trend. Then, during the period between 2011 and 2013, the risk level shows an obvious inverted U-shaped fluctuation, first increasing sharply in 2012, then falling back to almost the 2011 level in 2013. However, during the period between 2013 and 2015, the index keeps on rising until 2015, when it reaches the highest level of the decade. Finally, during the period between 2013 and 2015, the index shows a low-speed downward trend. The risk of coal power overcapacity in China from 2008 to 2017 shows a cyclical feature of “decline-rise-decline,” and the risk level has remained high in recent years.

4.3. Robustness Test

The procedure for constructing a composite index may be critically judged because of the relatively subjective selection of methods in each step [38]. Therefore, it is necessary to test the robustness of the composite index aggregation scheme. In this study, in addition to the DEA weighting method, we also adopted the equal weighting method and the entropy weighting method to calculate the composite index of coal power overcapacity, and then we compared the different results, as shown in Figure 4.
The Pearson correlation coefficient was used to analyze the correlation between three groups of evaluation results. The correlation coefficient between the result obtained by DEA weighting and the result obtained by equal weighting was 0.81, while the correlation coefficient between the result obtained by DEA weighting and the result obtained by entropy weighting was 0.85, both showing a strong correlation. It indicates that the evaluation results using the DEA method are relatively robust. Besides, according to Figure 4, the fluctuation trend of the results of the three groups of the composite indexes of coal power overcapacity risk has no significant difference. Due to the difference between the weighting principle of the above methods, the corresponding results cannot be exactly the same in value, but the gap is not significant. The maximum difference is only 0.12, which is within a reasonable range. Therefore, it can be concluded that the composite index synthesis scheme proposed in this study has passed the robustness test.

4.4. Further Discussion

4.4.1. Analysis of the Causes of the Fluctuation Law of Coal Power Overcapacity Risk

To further explore the causes of the fluctuation law of coal power overcapacity risk, this study compares the fluctuation law of the composite index of coal power overcapacity risk and the contribution index of seven related industries successively, as shown in Figure 5a–h. The results show that:
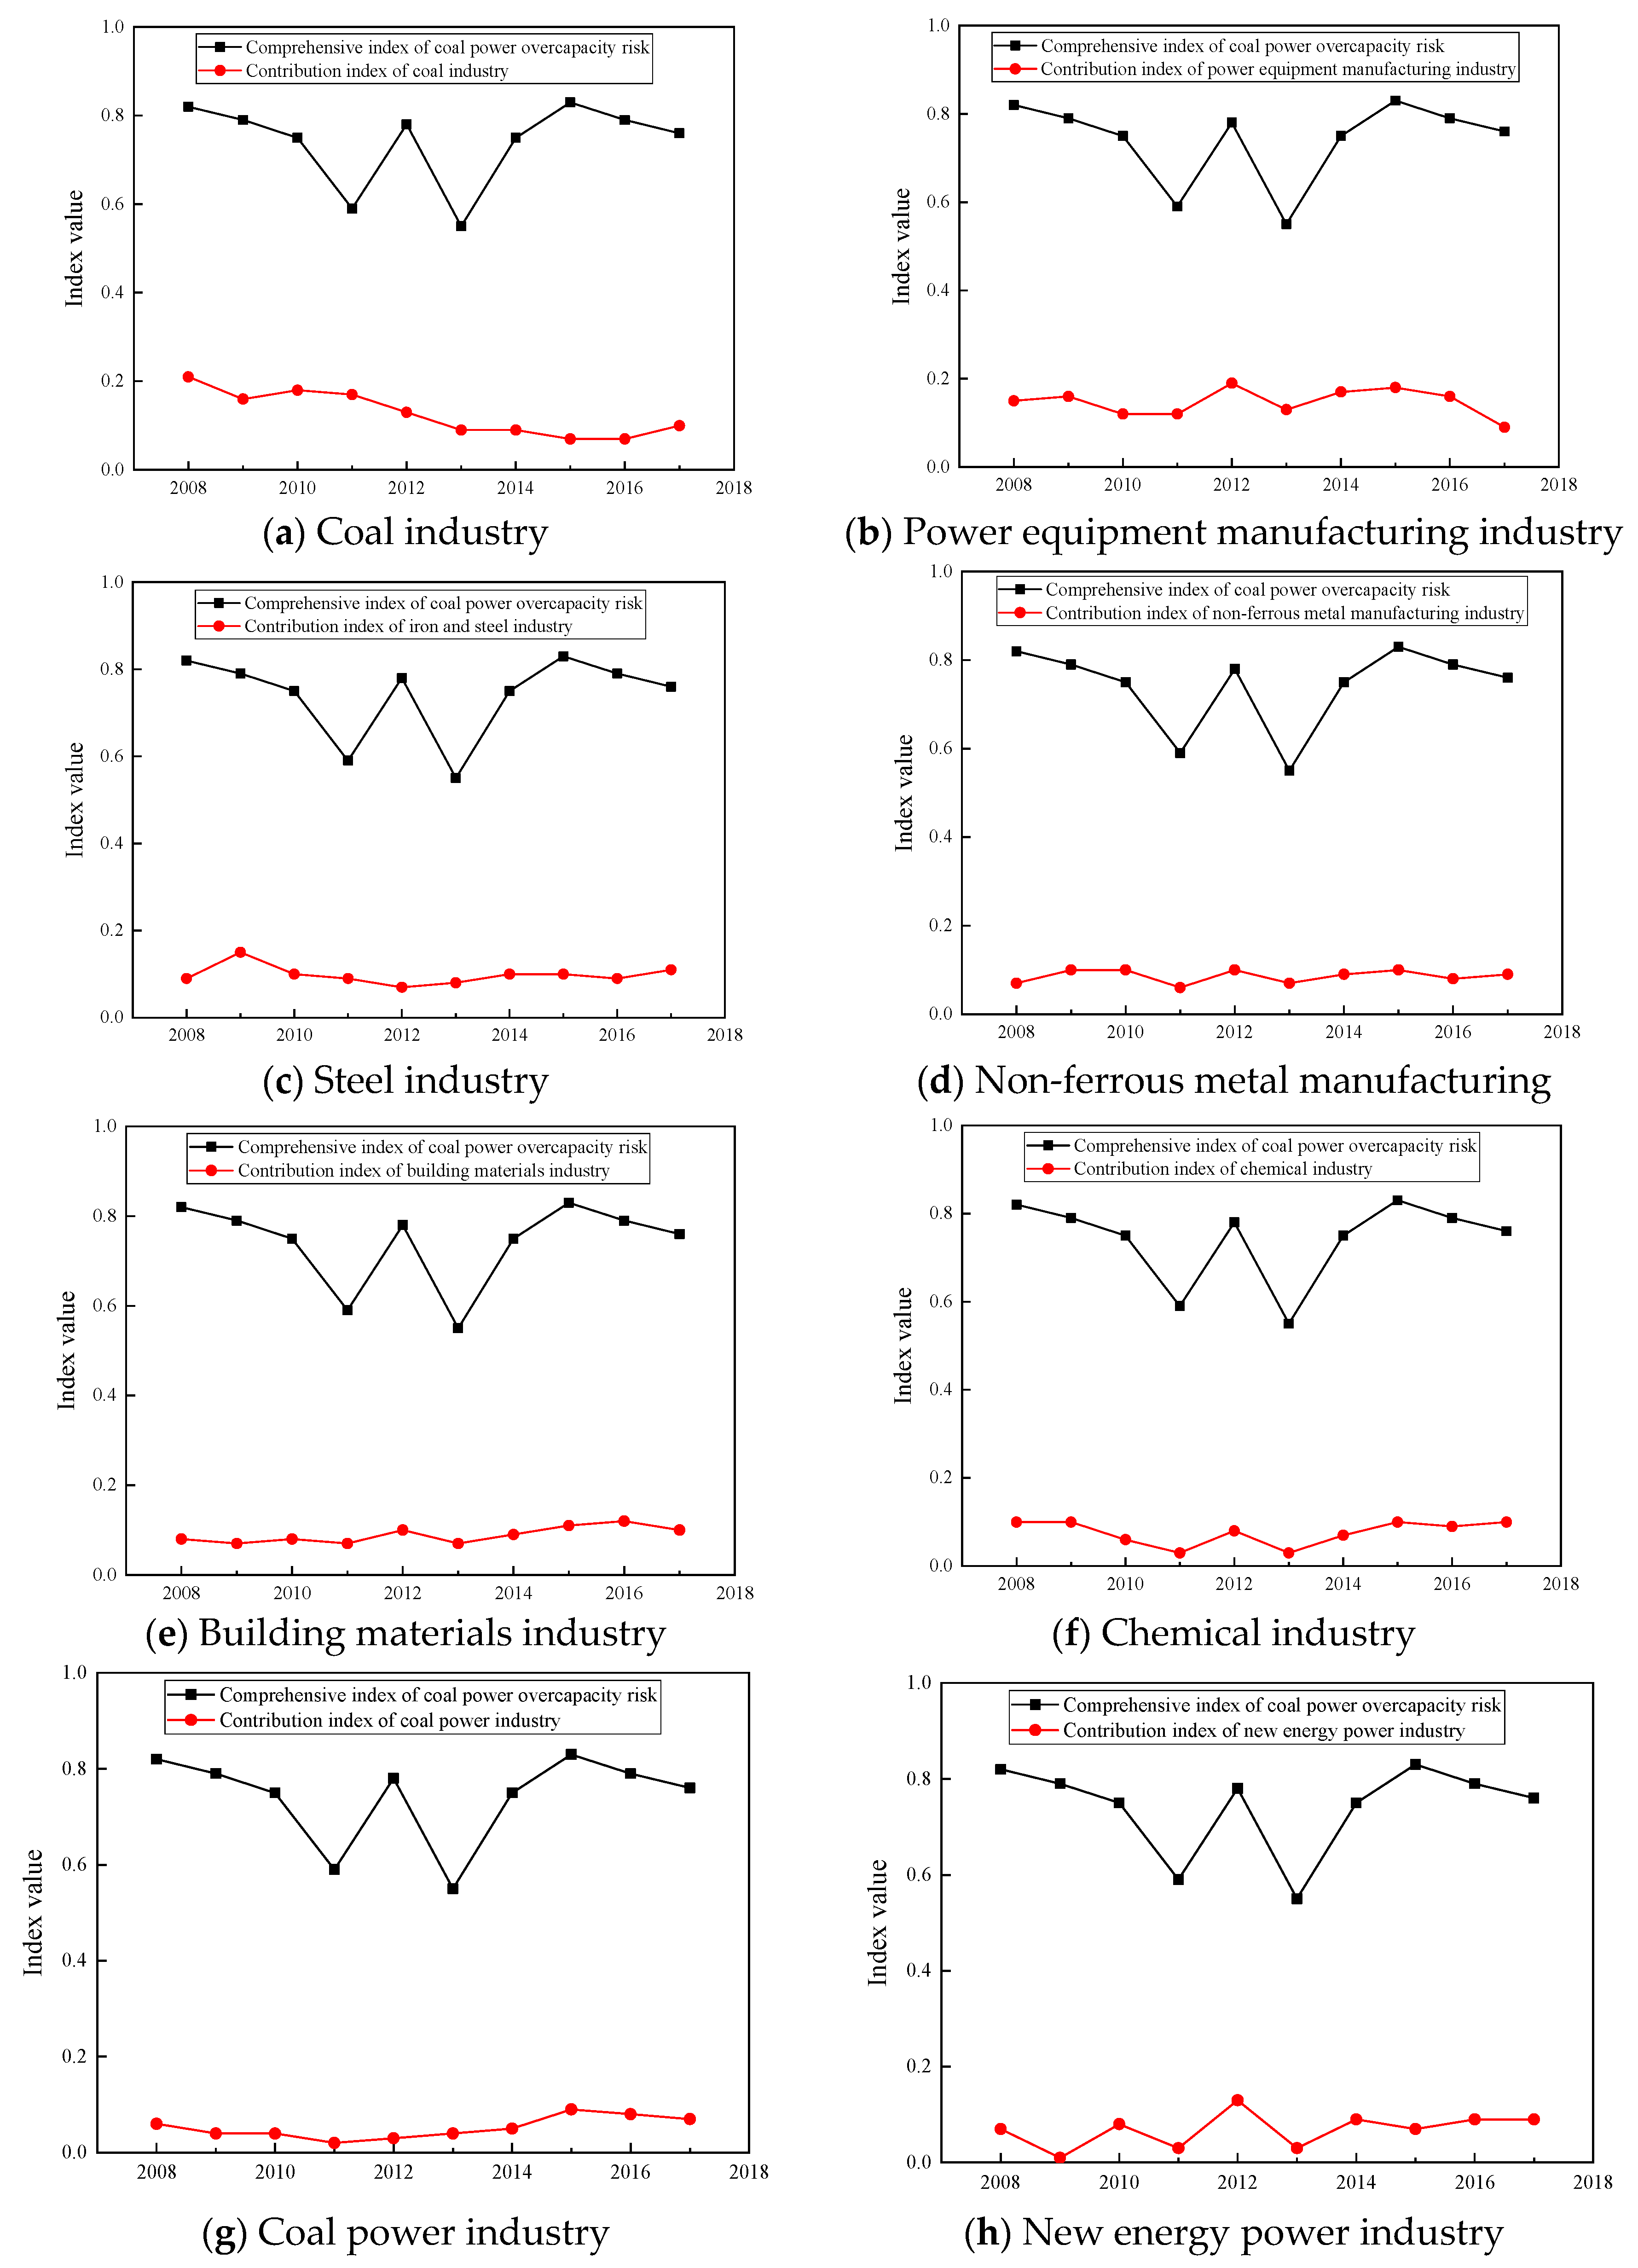
  • Between 2008 and 2011, the risk of coal power overcapacity keeps declining. At the same time, the contribution index curves of seven related industries show a downward trend. From 2008 to 2011, the coal power industry and its complementary and downstream industries showed good operating performance, with the input of production factors increasing steadily. On the contrary, the equipment utilization hours of the new energy power industry were at a low level, which was not a threat. These benefits jointly promote the reduction of the risk level of coal power overcapacity.
  • In 2012, the risk of coal power overcapacity increased sharply, and the contribution index curves of the complementary industry and most of the downstream industries showed similar fluctuations. In reality, these industries suffered from the deterioration of operating efficiency with supply such as credit, and the number of employees declining to varying degrees. Meanwhile, the equipment utilization hours of the new energy power industry increased by 12%, which further squeezed the living space of the coal power industry. In conclusion, the change in the operating mechanism of related industries ultimately affects the coal power industry, resulting in a sharp increase in the risk of coal power overcapacity.
  • In 2013, the risk of coal power overcapacity decreased significantly. Specifically, the power generation of the coal power industry resumed its growth while the equipment utilization hours of the new energy power industry showed negative growth. With the rapid growth of industrial sales value, the economic benefits of the power equipment manufacturing industry have improved significantly. At the same time, the performance of downstream industries also recovered, with the number of employees increasing by nearly 40%. These market changes will help resolve excess coal power capacity.
  • Since 2014, the risk level of coal power overcapacity rose until 2015, when it reached its highest level for a decade. Then in 2016 and 2017, it dropped slightly but was still at a relatively high level. In fact, the rise in this stage was mainly due to the deterioration of the operating conditions of the coal power industry, the power equipment manufacturing industry, and the four downstream industries. Eventually, the superposition of adverse factors derived from these industries makes the risk of overcapacity to rise again.
In general, the risk of coal power overcapacity is significantly affected by its related industries. The changes in operating conditions of related industries will act directly or indirectly on the supply and demand of coal power industry, eventually influencing its capacity utilization. Therefore, when examining the risk of coal power overcapacity, it is necessary to integrate the development characteristics of the coal power industry and the effects of related industries into the evaluation scope. It means that we should not only pay attention to the established factors that affect the coal power overcapacity risk, but also systematically consider random factors from its related industries.

4.4.2. The Identification of the Driving Factors of Coal Power Overcapacity

The existing literature often ignores the influence of the industry correlation effect when exploring the causes of overcapacity. In order to fill this gap, we used association analysis to track the influencing factors of coal power overcapacity. The support and confidence of each indicator calculated by association rules are arranged from high to low, and the influencing direction of each index was judged. The symbols CP, NE, PE, CO, ST, NF, BM, and CH, were used to represent eight industries respectively, including coal power, new energy power, power equipment, coal, steel, non-ferrous met-als, building materials, and the chemical industry, respectively. The results of the associa-tion analysis are shown in Table 3. It can be found that the upstream and downstream industries, as well as the complementary and alternative industries all have an impact on its overcapacity. Due to the lack of research on the impact of the environmental benefits and the fundamentals of related industries, this paper focused on studying them through industry correlation effects.
In terms of the impact of environmental benefit, the results showed that the higher the pollution emission intensity of the upstream coal industry and the downstream chemical industry, the lower the possibility of the coal power overcapacity. It should be noted that the serious pollution problem reflects the weak environmental regulations of the government, which reduces the marginal cost of upstream and downstream enterprises. Thus, there is a high probability that the coal power industry would not only obtain cheaper means of production but also achieve stronger market demand, which is conducive to resolving the excess capacity of coal power.
As far as the industry fundamentals are concerned, association analysis shows that the industrial concentration of the upstream industry and the capital intensity of the downstream industry are positively related to coal power overcapacity, while industrial concentration, marketization level, the employment elasticity of the downstream industry, and the industrial concentration of the complementary industry are all negatively related to coal power overcapacity. There are three reasons for this. First, the increase of industrial concentration strengthens the bargaining power of the upstream industry, which increases the marginal cost of the coal power industry and limits the reasonable utilization of the production capacity of the coal power. Second, the increase of industrial concentration, the marketization level, and the employment elasticity of downstream industries guarantees the operation of the market mechanism and provides downstream enterprises more space to adjust their operations flexibly. This helps coal power production enterprises obtain correct market information and enables them to adjust their operating strategies timely to reduce the risk of overcapacity. However, the increase of capital intensity in downstream industries raises the exit barriers and consequently, a large number of loss-making enterprises will be unable to exit in time, which ultimately misleads the production and investment decisions and may increase the potential risk of coal power overcapacity. Finally, the high industrial concentration of the complementary power equipment manufacturing industry helps to reduce disorderly competition and improve the profitability of the industry. Considering the mutually beneficial relationship between the power equipment manufacturing industry and the coal power industry, it is conducive to the healthy operation of the coal power industry.
Apart from the two above points, the new energy power industry also has a complicated connection of benefit with the coal power industry [39]. The results of association rules show that the high-speed growth of projects under construction and equipment utilization hours of the new energy power is highly related to the risk of coal power overcapacity. As an alternative industry, the new energy power industry such as wind and photovoltaic power industry inherently competes for power market with the coal power industry. With the slowdown of power demand and the increase of state’s support for the new energy industry, the survival and development space of coal power industry has been further compressed, increasing the risk of overcapacity and intensifying the contradiction between the two sides [40]. The result of association rules precisely reflects such a conflicting situation. Therefore, we can conclude that the rapid development of the new energy industry is positively related to coal power overcapacity risk.

5. Conclusions and Policy Implications

5.1. Conclusions

Considering the seriousness of overcapacity in China’s coal power industry and its importance in the sustainable development of the national economy, this study establishes a comprehensive index system based on an industry correlation mechanism. It proposes a CFS-ARs-DEA model for assessing coal power overcapacity risk. Through the robustness analysis, the reliability of the model and the stability of the results are verified. The main conclusions are as follows.
  • The comprehensive index system and model for assessing coal power overcapacity risk has remarkable advantages. First, the index system fully considers the industry correlation effect, and comprehensively covers the internal and external factors influencing coal power overcapacity. Second, the CFS-ARs-DEA integrated algorithm effectively reduces information redundancy from data features and avoids the subjectivity of index weighting and aggregation, thus helping to improve the scientificity of the risk assessment results of coal power overcapacity. This model provides an effective quantitative analysis tool for accurately identifying the risk level of industrial overcapacity and monitoring the trend of industrial overcapacity.
  • The empirical evaluation result of coal power overcapacity risk reveals the fluctuation law of overcapacity risk in China’s coal power industry between 2008 and 2017. From 2008 to 2017, the risk of coal power overcapacity presents a cyclical feature of “decline-rise-decline.” In 2016 and 2017, although the risk level was slowly declining, it was still at a high level. Besides, the risk of coal power overcapacity is significantly affected by the operation of related industries. From the perspective of environmental benefits, the constraints of environmental regulations of upstream and downstream industries will aggravate the overcapacity of the coal power industry. From the perspective of industry fundamentals, the increase of the industrial concentration of the upstream industry and the complementary industry, and the increase of capital intensity of the downstream industries aggravates the overcapacity of the coal power industry. The increase of industrial concentration, marketization level, and the employment elasticity of downstream industries can effectively restrain the overcapacity of the coal power industry.

5.2. Policy Implications

Based on the above conclusions, several policy recommendations are proposed to the Chinese government.
  • Establish and improve the monitoring and early warning mechanism of overcapacity risk in coal power industry. Government departments should systematically collect, summarize and analyze data of the whole coal power industry network, and constantly improve the statistical index system of overcapacity monitoring. It is necessary to avoid the ex-post assessment of overcapacity solely relying on the measurement of capacity utilization. Instead, a systematic analysis of the formation of overcapacity should be performed to accurately identify the potential risks. Specifically, a special information sharing platform should be established to release timely and transparent market information, so as to guide the coal power and other related enterprises to adjust their investment and production decisions. What is more, statistical departments can also rely on big data, cloud computing to dig out the causal association of data characteristics, which will help to systematically and accurately assess the state of overcapacity and potential risks.
  • It is of great significance to build a mechanism to resolve overcapacity from the overall perspective of industrial network. Our empirical results show that the impact of vertical and horizontal related industries of coal power industry on its overcapacity is significant. Therefore, in order to fundamentally control the overcapacity, the government should firstly improve the marketization level of the coal power industry and its related industries, giving full play to the guiding role of the market in investment. Secondly, the government should strengthen the vertical and horizontal strategic cooperation of the whole industry network, encourage the organic integration of the coal industry and the power industry through asset pooling and mutual equity participation, and promote the merger and reorganization of coal power enterprises of different sizes to improve the industry concentration. Finally, while encouraging the development of the new energy power industry, the government must comprehensively update the development planning of the coal power industry, so as to orderly allocate power generation capacity and guide the smooth exit of backward coal power capacity.
  • Government departments should control environmental regulation within the acceptable range of enterprises and establish a long-term mechanism to resolve overcapacity. As the association rules show, the increase of environmental regulation in upstream and downstream industries will aggravate the overcapacity of coal power industry. Therefore, while strengthening the industry environmental supervision, the government should ensure that the environmental regulation is reasonable and appropriate and adopt appropriate supervision measures. For example, the government can use more incentive and control measures such as environmental tax, emission trading and environmental subsidies to raise the market access threshold of high pollution and high energy consumption enterprises, and encourage enterprises to strengthen the innovation of production technology and industrial transformation. These measures are of benefit to realize the coordinated governance of environmental protection and overcapacity reduction of coal power industry.

Author Contributions

D.W.: Conceptualization, review and editing. X.X.: data curation, methodology, writing-original draft. Y.W.: Visualization, supervision, editing. All authors have read and agreed to the published version of the manuscript.

Funding

This research was funded by the National Natural Science Foundation of China (No. 72074210; No. 71573252), Social Science Foundation of Jiangsu Province (No. 18JD014), and the Think Tank of Energy Mining Economy (2018 Project for Cultural Evolution and Creation of CUMT 2018WHCC01).

Institutional Review Board Statement

Not applicable.

Informed Consent Statement

Not applicable.

Data Availability Statement

The datasets used and/or analyzed during the current study are available from the corresponding author on reasonable request.

Ethical approval and consent to participate

We declare that we do not have human participants, human data, or human tissue involved in the study.

Consent for publication

Not applicable.

Acknowledgments

We thank the anonymous reviewers for their constructive comments for improving the paper.

Conflicts of Interest

The authors declare that they have no conflict of interest.

References

  1. Yuan, J.; Li, P.; Wang, Y.; Liu, Q.; Shen, X.; Zhang, K.; Dong, L. Coal Power Overcapacity and Investment Bubble in China during 2015–2020. Energy Policy 2016, 97, 136–144. [Google Scholar] [CrossRef]
  2. Zhao, C.; Zhang, W.; Wang, Y.; Liu, Q.; Guo, J.; Xiong, M. The Economics of Coal Power Generation in China. Energy Policy 2017, 105, 1–9. [Google Scholar] [CrossRef]
  3. Zhang, H.; Zheng, Y.; Ozturk, U.A. The Impact of Subsidies on Overcapacity: A Comparison of Wind and Solar Energy Companies in China. Energy 2016, 94, 821–827. [Google Scholar] [CrossRef]
  4. Wang, Y.; Luo, G.; Guo, Y. Why Is There Overcapacity in China’s PV Industry in Its Early Growth Stage? Renew. Energy 2014, 72, 188–194. [Google Scholar] [CrossRef]
  5. Wang, D.; Wang, Y.; Song, X.; Liu, Y. Coal Overcapacity in China: Multiscale Analysis and Prediction. Energy Econ. 2018, 70, 244–257. [Google Scholar] [CrossRef]
  6. Feng, Y.; Wang, S.; Sha, Y.; Ding, Q.; Yuan, J. Coal Power Overcapacity in China: Province-Level Estimates and Policy Implications. Resour. Conserv. Recycl. 2018, 137, 89–100. [Google Scholar] [CrossRef]
  7. Ray, S.C. Nonparametric Measures of Scale Economies and Capacity Utilization: An Application to U.S. Manufacturing. Eur. J. Oper. Res. 2015, 245, 602–611. [Google Scholar] [CrossRef] [Green Version]
  8. Yang, G.; Fukuyama, H. Measuring the Chinese Regional Production Potential Using a Generalized Capacity Utilization Indicator. Omega 2018, 76, 112–127. [Google Scholar] [CrossRef]
  9. Wang, D.; Liu, Y.; Wang, Y.; Shi, X.; Song, X. Allocation of Coal De-capacity Quota among Provinces in China: A Bi-Level Multi-Objective Combinatorial Optimization Approach. Energy Econ. 2020, 87, 104709. [Google Scholar] [CrossRef]
  10. Lin, L.; Kahrl, F.; Liu, X. A Regional Analysis of Excess Capacity in China’s Power Systems. Resour. Conserv. Recycl. 2018, 129, 93–101. [Google Scholar] [CrossRef] [Green Version]
  11. Coussement, K.; Lessmann, S.; Verstraeten, G. A Comparative Analysis of Data Preparation Algorithms for Customer Churn Prediction: A Case Study in the Telecommunication Industry. Decis. Support Syst. 2017, 95, 27–36. [Google Scholar] [CrossRef]
  12. Pindyck, R.S. Irreversible Investment, Capacity Choice, and the Value of the Firm. Am. Econ. 1988, 969–985. [Google Scholar]
  13. Fusillo, M. Excess Capacity and Entry Deterrence: The Case of Ocean Liner Shipping Markets. Marit. Econ. Logist. 2003, 5, 100–115. [Google Scholar] [CrossRef]
  14. Nishimori, A.; Ogawa, H. Do Firms Always Choose Excess Capacity. Econ. Bull. 2004, 12, 1–7. [Google Scholar]
  15. Lin, Y.; Wu, H.; Xing, Y. “Wave Phenomenon” and Formation of Excess Capacity. Econ. Res. 2010, 10, 4–19. [Google Scholar]
  16. Qin, Q.; Jiao, Y.; Gan, X.; Liu, Y. Environmental Efficiency and Market Segmentation: An Empirical Analysis of China’s Thermal Power Industry. J. Clean Prod. 2020, 242, 118560. [Google Scholar]
  17. Yuan, J.; Lei, Q.; Xiong, M.; Guo, J.; Hu, Z. The Prospective of Coal Power in China: Will It Reach a Plateau in the Coming Decade? Energy Policy 2016, 98, 495–504. [Google Scholar] [CrossRef]
  18. Zhang, Y.; Nie, R.; Shi, R.; Zhang, M. Measuring the Capacity Utilization of the Coal Sector and Its Decoupling with Economic Growth in China’s Supply-Side Reform. Resources 2018, 129, 314–325. [Google Scholar] [CrossRef]
  19. Yang, G.; Fukuyama, H.; Song, Y. Estimating Capacity Utilization of Chinese Manufacturing Industries. Socio-Econ. Plan. Sci. 2019, 67, 94–110. [Google Scholar] [CrossRef]
  20. Han, G.; Wang, L. Capacity Utilization and the Safety Monitoring of Steel Industry in China from the Year 2000 to 2010. Reform 2012, 8, 31–41. [Google Scholar]
  21. Shi, R.; Fan, X.; He, Y. Comprehensive Evaluation Index System for Wind Power Utilization Levels in Wind Farms in China. Renew. Sust. Energ. Rev. 2017, 69, 461–471. [Google Scholar] [CrossRef]
  22. Dobos, I.; Vörösmarty, G. Green Supplier Selection and Evaluation Using DEA-Type Composite Indicators. Int. J. Prod. Econ. 2014, 157, 273–278. [Google Scholar] [CrossRef]
  23. Kotzee, I.; Reyers, B. Piloting a Social-Ecological Index for Measuring Flood Resilience: A Composite Index Approach. Ecol. Indic. 2016, 60, 45–53. [Google Scholar] [CrossRef]
  24. Neelawela, U.D.; Selvanathan, E.A.; Wagner, L.D. Global Measure of Electricity Security: A Composite Index Approach. Energy Econ. 2019, 81, 433–453. [Google Scholar] [CrossRef]
  25. Cigdem, O.; Demirel, H. Performance Analysis of Different Classification Algorithms Using Different Feature Selection Methods on Parkinson’s Disease Detection. J. Neurosci. Methods 2018, 3091, 81–90. [Google Scholar]
  26. Kushal, T.R.B.; Illindala, M.S. Correlation-Based Feature Selection for Resilience Analysis of MVDC Shipboard Power System. Int. J. Electr. Power Energy Syst. 2020, 117, 105732. [Google Scholar]
  27. Czibula, G.; Marian, Z.; Czibula, I.G. Software Defect Prediction Using Relational Association Rule Mining. Inf. Sci. 2014, 264, 260–278. [Google Scholar] [CrossRef]
  28. Carnovale, S.; Yeniyurt, S.; Rogers, D.S. Network Connectedness in Vertical and Horizontal Manufacturing Joint Venture Formations: A Power Perspective. J. Purch. Supply Manag. 2017, 23, 67–81. [Google Scholar] [CrossRef]
  29. Schlag, C.; Zeng, K. Horizontal Industry Relationships and Return Predictability. J. Empir. Financ. 2019, 53, 310–330. [Google Scholar]
  30. Sun, W.; Dong, K.; Zhao, T. Market Demand Dynamic Induced Mechanism in China’s Steel Industry. Resour. Policy 2017, 51, 13–21. [Google Scholar] [CrossRef]
  31. Du, W.; Li, M. Can Environmental Regulation Promote the Governance of Excess Capacity in China’s Energy Sector? the Market Exit of Zombie Enterprises. J. Clean Prod. 2019, 207, 306–316. [Google Scholar] [CrossRef]
  32. Guyon, I.; Elisseeff, A. An Introduction to Variable and Feature Selection. J. Mach. Learn. Res. 2003, 3, 1157–1182. [Google Scholar]
  33. Doshi, M.; Chaturvedi, S. Correlation based feature selection (CFS) technique to predict student Perfromance. Int. J. Comput. Vis. 2014, 6, 197–206. [Google Scholar] [CrossRef]
  34. Li, T.; Li, Y.; An, D.; Han, Y.; Xu, S.; Lu, Z.; Crittenden, J. Mining of the Association Rules between Industrialization Leveland Air Quality to Inform High-Quality Development in China. J. Environ. Manag. 2019, 246, 564–574. [Google Scholar] [CrossRef] [PubMed]
  35. Zhou, P.; Ang, B.W.; Poh, K.L. A Mathematical Programming Approach to Constructing Composite Indicators. Ecol. Econ. 2007, 62, 291–297. [Google Scholar] [CrossRef]
  36. Hatefi, S.M.; Torabi, S.A. A Common Weight MCDA-DEA Approach to Construct Composite Indicators. Ecol. Econ. 2010, 70, 114–120. [Google Scholar] [CrossRef]
  37. Nahar, J.; Kevin, T.; Tickle, S.; Chen, Y.P.P. Association Rule Mining to Detect Factors Which Contribute to Heart Disease in Males and Females. Expert Syst. Appl. 2013, 40, 1086–1093. [Google Scholar] [CrossRef]
  38. Dobbie, M.J.; Dail, D. Robustness and Sensitivity of Weighting and Aggregation in Constructing Composite Indices. Ecol. Indic. 2013, 29, 270–277. [Google Scholar]
  39. Ming, Z.; Ping, Z.; Shunkun, Y.L.H. Overall Review of the Overcapacity Situation of China’s Thermal Power Industry: Status Quo, Policy Analysis and Suggestions. Renew. Sust. Energ. Rev. 2017, 76, 768–774. [Google Scholar] [CrossRef]
  40. Yuan, J.; Xu, Y.; Zhang, X. China’s 2020 Clean Energy Target: Consistency, Pathways and Policy Implications. Energy Policy 2014, 65, 692–700. [Google Scholar] [CrossRef]
Figure 1. The basic principle of the assessment model of coal power overcapacity risk.
Sustainability 13 01426 g001
Figure 2. Correlation mechanism of the industry.
Sustainability 13 01426 g002
Figure 3. Risk assessment results of coal power overcapacity from 2008 to 2017.
Sustainability 13 01426 g003
Figure 4. Results of the robustness test.
Sustainability 13 01426 g004
Figure 5. Comparison between the composite index of coal power overcapacity risk and the contribution index of its related industries.
Sustainability 13 01426 g005
Table 1. Initial index system of coal power overcapacity risk assessment.
Upstream, Downstream and Complementary Industries (Including 6 Industries of Coal, Steel, Non-Ferrous Metals, Building Materials, Chemical Industry and Power Equipment Manufacturing)Coal Power IndustryAlternative Industries
(New Energy Power Industry)
DimensionIndicatorNumberIndicatorNumberIndicatorNumber
Industry fundamentalsIndustrial ConcentrationL1Industrial ConcentrationH1Industrial ConcentrationJ1
Marketization levelL2Opening degreeH2Opening degreeJ2
Capital intensityL3
Opening degreeL4
Employment elasticityL5
SupplyGrowth rate of enterprisesL6Growth rate of installed capacityH3Growth rate of installed capacityJ3
Growth rate of fixed asset investmentL7Growth rate of projects under constructionH4Growth rate of projects under constructionJ4
Growth rate of reconstruction and technological transformation expenditure L8Growth rate of completed electric power investmentH5Growth rate of completed electric power investmentJ5
Growth rate of employees’ average wageL9Growth rate of power generationH6Growth rate of power generationJ6
Growth rate of employeesL10
Labour productivityL11
Growth rate of financial expensesL12
DemandGrowth rate of industrial sales valueL13Growth rate of the whole power consumption H7Growth rate of the whole power consumption J7
Inventory turnoverL14
Growth rate of inventoryL15
Production sales ratioL16
PerformanceGrowth rate of sales profit L17Growth rate of total profitH8Growth rate of equipment utilization hours J8
Growth rate of main business incomeL18Growth rate of equipment utilization hours H9
Growth rate of turnover times of working capitalL19Capacity utilizationH10
Deficit areaL20Pollution emission intensityH11
Growth rate of lossL21
Asset liability ratioL22
Growth rate of accounts receivableL23
price indexL24
Pollution emission intensityL25
Number of initial indicators 150 11 8
Table 2. Results of indicators reduction and correlation.
CoalPower Equipment Steel Non−Ferrous MetalsBuilding Materials Chemical Coal Power New Energy Power
DimensionNumberReductionCorrelationReductionCorrelationReductionCorrelationReductionCorrelationReductionCorrelationReductionCorrelationReductionCorrelationReductionCorrelationReductionCorrelation
Industry fundamentalsL1Ret+Ret Ret H1RetDelJ1RetDel
L2 Ret RetDel H2 J2
L3 Ret+RetDelRetDelRet+
L4
L5RetDelRetDel Ret
SupplyL6 H3 J3Ret
L7Ret+ RetDelRet H4Ret+J4Ret+
L8 Ret Ret H5 J5
L9 H6RetJ6
L10Ret+RetRetRetRetRet
L11
L12 RetRet Ret
DemandL13 Ret RetDelRetRetDelH7 J7
L14 Ret H8
L15Ret+ Ret+
L16 Ret Ret
Industry performanceL17 H9RetJ8Ret+
L18Ret H10
L19 RetRet RetH11Ret
L20 Ret+ Ret+
L21
L22 RetDel
L23RetDel Ret+Ret+
L24Ret+ RetDel
L25Ret RetDel RetDelRet
Number of retained776666 4 3
Table 3. Association analysis results of factors influencing coal power overcapacity.
IndicatorsSupportConfidenceRankInfluencing DirectionIndicatorsSupportConfidenceRankInfluencing Direction
Capacity utilization of CP111Growth rate of inventory of NF0.6714+
Growth rate of power generation of CP0.8912Growth rate of turnover times of working capital of NF0.6714
Growth rate of employees of PE0.8912Growth rate of employees of BM0.6714
Growth rate of installed capacity of NE0.7813Growth rate of accounts receivable of BM0.6714+
Growth rate of main business income of CO0.7813Growth rate of turnover times of working capital of CH0.6714
Marketization level of ST0.7813Growth rate of reconstruction and technological transformation expenditure of PE0.56 15
Growth rate of financial expenses of ST0.7813Deficit area of PE0.5615+
Growth rate of employees of NF0.7813Growth rate of employees of CO0.56 15+
Production sales ratio of BM0.7813Growth rate of inventory of CO0.5615+
Growth rate of financial expenses of BM0.7813Price index of CO0.56 15+
Pollution emission intensity of CH0.7813Pollution emission intensity of CO0.56 15
Growth rate of projects under construction of CP0.6714+Capital intensity of ST0.56 15+
Growth rate of total profit of CP0.6714Growth rate of employees of ST0.56 15
Growth rate of projects under construction of NE0.6714+Inventory turnover of ST0.56 15
Growth rate of equipment utilization hours of NE0.6714+Growth rate of turnover times of working capital of ST0.56 15
Industrial concentration of PE0.6714Growth rate of fixed asset investment of NF0.56 15
Production sales ratio of PE0.6714Growth rate of industrial sales value of BM0.56 15
Growth rate of financial expenses of PE0.6714Growth rate of reconstruction and technological transformation expenditure of BM0.56 15
Growth rate of industrial sales value of PE0.6714Capital intensity of CH0.56 15+
Industrial concentration of CO0.6714+Employment elasticity of CH0.56 15
Growth rate of fixed asset investment of CO0.6714+Growth rate of employees of CH0.56 15
Industrial concentration of NF0.6714Deficit area of CH0.56 15+
Growth rate of accounts receivable of NF0.6714+
Publisher’s Note: MDPI stays neutral with regard to jurisdictional claims in published maps and institutional affiliations.

