
An Energy-Resilient Retrofit Methodology to Climate Change for Historic Districts. Application in the Mediterranean Area


Abstract
1. Introduction
1.1. Climate Change and the Urban Built Environment
- Reflective materials and cool roofs based on the maximization of solar radiation reflection and dissipation. Thus, cool materials represent efficient solutions for mitigating both local overheating air and temperatures of building surfaces. In Europe, cool roof potentialities have been supported by Synnefa and Santamouris [20,21,22] and the European Union, promoting the Cool Roofs Project and establishing the European Cool Roof Council (ECRC). The effectiveness of cool roofs in Mediterranean residential buildings was analyzed by [23,24,25,26,27,28,29];
- Reflective products combined with phase change materials (PCMs); specifically, in addition to the positive effect of cool materials, researchers have combined latent heat storage materials with solar reflective materials to reduce and delay the peak heat load, leading to important energy savings and improving thermal comfort conditions [30]. Relevant research in testing and applications in the Mediterranean area have been described in [30,31,32,33];
- Green roofs are currently considered a key technology to interplay with outdoor air conditions in order to mitigate the UHI phenomenon [10,34] and improve the thermal and energy performance of the built environment, both during the summery and wintry seasons [26]. As with previous solutions, green roofs were fully tested and discussed for residential buildings in the Mediterranean area in [35,36,37,38,39,40].
1.2. Historic Districts in Mediterranean Cities and Resilient Strategies for Climate Change
1.3. The Work Aim
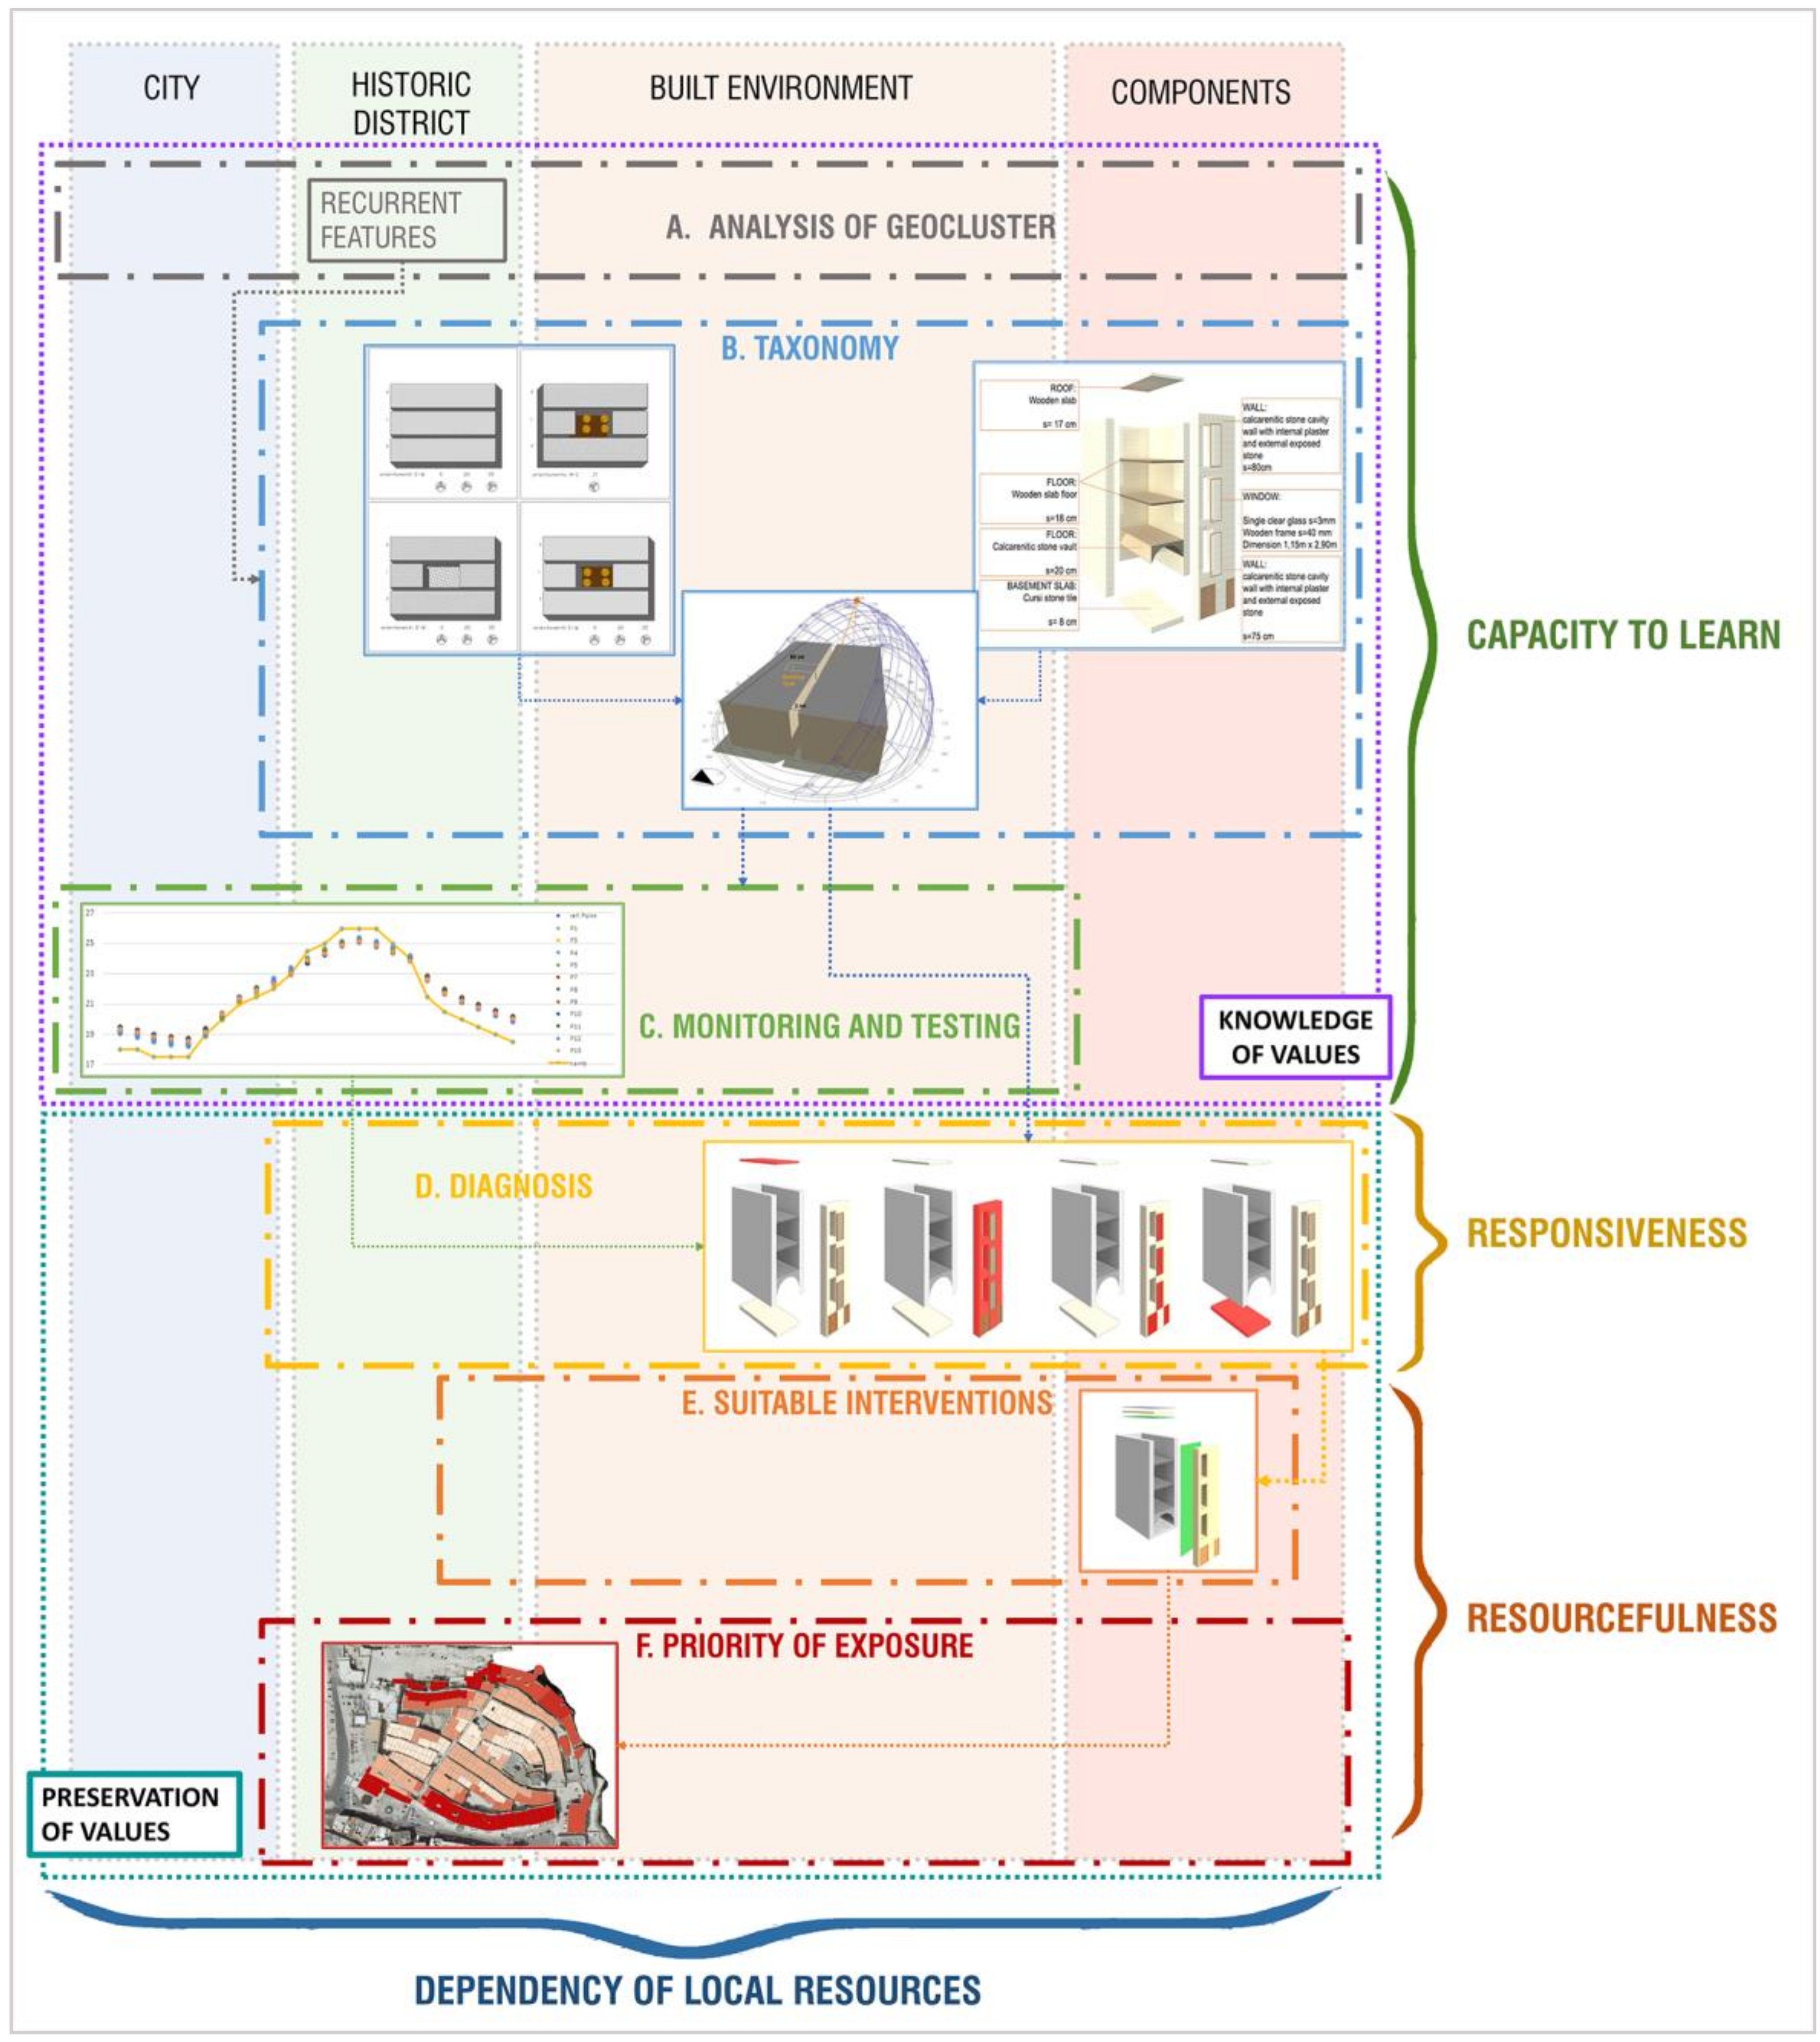
2. Materials and Methods
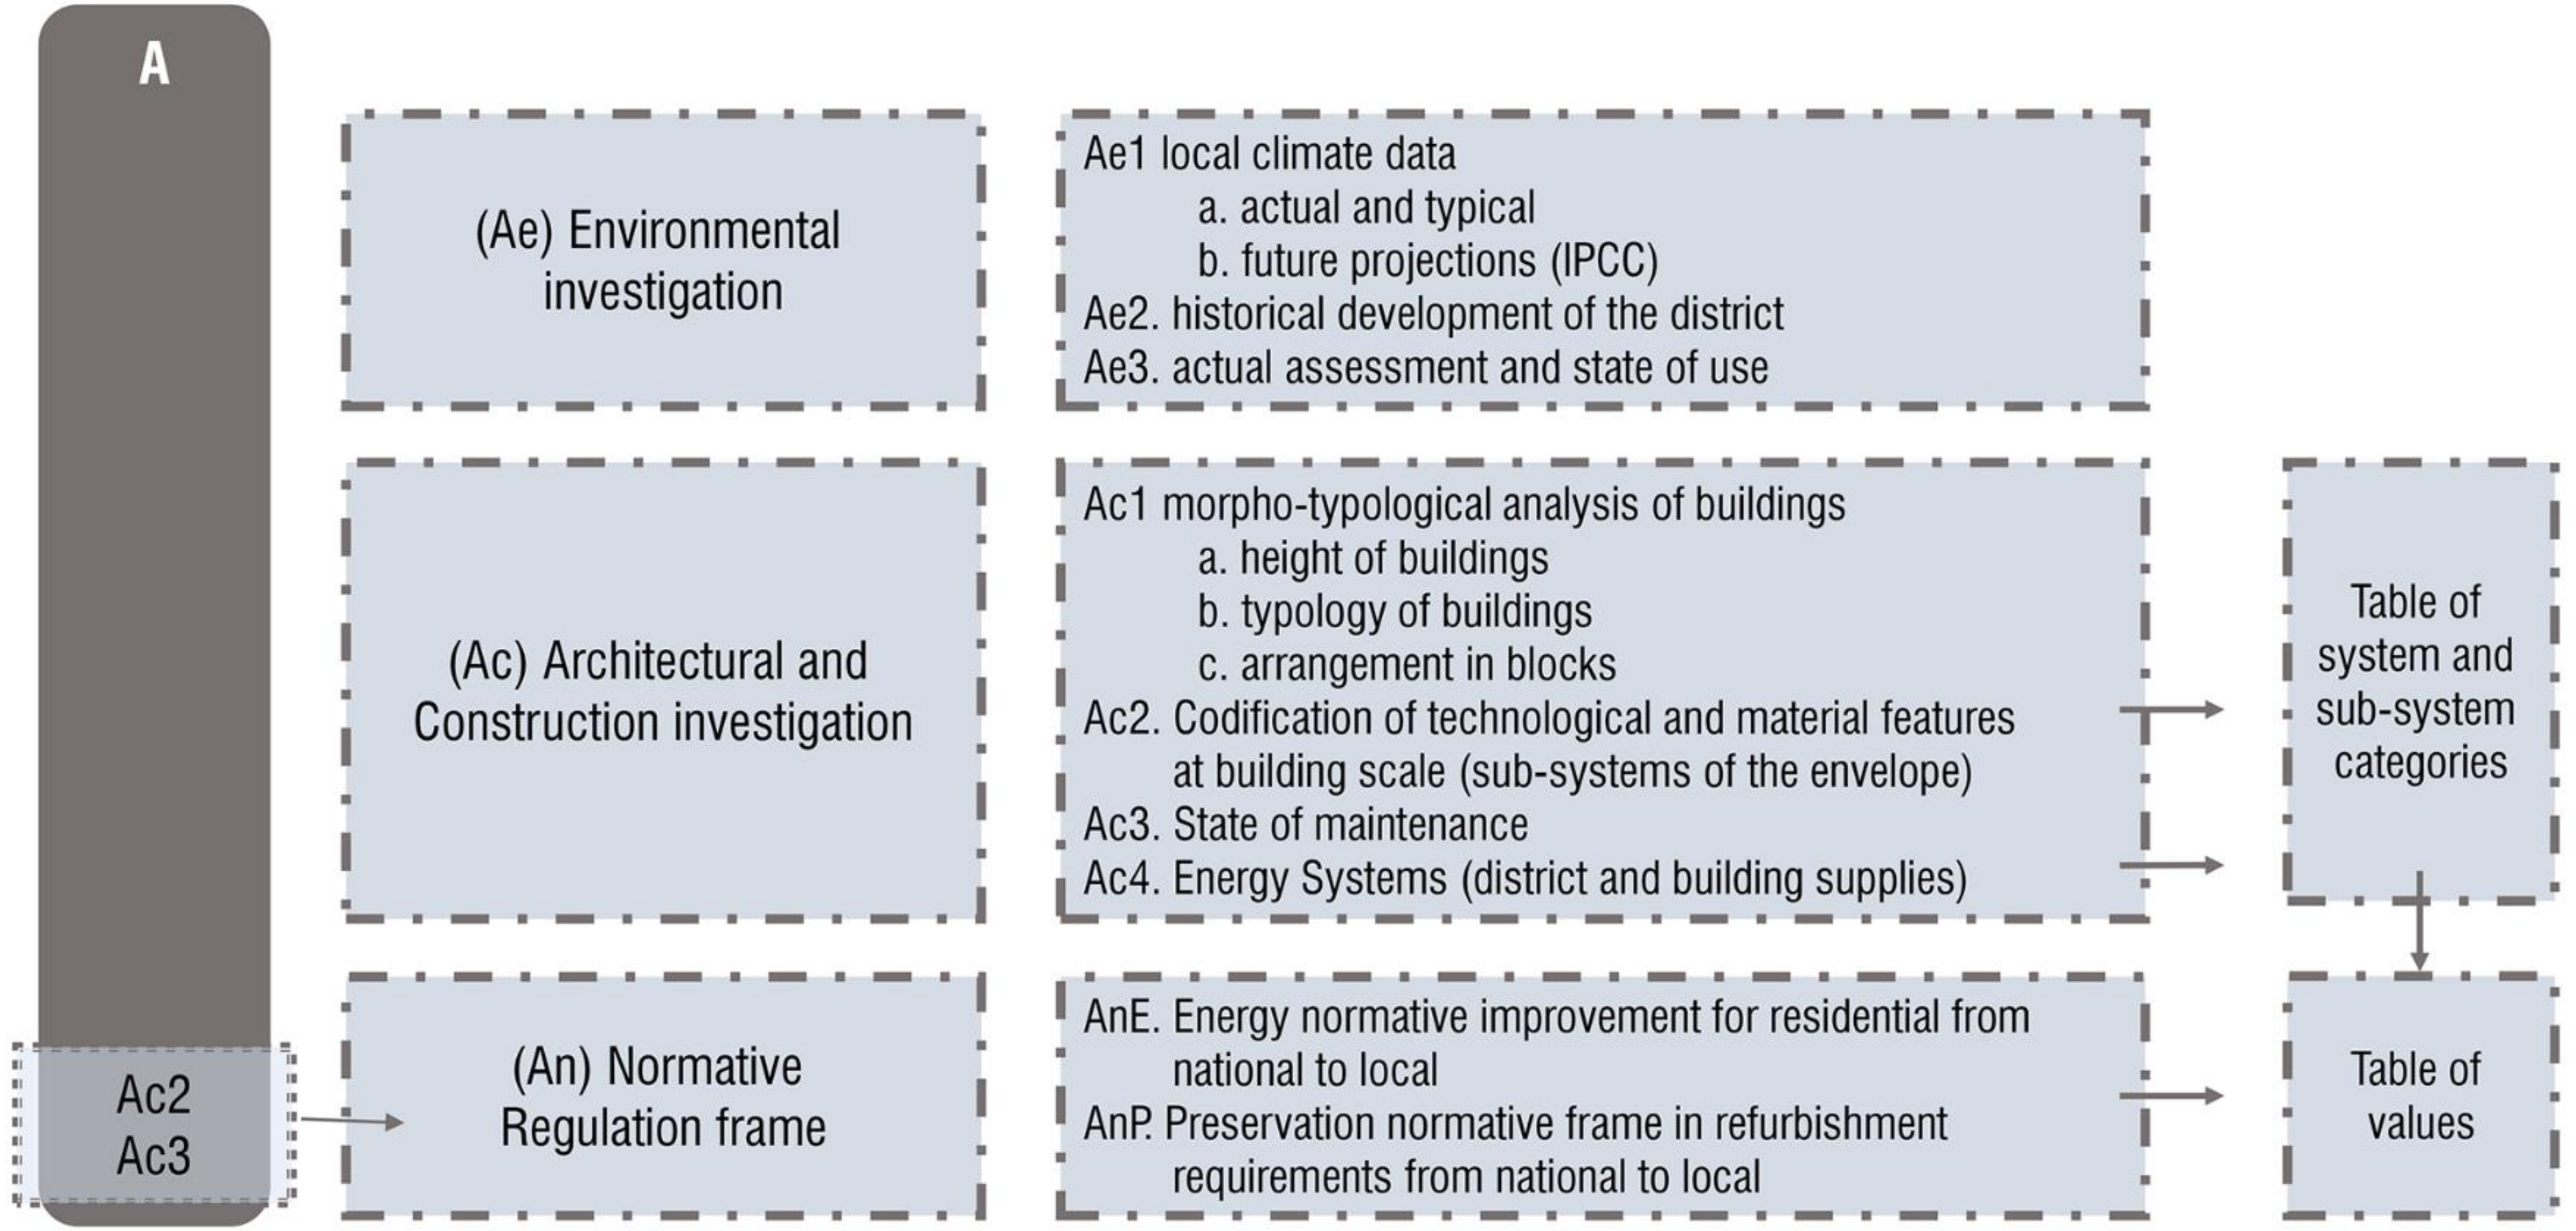
- A.
- Analytic Phase (Figure 2), involving a systematic investigation of environmental (Ae), architectural and construction (Ac) features and regulation norms for energy improvement (AnE) and preservation (AnP) on different scales. Notably, data are classified into specific fields, as follows:
- Ae
- Environmental field, for the investigation of:
- Ae1.a
- Typical and actual local climate features including statistical and historical monitored data used for the classification of typical climate on national, regional and local scales; focusing on the latter, the support of research activities in other fields, when applicable, can strongly support the management and collection of more detailed data;
- Ae1.b
- Projection of the local climate, referring to the stochastic global changes introduced in IPCC scenarios;
- Ae2
- Historical development of the district, focusing on the main characteristics of the use of land over time for development;
- Ae3
- Urban assessment and state of use, focusing on the use of buildings, services, energy distribution grids and traffic regulations;
- Ac
- Architectural and construction features, as analyses of:
- Ac1
- Morpho-typological characteristics of buildings on a district scale, referring to height, typologies and relationships with the asset of the districts; these data may be collected using archival and bibliographic records, and through on-site investigations;
- Ac2
- Codification of building features in a Table of categories of systems and subsystems categories which assess the predominant technologies and materials of the built envelope and energy systems in order to define possible transformations; in this case, direct on-site tests (stratigraphy, material properties) may be required;
- Ac3
- State of maintenance and the actual state of use of the residential stock on the district and building scales;
- Ac4
- Energy systems available on the building scale, focusing on cooling and heating, when data are available. Energy systems are translated in specific alphanumeric codes, providing the Ac2 collected features in the Table of systems and subsystems categories.
- An
- Energy improvement (AnE) and Preservation regulations (AnP) from the national to local scale, toward compliance with the national normative framework; overlapping built features and preservations thresholds, a Table of values is useful to summarize the provided data.
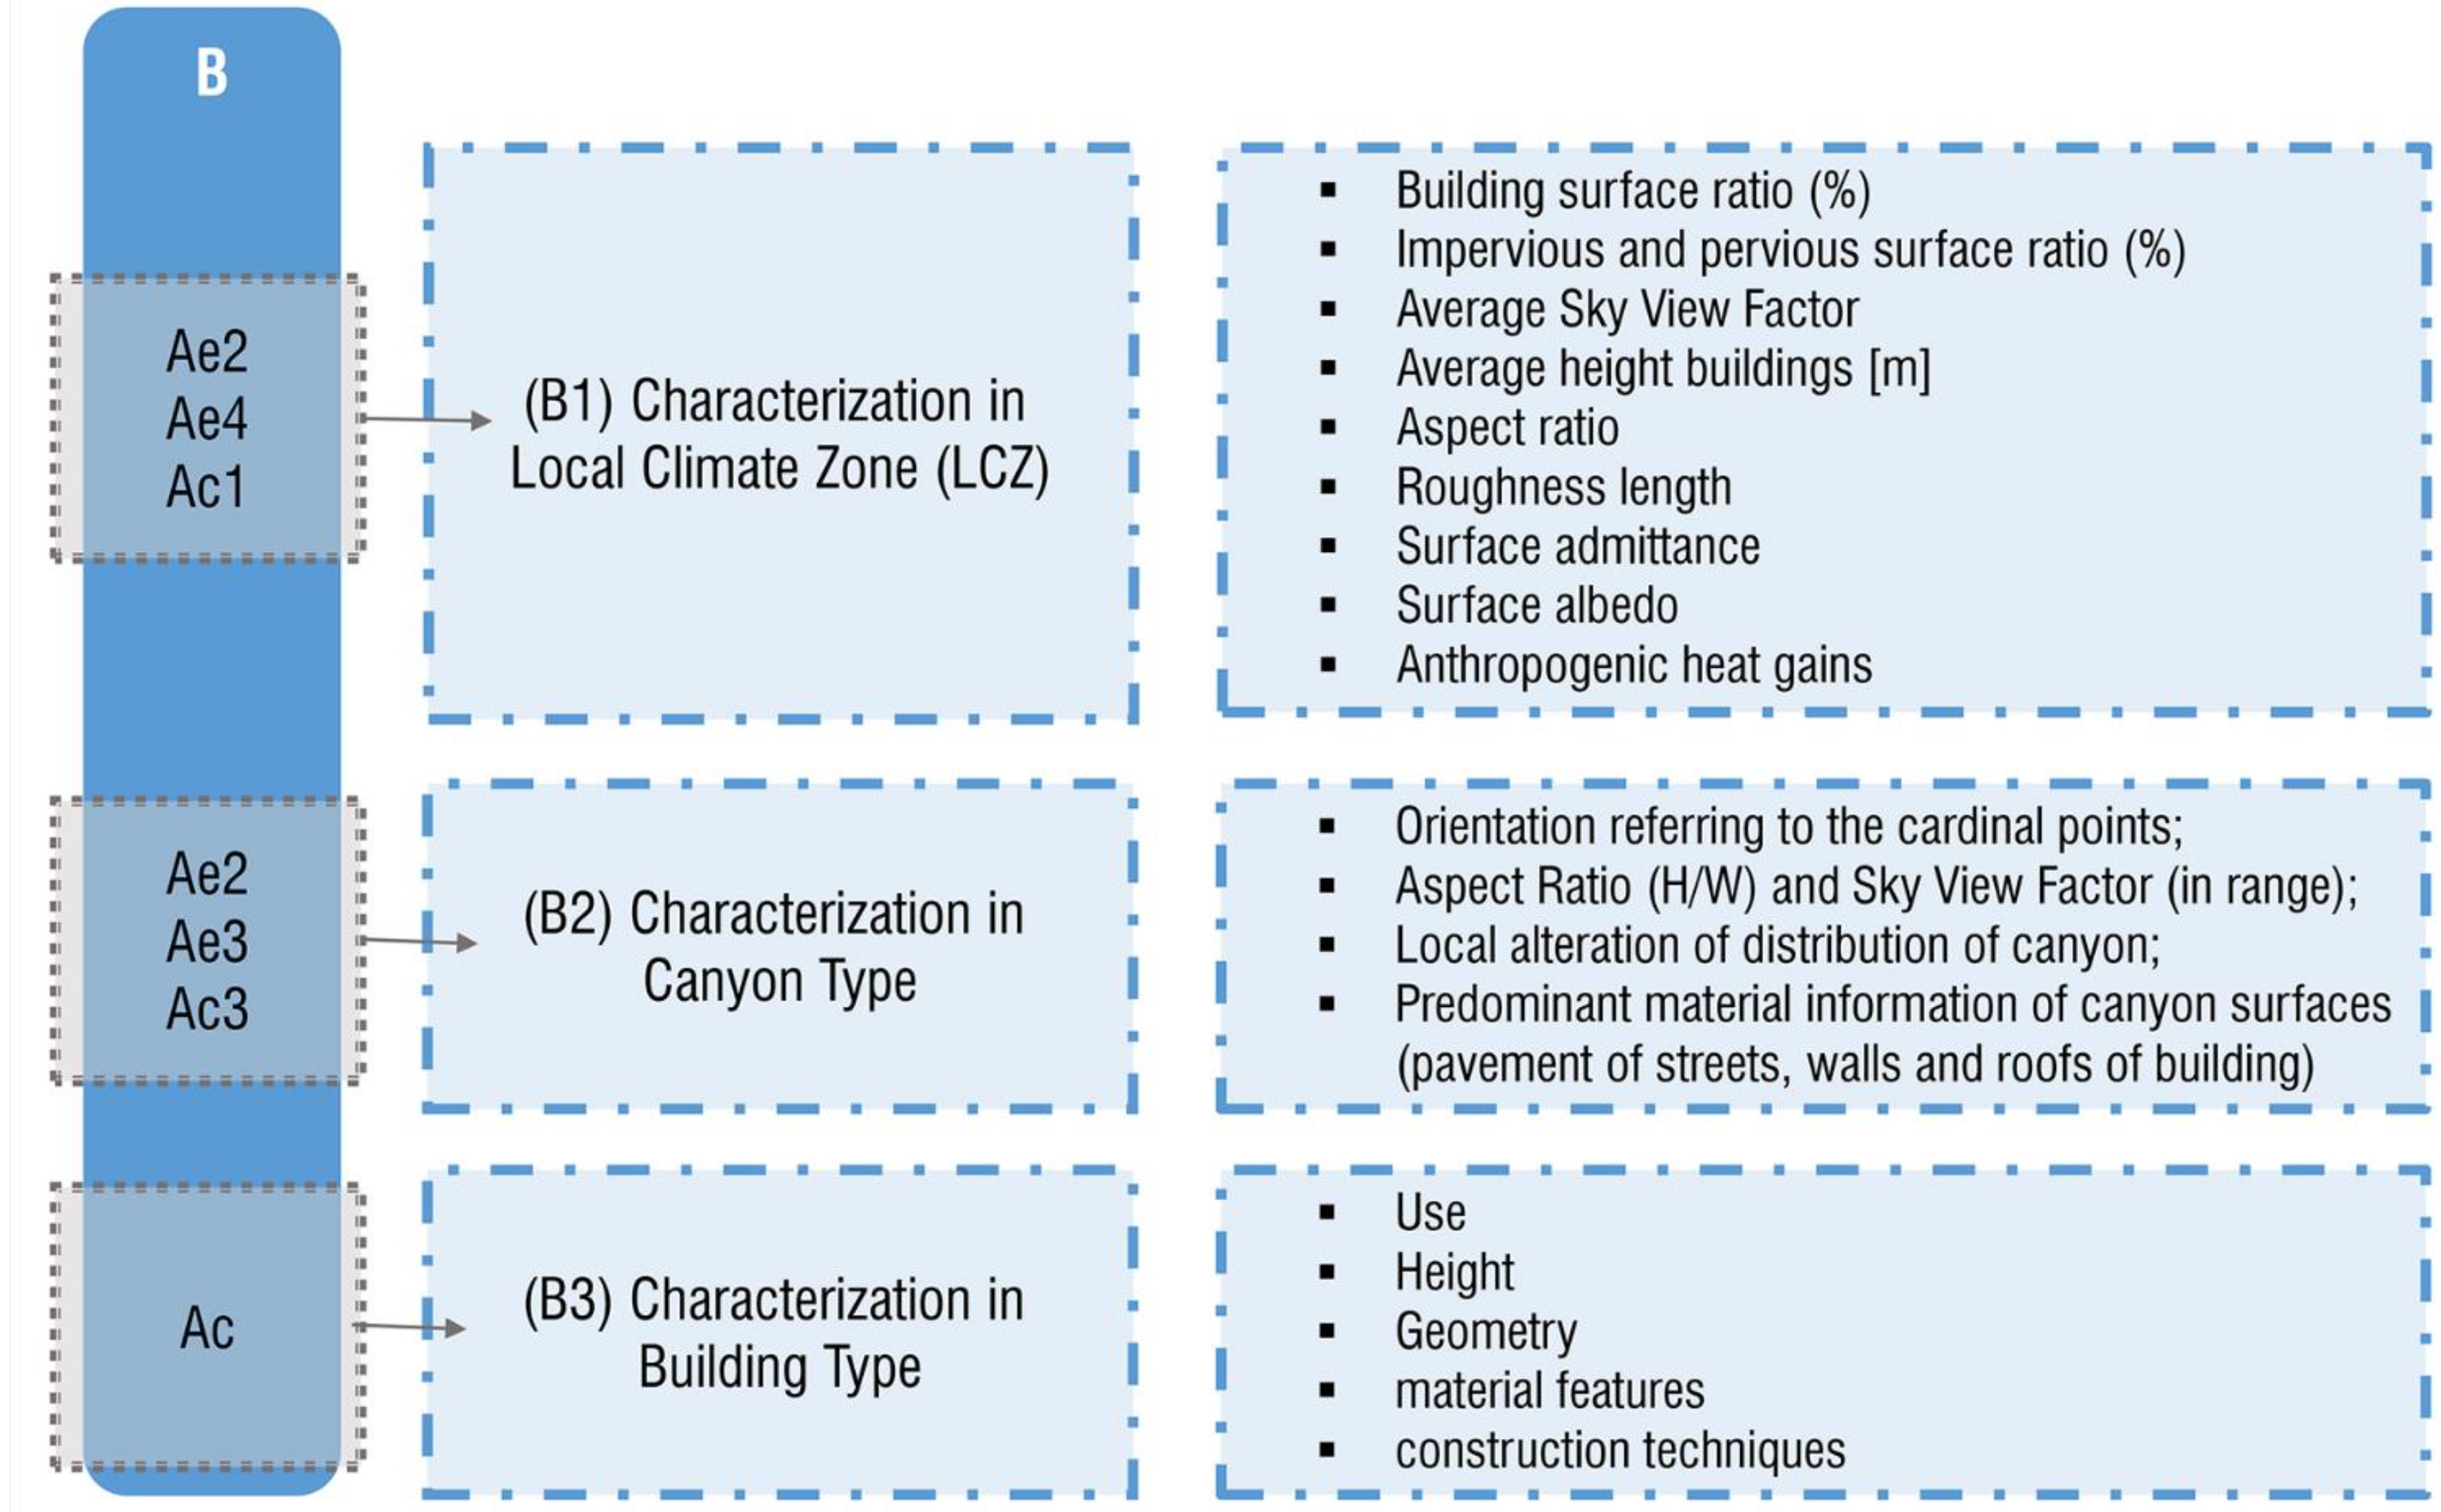
- B.
- The Taxonomy phase (Figure 3) represents the codification of all the data collected in the previous phase aiming at identifying a limited number of illustrative cases to support the aim of extending the results to similar cases and to analyze their representativeness. In fact, the “types” should be representative of different levels of information and interactions of the system and its elements with the environment, aiming at:
- B1.
- Characterization in the Local Climate Zone, as the first macro-parametrization of the whole district using the LCZ characterization process [13]; in particular, the district is analyzed focusing on the geometric and surface cover features, and thermal, radiative and metabolic properties collected in Ae2, Ae4, Ac1, to provide a building surface ratio (%), impervious and pervious surface ratio (%), average Sky View Factor (-), average building height [m], aspect ratio (-), roughness length (classes), surface admittance [J/(m2 s1/2 K)], surface albedo (-) and anthropogenic heat gains [Wm−2];
- B2.
- Characterization of “Canyon Type” as the result of a detailed analysis of data collected in Ae3, Ae2 and Ac3; it aims at delineating a system of representative street canyons in terms of main orientation (cardinal) and geometrical features, i.e., aspect ratio (H/W), Sky View Factor (SVF) and local alteration of the street canyon distribution in the district, as well as information on the street canyon surface materials (pavement of streets, walls and roofs of buildings).
- B3.
- Characterization of “Building Type” resulting from the taxonomical analysis of predominant use, height, geometrical and material features and construction techniques identified in detailed subphases of Ac. This Type presents the minimum representative element of whole interactions, and is useful for identifying transformation strategies.
- C.
- Monitoring and Testing phase of local behavior (Figure 4) constitutes the main instrument with which to monitor external dynamic processes in the long-term and, relating to the present, to provide a connection between taxonomy and diagnosis on different scales. For these reasons, it represents the main phase of the methodology aimed at the recognition of inherent qualities (adapting ones) and vulnerabilities. For this phase, two steps are considered:
- C1.
- Monitoring of local microclimate is the main instrument for the identification and assessment of relationships between building arrangements in historical districts and the local climate. In fact, according to the difficulty of identifying real and local behavior, measures should be taken to provide a system of comparable measurements between standard and similar instruments in different physical positions. Moreover, it could be useful to compare the representativeness of measurements with the LCZ classification on the district scale. To these ends, WMO guidelines should be followed to achieve a robust campaign, following practical reference indications; specifically, the measure points should be located at a comparable height and use a specific system to limit errors and overheating of the sensors; focusing on the choice of site, three measure points should be determined, taking into account:
- The choice of representative measurement points (E1) inside the historic center; following the identification of the “Canyon Type” in phase B2, this monitoring point should be representative of the widespread characteristics, avoiding local exceptions (geometry, materials);
- An external measurement point (E2) in an undisturbed area; such a zero-reference point must be representative of the exposure of local weather conditions;
- A comparative point (E3), located externally to the historic district, that is representative of the rest of the city and referring to an intermediate point between the historic district and external undisturbed conditions.
- C2.
- Testing Data aims at the assessment of exceptions in local climate conditions and system behavior due to of local differences on a district scale. For these purposes, monitored data may be analyzed:
- C2.1
- Temporally, aiming to identify local anomalies, relative to historical data;
- C2.2
- Testing Spatial variation of behaviour, using monitored data to check the reference point of measure (E1) and its horizontal variations by means of ENVI-met©. The district is modelled with the objectives of:
- C2.2a
- Firstly, testing the reference measure point to validate horizontal measurements, using and calibrating physical features of materials (Ac2) at the street canyon scale, and then extending the test horizontally to the wider district model;
- C2.2b
- Testing behavior in extreme conditions (if measured in C2.2b) on the same model; in this case, the recognition of extreme events follows the definition of the Warm-Spell index [78], and provides the opportunity to assess adaptive behavior in the reference point and the differences on the district scale, changing from typical to extreme conditions.
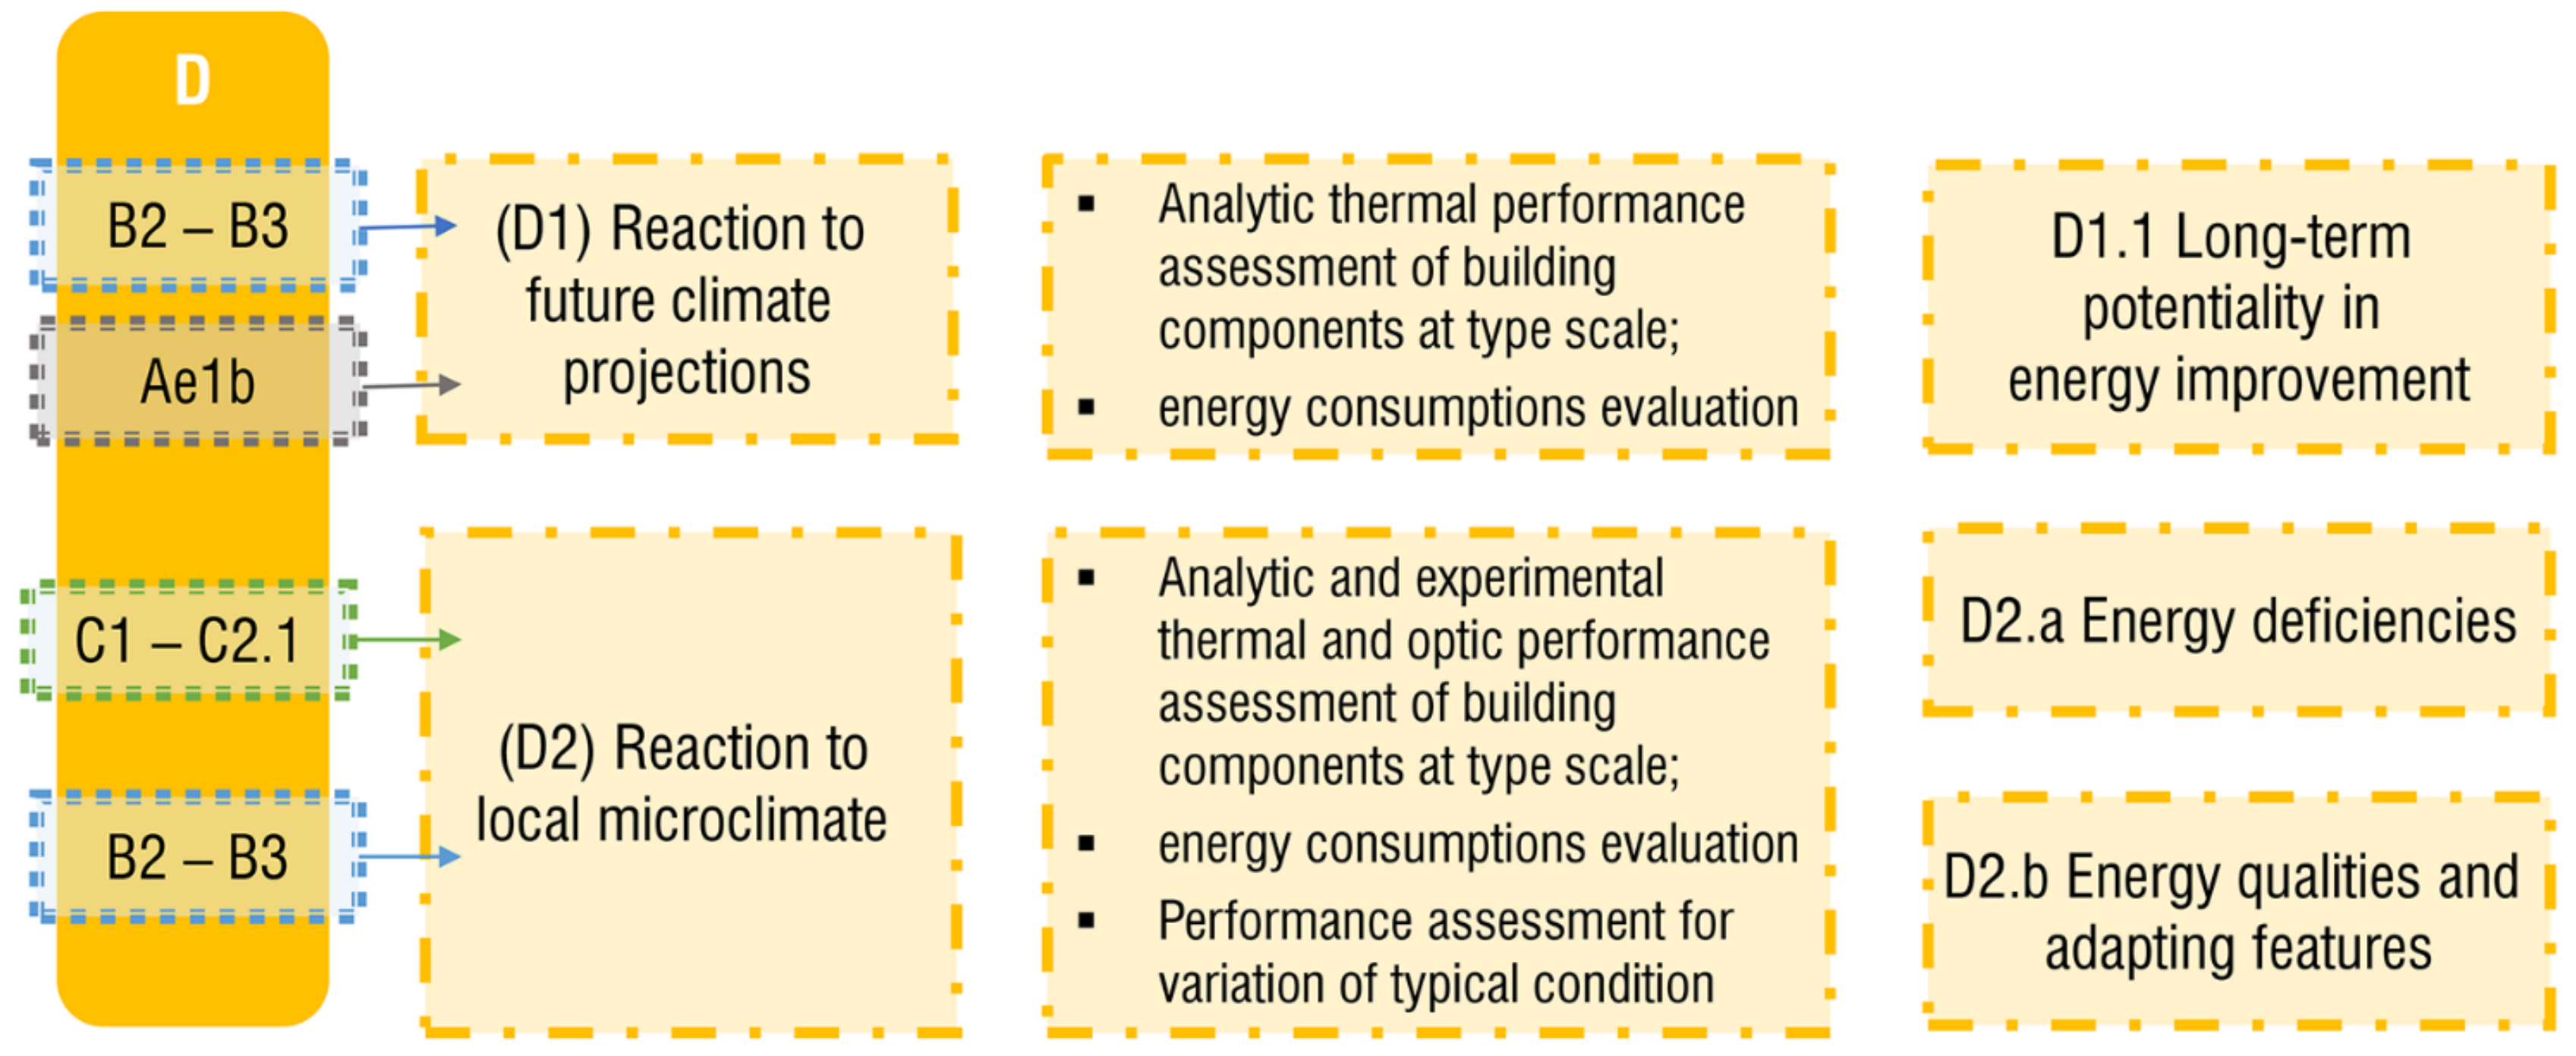
- D.
- The Diagnosis phase (Figure 5) concerns the study of energy consumption according to building type. Recognition of typical microclimate and local exceptions in the district and the physical and thermal features of the building envelope makes it possible to assess energy deficiencies and building pathologies, on one hand, and to recognize distinctive features of the original fabric, such as interactions with microclimates and the inherent qualities of the building, on the other. Specifically, diagnoses are the result of an iterative process of energy consumption variations, aiming at the characterization of behavior in term of:
- D1.
- Reactions to climate change projections, referring to the different statistical weather conditions analyzed in phase Ae1.b, in order to determine the long-term potential of energy improvements;
- D2.
- Reaction to the local microclimates based on the reference point data and the generated microclimates along street canyons, as observed in C2.2. In this subphase, energy qualities and adapting features, as well as energy deficiencies, are assessed both at the street canyon and building type scales, focusing respectively on microclimate variations and the properties of the envelope subsystem.
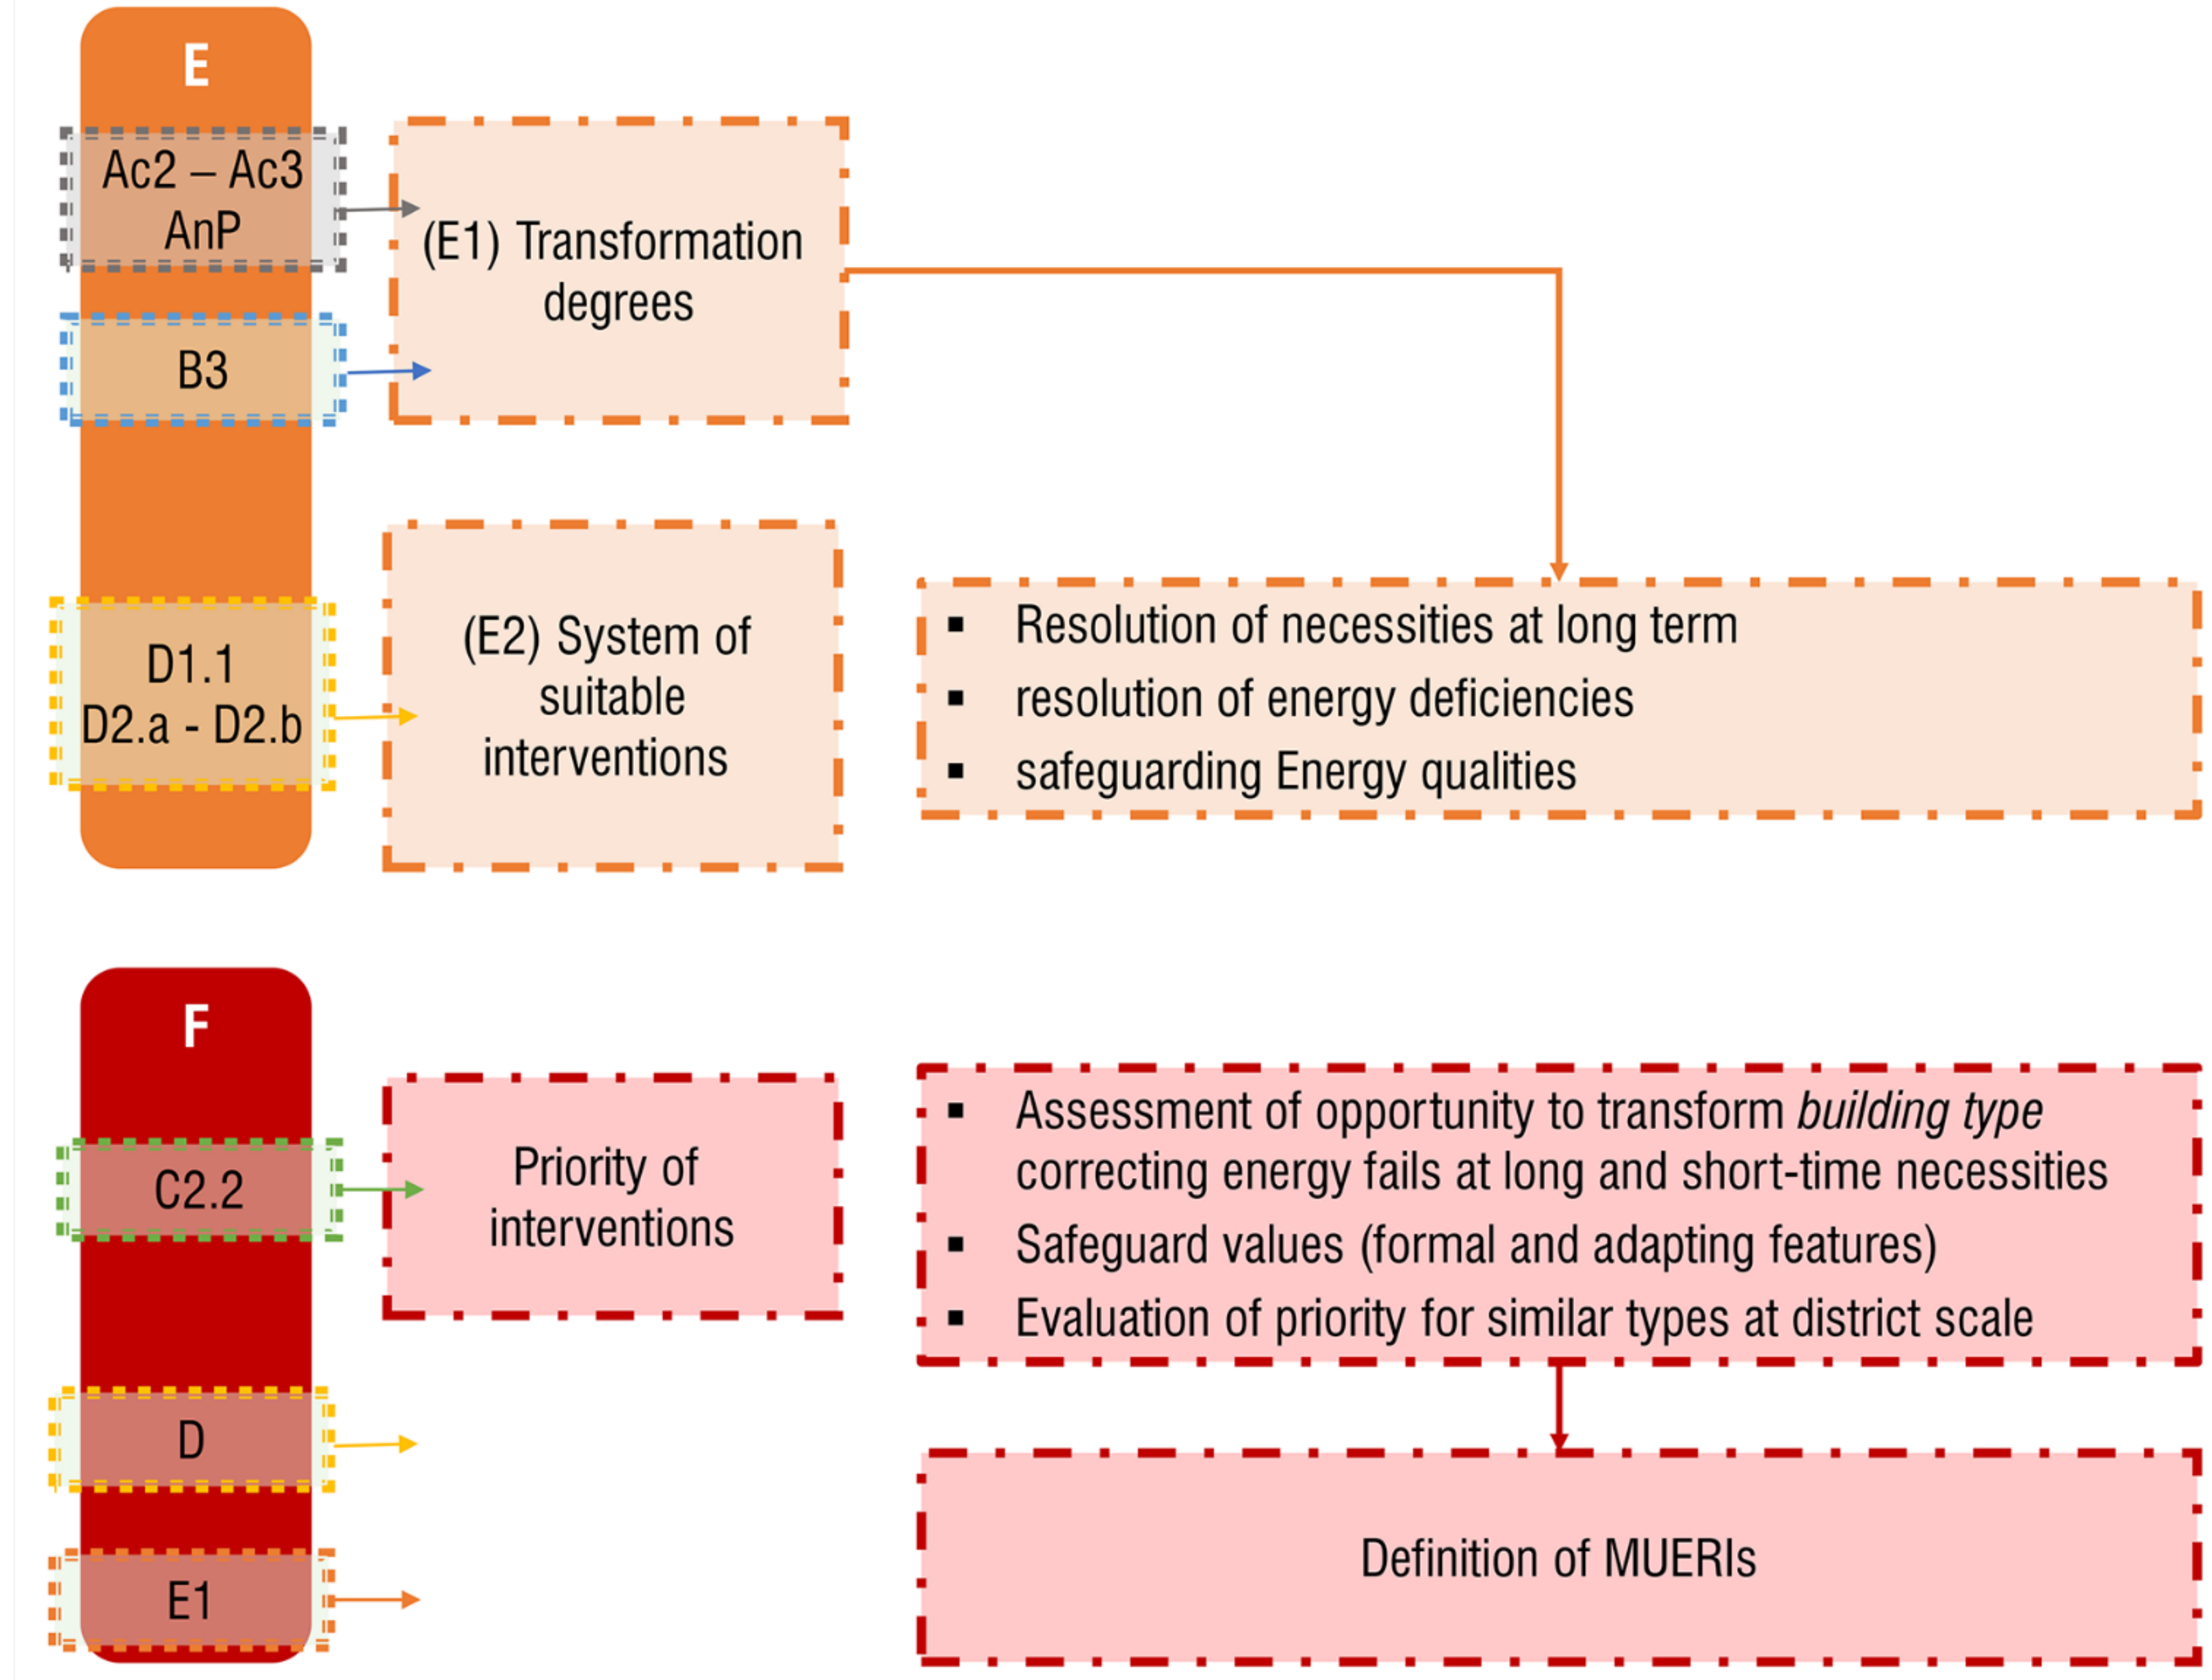
- E.
- Taxonomy of suitable interventions (Figure 6); here, all the deficiencies delineated in the previous phase are assessed in terms of possible transformation of the system and preservation regulations (AnP). Specifically:
- E1.
- According to resilience thinking, the “transformability” of a building describes the capacity to correct its present vulnerabilities. The definition of Transformation Degree, namely the building attitude to be modified without altering its historical and architectural features, is introduced as the combination of the state of maintenance (Ac3) and the formal values (AnP) on a building scale;
- E2.
- As the second step, transformation solutions are combined with preservation codes, as a System of suitable interventions, referring to the mitigation and adaptation of technical solutions; in particular, the developed solutions for each critical building component are conceived as design guidelines and best practices to be translated into the selection of technological solutions, based on both traditional and innovative products and systems for energy efficiency. The solutions are chosen to address energy deficiencies according to weaknesses, with present-day and long-term perspectives, in order to safeguard the appropriate qualities.
- F.
- Assessment of priorities for intervention (Figure 6) on the district scale, delineating an integrated system of recurrent “resilient” units. In this sense, different levels of adaptability on the street canyon scale, as defined in C2.2, and the transformability of vulnerable elements on the building scale serve to identify different combinations of “Minimum Unit of Energy-Resilient Intervention” (MUERI); these units should help in creating scenarios for the overall regeneration of homogenous urban/building areas, involving common priorities and controlled actions supported by technical datasheets. Notably, datasheets include all the information about MUERI type in terms of location, exposure level, transformability degree of the envelope subsystems, etc. Additionally, it can be useful to schedule and guide transformations.
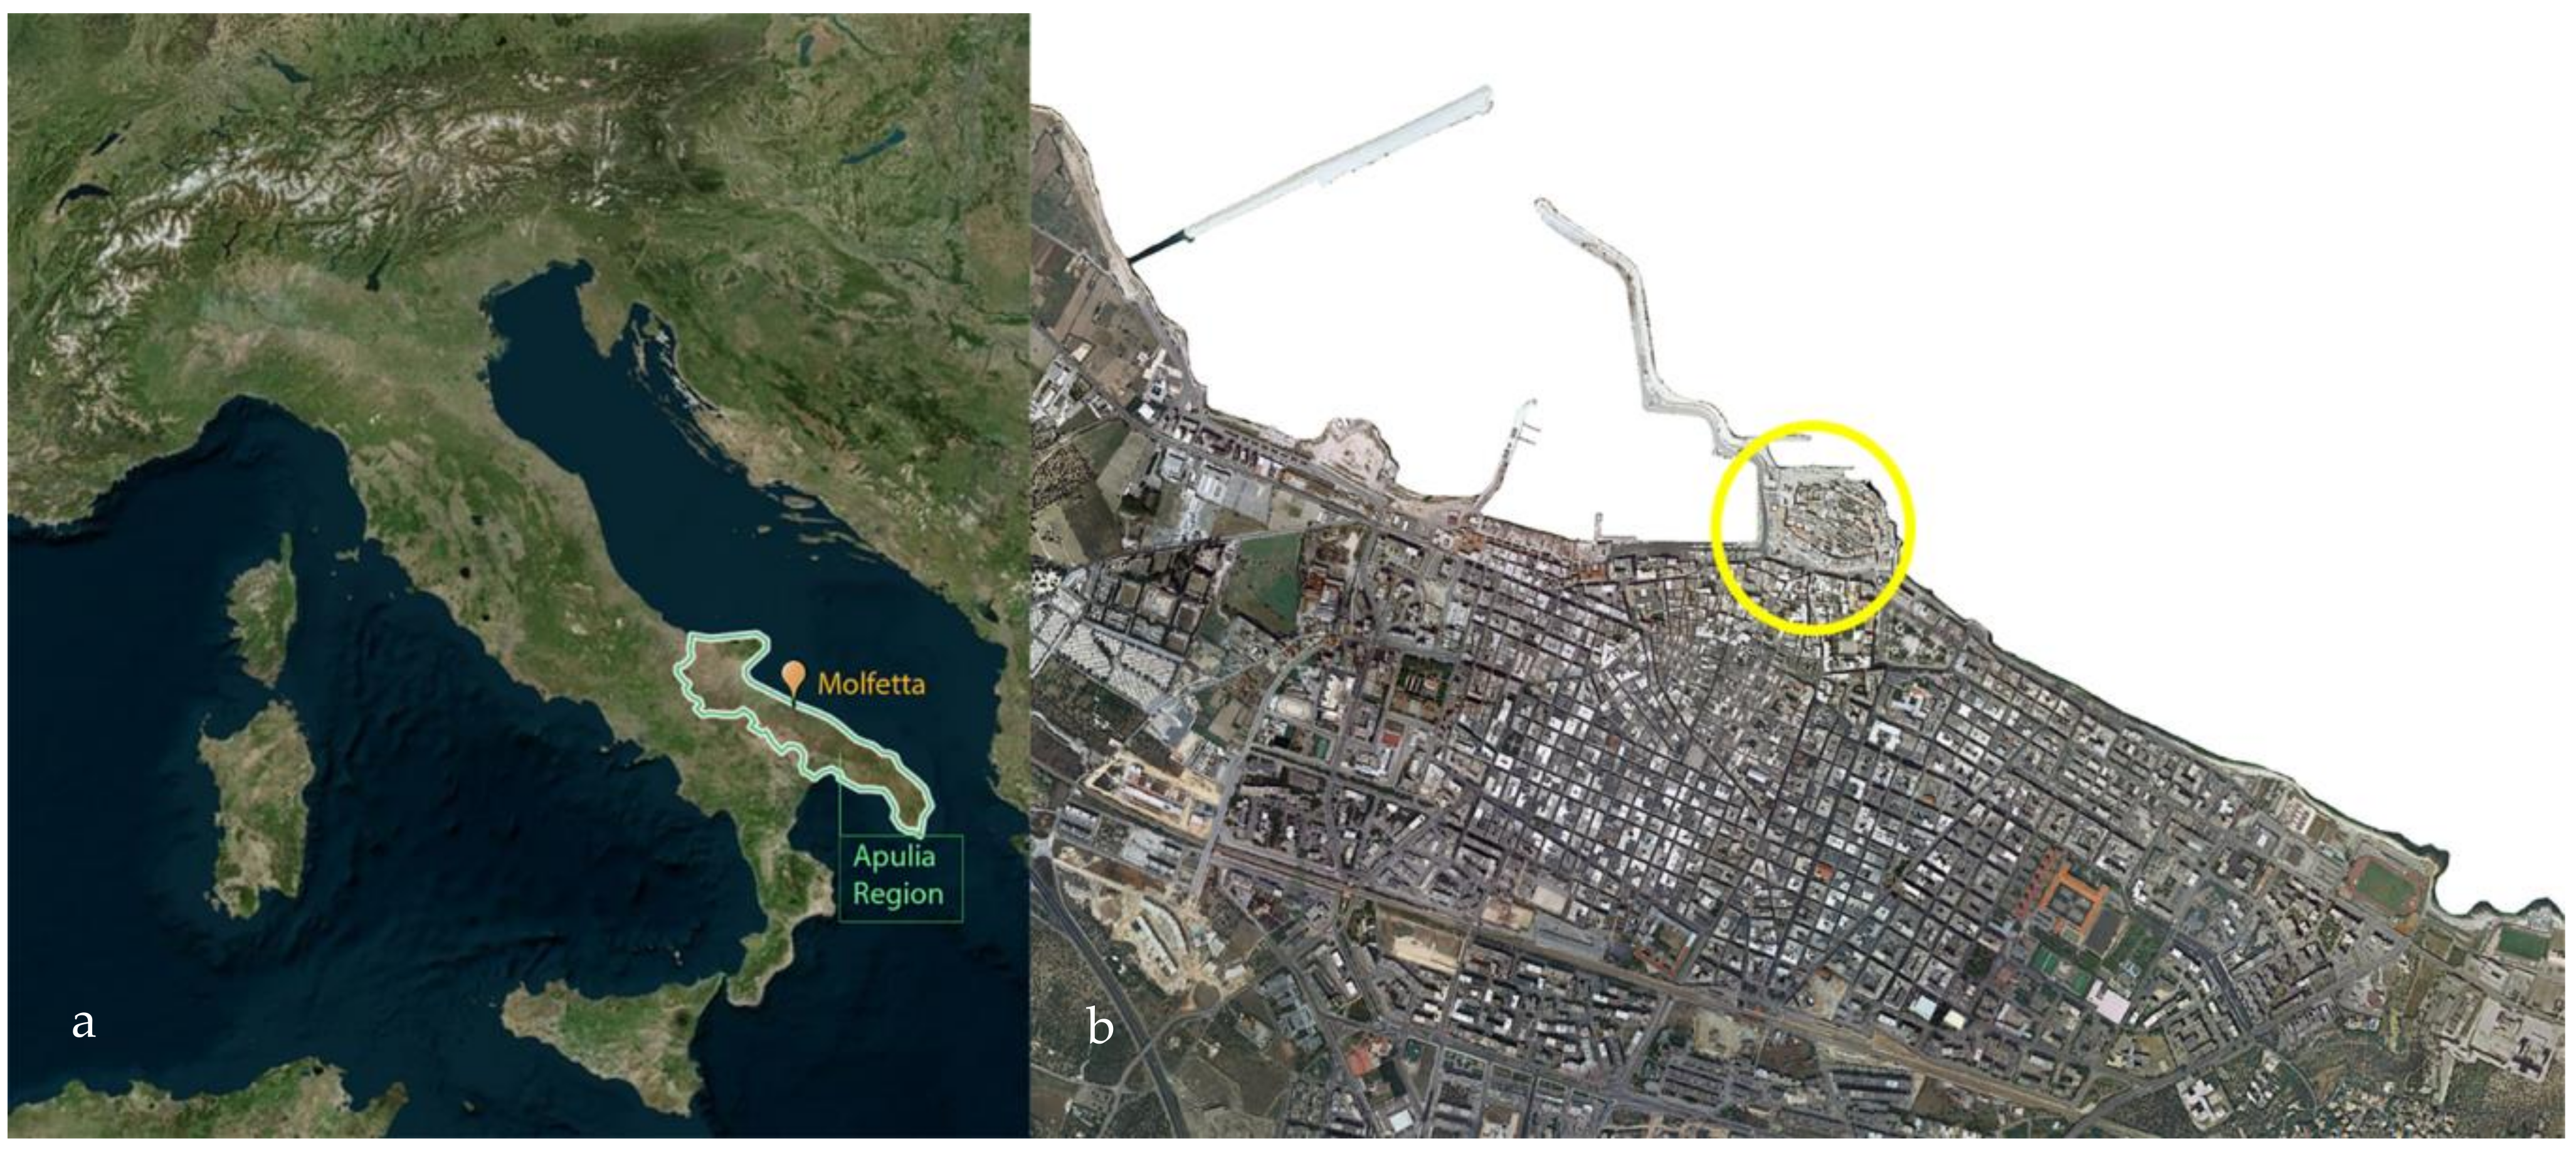
3. Results of the Case Study
3.1. Analytic Phase (A)
- Masonry, i.e., compound walls, are typically thick (50–90 cm) and made of calcarenitic squared blocks; inner façades are always plastered, while external ones are prevalently unplastered (Wa2) with few exceptions (plastered—Wa2);
- Ceilings vary in material and construction depending on the position; usually, a barrel vault divides the ground floor from the first one, which may or may not be plastered (Cg1 and Cg2, respectively); the inner ceilings are thin and feature wooden beams; finally, roofs are usually like inner ceilings (wooden) (Cin) with different external finishes;
- On the ground floor, the basement slab is made of concrete and is placed above a layer of stone blocks and gravel (Bf);
- Windows represent a low percentage of the opaque envelope (max 10%) according to the need for low exposition to solar radiation in a hot climate; generally, windows have a wooden frame and double-glazing (Wi1).
- Some roofs have external paving using calcarenitic stone tiles (Cex.b), called “chiancarelle” or “cotto” (Cex.a) tiles, or a waterproof membrane (Cex.c); the aforementioned tiles were used as a substitute for the original calcarenitic tiles. In terms of performance, these roofs display similar transmittance values (by the static sublayer) and differ in terms of their optical characteristics due to the external layer; albedo values vary from 0.1 for bituminous surfaces (Cex.c), 0.4 for “cotto” tiles (Cex.b) to 0.6 for stone pavement (Cex.a). The loss of the original characteristics cannot be attributed to administrative negligence, but rather, to widespread poor conservation;
- Windows present a common level of transformation; even if the wooden frame is preserved, original single glazes have been widely substituted with double ones.
3.2. Taxonomy Phase (B)
- High geometric compactness, considering the aspect ratio, i.e., the relationship between height (H) and width (W), H/W, of the street canyon–air volume, and the sky view factor (SVF), i.e., the ratio of the amount of sky visible from ground level. H/W was prevalently high (>3.5) while SVF values varied among very narrow street canyons (<0.1), narrow ones (0.1–0.2) and open spaces (0.3).
- The low permeability of the district due to the high building ratio (62.1%) and low pervious ratio (2.5%).
- The prevalent materials, recognizing calcareous stone as one of the main features of the district (for horizontal surfaces and walls).
- Finally, the energy loads were characterized by a zero value for anthropogenic heat due to the absence of vehicular traffic.
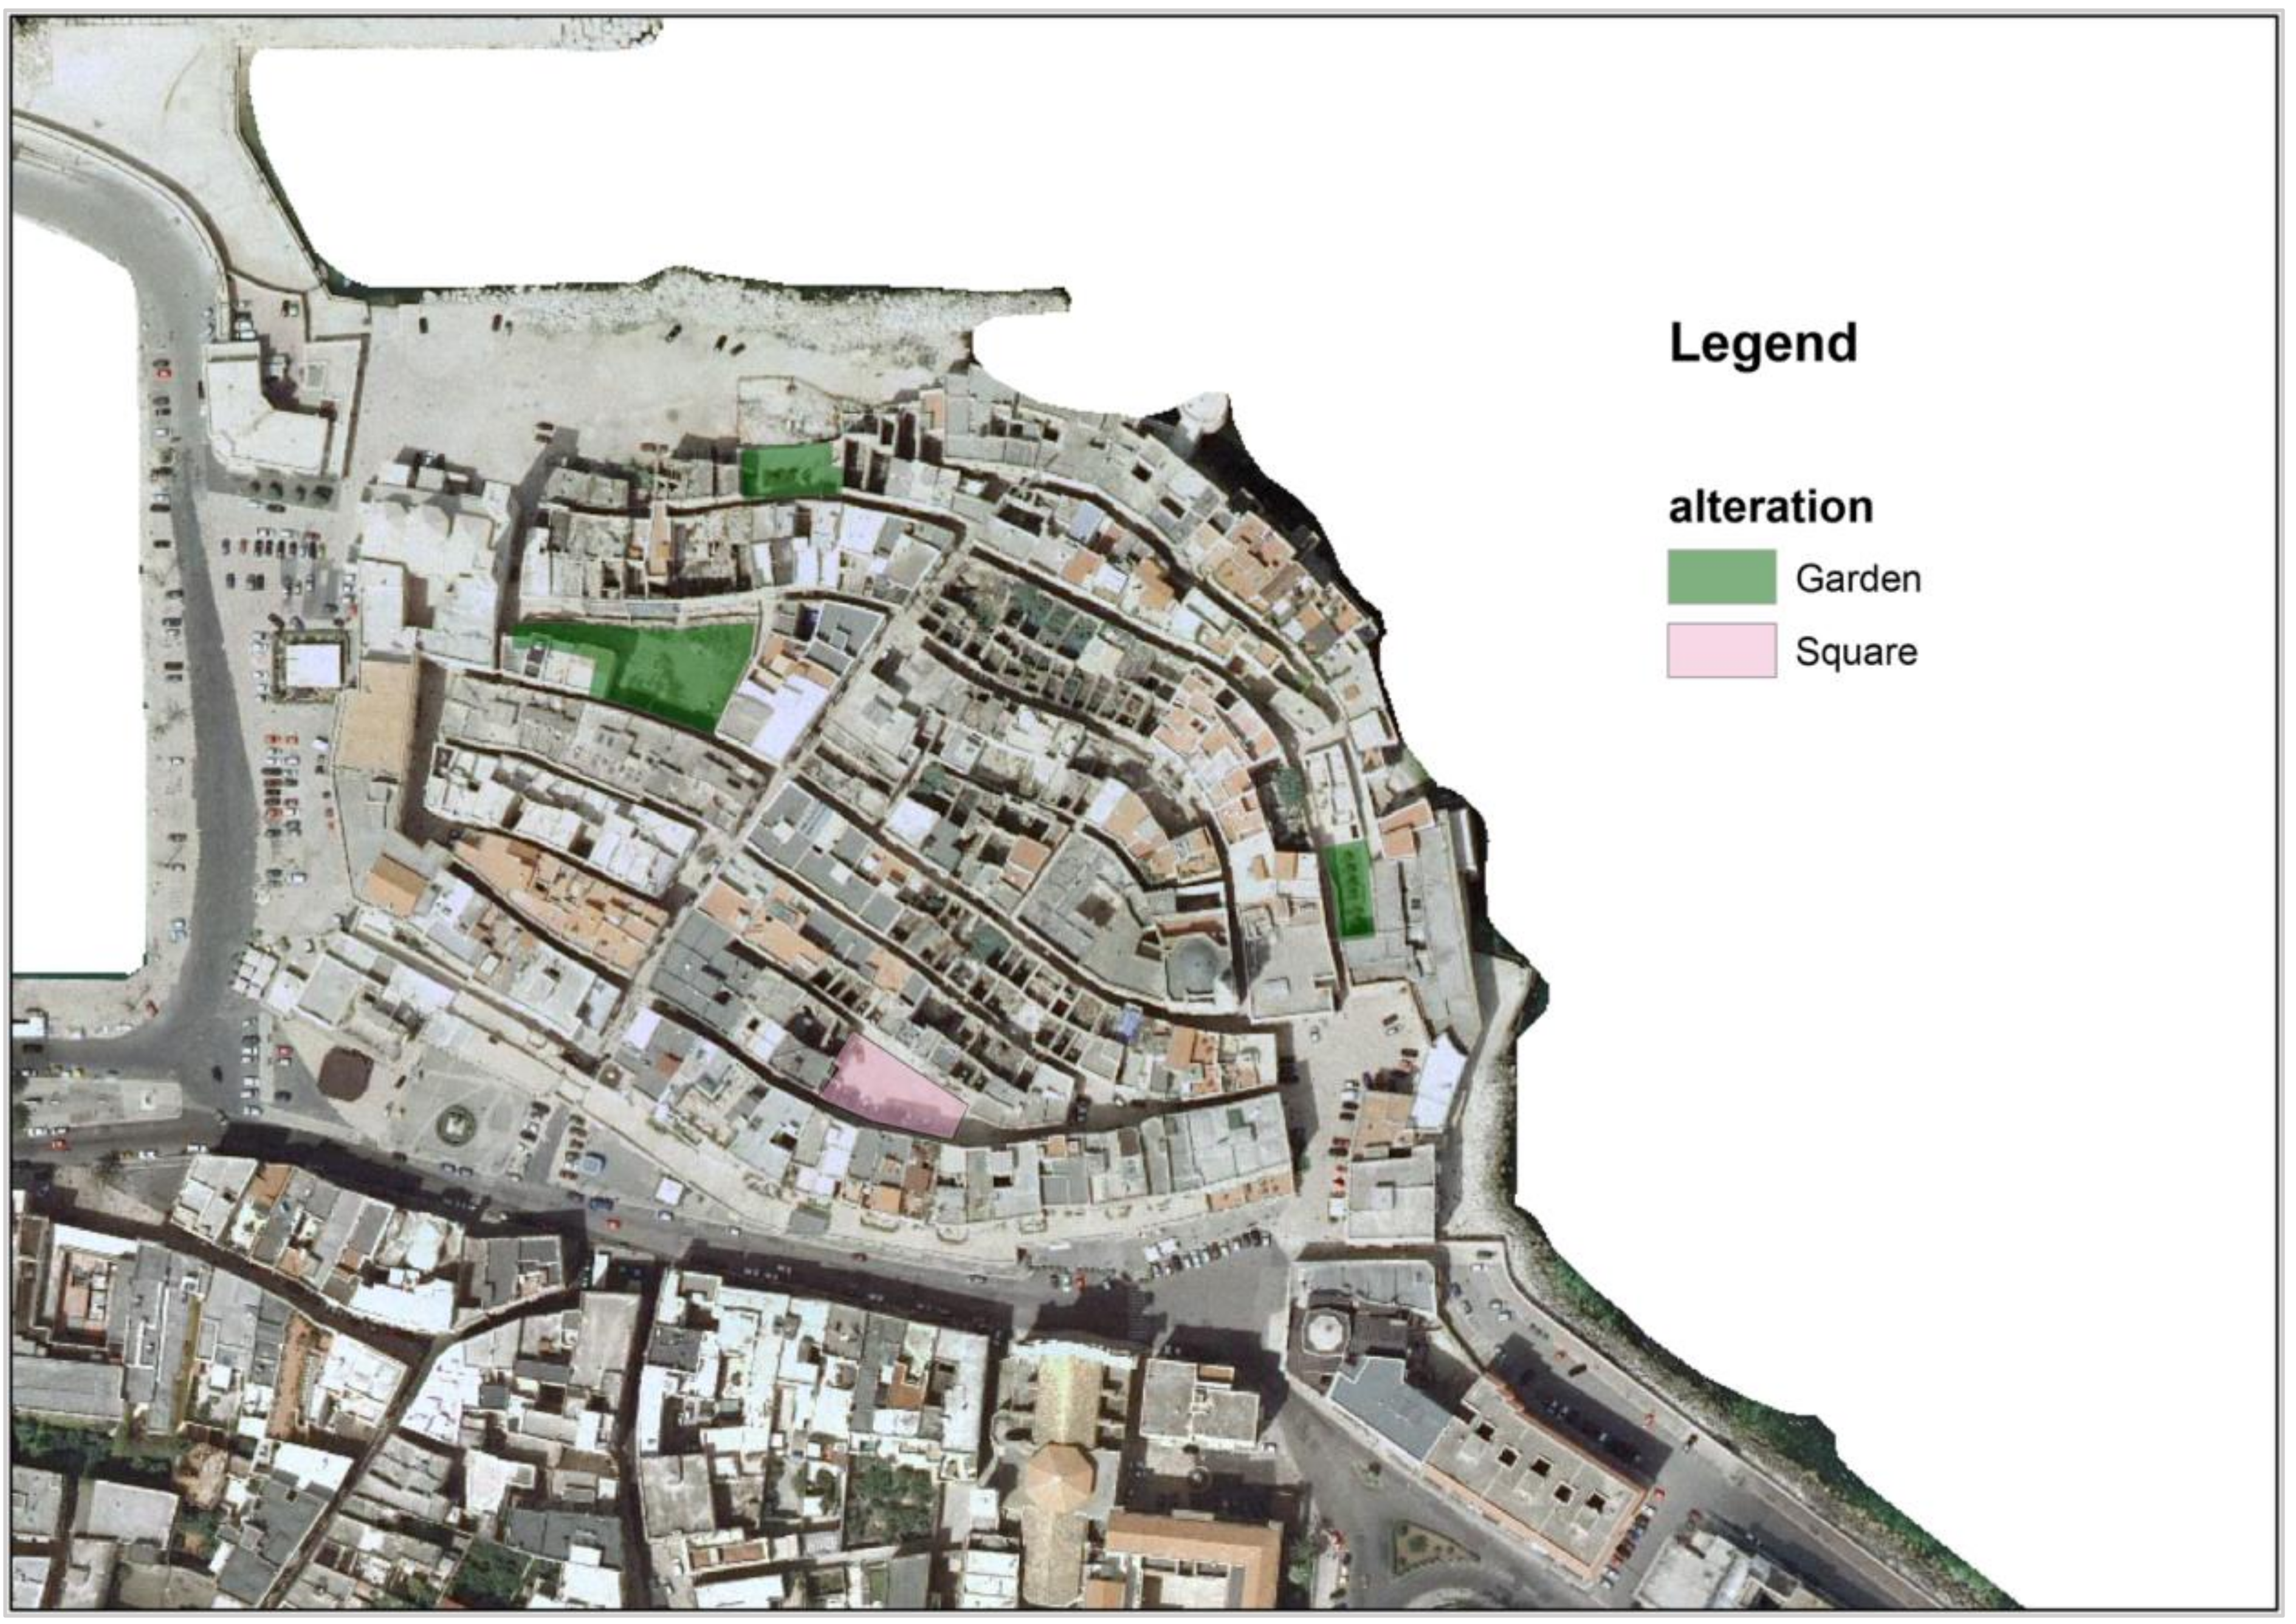
3.3. Monitoring and Testing Phase of Local Behavior (C)
- A consistent reduction of temperature during the day, i.e., ΔTmaxE1-E2 ≈ −1.5 °C, generated by the high compactness level of the built environment;
- In contrast, there was a nocturnal UHI effect, i.e., ΔTminE1-E2 ≈ +0.5 °C, as a direct consequence of this compactness; in this case, the closeness of districts and the absence of wind decreased the heat exchange. Moreover, the nocturnal effect depended on the reflectiveness of surfaces that could not exchange the longwave radiation;
- Finally, a shrinking effect of temperature variations during the day, expressed as variations in the standard deviation between monthly temperatures (ΔσE1-E2 ≈ −1).
- By increasing SVF in open spaces (as the superior extreme value in garden P1 and square P2), different temperature values were found; the open spaces were characterized by a temperature difference of nearly +1 °C at night time because of the higher solar heat storage during the day and the lower dissipation during the night due to low wind intensities; during the day, temperatures in open spaces reached a difference of nearly 0.5 °C; therefore, open spaces were characterized by an increasing mean daily temperature (+0.5 °C) and a higher reduction in the standard deviation of daily temperatures (compared to street canyon E1);
- A halfway condition is highlighted in street canyons where SVF and H/W values (e.g., P3) varied between narrow and open space cases; even if good shading properties ensured similar temperatures during the day and a comparable standard deviation of daily measurements (compared with narrow reference street), during the night, temperatures increased (+0.5 °C);
- Finally, in addition to simulations for inner points of the district, boundary blocks had similar conditions to the Harbor Master office measurements.
- R.1 refers to narrow street canyons where both nocturnal and daytime temperatures were modified, compared to external ones (E2);
- R.2 concerns middle street canyons, where only nocturnal conditions differed;
- R.3 describes open areas where temperature conditions were affected both in maximum and minimum conditions;
- R.4 identifies external conditions for boundaries.
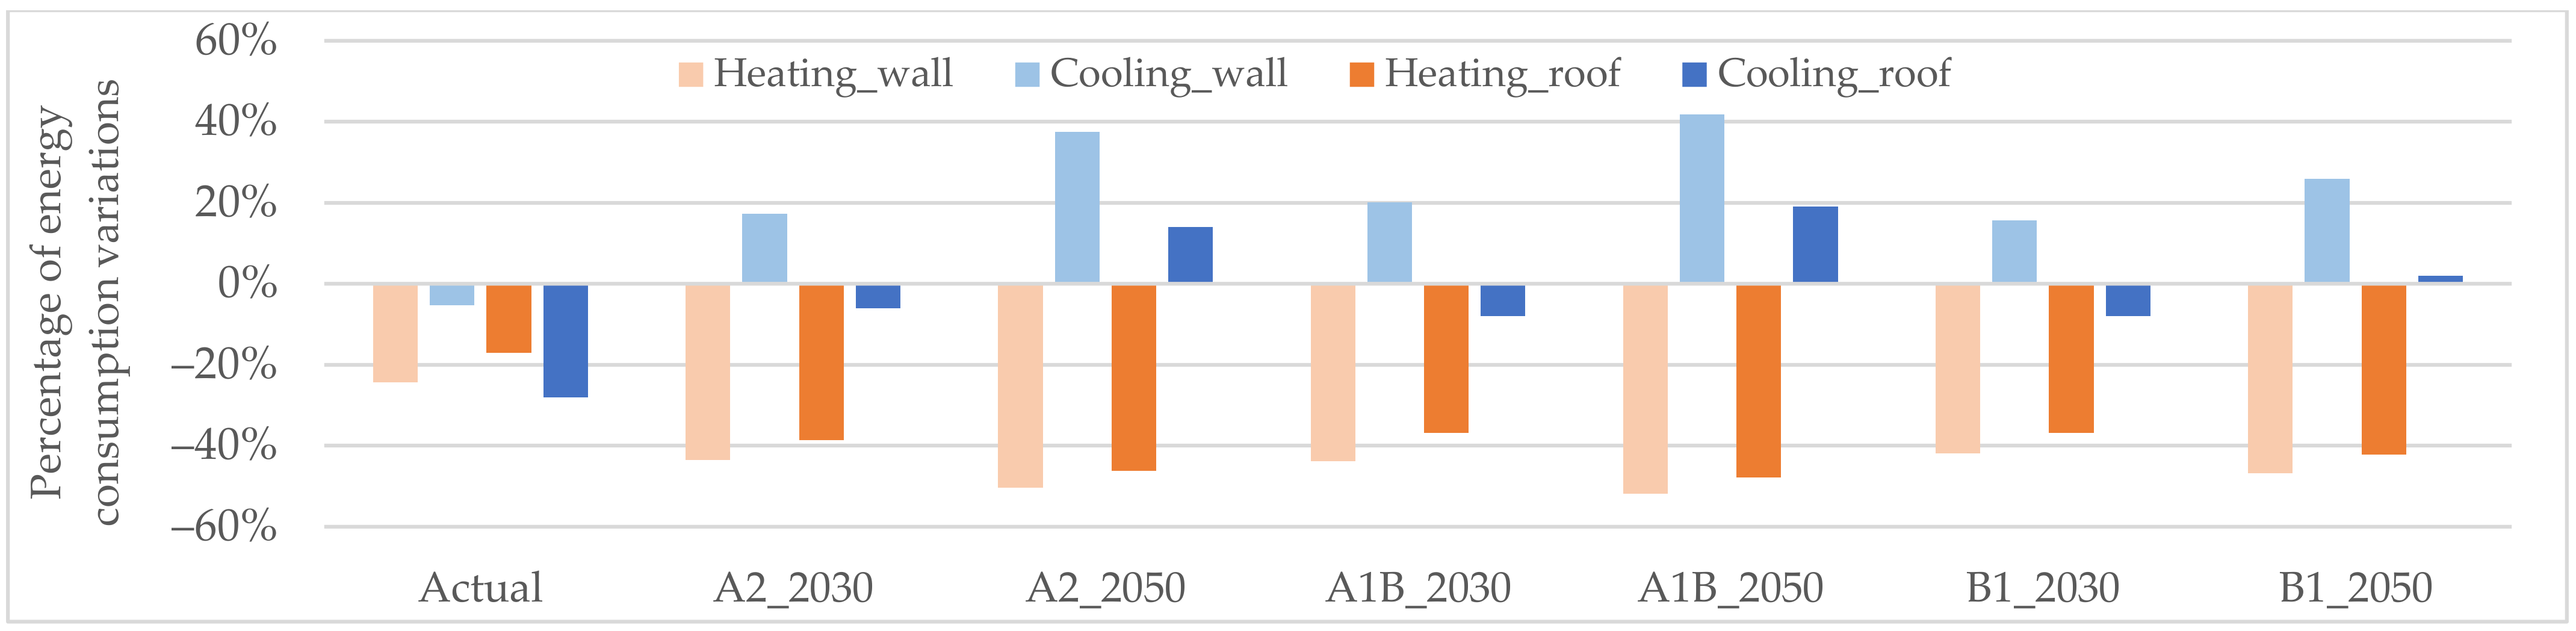
3.4. Diagnosis Phase (D)
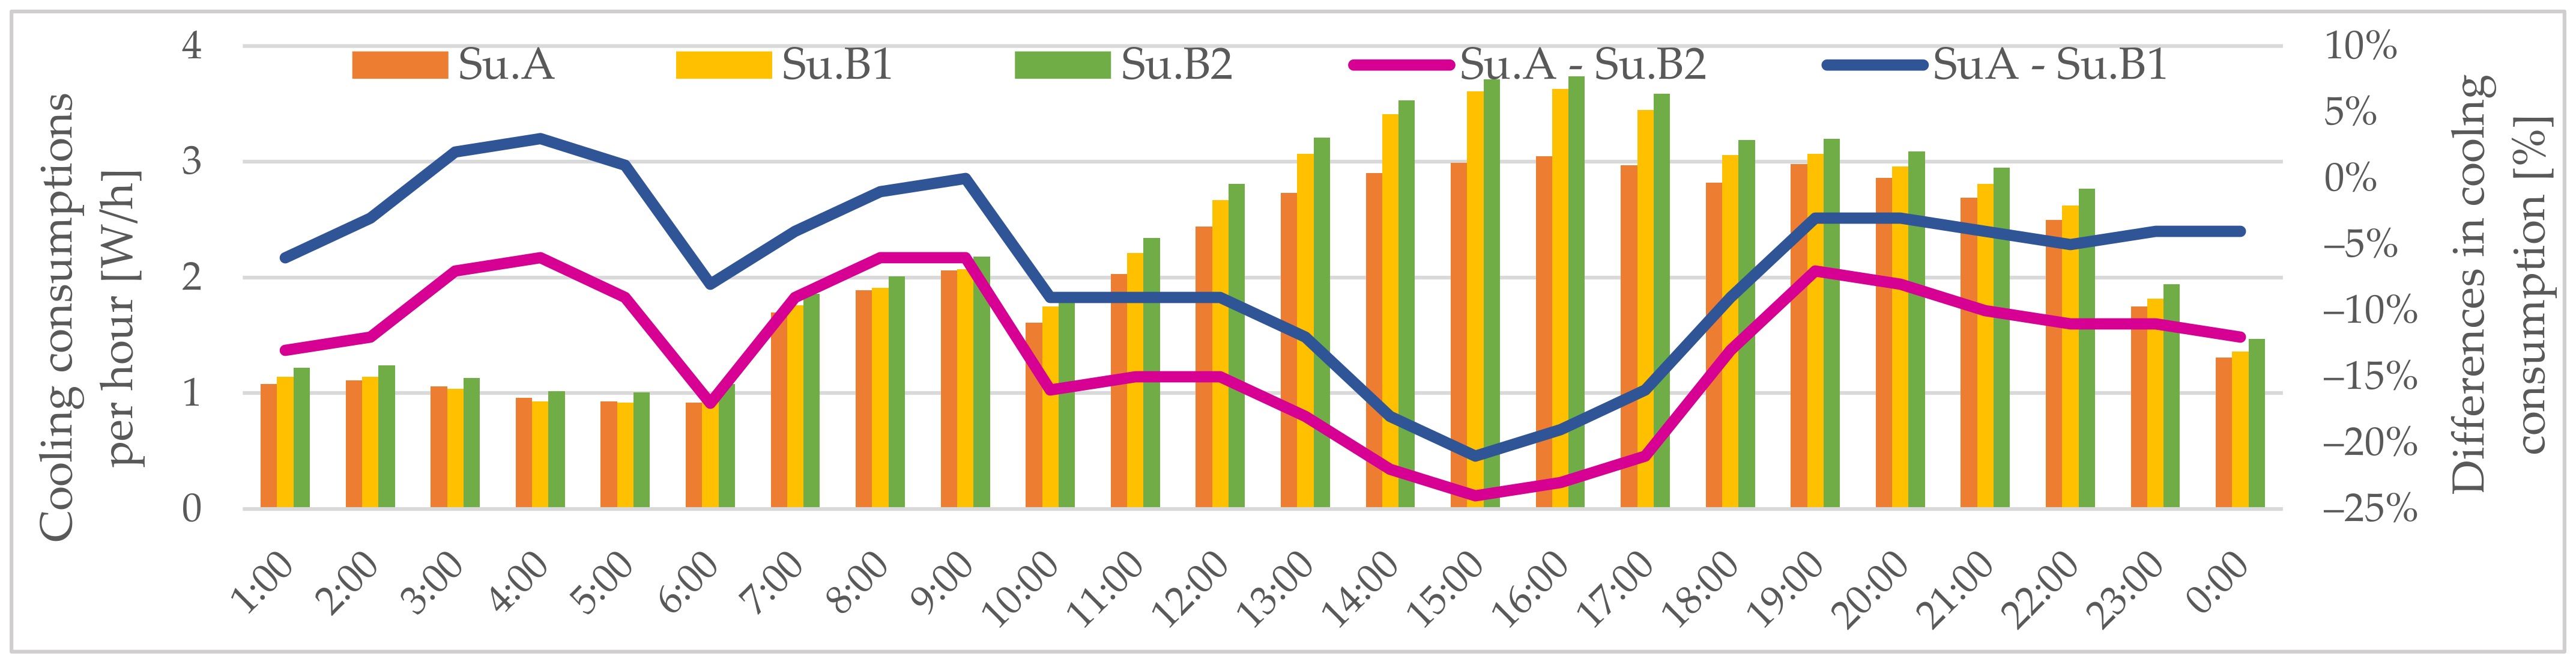
- Su.A: tower house in street canyon type (as modelled), considering the temperatures measured in the street canyon (E2);
- Su.B1: tower house type located in the square (without the on-face block), considering temperatures measured in the street canyon (E2); this represents an intermediate case aimed at comparing the effect of openness and constantly increasing temperatures in separate ways;
- Su.B2 tower house type in the square (without on-face block), considering the temperatures measured in the street canyon, with increments of 0.5 °C (E2 + 0.5 °C).
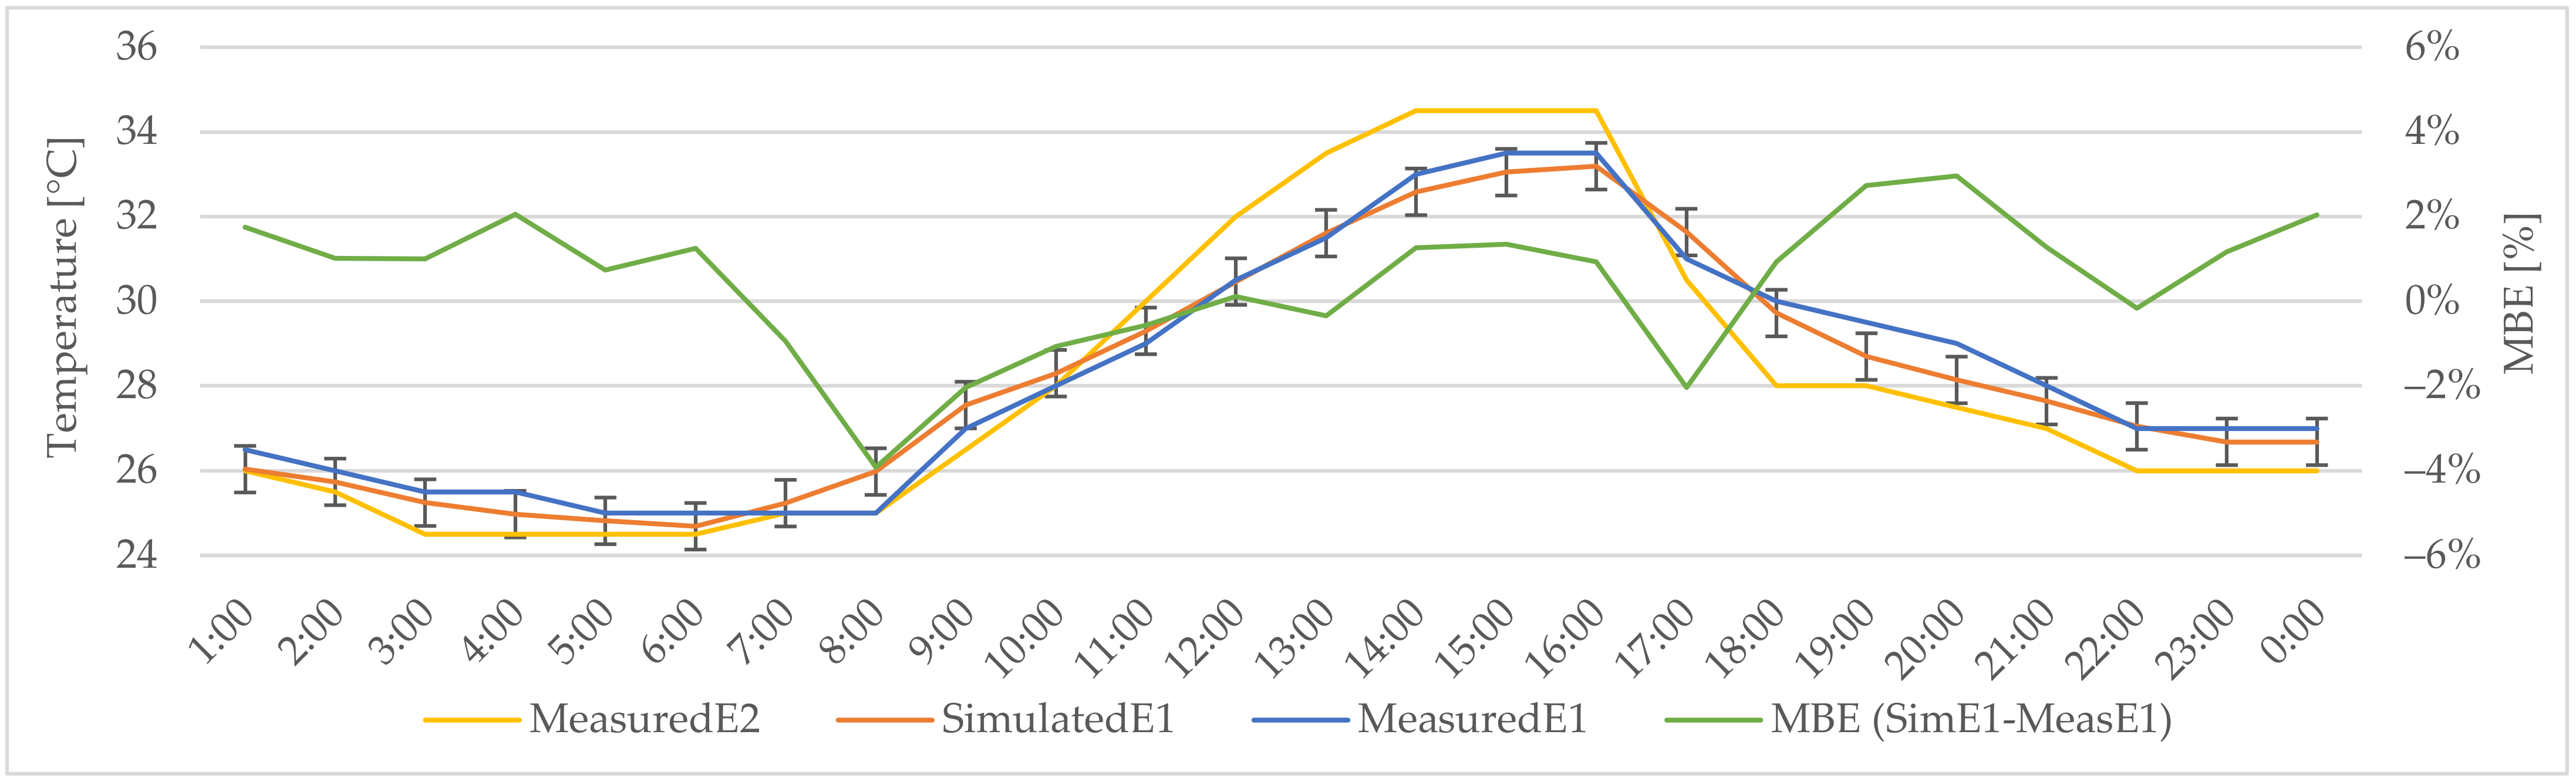
- The main shading effect on the building type supported a reduction in cooling demand during the daytime (−20% Su.A-Su.B1—Blue line in Figure 10);
- Microclimate alterations, combined with the loss of shading in open areas, have a minor additional influence on cooling reduction, i.e., approaching −25% (−20% Su.A-Su.B2—Purple line in Figure 10);
- In contrast, during the night, the cooling reduction was prevalently related to alterations in the microclimate (+0.5 °C), with a lower effect than in the daytime (−17% at 06:00 and 12% at 00:00—Bars graph in Figure 10).
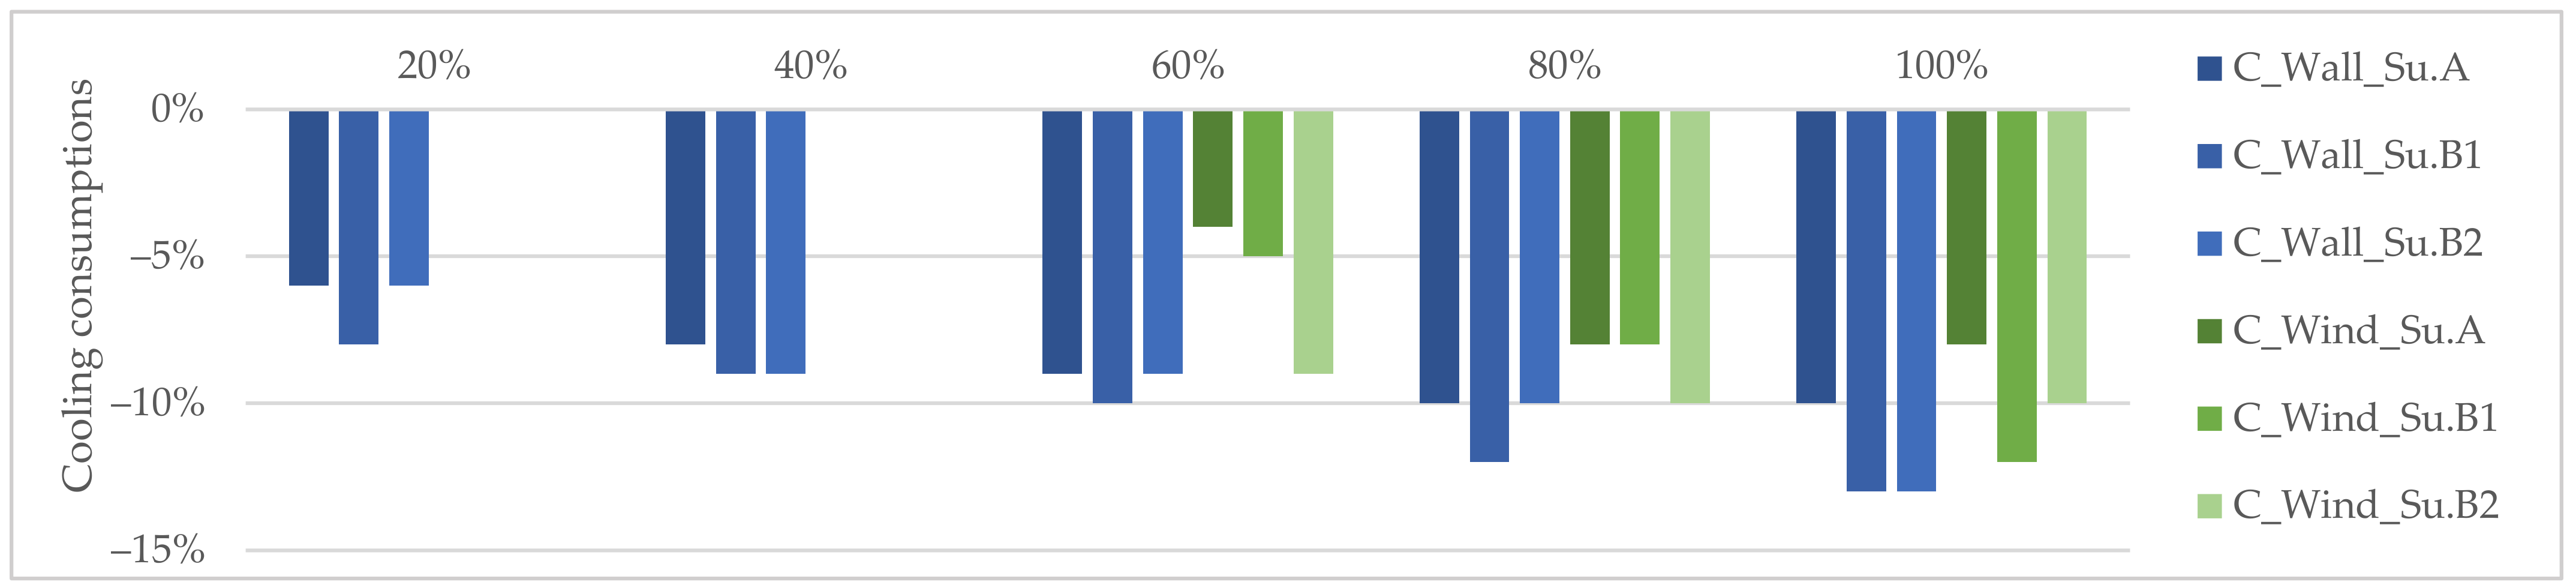
- CS1 is an extensive green roof (LAI = 1, soil depth Sd = 0.25 m) combined with an insulation sublayer; a low-impact real solution.
- CS2 is a smart solution for roofs involving the use of PCMs, i.e., light-density materials that improve the thermal inertia of the subsystem, characterized by a thickness of 70 mm and a latent melt temperature of 25 °C, and an outer reflective finishing layer (α = 0.84, ε = 0.89).
- CS3 is a widespread solution for roofs in hot climates, characterized by a well-designed insulating layer and an outer reflective finishing layer (α = 0.84, ε = 0.89).
3.5. Taxonomy of Suitable Interventions (E)
- [T.R.H]
- HIGH: severely damaged or collapsed roofs; for them, interventions involve reconstruction;
- [T.R.M]
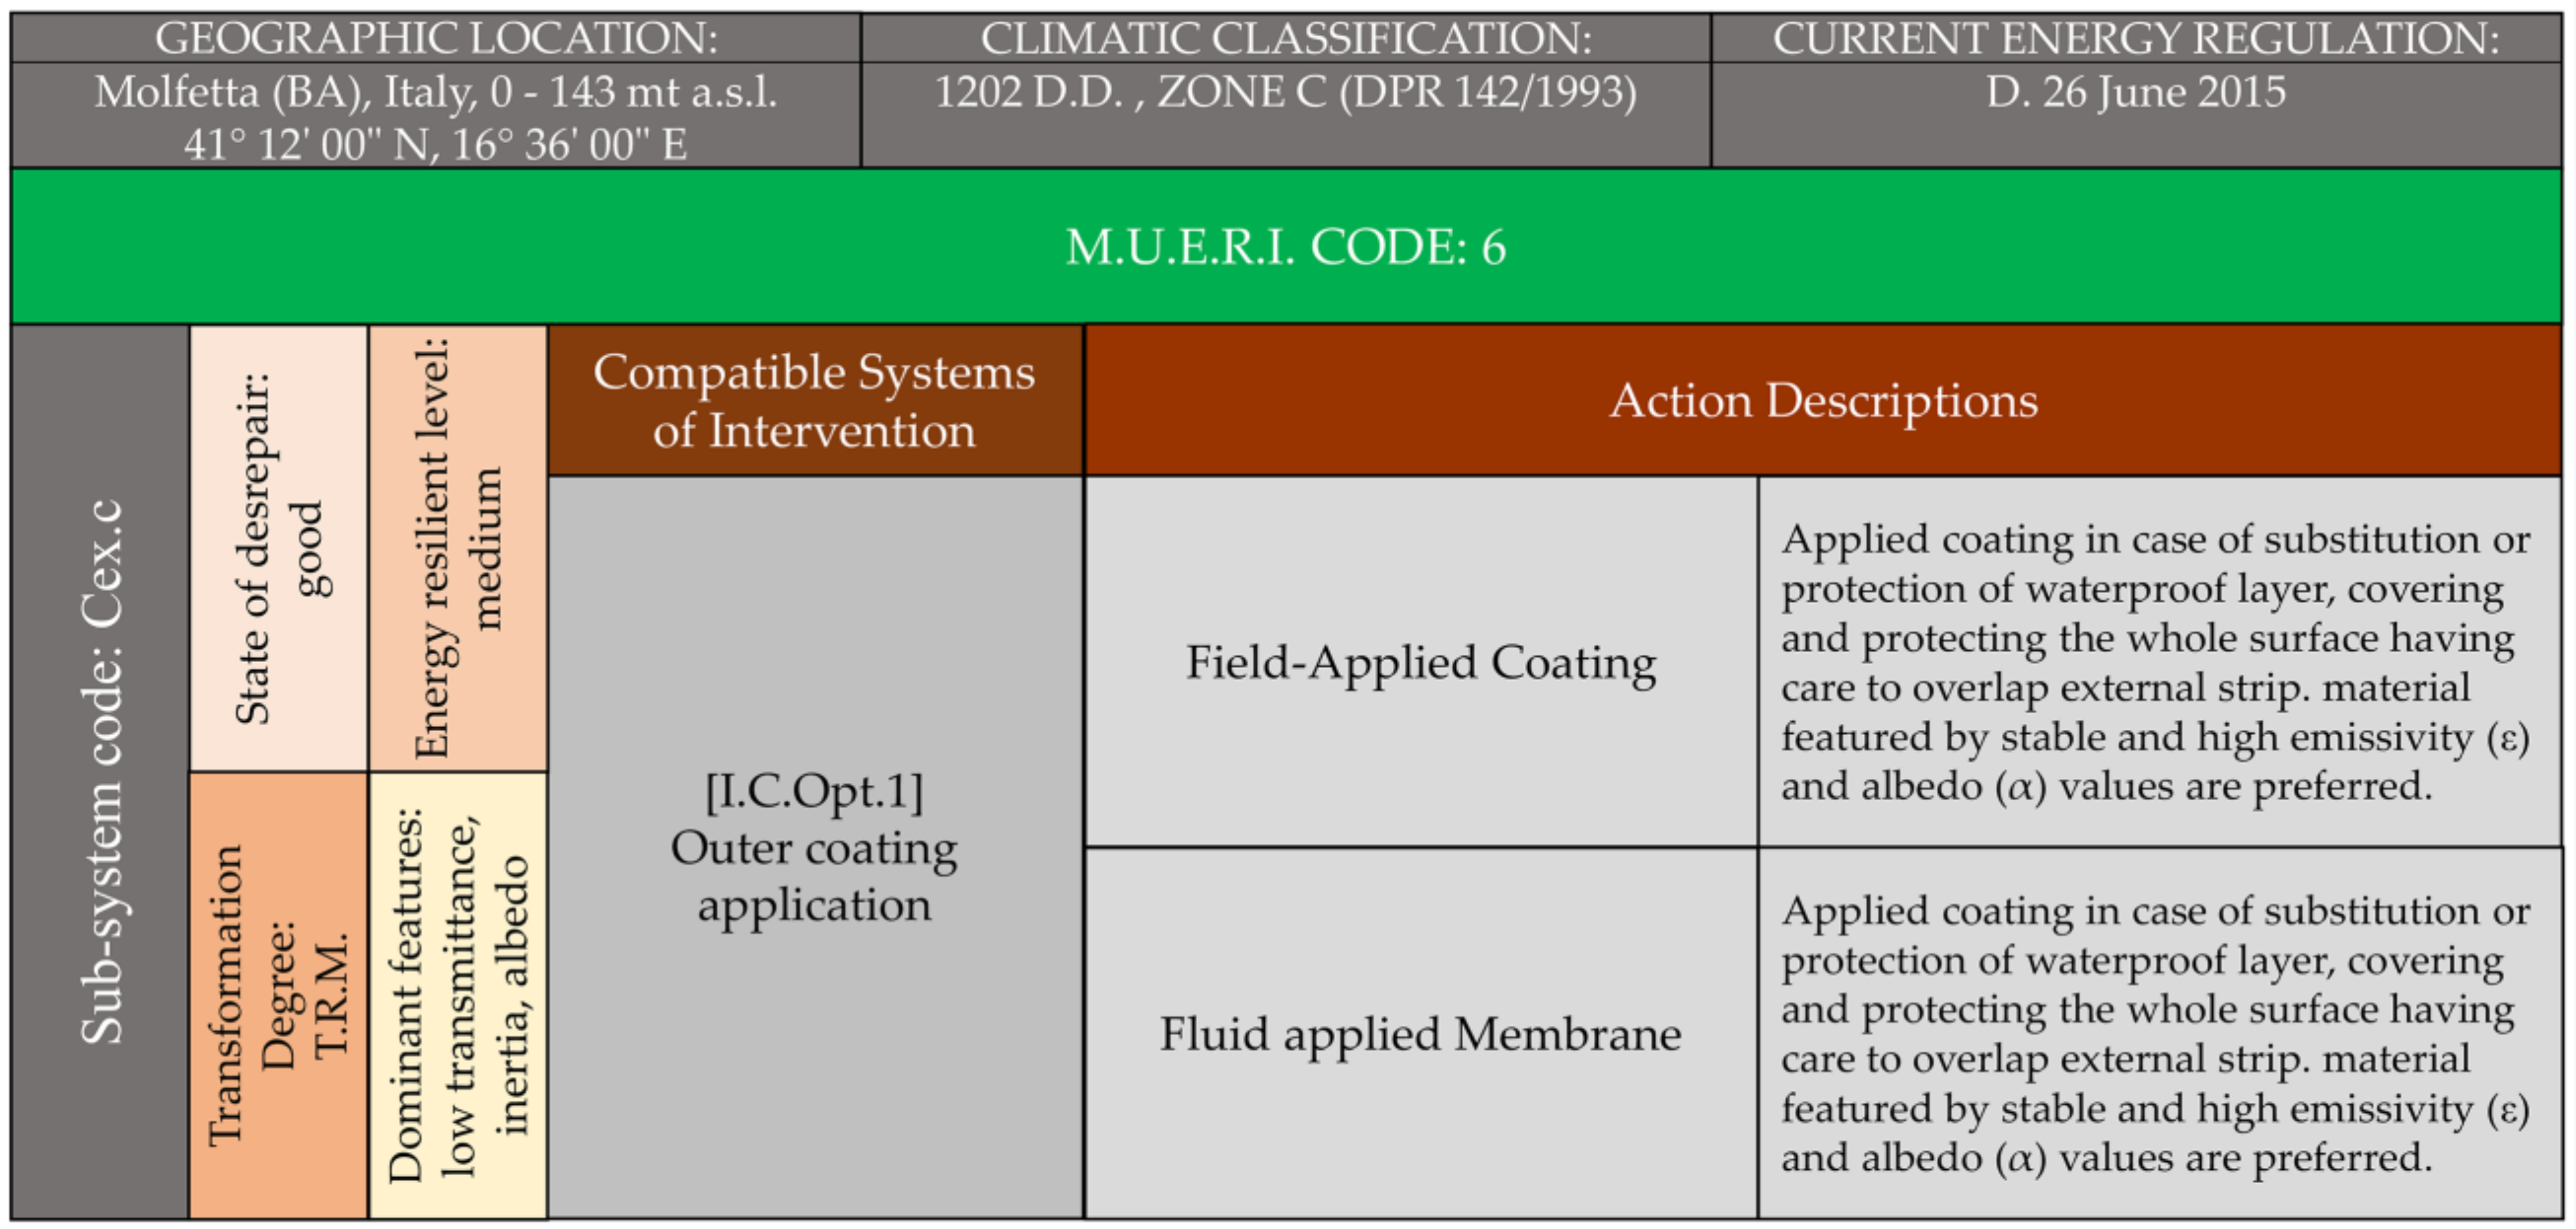
- MEDIUM: roofs covered by waterproofing layer (Cex.c) or not original pavement (Cex.a); the design and application of a compatible finishing material are required;
- [T.R.L-M]
- LOW-MEDIUM: roofs covered by the original or other valuable roof tiles; interventions have to preserve the formal and material identity of the external finish (e.g., removing, treating and reusing the stone tiles (Cex.b)).
- [T.W.H]
- HIGH: severely damaged or collapsed walls; interventions aim at reconstruction;
- [T.W.M-H]
- MEDIUM-HIGH: plastered walls; transformation involves the replacement of the original finishing with compatible and superior ones;
- [T.W.L]
- LOW: unplastered walls; interventions are limited to the inner surfaces or in the nucleus, in order to preserve the outer surface.
- [T.S.H]
- HIGH: constructions are already equipped with systems and connected to distribution grids;
- [T.S.M.]
- MEDIUM: buildings had energy systems but they are not connected to the distribution grids;
- [T.S.L.]
- LOW: buildings with obsolete systems which are disconnected from the grids.
- [I.C.Opt]
- Introduction of finishing solutions with good optical properties, which may be classified into two types:
- [I.C.Opt.1]
- Finishing additives or substitutions for roofs which are not easily accessible; in such cases, the use of field-applied coatings or fluid applied membranes can support ordinary maintenance, covering or substituting the bituminous surfaces;
- [I.C.Opt.2]
- Substitution of nonoriginal paving on accessible roofs with reflective technologies, such as clear reflective concrete or “cotto” tiles;
- [I.C.Th]
- Enhancement of thermal properties by inserting insulation panels under finishing sublayers; the use of insulation panels can achieve the lowest increase of thickness (e.g., aerogel, VIPs, multilayer reflective boards), thereby reducing variation. The main differences concern the external finishing treatments:
- [I.C.Th.1]
- In the case of nonoriginal paving and industrial external products (C.ex.a and C.ex.c), substitution is allowed;
- [I.C.Th.2]
- For original or comparable pavements (C.ex.b), removal and substitution are to be avoided in favor of reuse after thermal improvement of roofs, according to the degree of transformability.
- [I.C.Ti]
- Increase the thermal inertia of the roof by inserting new layers into the structural parts; the main solutions involve the replacement of the inclined screed above the slab, introducing insulation and lightweight concrete (e.g., with expanded clay, pumice, or expanded glass) or adding coatings or doped pavement with phase changing materials on the external surface to enhance attenuation and time shift of summer temperature peaks through controlled latent heat storage and release. In this second case, the possibility of introducing these materials depends on the penetration capacity of PCMs in the market, and thus, is a question of cost.
- [I.Wa.1]
- Installation of insulation panels on the external façade to achieve the lowest thickness (e.g., aerogel, VIPs, multilayer reflective boards), including a thermo-insulating plaster coating (e.g., hydraulic lime with EPS additives) in cases with outer plastered surfaces. When compatible with the thermal goals, natural and recyclable insulation panels are also allowed.
- [I.Wa.2]
- Filling the inner cavity with insulation mixtures (e.g., hydraulic lime with nanoparticles) for unplastered facades; thermal improvement along the inner surfaces of walls is to be avoided in order to preserve the thermal inertia and prevent interstitial condensation.
- [I.Wa.3]
- When extremely damaged, the construction of a new wall, observing the thermal threshold values defined by the law; using clear plaster to achieve formal homogeneity with the historic district.
- [I.S.1]
- Upgrade cooling and heating systems when the building is already connected to urban supplies.
- [I.S.2]
- Connection of the systems to urban supplies and use efficient technologies.
- [I.S.3]
- Introduction of efficient systems that do not require grid supplies (e.g., biomass boilers).
3.6. Assessment of Intervention Priority (F)
- 1.
- On the street canyon scale, three levels are recognized in terms of modifying the local microclimate to achieve a positive effect on reducing cooling demands:
- [A.C.H]
- HIGH for inner street canyons for all assets; here, the minimum average daily temperatures and maximum values of reduction of standard deviations generated the maximum reduction of energy consumption for daytime cooling (R1 and R2, section C2.2);
- [A.C.M]
- MEDIUM along open areas where average values of daily temperatures increased due to the nocturnal UHI effect (+0.5 °C) but reflected good behavior in terms of reducing daytime ones (R3);
- [A.C.L]
- LOW along the boundary where any adaptability capacity can be considered.
- 2.
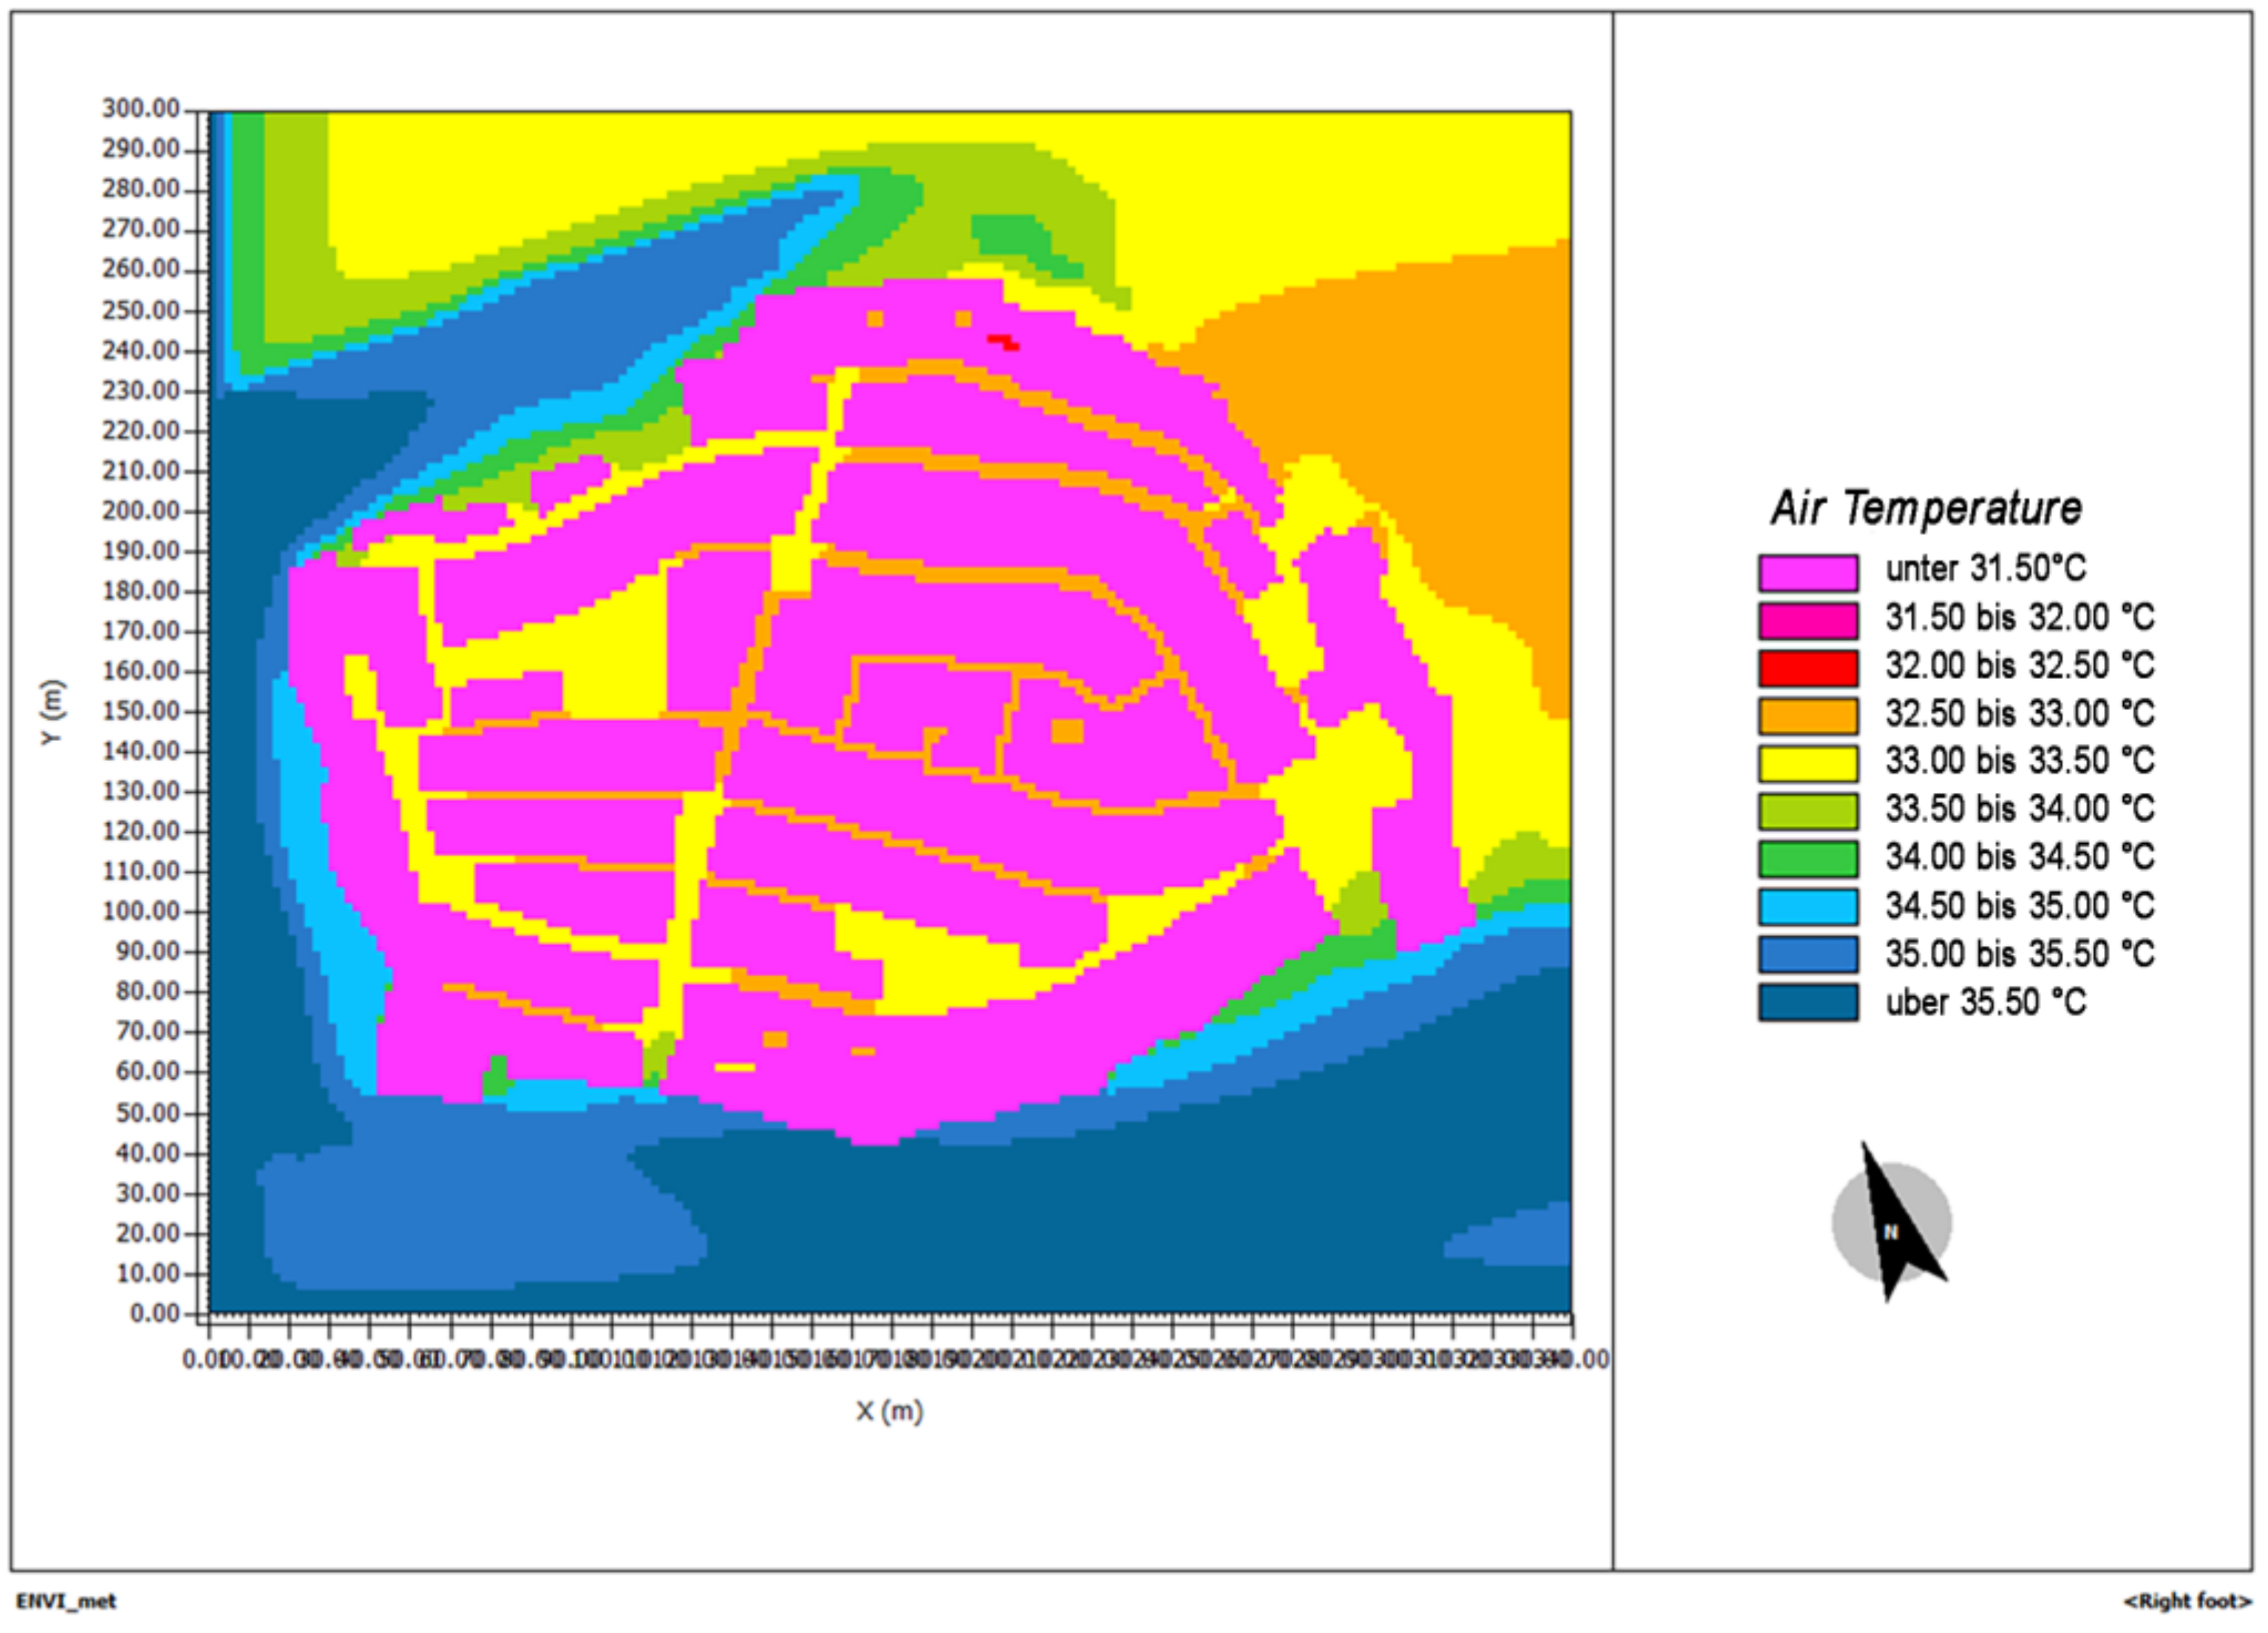
- On the building scale, adaptability describes the potential capacity to reduce local overheating outside the air volume of street canyon, and therefore, focuses on the optical properties of the roof materials (see results in Section C2.2, Figure 12):
- [A.R.H]
- HIGH for paved roofs made of stone (“chiancarelle”) with good optical features (C.ex.a);
- [A.R.M]
- MEDIUM for paved roofs with medium albedo values (C.ex.b);
- [A.R.L]
- LOW for roofs with low optical performance, such as those with a bituminous finish (C.ex.c).
4. Discussion and Conclusions
Author Contributions
Funding
Institutional Review Board Statement
Informed Consent Statement
Data Availability Statement
Acknowledgments
Conflicts of Interest
Abbreviations
| IPCC | Intergovernmental Panel on Climate Change |
| UHI | Urban Heat Island |
| PCM | Phase Change Material |
| SVF | Sky View Factor |
| WMO | World Meteorological Organization |
| LCZ | Local Climate Zone |
| MUERI | Minimum Unit of Energy Resilient Intervention |
| ARPA | Regional Agency for the Protection of the Environment (Agenzia Regionale per la Protezione Ambientale) |
| RH | Relative Humidity |
| WSDI | Warm Spell Duration Index |
Appendix A


References
- Lucon, O.; Ürge-Vorsatz, D.; Ahmed, A.Z.; Akbari, H.; Bertoldi, P.; Cabeza, L.F.; Eyre, N.; Gadgil, A.; Harvey, L.D.; Jiang, Y. Buildings. In Climate Change 2014: Mitigation of Climate Change. IPCC Working Group III Contribution to AR5; Cambridge University Press: Cambridge, UK, 2014. [Google Scholar]
- IEA. IEA Online Data Services. 2013. Available online: https://www.iea.org/data-and-statistics?country=WORLD&fuel=Energy%20supply&indicator=TPESbySource (accessed on 21 December 2020).
- Agency, I.E. CO2 Emissions from Fuel Combustion 2014. 2014. Available online: https://www.iea.org/reports/co2-emissions-from-fuel-combustion-overview (accessed on 21 December 2020).
- U.S. Environmental Protection Agency. Inventory of U.S. Greenhouse Gas Emissions and Sinks: 1990–2018; EPA 430-R-20-002; Environmental Protection Agency: Washington, DC, USA, 2020.
- Stocker, T.F.; Qin, D.; Plattner, G.-K.; Tignor, M.; Allen, S.K.; Boschung, J.; Nauels, A.; Xia, Y.; Bex, V.; Midgley, P.M. Climate Change 2013: The Physical Science Basis. Contribution of Working Group I to the Fifth Assessment Report of the Intergovernmental Panel on Climate Change; Stocker, T.F., Qin, D., Plattner, G.-K., Tignor, M., Allen, S.K., Boschung, J., Nauels, A., Xia, Y., Bex, V., Midgley, P.M., Eds.; Cambridge University Press: Cambridge, UK; New York, NY, USA, 2013; 1535p. [Google Scholar]
- Kitous, A.; Despres, J. Assessment of the Impact of Climate Change on Residential Energy Demand for Heating and Cooling; Joint Research Centre: Luxemburg, 2018. [Google Scholar]
- Commission Recommendation (EU) 2016/1318 of 29 July 2016 on Guidelines for the Promotion of Nearly Zero-Energy Buildings and Best Practices to Ensure that, by 2020, All New Buildings Are Nearly Zero-Energy Buildings. 2016. Available online: http://data.europa.eu/eli/reco/2016/1318/oj (accessed on 21 December 2020).
- European Commission. The EU Strategy on Adaptation to Climate Change; European Commission: Brussels, Belgium, 2013. [Google Scholar]
- Jarraud, M. Guide to Meteorological Instruments and Methods of Observation; WMO-No. 8; World Meteorological Organization: Geneva, Switzerland, 2008. [Google Scholar]
- Santamouris, M. Cooling the cities—A review of reflective and green roof mitigation technologies to fight heat island and improve comfort in urban environments. Sol. Energy 2014, 103, 682–703. [Google Scholar] [CrossRef]
- Santamouris, M. On the energy impact of urban heat island and global warming on buildings. Energy Build. 2014, 82, 100–113. [Google Scholar] [CrossRef]
- Stewart, I.D.; Oke, T.R. Thermal Differentiation of Local Climate Zones Using Temperature Observations from Urban and Rural Field Sites. In Proceedings of the Preprints, 9th Symposium, on Urban Environment, Keystone, CO, USA, 2–6 August 2010; pp. 2–6. [Google Scholar]
- Stewart, I.D.; Oke, T.R. Local Climate Zones for Urban Temperature Studies. Bull. Am. Meteorol. Soc. 2012, 93, 1879–1900. [Google Scholar] [CrossRef]
- Saheb, Y.; Shnapp, S.; Paci, D. From Nearly-Zero Energy Buildings to Net-Zero Energy Districts; Technical report EUR 29734 EN; Joint Research Centre: European Commission: Brussels, Belgium, 2019; 113p. [Google Scholar]
- C40 Cities Climate Action Planning Framework. Available online: https://cdn.locomotive.works/sites/5ab410c8a2f42204838f797e/pages/5ae2f92374c4837e195d0e00/files/20200324_C40_Climate_Action_Planning_Framework.pdf?1591007745 (accessed on 21 December 2020).
- C40 Cities Defining Carbon Neutrality for Cities & Managing Residual Emissions. Available online: https://c40-production-images.s3.amazonaws.com/researches/images/76_Carbon_neutrality_guidance_for_cities_20190422.original.pdf?1555946416 (accessed on 12 January 2021).
- Covenant of Mayors Covenant of Mayors. Available online: http://www.covenantofmayors.eu (accessed on 21 December 2020).
- Field, C.B. Climate Change 2014–Impacts, Adaptation and Vulnerability: Regional Aspects; Cambridge University Press: Cambridge, UK, 2014; ISBN 1107058163. [Google Scholar]
- Coppola, E.; Giorgi, F. An assessment of temperature and precipitation change projections over Italy from recent global and regional climate model simulations. Int. J. Clim. 2010, 32, 11–32. [Google Scholar] [CrossRef]
- Synnefa, A.; Santamouris, M.; Livada, I. A study of the thermal performance of reflective coatings for the urban environment. Sol. Energy 2006, 80, 968–981. [Google Scholar] [CrossRef]
- Synnefa, A.; Santamouris, M.; Akbari, H. Estimating the effect of using cool coatings on energy loads and thermal comfort in residential buildings in various climatic conditions. Energy Build. 2007, 39, 1167–1174. [Google Scholar] [CrossRef]
- Synnefa, A.; Santamouris, M. Advances on technical, policy and market aspects of cool roof technology in Europe: The Cool Roofs project. Energy Build. 2012, 55, 35–41. [Google Scholar] [CrossRef]
- Costanzo, V.; Evola, G.; Gagliano, A.; Marletta, L.; Nocera, F. Study on the Application of Cool Paintings for the Passive Cooling of Existing Buildings in Mediterranean Climates. Adv. Mech. Eng. 2013, 5, 413675. [Google Scholar] [CrossRef]
- Kolokotsa, D.; Giannariakis, G.; Gobakis, K.; Giannarakis, G.; Synnefa, A.; Santamouris, M. Cool roofs and cool pavements application in Acharnes, Greece. Sustain. Cities Soc. 2018, 37, 466–474. [Google Scholar] [CrossRef]
- Zinzi, M. Cool materials and cool roofs: Potentialities in Mediterranean buildings. Adv. Build. Energy Res. 2010, 4, 201–266. [Google Scholar] [CrossRef]
- Zinzi, M.; Agnoli, S. Cool and green roofs. An energy and comfort comparison between passive cooling and mitigation urban heat island techniques for residential buildings in the Mediterranean region. Energy Build. 2012, 55, 66–76. [Google Scholar] [CrossRef]
- Zinzi, M. Exploring the potentialities of cool facades to improve the thermal response of Mediterranean residential buildings. Sol. Energy 2016, 135, 386–397. [Google Scholar] [CrossRef]
- Boixo, S.; Diaz-Vicente, M.; Colmenar, A.; Castro, M.A. Potential energy savings from cool roofs in Spain and Andalusia. Energy 2012, 38, 425–438. [Google Scholar] [CrossRef]
- Pisello, A.L.; Rossi, F.; Cotana, F. On the impact of cool roofs in Italian residential buildings: Experimental assessment of summer and winter performance. In Proceedings of the SEBUA-12 ICHMT International Symposium on Sustainable Energy in Buildings and Urban Areas, Kusadasi, Turkey, 14–20 July 2020; Begell House: 2012 (online). pp. 1–20. [Google Scholar]
- Karlessi, T.; Santamouris, M.; Synnefa, A.; Assimakopoulos, D.N.; Didaskalopoulos, P.; Apostolakis, K.C. Development and testing of PCM doped cool colored coatings to mitigate urban heat island and cool buildings. Build. Environ. 2011, 46, 570–576. [Google Scholar] [CrossRef]
- Pisello, A.L.; Fortunati, E.; Mattioli, S.; Cabeza, L.F.; Barreneche, C.; Kenny, J.; Cotana, F. Innovative cool roofing membrane with integrated phase change materials: Experimental characterization of morphological, thermal and optic-energy behavior. Energy Build. 2016, 112, 40–48. [Google Scholar] [CrossRef]
- Piselli, C.; Castaldo, V.L.; Pisello, A.L. How to enhance thermal energy storage effect of PCM in roofs with varying solar reflectance: Experimental and numerical assessment of a new roof system for passive cooling in different climate conditions. Sol. Energy 2019, 192, 106–119. [Google Scholar] [CrossRef]
- Lassandro, P.; Di Turi, S. Energy efficiency and resilience against increasing temperatures in summer: The use of PCM and cool materials in buildings. Int. J. Heat Technol. 2017, 35, S307–S315. [Google Scholar] [CrossRef]
- Gaitani, N.; Mihalakakou, G.; Santamouris, M. On the use of bioclimatic architecture principles in order to improve thermal comfort conditions in outdoor spaces. Build. Environ. 2007, 42, 317–324. [Google Scholar] [CrossRef]
- Peñalvo-López, E.; Cárcel-Carrasco, J.; Alfonso-Solar, D.; Valencia-Salazar, I.; Hurtado-Pérez, E. Study of the Improvement on Energy Efficiency for a Building in the Mediterranean Area by the Installation of a Green Roof System. Energies 2020, 13, 1246. [Google Scholar] [CrossRef]
- Maiolo, M.; Pirouz, B.; Bruno, R.; Palermo, S.A.; Arcuri, N.; Piro, P. The Role of the Extensive Green Roofs on Decreasing Building Energy Consumption in the Mediterranean Climate. Sustainability 2020, 12, 359. [Google Scholar] [CrossRef]
- Karteris, M.; Theodoridou, I.; Mallinis, G.; Tsiros, E.; Karteris, A. Towards a green sustainable strategy for Mediterranean cities: Assessing the benefits of large-scale green roofs implementation in Thessaloniki, Northern Greece, using environmental modelling, GIS and very high spatial resolution remote sensing data. Renew. Sustain. Energy Rev. 2016, 58, 510–525. [Google Scholar] [CrossRef]
- Fioretti, R.; Palla, A.; Lanza, L.; Principi, P. Green roof energy and water related performance in the Mediterranean climate. Build. Environ. 2010, 45, 1890–1904. [Google Scholar] [CrossRef]
- Silva, C.M.; Gomes, M.G.; Silva, M. Green roofs energy performance in Mediterranean climate. Energy Build. 2016, 116, 318–325. [Google Scholar] [CrossRef]
- Bevilacqua, P.; Mazzeo, D.; Bruno, R.; Arcuri, N. Experimental investigation of the thermal performances of an extensive green roof in the Mediterranean area. Energy Build. 2016, 122, 63–79. [Google Scholar] [CrossRef]
- Economidou, M.; Atanasiu, B.; Despret, C.; Maio, J.; Nolte, I.; Rapf, O. Europe’s buildings under the microscope. A country-by-country review of the energy performance of buildings. Build. Perform. Inst. Eur. 2011, 35–36. [Google Scholar]
- UNESCO. Recommendations Concerning the Safeguarding and Contemporary Role of Historic Areas. 1976. Available online: http://portal.unesco.org/en/ev.php-URL_ID=13133&URL_DO=DO_TOPIC&URL_SECTION=201.html (accessed on 21 December 2020).
- Troi, A. Historic buildings and city centres–The potential impact of conservation compatible energy refurbishment on climate protection and living conditions. In Proceedings of the Conference Energy Management in Cultural Heritage, Dubrovnik, Croatia, 6–8 April 2011. [Google Scholar]
- Guillaud, H. Socio-cultural sustainability in vernacular architecture. In VERSUS: Heritage for Tomorrow; Correia, M., Dipasquale, L., Mecca, S., Eds.; Firenze University Press: Firenze, Italy, 2014; pp. 49–55. [Google Scholar]
- Achenza, M.; Glovagnorio, I. Environmental sustainability in vernacular architecture. In VERSUS: Heritage for Tomorrow; Correia, M., Dipasquale, L., Mecca, S., Eds.; Firenze University Press: Firenze, Italy, 2014; pp. 41–48. [Google Scholar]
- Caimi, A.; Hofmann, M. Learning from vernacular building practices: A starting point for risk mitigation. In Proceedings of the Vernacular Heritage and Earthen Architecture: Contributions for Sustainable Development, Vila Nova de Cerveira, Portugal, 16–20 October 2013; CRC Press-Taylor & Francis Group: Boca Raton, FL, USA, 2014; pp. 703–709. [Google Scholar]
- EU Directive 2012/27/EU of the European Parliament and of the Council of 25 Octorber 2012 on Energy Efficiency, Amending Directives 2009/125/EC and 2010/30/EU and Repealing Directives 2008/8/EC and 2006/32/EC. 2012. Available online: https://www.energypoverty.eu/publication/directive-201227eu-european-parliament-and-council-25-october-2012-energy-efficiency (accessed on 21 December 2020).
- Bouchair, A.; Tebbouche, H.; Hammouni, A.; Lehtihet, M.C.; Blibli, M. Compact Cities as a Response to the Challenging Local Environmental Constraints in Hot Arid Lands of Algeria. Energy Procedia 2013, 42, 493–502. [Google Scholar] [CrossRef]
- Al Tawayha, F.; Bragança, L.; Mateus, R. Contribution of the Vernacular Architecture to the Sustainability: A Comparative Study between the Contemporary Areas and the Old Quarter of a Mediterranean City. Sustainability 2019, 11, 896. [Google Scholar] [CrossRef]
- Coch, H. Bioclimatism in vernacular architecture. Renew. Sustain. Energy Rev. 1998, 2, 67–87. [Google Scholar] [CrossRef]
- Ulu, M.; Arsan, Z.D. Retrofit Strategies for Energy Efficiency of Historic Urban Fabric in Mediterranean Climate. Atmosphere 2020, 11, 742. [Google Scholar] [CrossRef]
- De Rubeis, T.; Nardi, I.; Muttillo, M.; Paoletti, D. The restoration of severely damaged churches—Implications and opportunities on cultural heritage conservation, thermal comfort and energy efficiency. J. Cult. Herit. 2020, 43, 186–203. [Google Scholar] [CrossRef]
- Fernandes, J.; Mateus, R.; Bragança, L. The potential of vernacular materials to the sustainable building design. In Proceedings of the Vernacular Heritage and Earthen Architecture, Vila Nova de Cerveira, Portugal, 16–20 October 2013; CRC Press: London, UK, 2014; pp. 623–629. [Google Scholar]
- Tadeu, S.; Tadeu, A.; Simões, N.; Gonçalves, M.; Prado, R. A sensitivity analysis of a cost optimality study on the energy retrofit of a single-family reference building in Portugal. Energy Effic. 2018, 11, 1411–1432. [Google Scholar] [CrossRef]
- Hao, L.; Herrera-Avellanosa, D.; Del Pero, C.; Troi, A. What Are the Implications of Climate Change for Retrofitted Historic Buildings? A Literature Review. Sustainability 2020, 12, 7557. [Google Scholar] [CrossRef]
- Santamouris, M. Present and Future Challenges and Opportunities in the Built Environment BT. In Bioclimatic Approaches in Urban and Building Design; Chiesa, G., Ed.; PoliTO Springer Series: Cham, Switzerland, 2021; pp. 111–116. ISBN 978-3-030-59328-5. [Google Scholar]
- Della Torre, S.; Pianezze, F.; Pracchi, V. Efficienza Energetica e Patrimonio Architettonico: Stato dell’Arte e Prospettive di Ricercar; Arkos Sci. e Restauro: Turin, Italy, 2010; p. 52. [Google Scholar]
- Fusco Girard, L.; Cerreta, M.; De Toro, P. Sviluppo delle competenze nel processo di agenda 21 locale: I risultati di un percorso di ricerca. Boll. Dip. Conserv. Beni Archit. Ambient. Univ. Stud. Napoli 2002, 4, 105–111. [Google Scholar]
- Litti, G.; Khoshdel, S.; Audenaert, A.; Braet, J. Hygrothermal performance evaluation of traditional brick masonry in historic buildings. Energy Build. 2015, 105, 393–411. [Google Scholar] [CrossRef]
- Giuliani, M.; Henze, G.P.; Florita, A.R. Modelling and calibration of a high-mass historic building for reducing the prebound effect in energy assessment. Energy Build. 2016, 116, 434–448. [Google Scholar] [CrossRef]
- Roberti, F.; Oberegger, U.F.; Gasparella, A. Calibrating historic building energy models to hourly indoor air and surface temperatures: Methodology and case study. Energy Build. 2015, 108, 236–243. [Google Scholar] [CrossRef]
- Cornaro, C.; Puggioni, V.A.; Strollo, R.M. Dynamic simulation and on-site measurements for energy retrofit of complex historic buildings: Villa Mondragone case study. J. Build. Eng. 2016, 6, 17–28. [Google Scholar] [CrossRef]
- Cardinale, N.; Rospi, G.; Stefanizzi, P. Energy and microclimatic performance of Mediterranean vernacular buildings: The Sassi district of Matera and the Trulli district of Alberobello. Build. Environ. 2013, 59, 590–598. [Google Scholar] [CrossRef]
- Anna-Maria, V. Evaluation of a sustainable Greek vernacular settlement and its landscape: Architectural typology and building physics. Build. Environ. 2009, 44, 1095–1106. [Google Scholar] [CrossRef]
- Field, C.B.; Barros, V.R.; Mach, K.; Mastrandrea, M. Climate Change 2014: Impacts, Adaptation, and Vulnerability; Cambridge University Press: Cambridge, UK; New York, NY, USA, 2014; Volume 1. [Google Scholar]
- Leissner, J.; Beuschlein, S.; Pilz, M.; Martin, G.; Blades, N.; Redol, P. Assessment and monitoring the environment of cultural property (AMECP Project). Eur. Cult. Herit. Newsl. Res. ECHNLR 1997, 10, 5–50. [Google Scholar]
- Laser Multitask Non-Destructive Technology in Conservation Diagnostic Procedures (LASERACT). Available online: https://cordis.europa.eu/project/id/EVK4-CT-2002-00096 (accessed on 21 December 2020).
- Global Climate Change Impact on Built Heritage and Cultural Landscapes (NOAHS ARK Project). Available online: https://cordis.europa.eu/project/id/501837 (accessed on 21 December 2020).
- Friendly Heating: Confortable to People and Compatible with Conservation of Art Works Preserved in Churches (Friendly Heating Project). Available online: https://cordis.europa.eu/project/id/EVK4-CT-2001-00067/fr (accessed on 21 December 2020).
- On-Site Investigation Techniques for the Structural Evaluation of Historic Masonry Buildings (OnSiteForMasonry Project). Available online: https://cordis.europa.eu/project/id/EVK4-CT-2001-00060 (accessed on 21 December 2020).
- Smart Monitoring of Historic Structures (SMooHS Project). Available online: https://cordis.europa.eu/project/id/212939 (accessed on 21 December 2020).
- Damage Risk Assessment, Economic Impact and Mitigation Strategies for Sustainable Preservation of Cultural Heritage in the Times of Climate Change (Climate for Culture Project). Available online: https://cordis.europa.eu/project/id/226973 (accessed on 21 December 2020).
- Remund, J.; Müller, S.; Kunz, S.; Huguenin-Landl, B.; Studer, C.; Cattin, S. Meteonorm Handbook Part I: Software. 2012, pp. 1–58. Available online: http://www.meteonorm.com/en/downloads/documents/ (accessed on 21 December 2020).
- Sesana, E.; Bertolin, C.; Gagnon, A.S.; Hughes, J.J. Mitigating Climate Change in the Cultural Built Heritage Sector. Climate 2019, 7, 90. [Google Scholar] [CrossRef]
- United Nations. Take Action for the Sustainable Development Goals. Available online: https://www.un.org/sustainabledevelopment/sustainable-development-goals/ (accessed on 13 January 2021).
- Zordan, L.; Morganti, R.; De Berardinis, P. La casa in pietra nei contesti storici d’Abruzzo: Dalle tradizioni del costruire alla conservazione attiva. Arkos Sci. Restauro Archit. 2006, 7, 25–32. [Google Scholar]
- Zordan, L.; Bellicoso, A.; Berardinis, P.D.; Morganti, R. Dalla Conoscenza al Progetto. Tutela e Valorizzazione dell’Edilizia di Base nei Contesti Storici dell’Abruzzo. In Proceedings of the Secondo Congresso Internazionale Ar. Tecnica, Turin, Italy, 9–11 November 2006; CELID: Turin, Italy, 2006; Volume 1, pp. 505–514. [Google Scholar]
- Alexander, L.; Herold, N. Clim PACT2. Indices Software. A Doc. Prep. behalf Comm. Climatol. Expert Team Sect. Clim. Indices. 2016. Available online: https://epic.awi.de/49274/1/ClimPACTv2_manual.pdf/ (accessed on 21 December 2020).
- De Tommasi, G.; Fatiguso, F.; De Fino, M. Riqualificazione Energetica del Patrimonio Edilizio Storico. Studi per il Geocluster dei Borghi Antichi in Area Mediterranea; EdicomEdizioni: Monfalcone, Italy, 2019; ISBN 9788896386811. [Google Scholar]
- SIT Puglia. Available online: www.sit.puglia.it (accessed on 21 December 2020).
- Santamouris, M. Environmental Design of Urban Buildings: An Integrated Approach; Routledge: London, UK, 2013; ISBN 1136566945. [Google Scholar]
- Fatiguso, F.; De Fino, M.; Cantatore, E.; Scioti, A.; De Tommasi, G.; Hernandez, S. Energy models towards the retrofitting of the historic built heritage. WIT Trans. Built Environ. 2015, 153, 159–170. [Google Scholar]
- Fatiguso, F.; De Fino, M.; Cantatore, E. An energy retrofitting methodology of Mediterranean historical buildings. Manag. Environ. Qual. Int. J. 2015, 26, 984–997. [Google Scholar] [CrossRef]
- Cantatore, E.; De Fino, M.; Fatiguso, F. Strategies for energy retrofitting of historic urban districts. Prog. Ind. Ecol. Int. J. 2016, 10, 334. [Google Scholar] [CrossRef]


| Jan | Febr | Mar | April | May | June | July | Aug | Sept | Oct | Nov | Dec | |
|---|---|---|---|---|---|---|---|---|---|---|---|---|
| Meteonorm_Act | 9.1 | 9.1 | 12.5 | 16.9 | 20.6 | 24.6 | 28.2 | 27.3 | 22.1 | 18.8 | 14.6 | 10.6 |
| ARPA_2017 | 8.8 | 8.8 | 12.1 | 16.3 | 20.2 | 24.2 | 27.7 | 26.9 | 21.9 | 17.6 | 13.9 | 10.7 |
| Built Element | Code | Preservation Action | Preservation Code |
|---|---|---|---|
| Building scale | |||
| Wall | Wa1 | Substitution of plaster not avoided Covering of stone detail avoided Use of clear colored plaster | V.Wa1 |
| Wa2 | Maintenance of exposed stone Covering avoided | V.Wa2 | |
| Window | Wi1 | Maintenance of wooden frame Observance of dimensions Substitution of glasses not avoided | V.Wi1 |
| Ground floor ceiling | Cg1 | Substitution of plaster not avoided if lacking decorations | V.Cg1 |
| Cg2 | Maintenance of exposed stone Covering avoided | V.Cg2 | |
| Roof (inner) | Cin | Maintenance of wooden beams Covering avoided Overloading avoided | V.Cin |
| Roof (external) | Cex.a | No action on external surfaces Preservation of wooden subsystem | |
| Cex.b | Maintenance of stone tiles Replacement avoided | V.Cex.b | |
| Cex.c | No action on external surfaces Preservation of wooden subsystem | ||
| Basement slab | Bf1 | Maintenance of stone tiles Replacement avoided | V.Bf1 |
| District scale | |||
| “Basole” | B1 | Maintenance of stone tiles Replacement avoided | V.B1 |
| Code | Albedo | Emissivity |
| Wa1 | 0.60 | 0.95 |
| Wa2 | 0.5 | 0.9 |
| Cex.a | 0.4 | 0.9 |
| Cex.b | 0.6 | |
| Cex.c | 0.07 |
| S_H | Heating System | S_C | Cooling System |
|---|---|---|---|
| S_H.1 | condensing boiler | S_C.1 | air conditioning with inverter technology |
| S_H.2 | new gas-fired boiler | S_C.2 | air conditioning with on-off control |
| Building Surface Ratio (%) | Impervious Surface Ratio (%) | Pervious Surface Ratio (%) | Average Sky View Factor | Average Height of Buildings [m] | Aspect Ratio (H/W) | Roughness Length | ||
|---|---|---|---|---|---|---|---|---|
| Molfetta | 62.1% | 35.4% | 2.5% | Very Narrow street canyon | <0.1 | 11.5 | >3.5 | skimming |
| Narrow street canyon | 0.1–0.2 | |||||||
| Open spaces | >0.3 | |||||||
| Building-Type | Comp. Code | Component | Thickness [m] | Current Thermal Conductance [W/m2 K] | Pase Shift τ/ Attenuation of Thermal Wave σ | Normative Threshold [W/m2 K] |
|---|---|---|---|---|---|---|
| Middle Tower house | Wa2 | Wall | 0.75 | 2 | 12h/0.7 | 0.38 |
| Cex.c | Roof | 0.17 | 2.83 | 0.36 | ||
| Bf1 | Basement slab | 0.08 | 1.83 | 0.40 | ||
| Wi1 | Window | - | 5.40 | 2.40 |
 | Measure Point | TMax [°C] | TMin [°C] | Tmean [°C] | σ |
| E1 | 33.00 | 24.70 | 28.15 | 2.75 | |
| E2 | 34.5 | 23.50 | 27.75 | 3.85 | |
| P1/P2 | 33.40 | 25.55 | 28.65 | 2.55 | |
| P3 | 33.30 | 25.10 | 28.40 | 2.95 |
| Component | Component Code | Transformation Degree | Intervention Code |
|---|---|---|---|
| Wall | Wa1 | T.W.M-H | I.Wa.1 |
| Wa2 | T.W.L | I.Wa.2 | |
| Roof | Cex.a + C.in | T.R.M | I.C.Opt.2 + I.C.Th.1 |
| Cex.b + C.in | T.R.M-L | I.C.Th.1 | |
| Cex.c + C.in | T.R.M | I.C.Opt.1 + I.C.Th.1 | |
| HVAC system | S_H–S_C | T.S.H | I.S.1 |
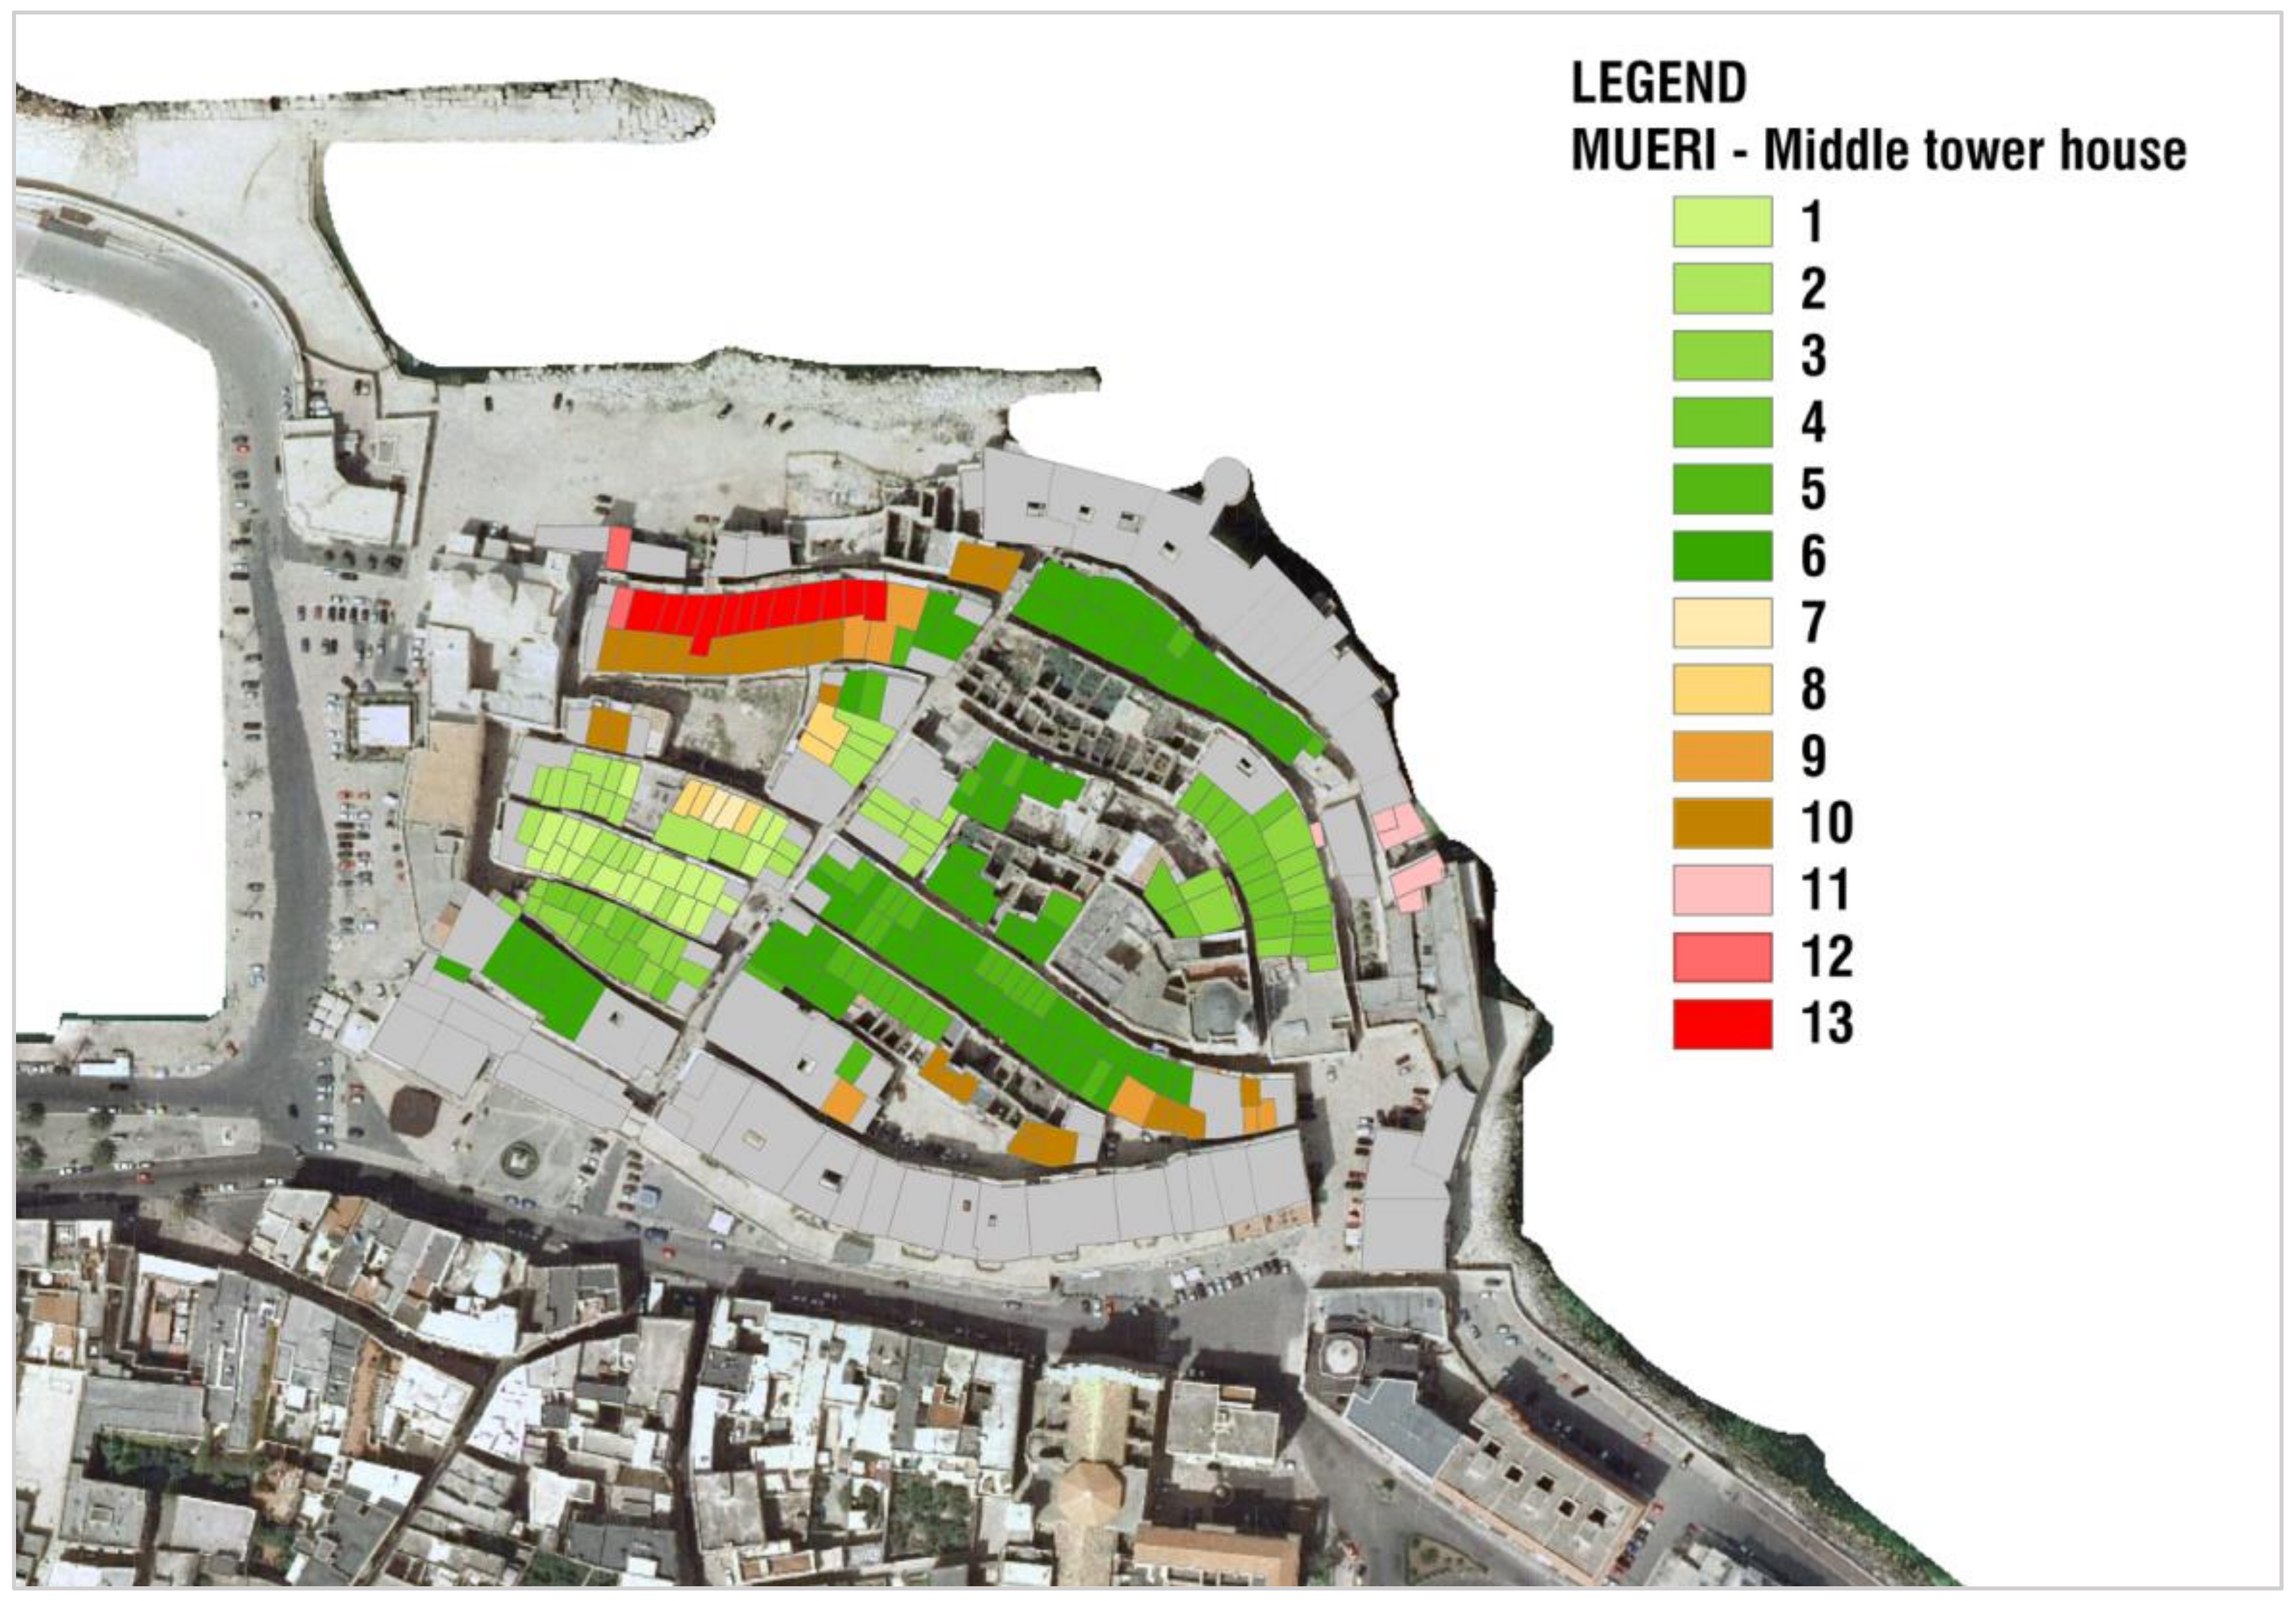
| MUERI Code | Adapt_Canyon | Adapt_Roof | Transf_Roof | Transf_wall | Score | Representa-Tiveness for Building Type [%] | Incidence of Emergency |
|---|---|---|---|---|---|---|---|
| 1 | A.C.H. | A.R.H. | T.R.M-L. | T.W.L. | 8 | 7.31% |  |
| 2 | A.C.H. | A.R.H. | T.R.M-L. | T.W.M-H. | 9 | 10.38% | |
| 3 | A.C.H. | A.R.M. | T.R.M. | T.W.L. | 8 | 6.54% | |
| 4 | A.C.H. | A.R.M. | T.R.M. | T.W.M-H. | 9 | 8.46% | |
| 5 | A.C.H. | A.R.L. | T.R.M. | T.W.L. | 7 | 10.77% | |
| 6 | A.C.H. | A.R.L. | T.R.M. | T.W.M-H. | 8 | 30.38% | |
| 7 | A.C.M. | A.R.H. | T.R.M-L. | T.W.L. | 7 | 0.77% | |
| 8 | A.C.M. | A.R.H. | T.R.M-L. | T.W.M-H. | 8 | 1.92% | |
| 9 | A.C.M. | A.R.L. | T.R.M. | T.W.L. | 6 | 2.69% | |
| 10 | A.C.M. | A.R.L. | T.R.M. | T.W.M-H. | 7 | 9.62% | |
| 11 | A.C.L. | A.R.H. | T.R.M-L. | T.W.L. | 6 | 1.92% | |
| 12 | A.C.L. | A.R.L. | T.R.M. | T.W.L. | 5 | 4.62% | |
| 13 | A.C.L. | A.R.L. | T.R.M. | T.W.M-H. | 6 | 4.62% |
Publisher’s Note: MDPI stays neutral with regard to jurisdictional claims in published maps and institutional affiliations. |
© 2021 by the authors. Licensee MDPI, Basel, Switzerland. This article is an open access article distributed under the terms and conditions of the Creative Commons Attribution (CC BY) license (http://creativecommons.org/licenses/by/4.0/).
Share and Cite
Cantatore, E.; Fatiguso, F. An Energy-Resilient Retrofit Methodology to Climate Change for Historic Districts. Application in the Mediterranean Area. Sustainability 2021, 13, 1422. https://doi.org/10.3390/su13031422
Cantatore E, Fatiguso F. An Energy-Resilient Retrofit Methodology to Climate Change for Historic Districts. Application in the Mediterranean Area. Sustainability. 2021; 13(3):1422. https://doi.org/10.3390/su13031422
Chicago/Turabian StyleCantatore, Elena, and Fabio Fatiguso. 2021. "An Energy-Resilient Retrofit Methodology to Climate Change for Historic Districts. Application in the Mediterranean Area" Sustainability 13, no. 3: 1422. https://doi.org/10.3390/su13031422
APA StyleCantatore, E., & Fatiguso, F. (2021). An Energy-Resilient Retrofit Methodology to Climate Change for Historic Districts. Application in the Mediterranean Area. Sustainability, 13(3), 1422. https://doi.org/10.3390/su13031422