Comprehensive Measurement and Regional Imbalance of China’s Green Development Performance
Abstract
1. Introduction
2. Materials and Methods
2.1. Materials
2.1.1. Division of Economic Regions
2.1.2. Analytical Framework of Green Development Performance
2.1.3. Index Selection and Data Source
2.2. Methods
2.2.1. Two-Stage Super-Efficiency Network SBM Model
2.2.2. Dagum Gini Coefficient Decomposition
2.2.3. Analysis of Convergence
3. Results
3.1. Green Development Performance and the Efficiency of Sub-Links
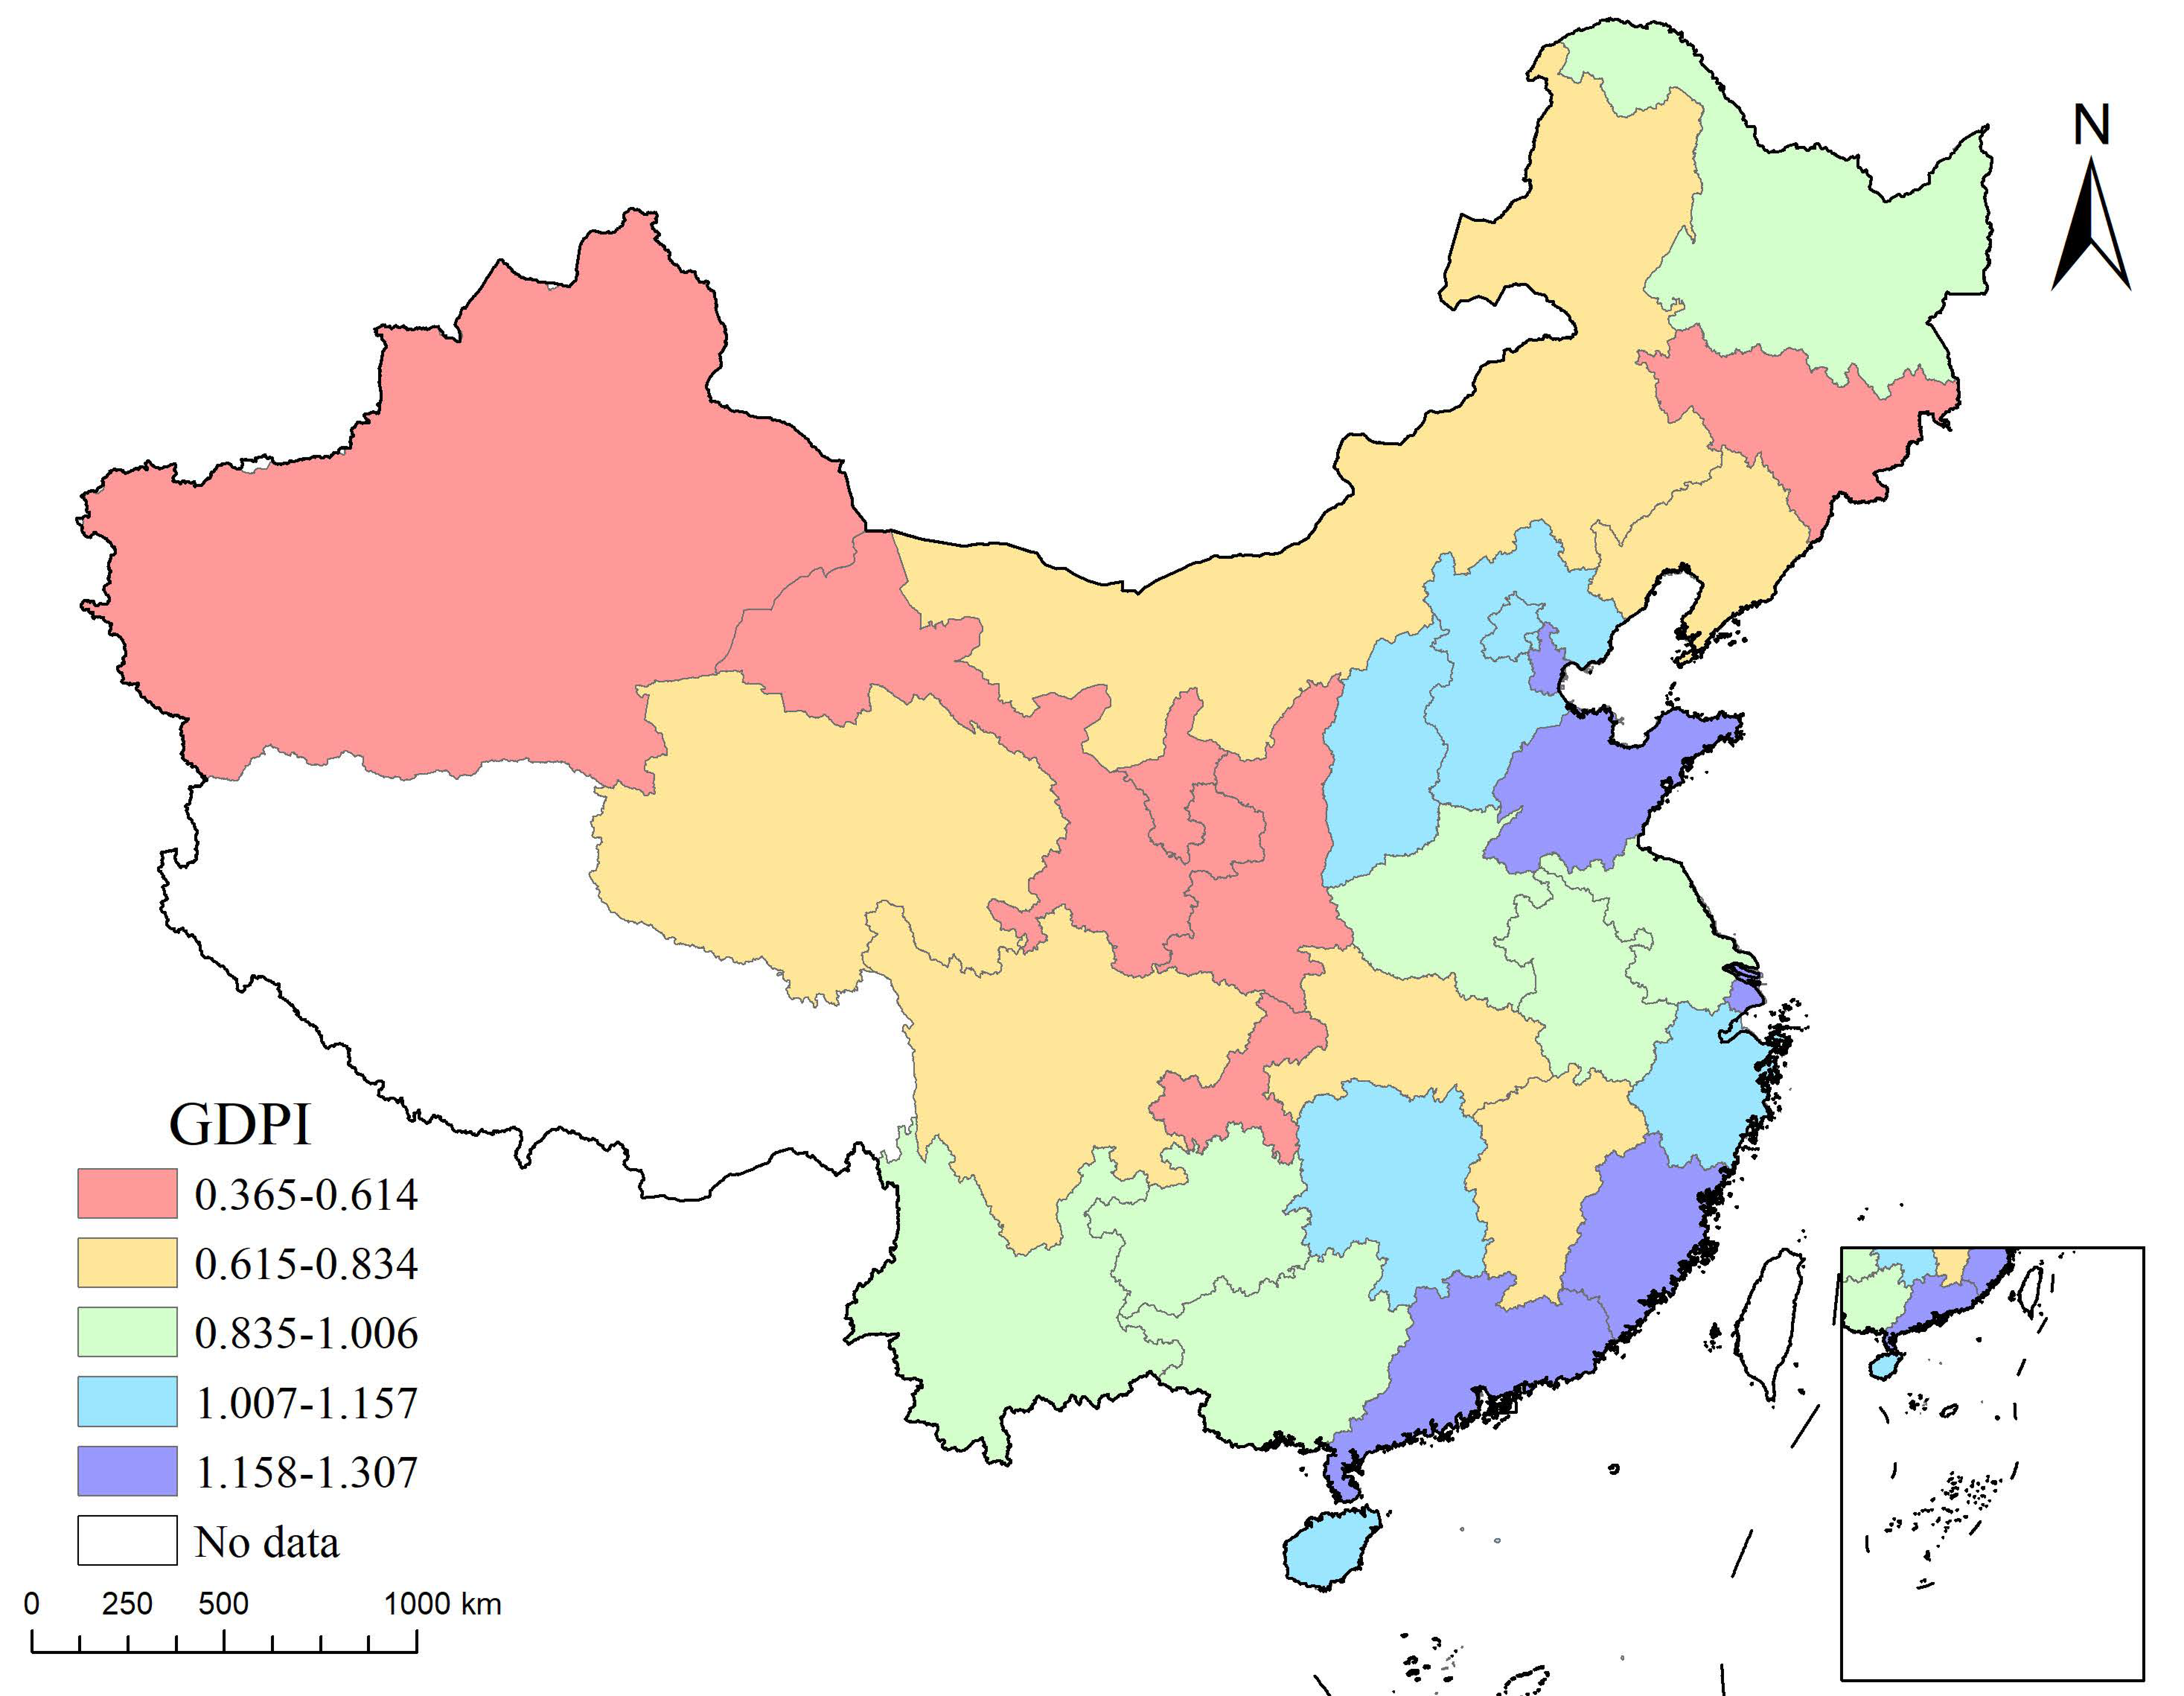
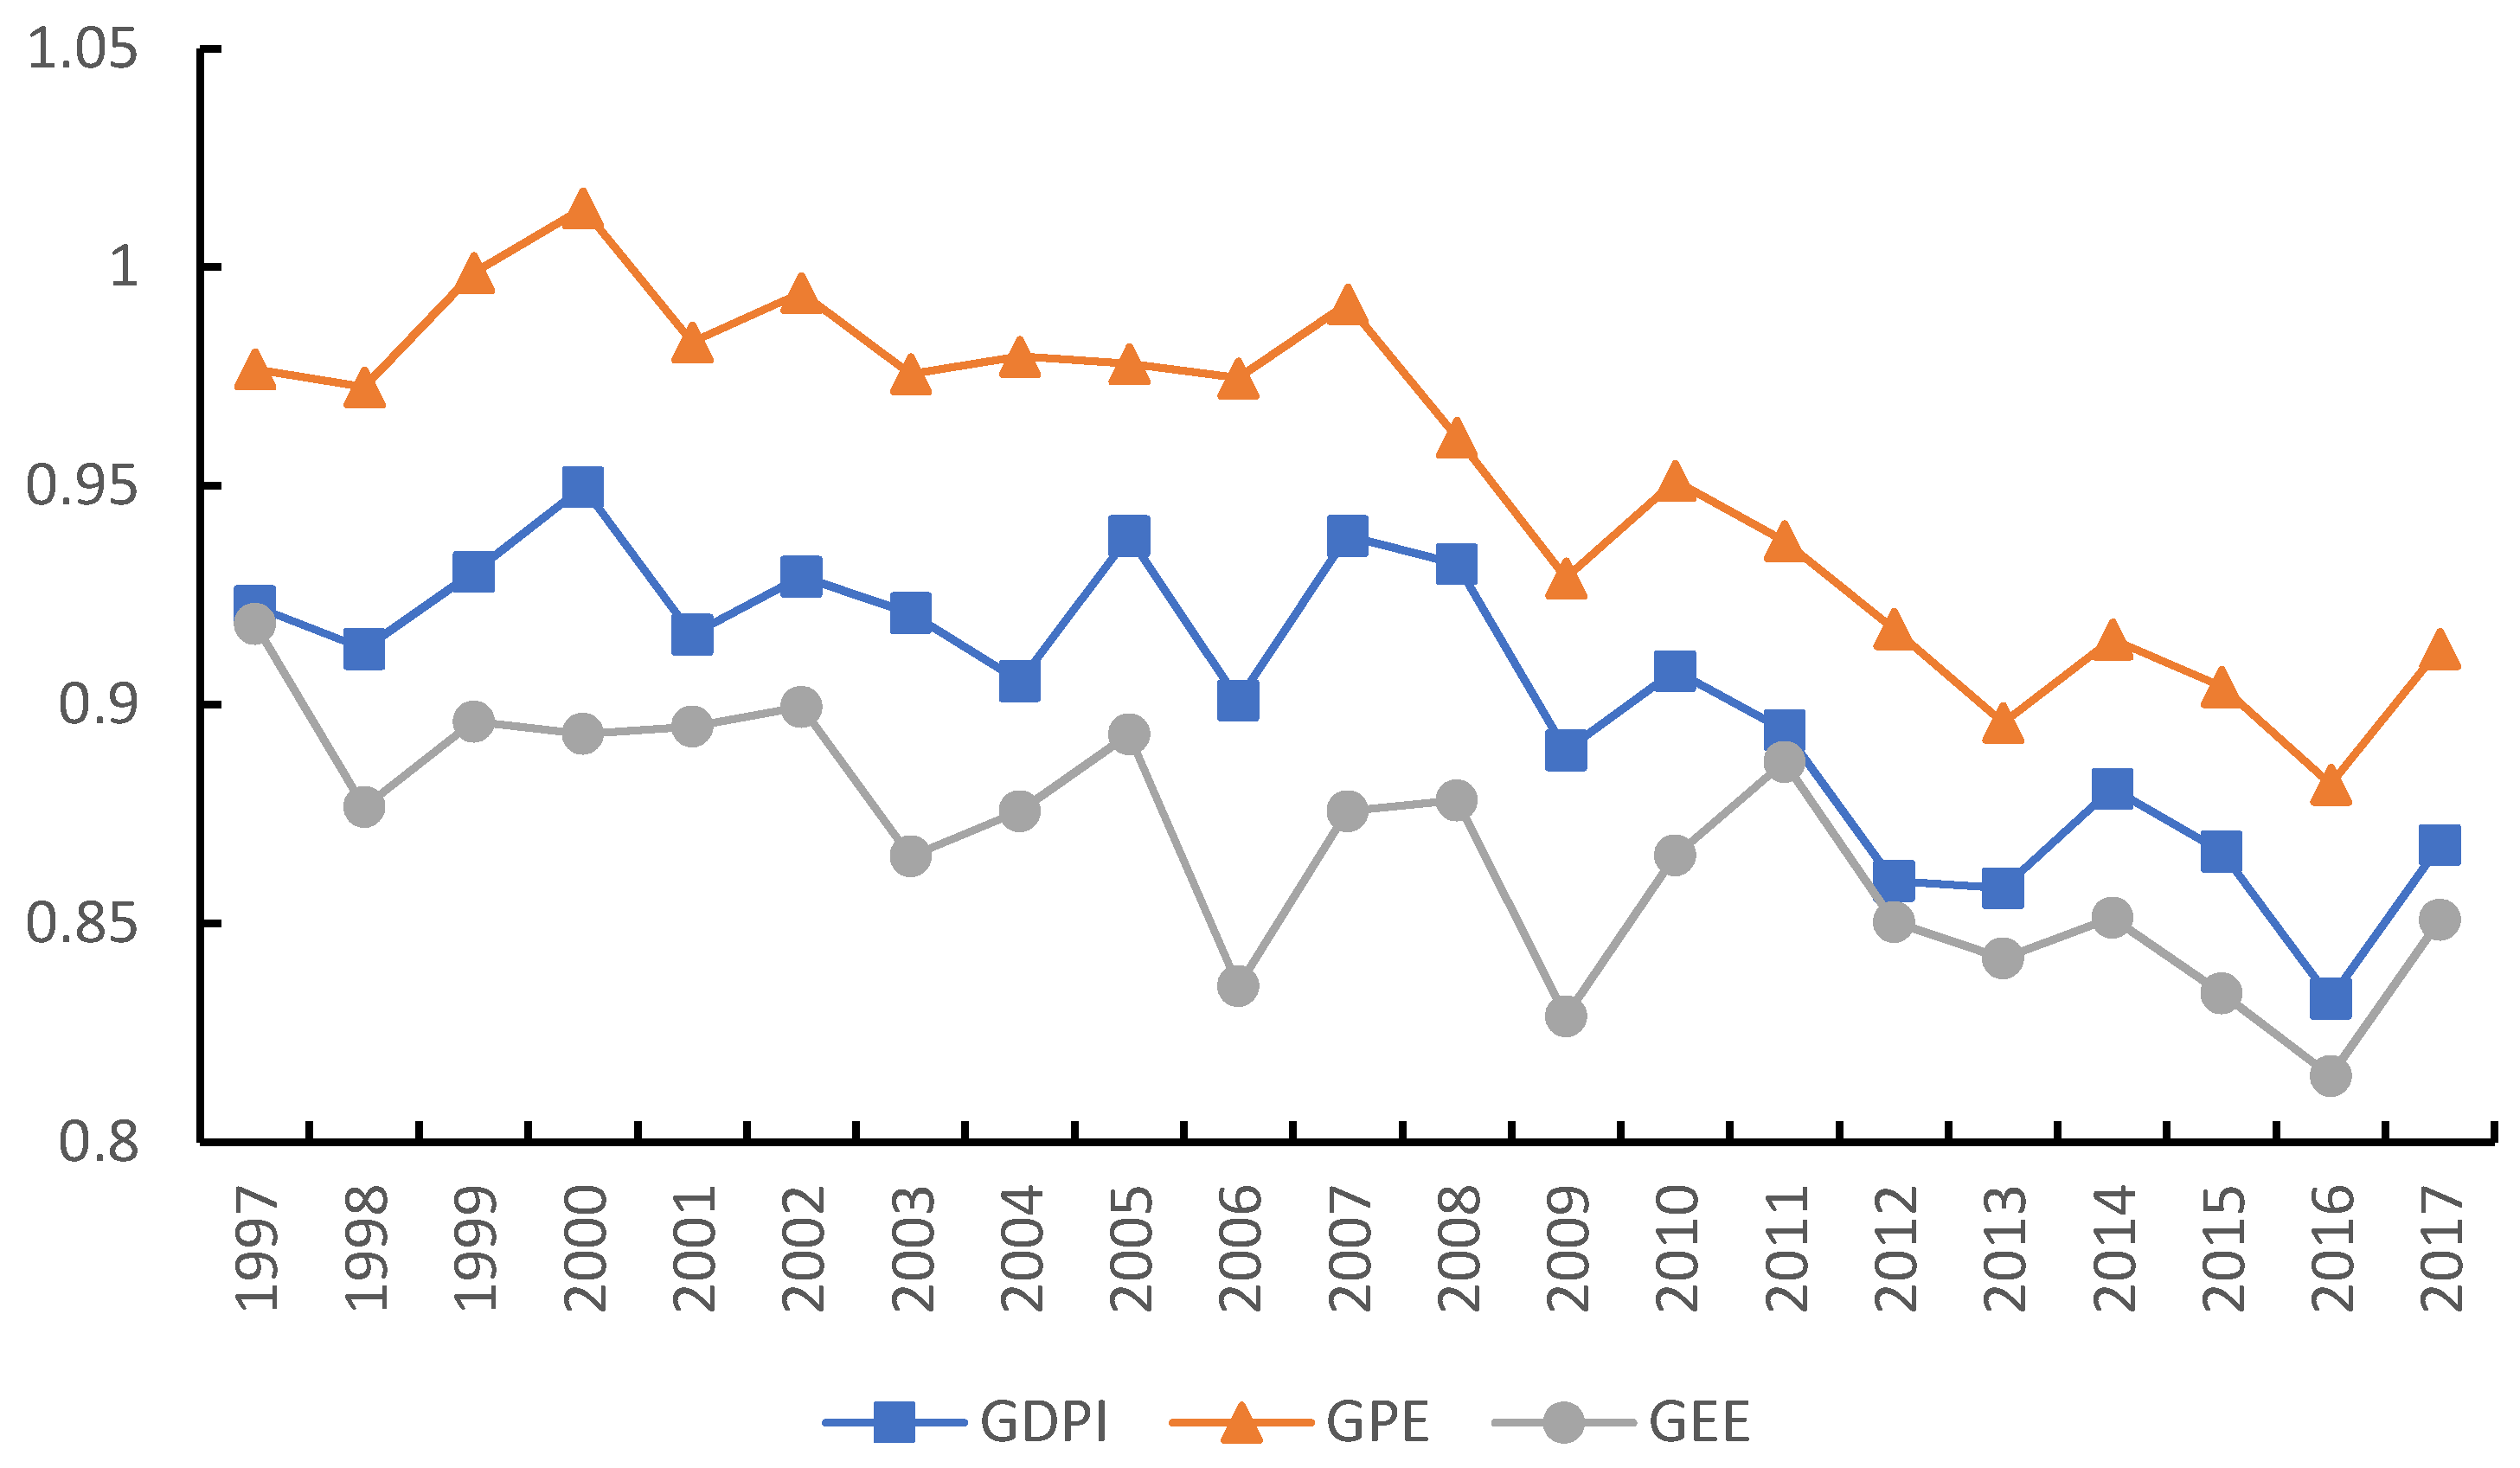
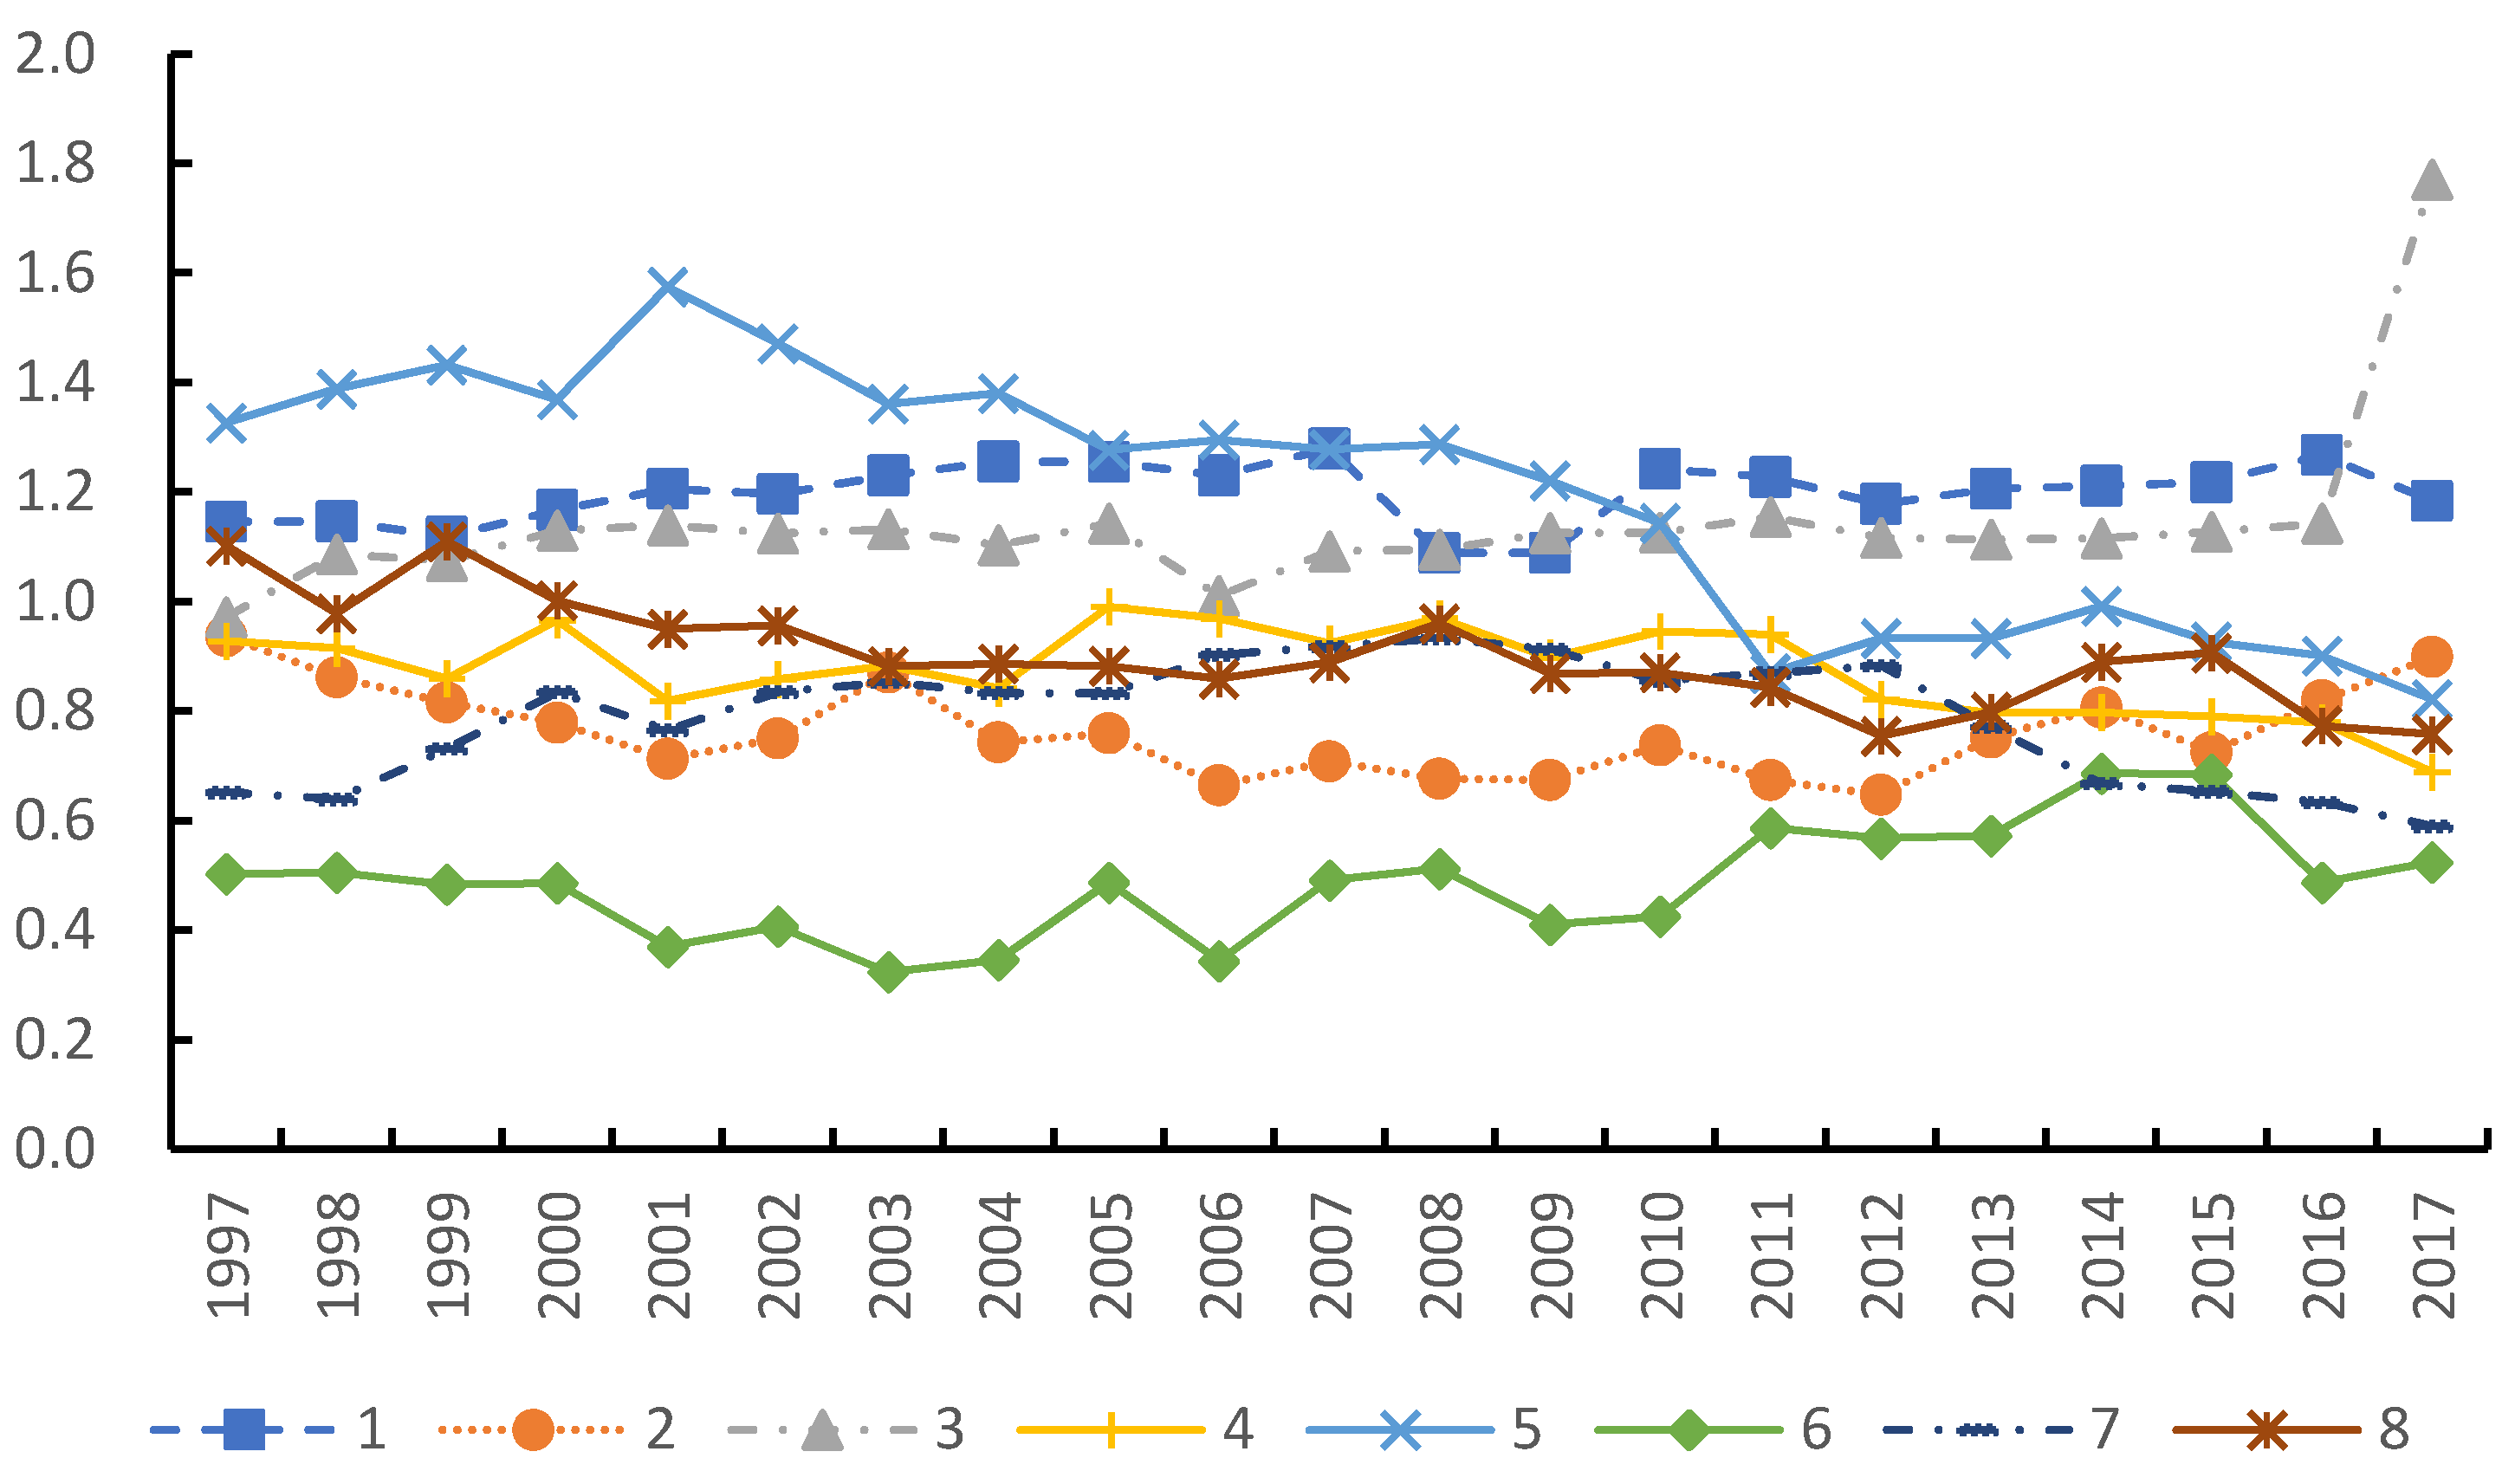
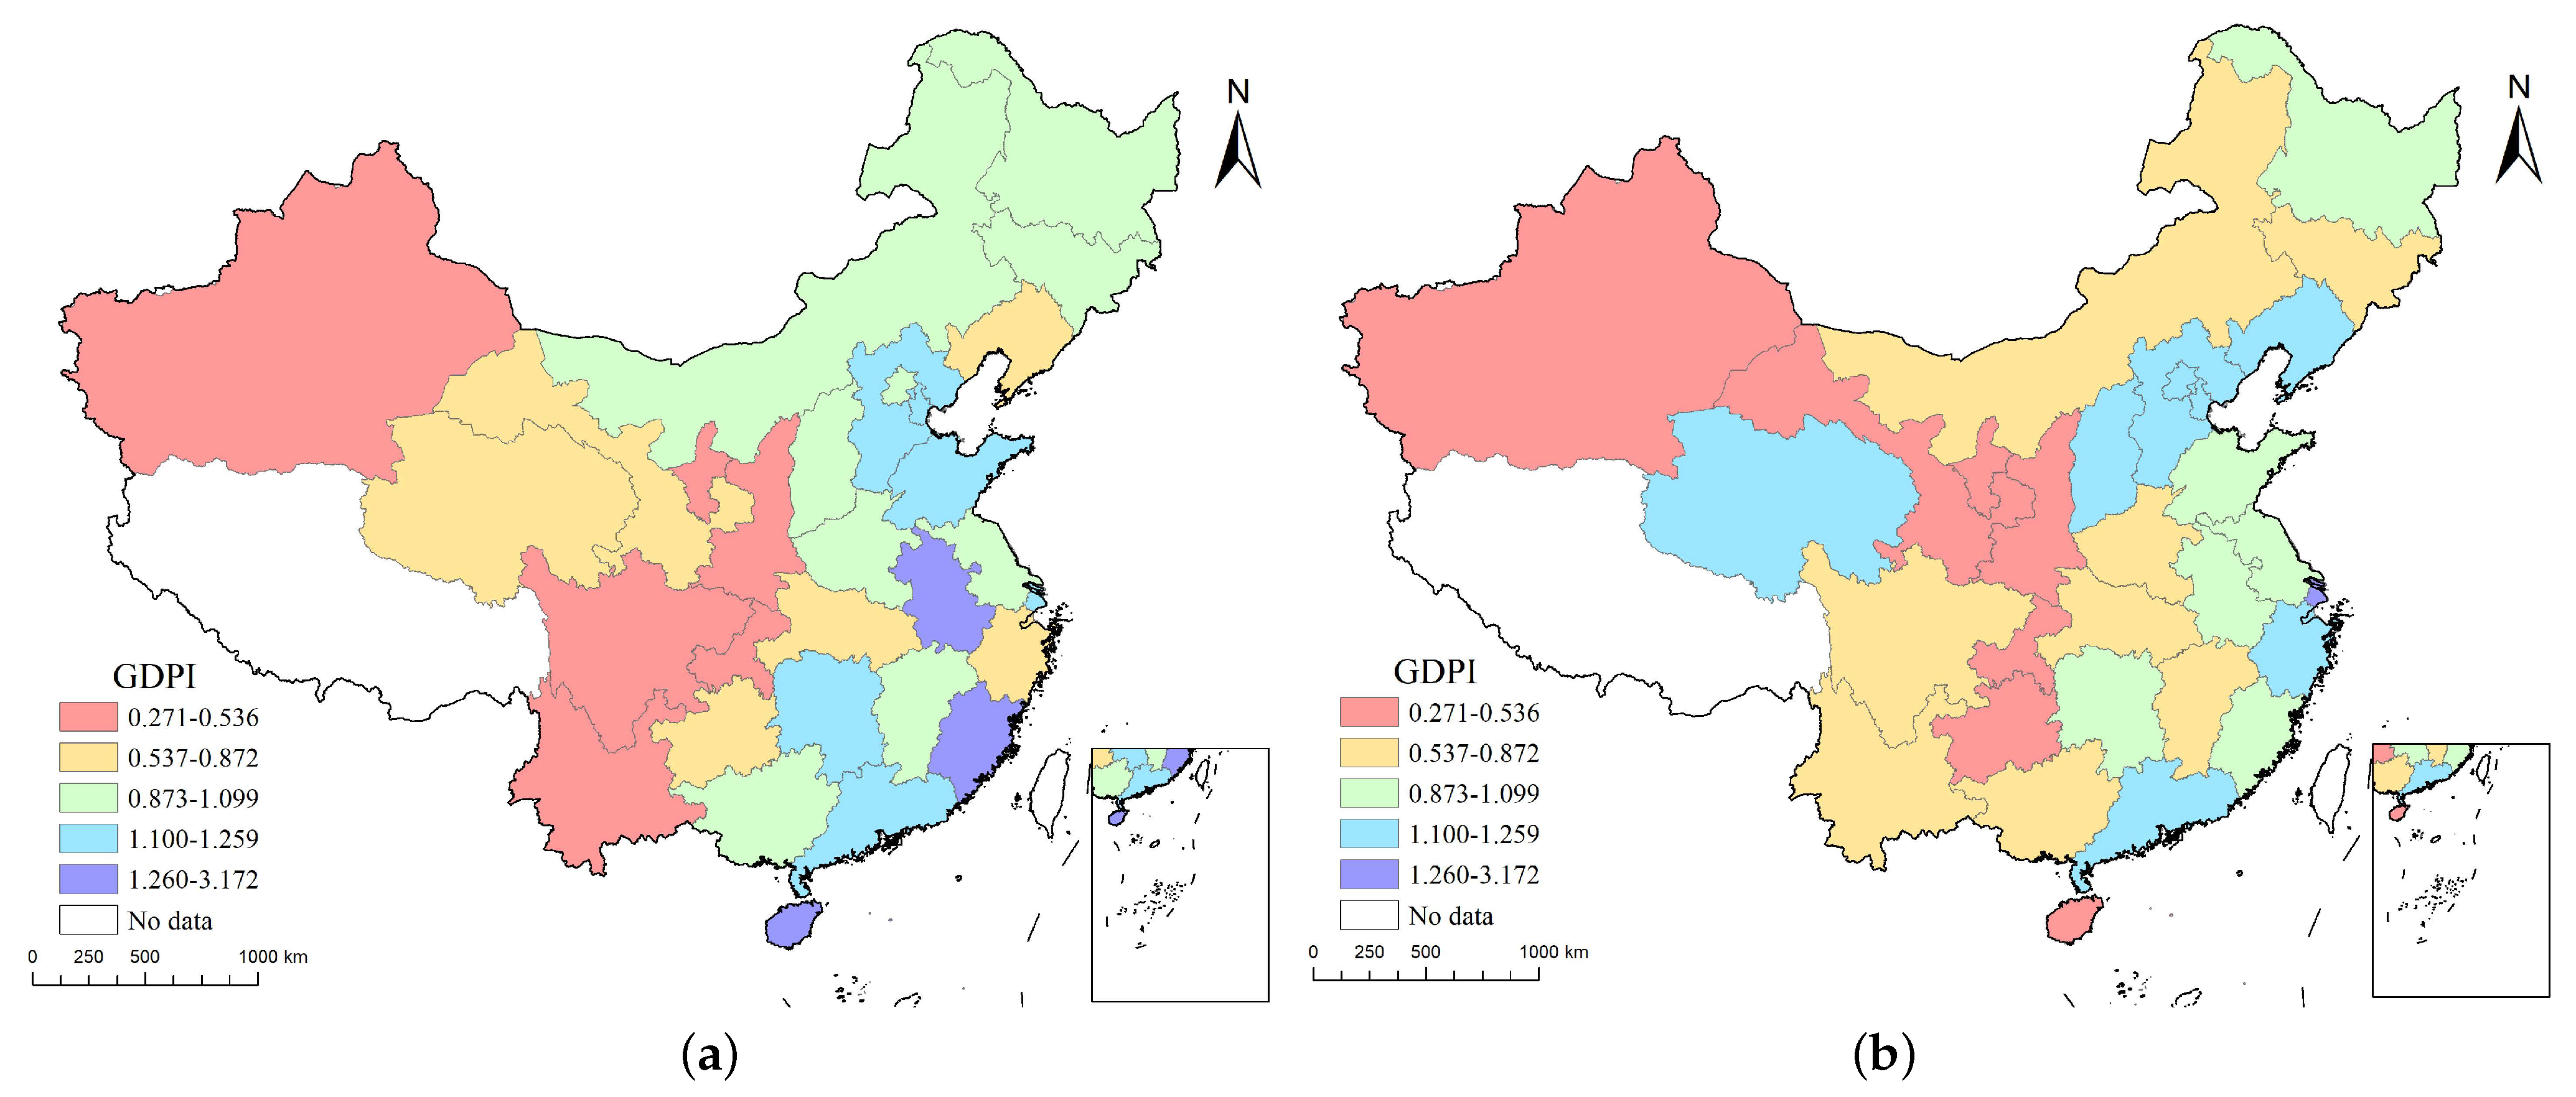
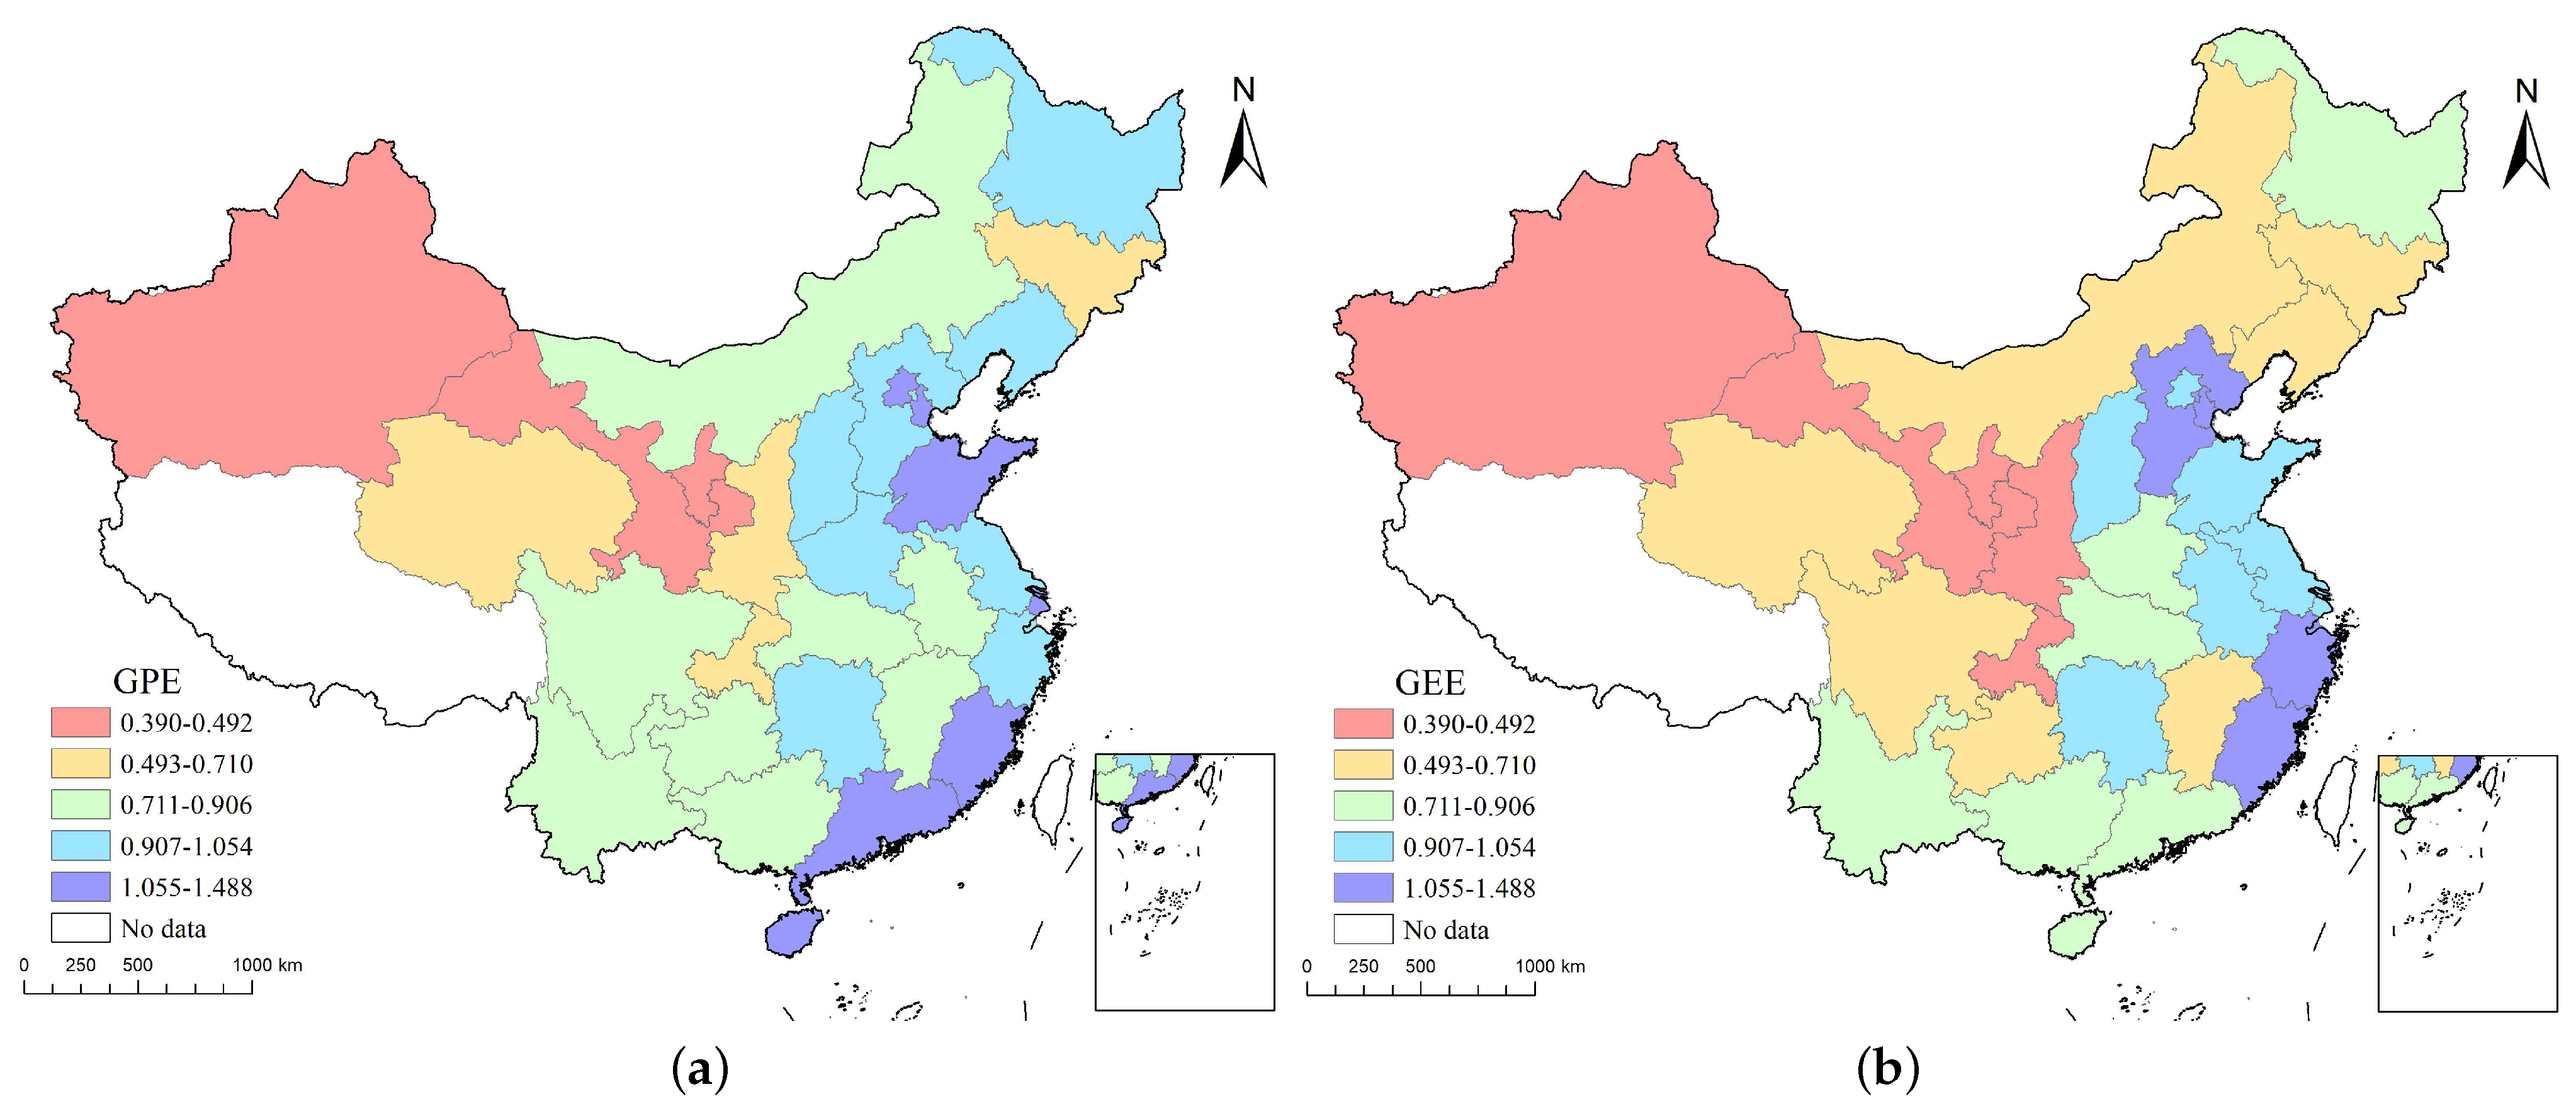
3.1.1. Comprehensive Evaluation of Green Development Performance
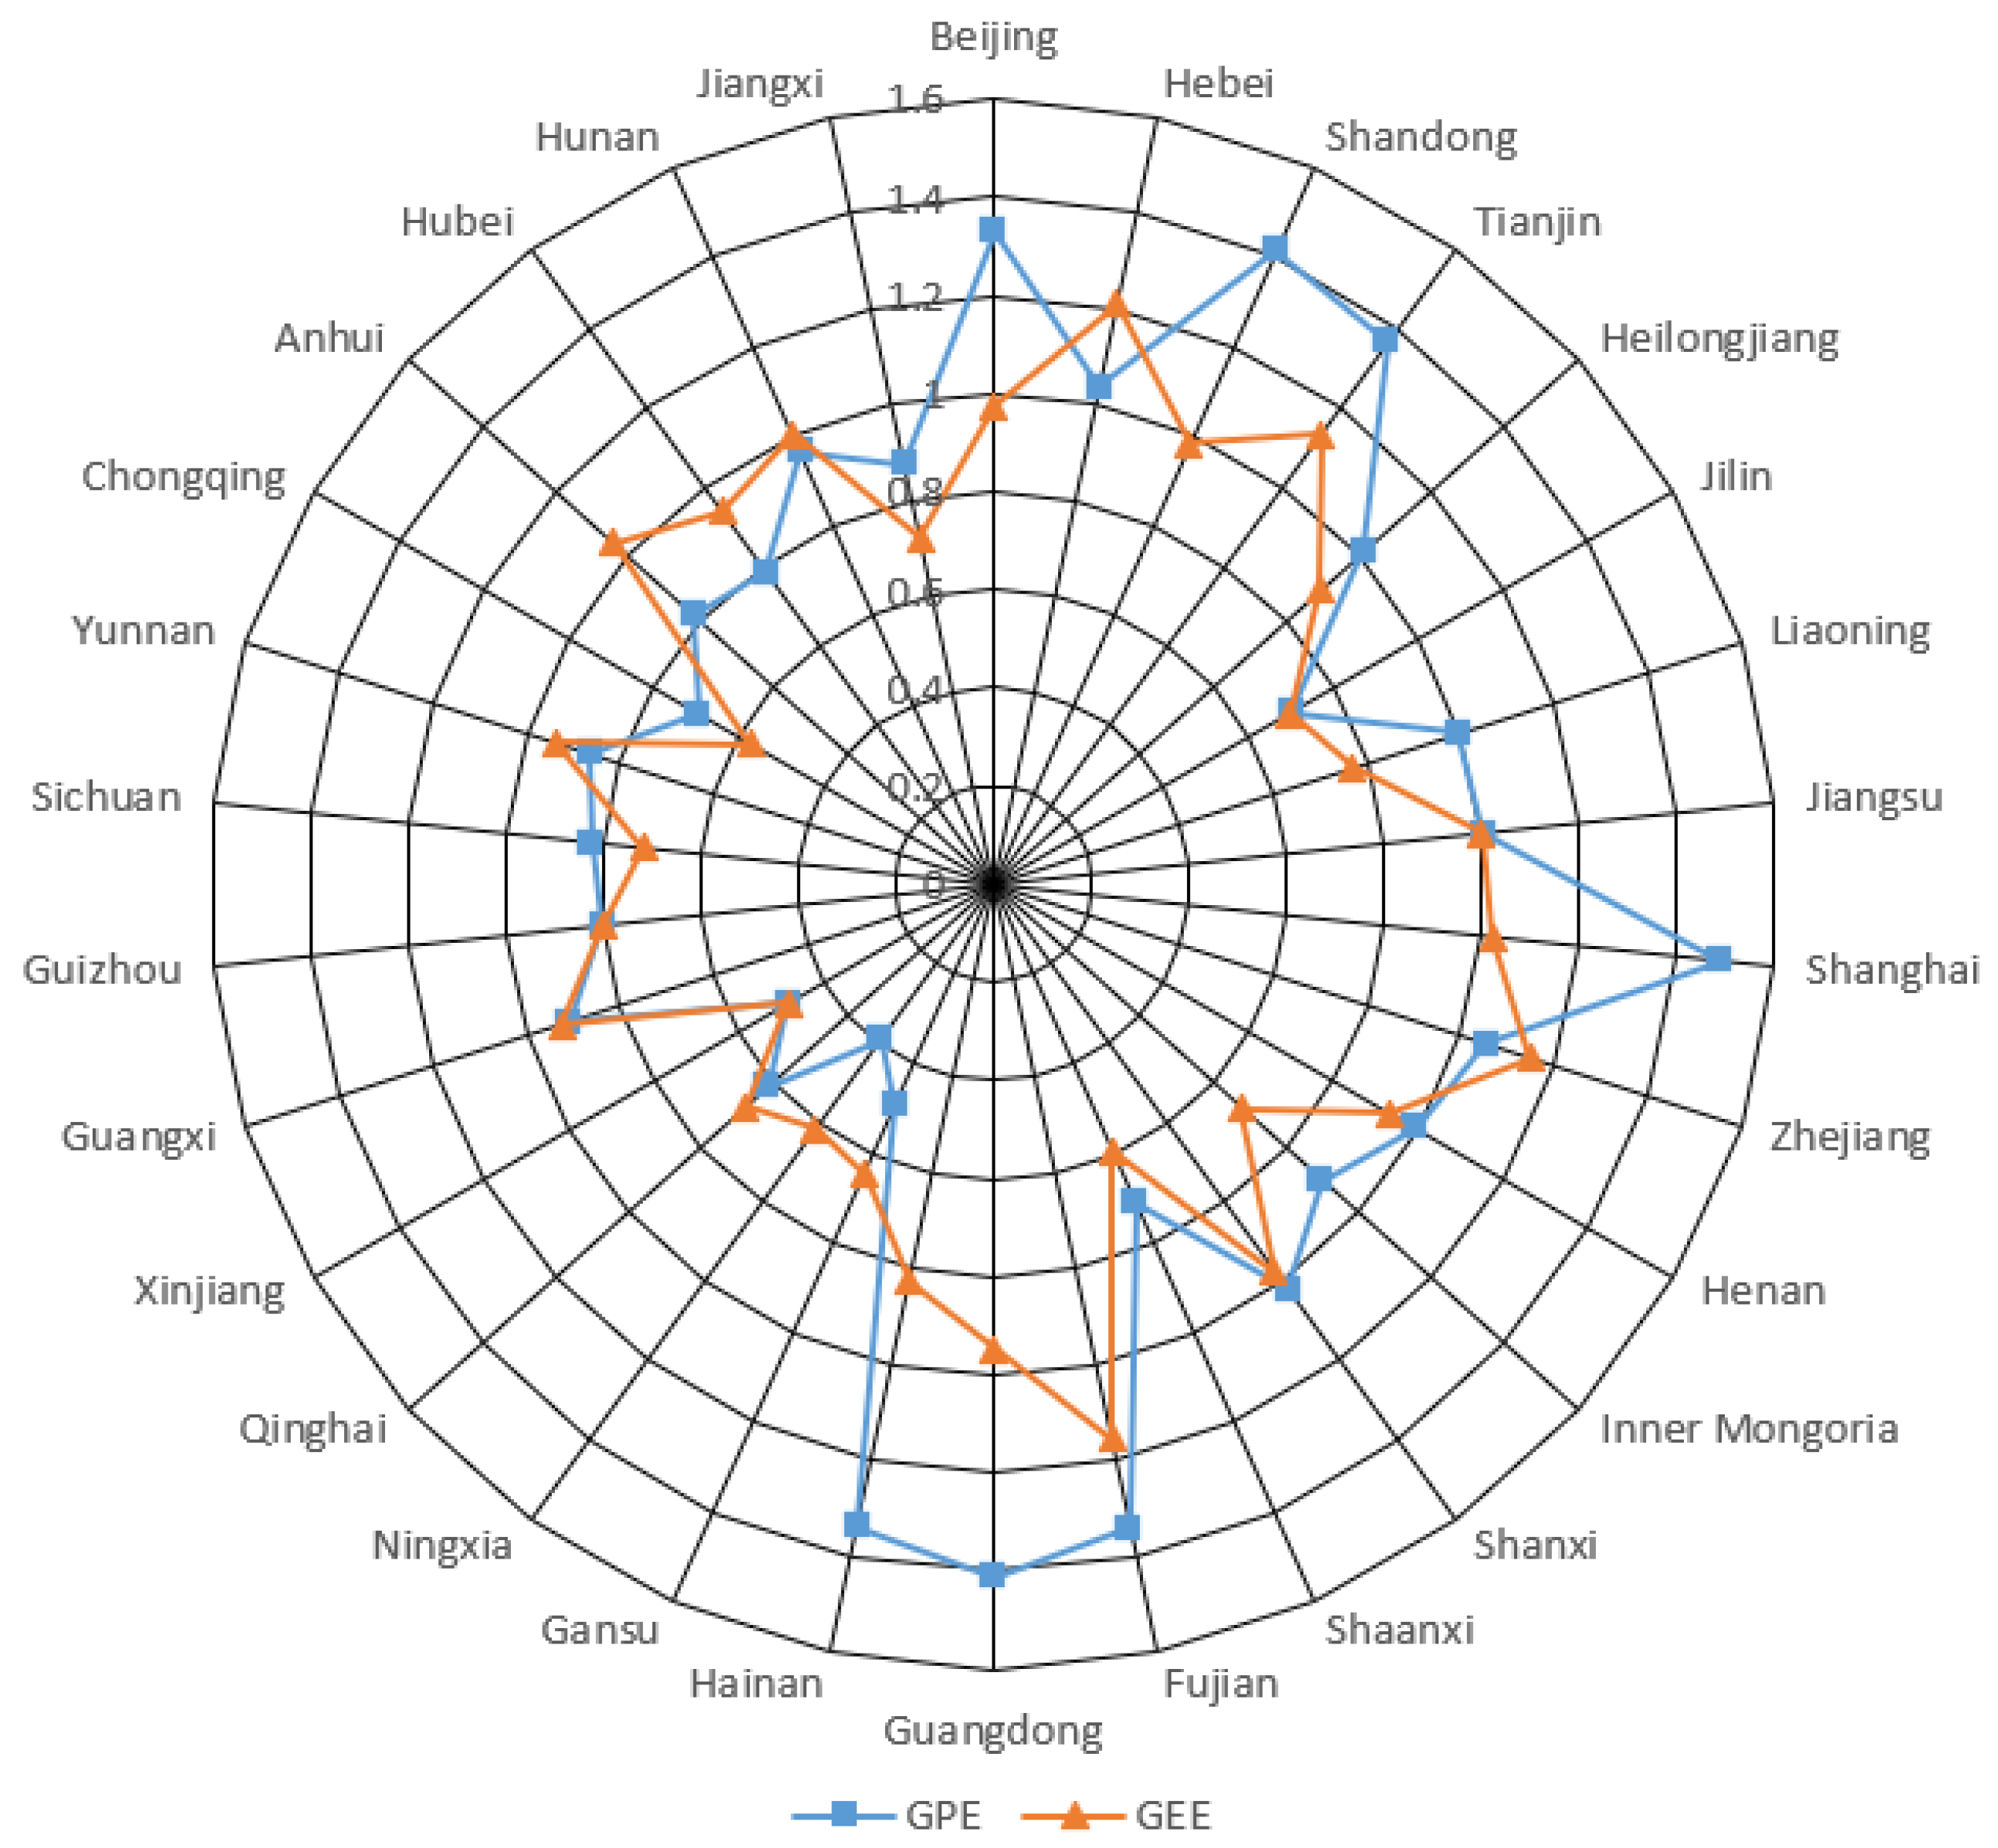
3.1.2. Comparative Analysis of Green Development Performance and Sub-Link Efficiency
3.2. Analysis of Regional Differences in Green Development Performance
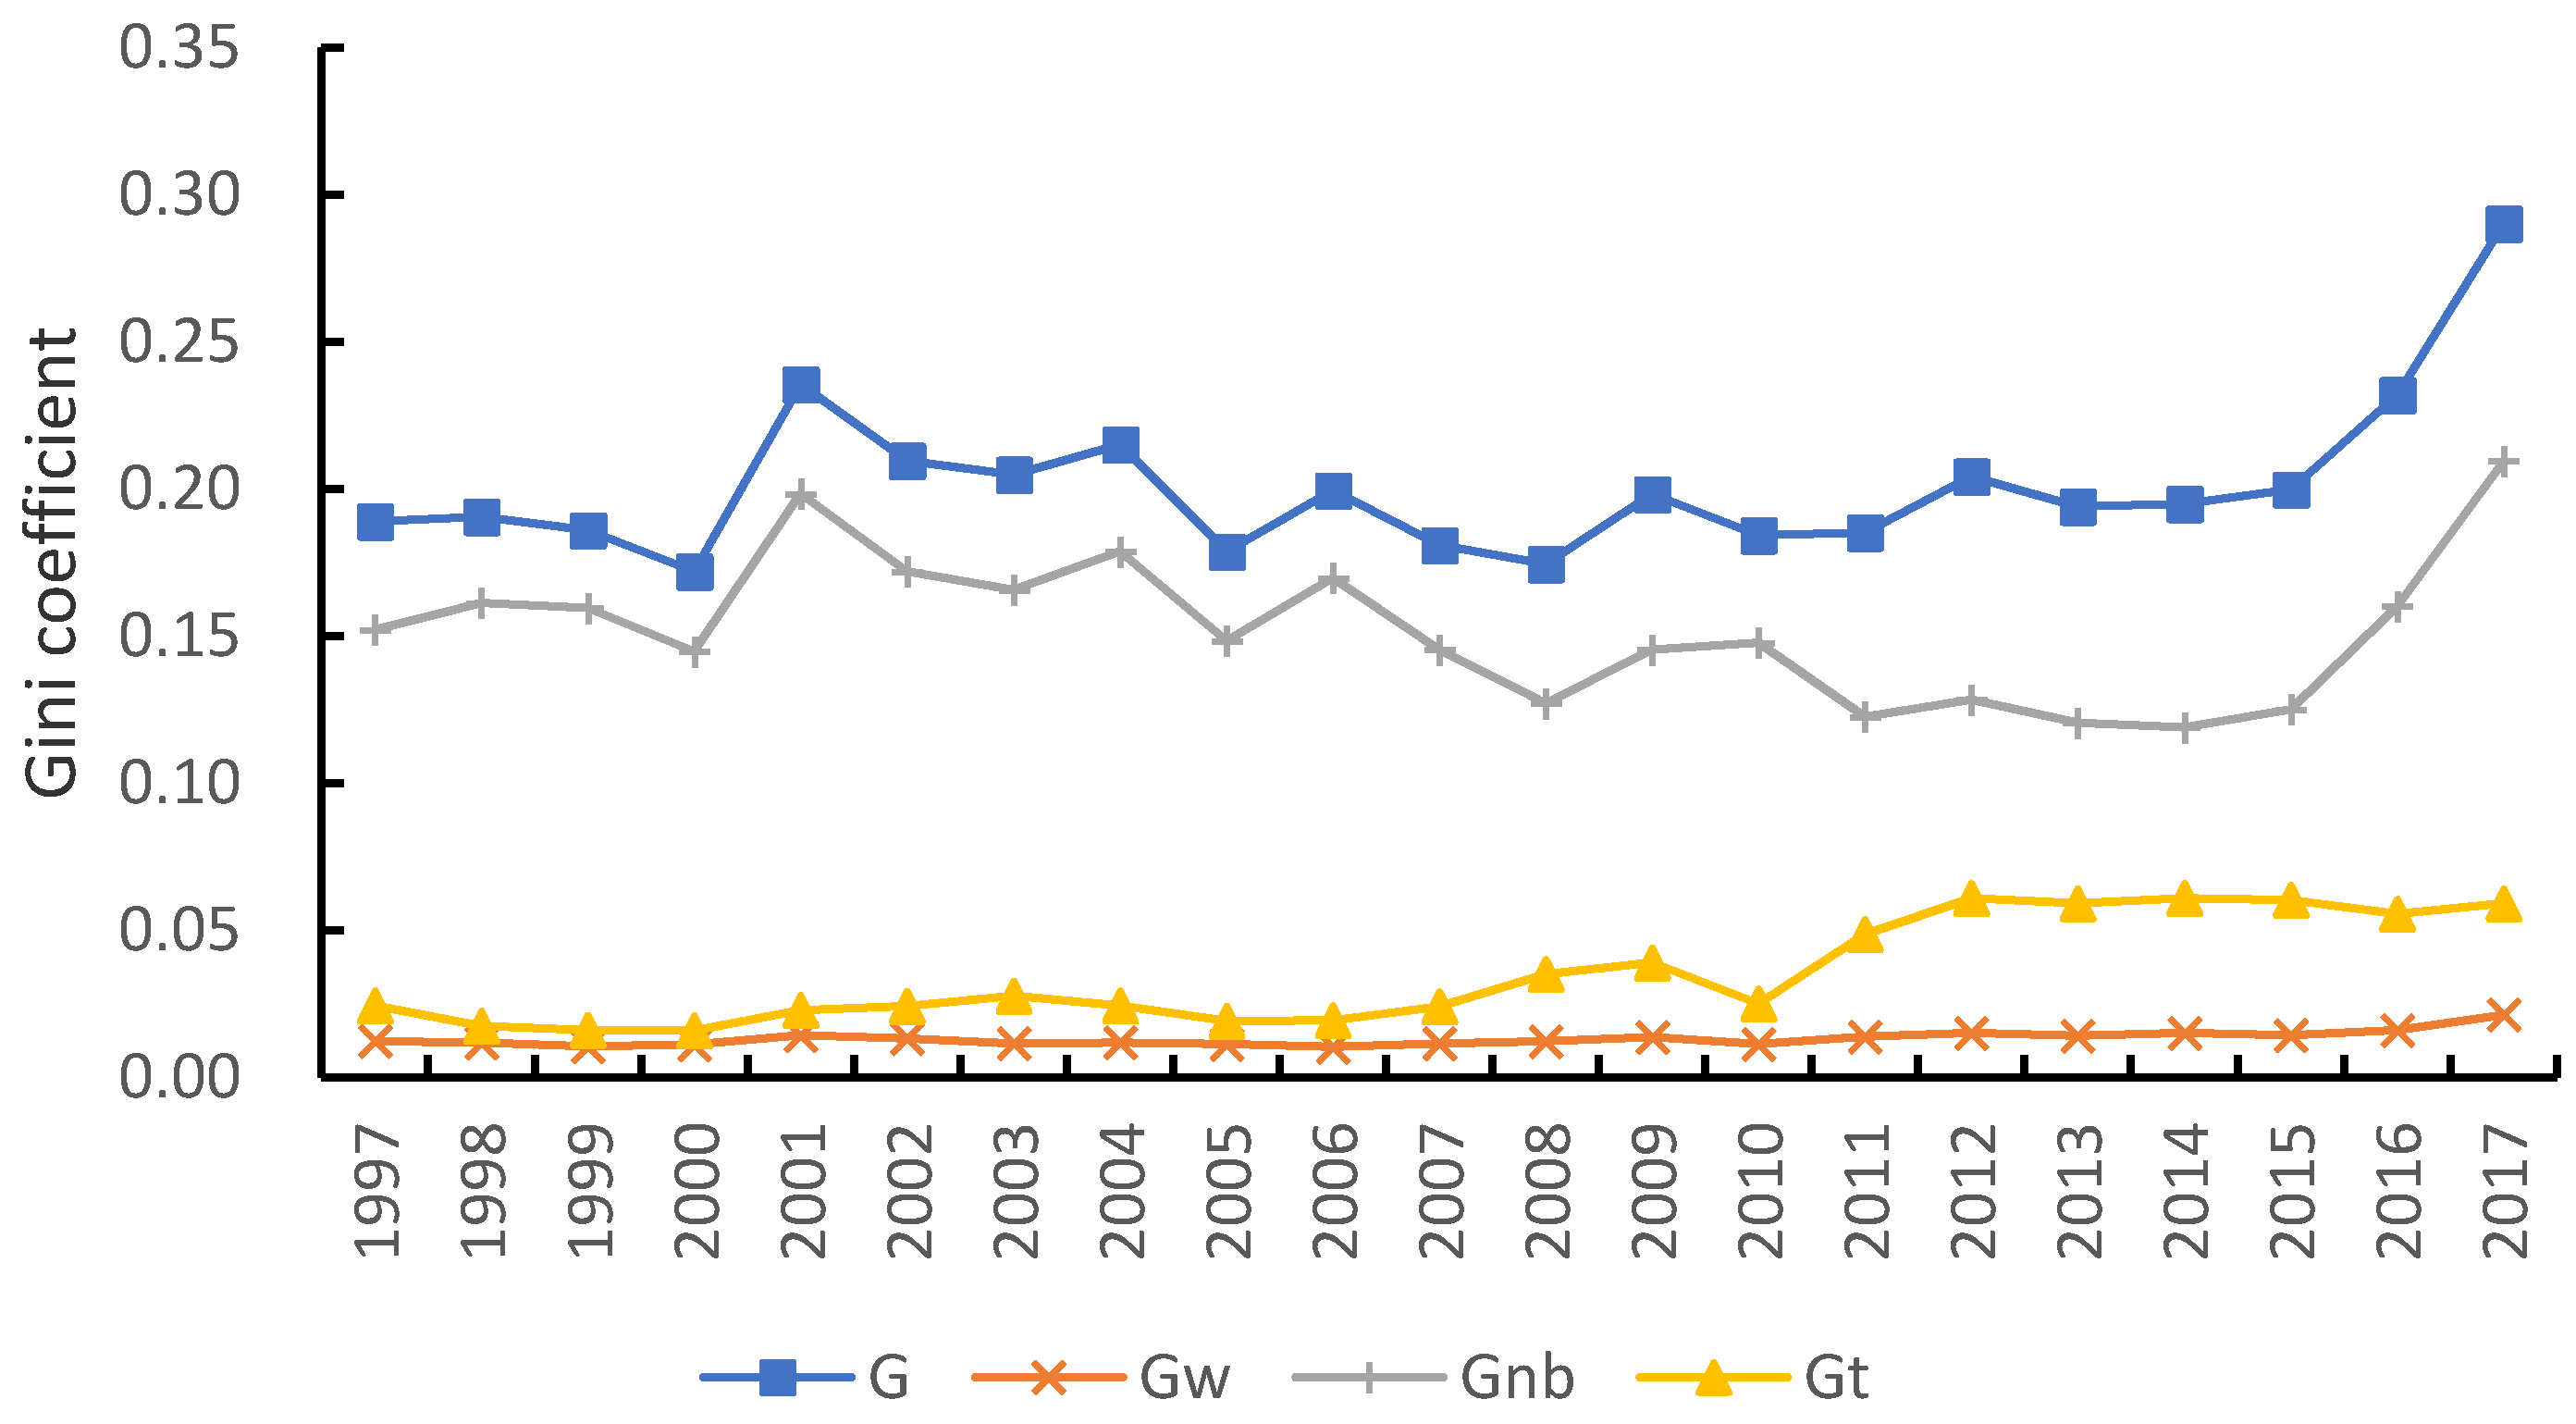
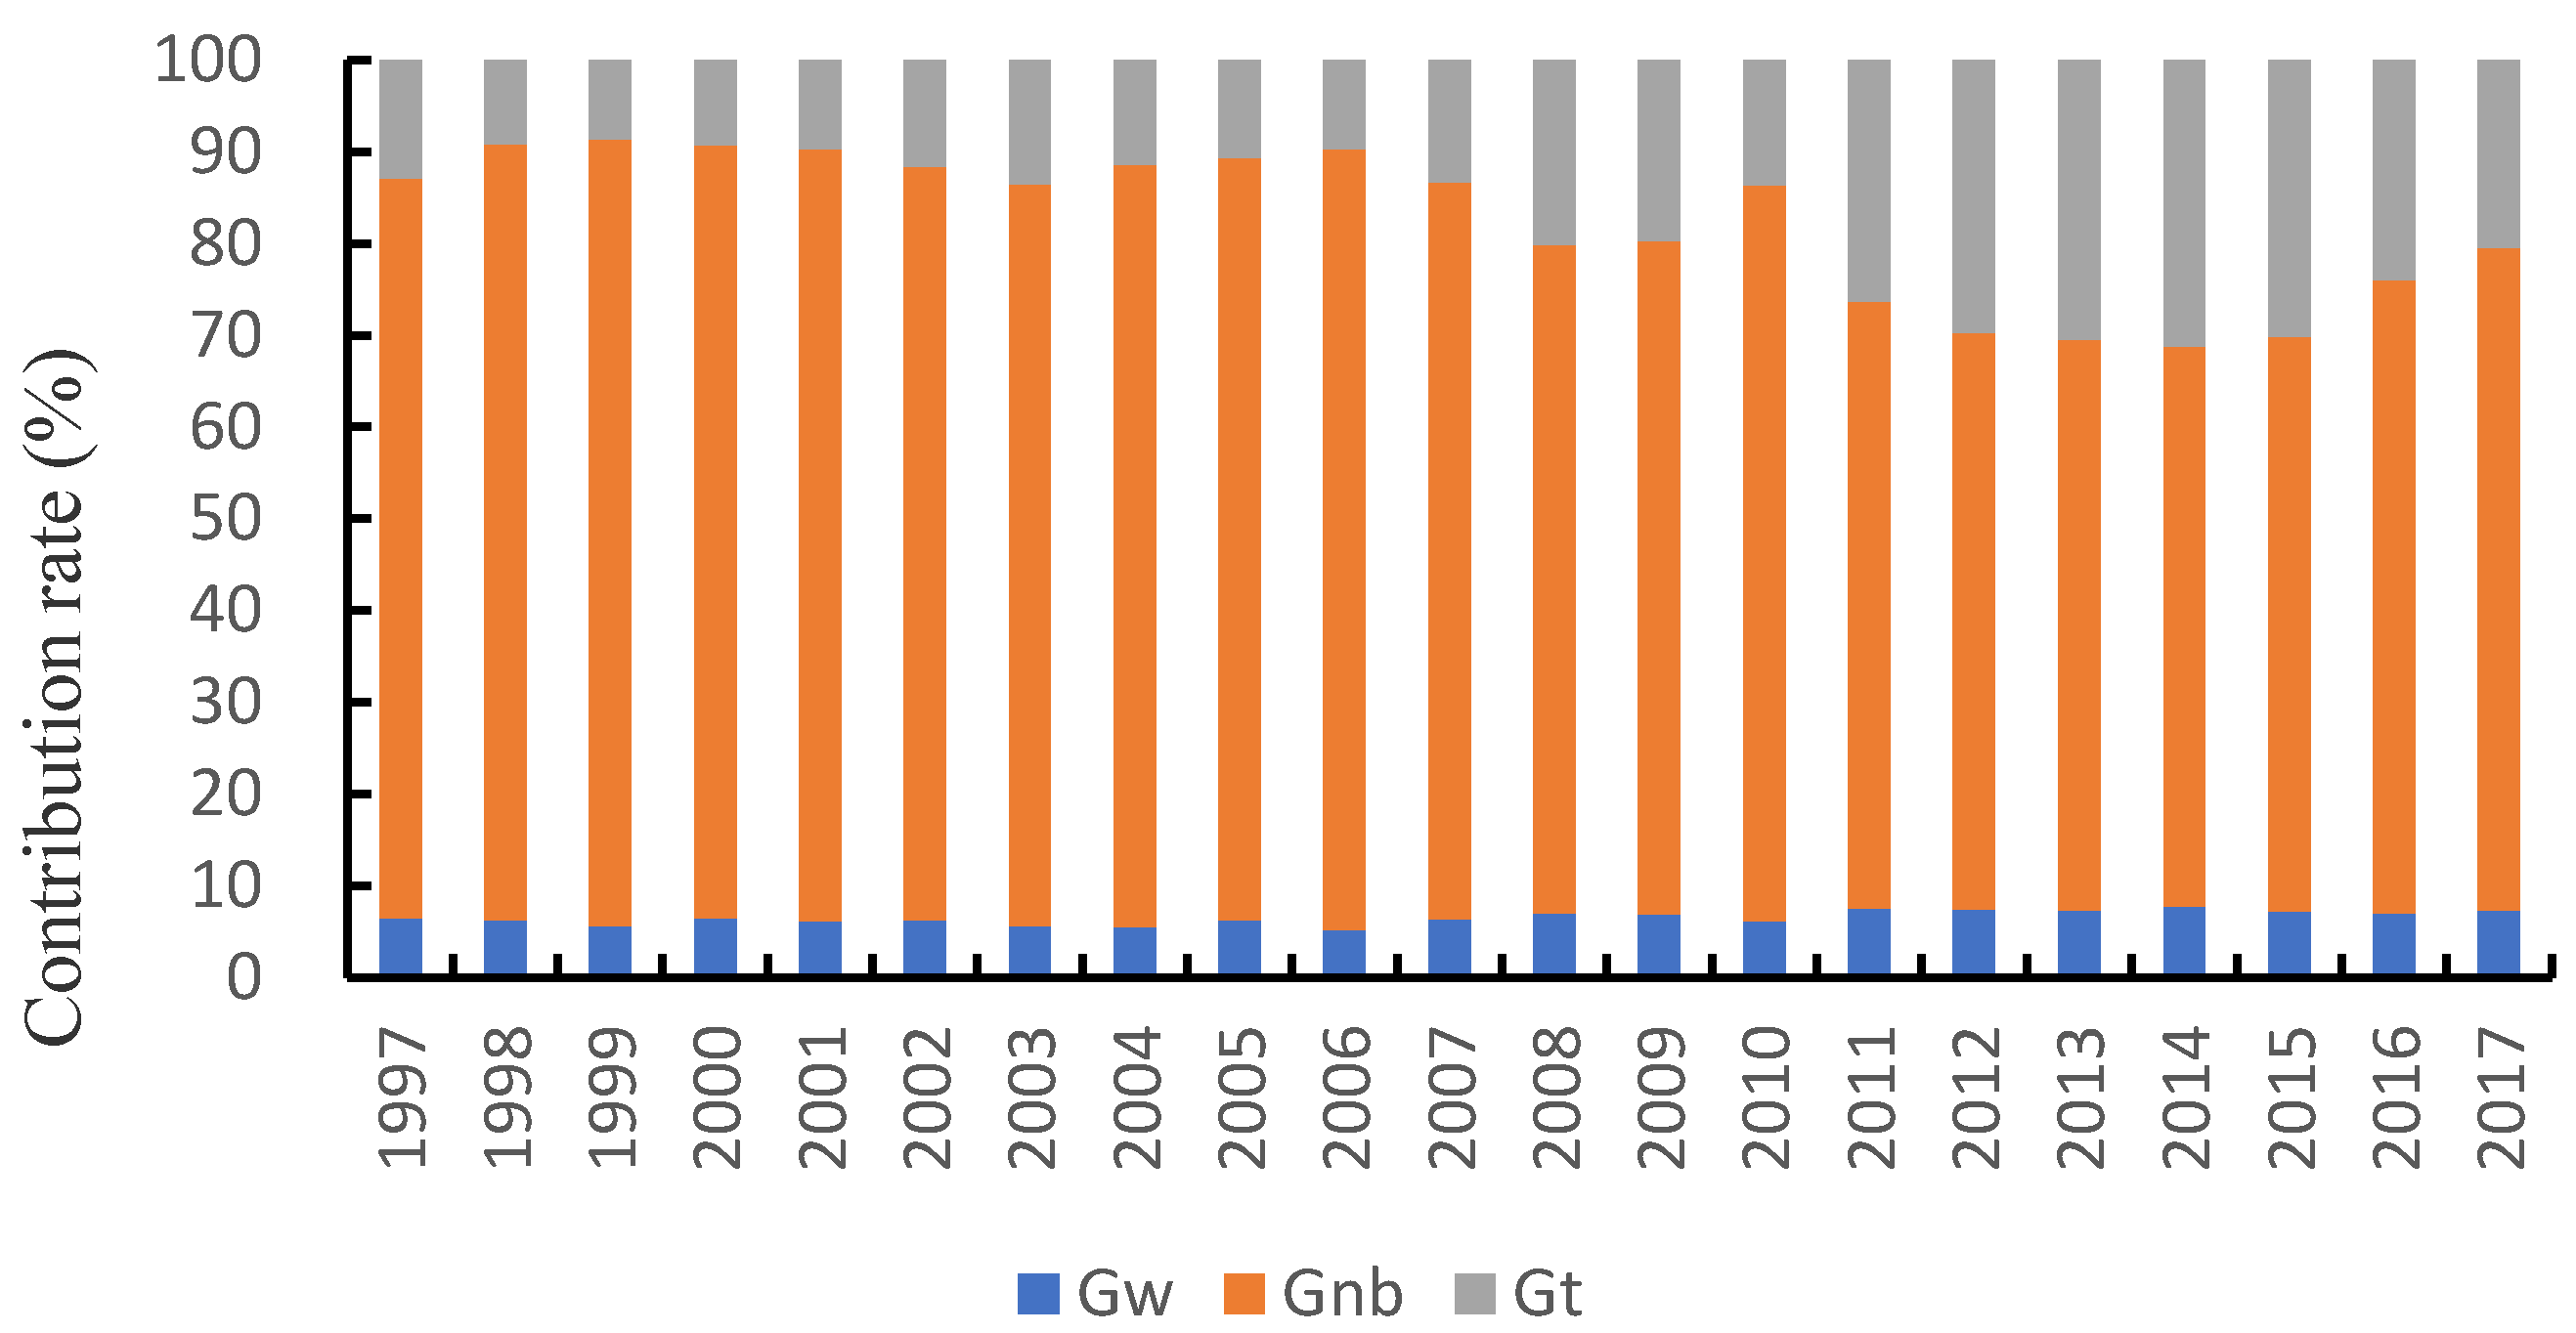
3.2.1. Overall Difference
3.2.2. Intra-Regional Differences
3.2.3. Inter-Regional Differences
3.3. Green Development Performance Convergence Mechanism
3.3.1. σ Convergence
3.3.2. β Convergence
4. Discussions and Conclusions
4.1. Discussions
4.2. Conclusions
Author Contributions
Funding
Institutional Review Board Statement
Informed Consent Statement
Data Availability Statement
Conflicts of Interest
References
- Jin, P.; Peng, C.; Song, M. Macroeconomic uncertainty, high-level innovation, and urban green development performance in China. China Econ. Rev. 2019, 55, 1–18. [Google Scholar] [CrossRef]
- Li, L.; Hu, J. Ecological total-factor energy efficiency of regions in China. Energy Policy 2012, 46, 216–224. [Google Scholar] [CrossRef]
- Wen, H.; Lee, C. Impact of fiscal decentralization on firm environmental performance: Evidence from a county-level fiscal reform in China. Environ. Sci. Pollut. Res. 2020, 27, 36147–36159. [Google Scholar] [CrossRef] [PubMed]
- Iftikhar, Y.; Wang, Z.; Zhang, B.; Wang, B. Energy and CO2 emissions efficiency of major economies: A network DEA approach. Energy Econ. 2018, 147, 197–207. [Google Scholar] [CrossRef]
- Kortelainen, M. Dynamic environmental performance analysis: A Malmquist index approach. Ecol. Econ. 2008, 64, 701–715. [Google Scholar] [CrossRef]
- Jena, P.R. Estimating environmental efficiency and Kuznets curve for India. In Proceedings of the Contributed Paper Prepared for Presentation at the International Association of Agricultural Economists Conference, Beijing, China, 16–22 August 2009. [Google Scholar]
- Su, S.; Zhang, F. Modeling the role of environmental regulations in regional green economy efficiency of China: Empirical evidence from super efficiency DEA-Tobit model. J. Environ. Manag. 2020, 261, 110227. [Google Scholar]
- Liu, X.; Yang, X.; Guo, R. Regional Differences in Fossil Energy-Related Carbon Emissions in China’s Eight Economic Regions: Based on the Theil Index and PLS-VIP Method. Sustainability 2020, 12, 2576. [Google Scholar] [CrossRef]
- Lu, C.; Venevsky, S.; Shi, X.; Wang, L.; Wright, J.S.; Wu, C. Econometrics of the environmental Kuznets curve: Testing advancement to carbon intensity-oriented sustainability for eight economic zones in China. J. Clean. Prod. 2020, 283, 124561. [Google Scholar] [CrossRef]
- Chen, Y.; Yang, Z.; Shu, F.; Hu, Z.; Meyer, M.; Bhattacharya, S. A patent based evaluation of technological innovation capability in eight economic regions in PR China. World Patent Inf. 2009, 31, 104–110. [Google Scholar] [CrossRef]
- Xie, X.; Cai, W.; Jiang, Y.; Zeng, W. Carbon footprints and embodied carbon flows analysis for China’s eight regions: A new perspective for mitigation solutions. Sustainability 2015, 7, 10098–10114. [Google Scholar] [CrossRef]
- Qing, Y.; Wan, X.; Ma, H. Assessing Green Development Efficiency of Municipalities and Provinces in China Integrating Models of Super-Efficiency DEA and Malmquist Index. Sustainability 2015, 7, 4492–4510. [Google Scholar]
- An, Q.; Wu, Q.; Li, J.; Xiong, B.; Chen, X. Environmental efficiency evaluation for Xiangjiang River basin cities based on an improved SBM model and Global Malmquist index. Energy Econ. 2019, 81, 95–103. [Google Scholar] [CrossRef]
- Wang, Z.; Wang, X.; Liang, L. Green economic efficiency in the Yangtze River Delta: Spatiotemporal evolution and influencing factors. Ecosyst. Health Sustain. 2019, 5, 20–35. [Google Scholar] [CrossRef]
- Zhao, P.; Zeng, L.; Lu, H.; Zhou, Y.; Hu, H.Y.; Wei, X.Y. Green economic efficiency and its influencing factors in China from 2008 to 2017: Based on the super-SBM model with undesirable outputs and spatial Dubin model. Sci. Total Environ. 2020, 741, 140026. [Google Scholar] [CrossRef] [PubMed]
- Cui, Y.; Liu, W.; Khan, S.U.; Yu, C.; Jun, Z.; Yue, D.; Zhao, M. Regional differential decomposition and convergence of rural green development efficiency: Evidence from China. Environ. Sci. Pollut. Res. 2020, 27, 22364–22379. [Google Scholar]
- Xu, S.; Li, Y.; Tao, Y.; Wang, Y.; Li, Y. Regional Differences in the Spatial Characteristics and Dynamic Convergence of Environmental Efficiency in China. Sustainability 2020, 12, 7423. [Google Scholar] [CrossRef]
- Wang, D.; Wan, K.; Yang, J. Ecological efficiency of coal cities in China: Evaluation and influence factors. Nat. Hazards 2019, 95, 363–379. [Google Scholar] [CrossRef]
- Li, H.; Fang, K.; Yang, W.; Wang, D.; Hong, X. Regional environmental efficiency evaluation in China: Analysis based on the Super-SBM model with undesirable outputs. Math. Comput. Model. 2013, 58, 1018–1031. [Google Scholar] [CrossRef]
- Wu, D.; Wang, Y.; Qian, W. Efficiency evaluation and dynamic evolution of China’s regional green economy: A method based on the Super-PEBM model and DEA window analysis. J. Clean. Prod. 2020, 264, 121630. [Google Scholar] [CrossRef]
- Peng, Y.; Chen, Z.; Lee, J. Dynamic Convergence of Green Total Factor Productivity in Chinese Cities. Sustainability 2020, 12, 4883. [Google Scholar] [CrossRef]
- Charnes, A.; Cooper, W.; Rhodes, E. Measuring the efficiency of decision-making units. Eur. J. Oper. Res. 1978, 2, 429–444. [Google Scholar] [CrossRef]
- Tone, K. A slacks-based measure of efficiency in data envelopment analysis. Eur. J. Oper. Res. 2001, 130, 498–509. [Google Scholar] [CrossRef]
- Tone, K. A slacks-based measure of super-efficiency in data envelopment analysis. Eur. J. Oper. Res. 2002, 143, 32–41. [Google Scholar] [CrossRef]
- Loikkanen, H.A.; Susiluoto, I. An Evaluation of Economic Efficiency of Finnish Regions by DEA and Tobit Models; 42st Congress of the European Regional Science Association: Dortmund, Germany, 2002. [Google Scholar]
- Fare, R. Measuring Farrell efficiency for a firm with intermediate inputs. Acad. Econ. Pap. 1991, 19, 329–340. [Google Scholar]
- Fare, R.; Grosskopf, S. Productivity and intermediate products: A frontier approach. Comput. Econ. 1996, 50, 65–70. [Google Scholar] [CrossRef]
- Zhu, B.; Zhang, M.; Zhou, Y.; Wang, P.; Sheng, J.; He, K.; Wei, Y.M.; Xie, R. Exploring the effect of industrial structure adjustment on interprovincial green development efficiency in China: A novel integrated approach. Energy Policy 2019, 134, 110946. [Google Scholar] [CrossRef]
- Tao, X.; Wang, P.; Zhu, B. Provincial green economic efficiency of China: A non-separable input–output SBM approach. Appl. Energy 2016, 171, 58–66. [Google Scholar] [CrossRef]
- Zhou, L.; Zhou, C.; Che, L.; Wang, B. Spatio-temporal evolution and influencing factors of urban green development efficiency in China. J. Geogr. Sci. 2020, 30, 724–742. [Google Scholar] [CrossRef]
- Peng, G.; Zhang, X.; Liu, F.; Ruan, L.; Tian, K. Spatial–temporal evolution and regional difference decomposition of urban environmental governance efficiency in China. Environ. Dev. Sustain. 2020, 1–17. [Google Scholar] [CrossRef]
- Dagum, C. A new approach to the decomposition of the Gini income inequality ratio. Empir. Econ. 1997, 22, 515–531. [Google Scholar] [CrossRef]
- Xiong, H.; Lan, L.; Liang, L.; Liu, Y.; Xu, X. Spatio-temporal Differences and Dynamic Evolution of PM2. 5 Pollution in China. Sustainability 2020, 12, 5349. [Google Scholar] [CrossRef]
- Han, H.; Ding, T.; Nie, L.; Hao, Z. Agricultural eco-efficiency loss under technology heterogeneity given regional differences in China. J. Clean. Prod. 2020, 250, 119511. [Google Scholar] [CrossRef]
- Lu, X.; Kuang, B.; Li, J. Regional difference decomposition and policy implications of China’s urban land use efficiency under the environmental restriction. Habitat Int. 2018, 77, 32–39. [Google Scholar] [CrossRef]
- Shen, C.; Feng, R.; Yu, B.; Liao, Z. Industrial CO2 Emissions Efficiency and its Determinants in China: Analyzing Differences across Regions and Industry Sectors. Pol. J. Environ. Stud. 2018, 27, 1239–1253. [Google Scholar] [CrossRef]
- National Bureau of Statistics of China (NBSC). Chinese Statistics Yearbook; NBSC: Beijing, China, 1998–2018. (In Chinese)
- National Bureau of Statistics of China (NBSC). Chinese Energy Statistics Yearbook; NBSC: Beijing, China, 1998–2018. (In Chinese)
- National Bureau of Statistics of China (NBSC). China Environment Statistics Yearbook; NBSC: Beijing, China, 1998–2018. (In Chinese)
- Rezitis, A. Agricultural productivity and convergence: Europe and the United States. Appl. Econ. 2010, 42, 1029–1044. [Google Scholar] [CrossRef]
- Lu, X.; Xu, C. The difference and convergence of total factor productivity of inter-provincial water resources in China based on three-stage DEA-Malmquist index model. Sustain. Comput. Inform. Syst. 2019, 22, 75–83. [Google Scholar] [CrossRef]
- Sobhan, R. The Problem of regional imbalance in the economic development of Pakistan. Asian Surv. 1962, 2, 31–37. [Google Scholar] [CrossRef]
- Toprak, M.; Bayraktar, Y.; Özyılmaz, A. Analysis of the Impact of Public Investments on Regional Imbalance at the Regional Level in Turkey; International Congress on Politic, Economic and Social Studies (ICPESS): Istanbul, Turkey, 2017. [Google Scholar]
- Doloreux, D.; Parto, S. Regional innovation systems: Current discourse and unresolved issues. Technol. Soc. 2005, 27, 133–153. [Google Scholar] [CrossRef]
- Doloreux, D. What we should know about regional systems of innovation. Technol. Soc. 2002, 24, 243–263. [Google Scholar] [CrossRef]
- Isaksen, A.; Trippl, M. Exogenously led and policy-supported new path development in peripheral regions: Analytical and synthetic routes. Econ. Geogr. 2017, 93, 436–457. [Google Scholar] [CrossRef]
- Maillat, D.; Kebir, L. Conditions-cadres et compétitivité des régions: Une relecture. Can. J. Reg. Sci. 2001, 24, 41–56. [Google Scholar]
- Rockström, J.; Steffen, W.; Noone, K.; Persson, Å.; Chapin, F.S.; Lambin, E.F.; Lenton, T.M.; Scheffer, M.; Folke, C.; Schellnhuber, H.J.; et al. A safe operating space for humanity. Nature 2009, 461, 472–475. [Google Scholar] [CrossRef] [PubMed]
- Davies, A.; Mullin, S. Greening the economy: Interrogating sustainability innovations beyond the mainstream. J. Econ. Geogr. 2011, 11, 793–816. [Google Scholar] [CrossRef]
- Mol, A. Ecological modernization and the global economy. Glob. Environ. Politics 2002, 2, 92–115. [Google Scholar] [CrossRef]

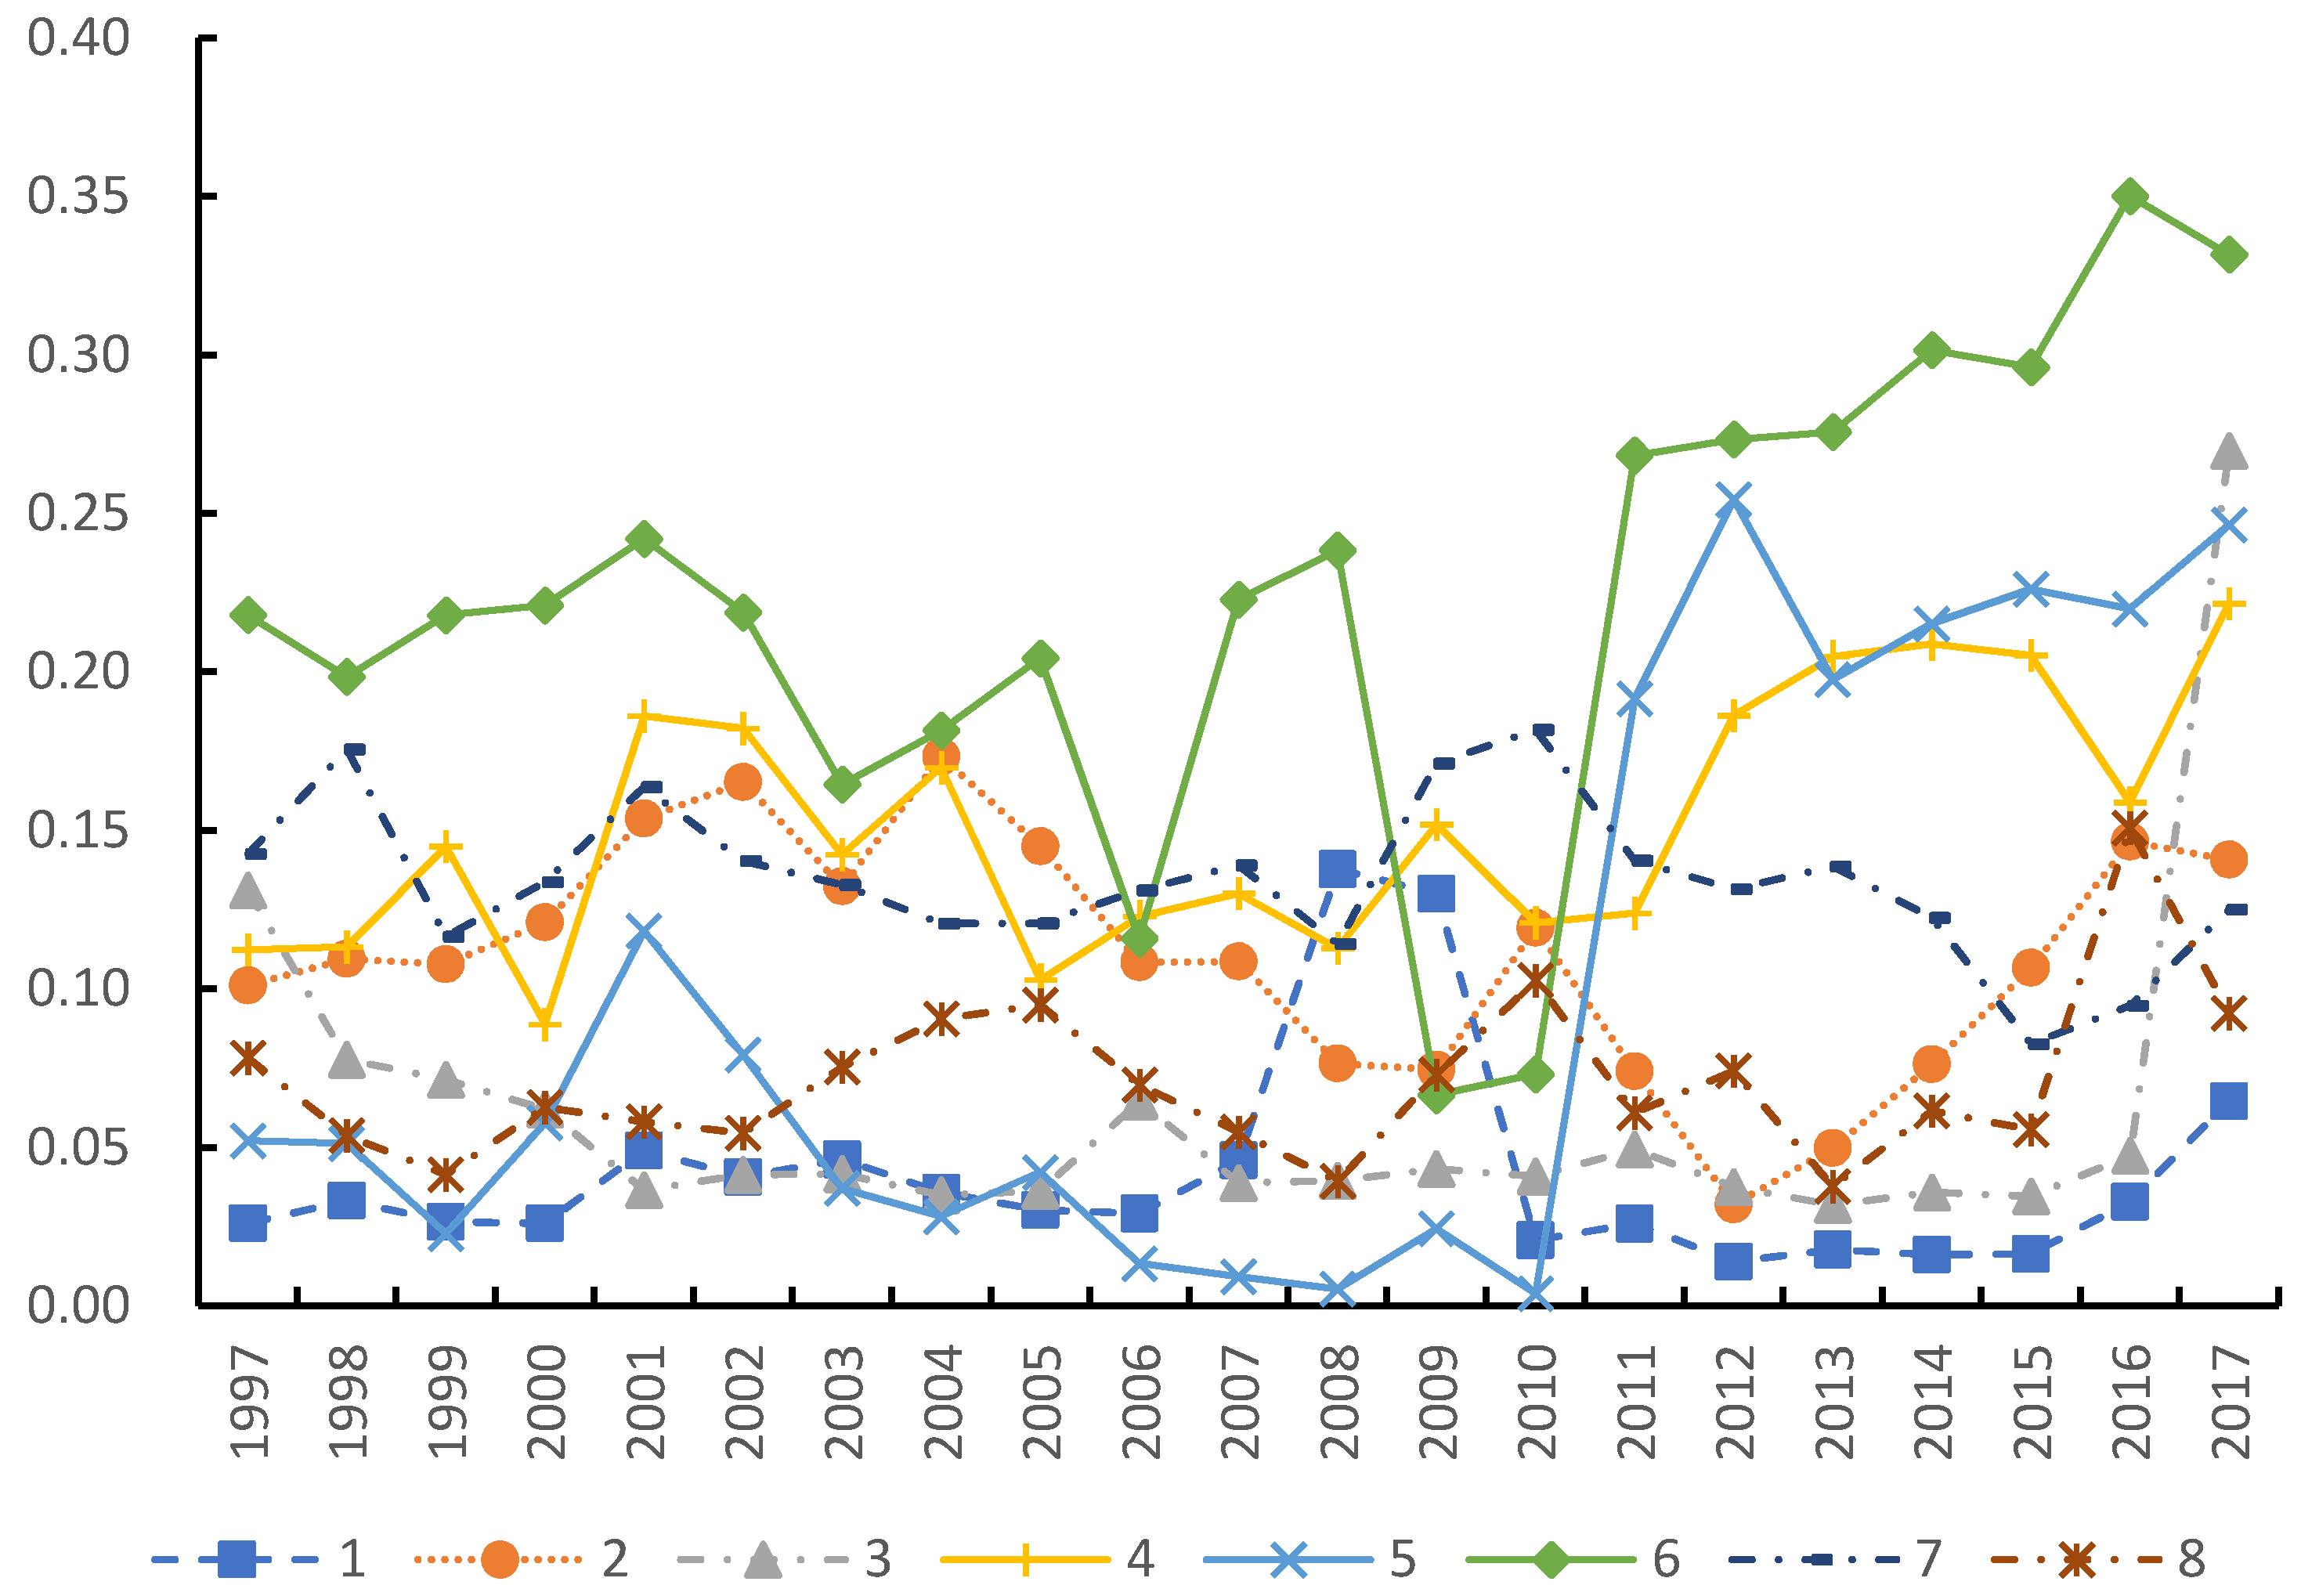
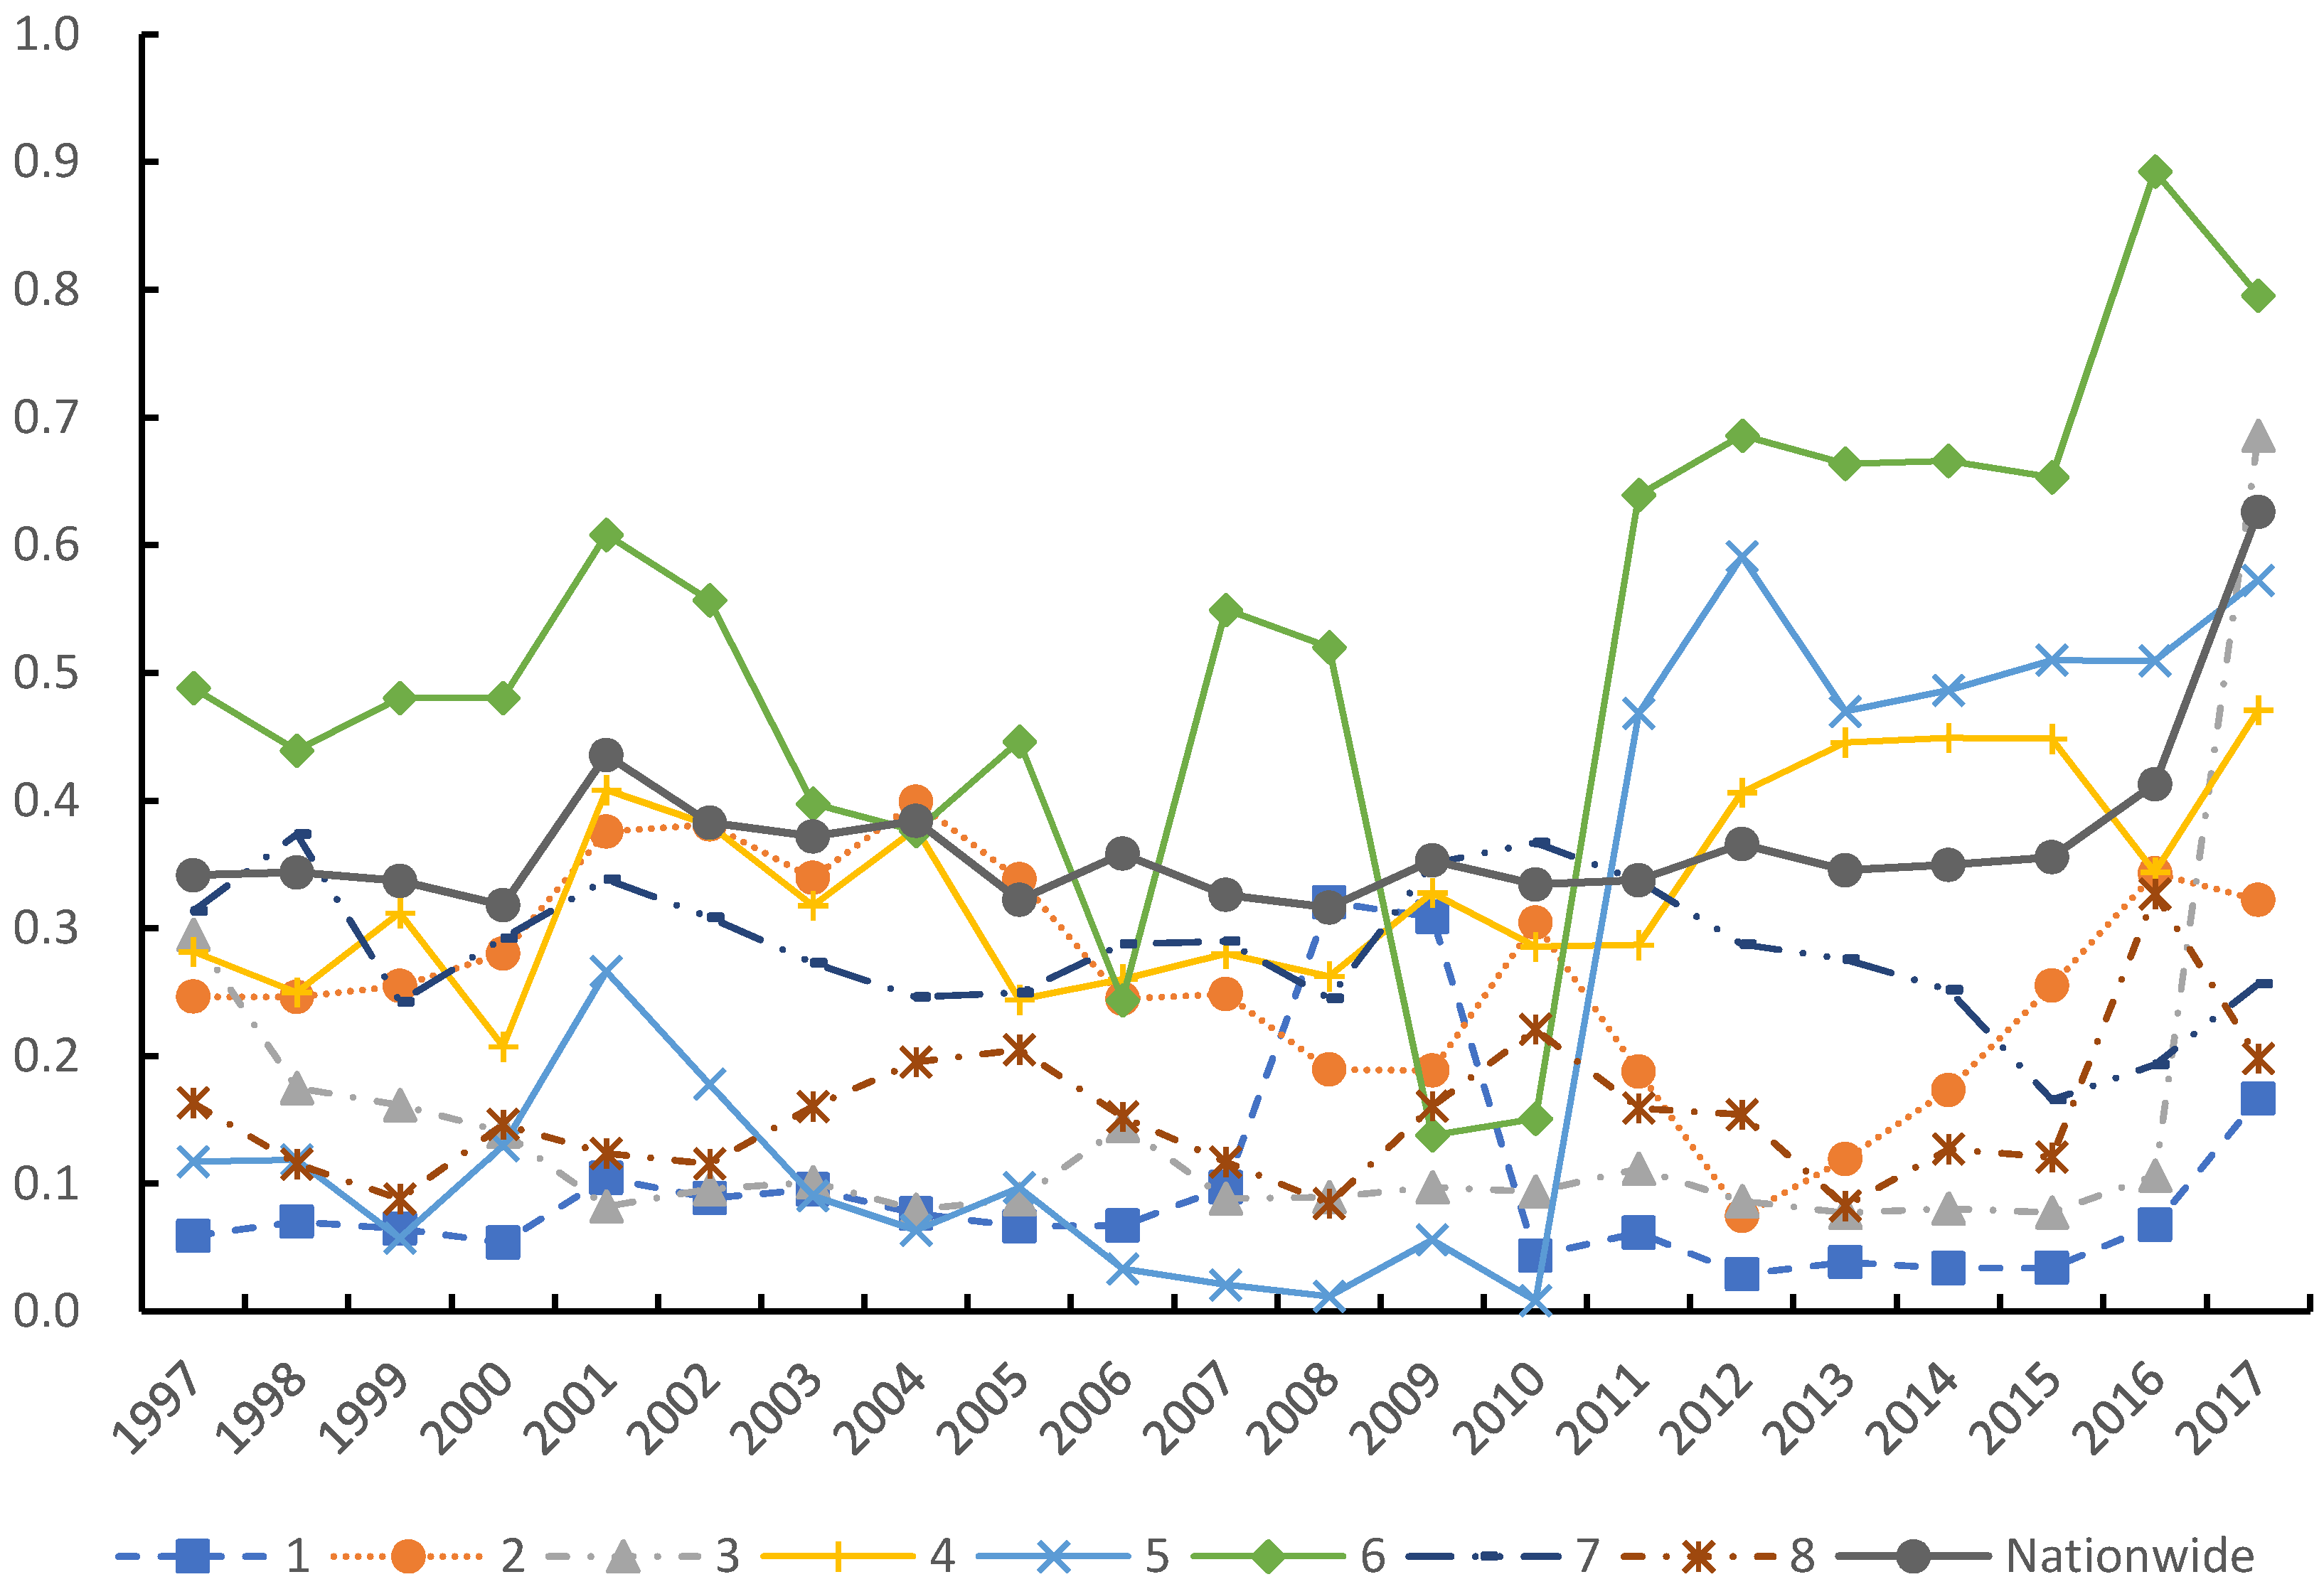
| Regions | Constitutions |
|---|---|
| Northern coast | Beijing, Tianjin, Hebei, Shandong |
| Eastern coast | Shanghai, Jiangsu, Zhejiang |
| Southern coast | Fujian, Guangdong, Hainan |
| Northeast | Liaoning, Jilin, Heilongjiang |
| Middle Yellow River | Shanxi, Inner Mongolia, Henan, Shaanxi |
| Middle Yangtze River | Anhui, Jiangxi, Hubei, Hunan |
| Southwest | Guangxi, Chongqing, Sichuan, Guizhou, Yunnan |
| Northwest | Ningxia, Gansu, Qinghai, Xinjiang |
| Stage | Type | First Level Indicators | Second Level Indicators | Third Level Indicators |
|---|---|---|---|---|
| Economic production stage | Input | Resource input | Labor | Employed persons |
| Capital | Total investment in fixed assets | |||
| Energy | Energy consumption | |||
| Water | Per capita water consumption | |||
| Land | Area of built districts | |||
| Output | Economic output | GDP | Area GDP | |
| Intermediate variable | Pollution emissions | Wastewater | Total wastewater discharged | |
| Waste gas | SO2 emission | |||
| Solid waste | Industrial solid waste discharge | |||
| Environmental governance stage | Input | Environmental governance | Environmental input | Investment in the treatment of environmental pollution |
| Output | Waste utilization | Wastes utilization | Facilities for treatment of waste water and waste gas | |
| Waste water utilization | Treat of industrial wastewater | |||
| Solid waste utilization | Utilization of solid waste |
| GDPI | GPE | GEE | |
|---|---|---|---|
| GDPI | 1 | 0.941 *** | 0.798 *** |
| GPE | 0.941 *** | 1 | 0.777 *** |
| GEE | 0.798 *** | 0.777 *** | 1 |
| Region | Region | Region | Region | ||||
|---|---|---|---|---|---|---|---|
| 8-7 | 0.148 | 7-6 | 0.327 | 6-4 | 0.351 | 5-1 | 0.112 |
| 8-6 | 0.346 | 7-5 | 0.246 | 6-3 | 0.408 | 4-3 | 0.156 |
| 8-5 | 0.190 | 7-4 | 0.171 | 6-2 | 0.299 | 4-2 | 0.179 |
| 8-4 | 0.144 | 7-3 | 0.193 | 6-1 | 0.429 | 4-1 | 0.168 |
| 8-3 | 0.133 | 7-2 | 0.172 | 5-4 | 0.206 | 3-2 | 0.205 |
| 8-2 | 0.135 | 7-1 | 0.218 | 5-3 | 0.136 | 3-1 | 0.076 |
| 8-1 | 0.155 | 6-5 | 0.453 | 5-2 | 0.264 | 2-1 | 0.228 |
| Region | β | t | Constant | t | R2 |
|---|---|---|---|---|---|
| Nationwide | 0.285 *** | 5.18 | 0.0382 | 1.31 | 0.0778 |
| Northern Coast | 0.619 *** | 48.18 | −0.0832 | −2.27 | 0.4433 |
| Northeast | 0.265 ** | 5.78 | 0.0373 | −0.43 | 0.3927 |
| Eastern coast | 0.780 * | 4.16 | 0.0748 | 0.40 | 0.2223 |
| The Middle Yellow River | 0.395 * | 3.05 | 0.0429 | 0.64 | 0.2589 |
| Southern coast | 0.183 ** | 5.12 | −0.0139 | −0.51 | 0.4581 |
| Northwest | 0.209 * | 2.53 | 0.183 | 1.41 | 0.4001 |
| Southwest | 0.383 *** | 4.82 | 0.158 | 2.03 | 0.2081 |
| The Yangtze River | 0.647 *** | 10.02 | −0.0960 | −1.19 | 0.3980 |
| Region | β | t | Constant | t | R2 |
|---|---|---|---|---|---|
| Nationwide | 0.289 *** | 5.54 | −0.160 | −0.31 | 0.0714 |
| Northern Coast | 0.670 *** | 13.15 | −0.800 | −1.03 | 0.3586 |
| Northeast | 0.425 * | 2.93 | −2.746 * | −3.29 | 0.1405 |
| Eastern coast | 0.936 ** | 9.56 | 1.218 | 0.75 | 0.1718 |
| The Middle Yellow River | 0.404 | 2.18 | −1.727 | −1.13 | 0.1883 |
| Southern coast | 0.188 | 2.53 | −0.646 | −0.37 | 0.4055 |
| Northwest | 0.305 | 2.03 | −1.046 | −0.33 | 0.2601 |
| Southwest | 0.498 *** | 5.39 | −0.742 | −1.22 | 0.2738 |
| The Yangtze River | 0.721 *** | 9.46 | 2.472 | 0.92 | 0.3791 |
Publisher’s Note: MDPI stays neutral with regard to jurisdictional claims in published maps and institutional affiliations. |
© 2021 by the authors. Licensee MDPI, Basel, Switzerland. This article is an open access article distributed under the terms and conditions of the Creative Commons Attribution (CC BY) license (http://creativecommons.org/licenses/by/4.0/).
Share and Cite
Wang, S.; Zhang, Y.; Wen, H. Comprehensive Measurement and Regional Imbalance of China’s Green Development Performance. Sustainability 2021, 13, 1409. https://doi.org/10.3390/su13031409
Wang S, Zhang Y, Wen H. Comprehensive Measurement and Regional Imbalance of China’s Green Development Performance. Sustainability. 2021; 13(3):1409. https://doi.org/10.3390/su13031409
Chicago/Turabian StyleWang, Shengyun, Yaxin Zhang, and Huwei Wen. 2021. "Comprehensive Measurement and Regional Imbalance of China’s Green Development Performance" Sustainability 13, no. 3: 1409. https://doi.org/10.3390/su13031409
APA StyleWang, S., Zhang, Y., & Wen, H. (2021). Comprehensive Measurement and Regional Imbalance of China’s Green Development Performance. Sustainability, 13(3), 1409. https://doi.org/10.3390/su13031409


