Inflows and Outflows from Material Stocks of Buildings and Networks and their Space-Differentiated Drivers: The Case Study of the Paris Region


Abstract
1. Introduction
1.1. Issues Related to Urbanization and Construction Material Flows
1.2. A Lack of Coordination Between Circular Economy Strategies and Urban Planning
1.3. Research on the Space-Differentiated Drivers of Construction Material Flows and Its Gap
1.4. Objectives and Plan
2. Materials and Methods
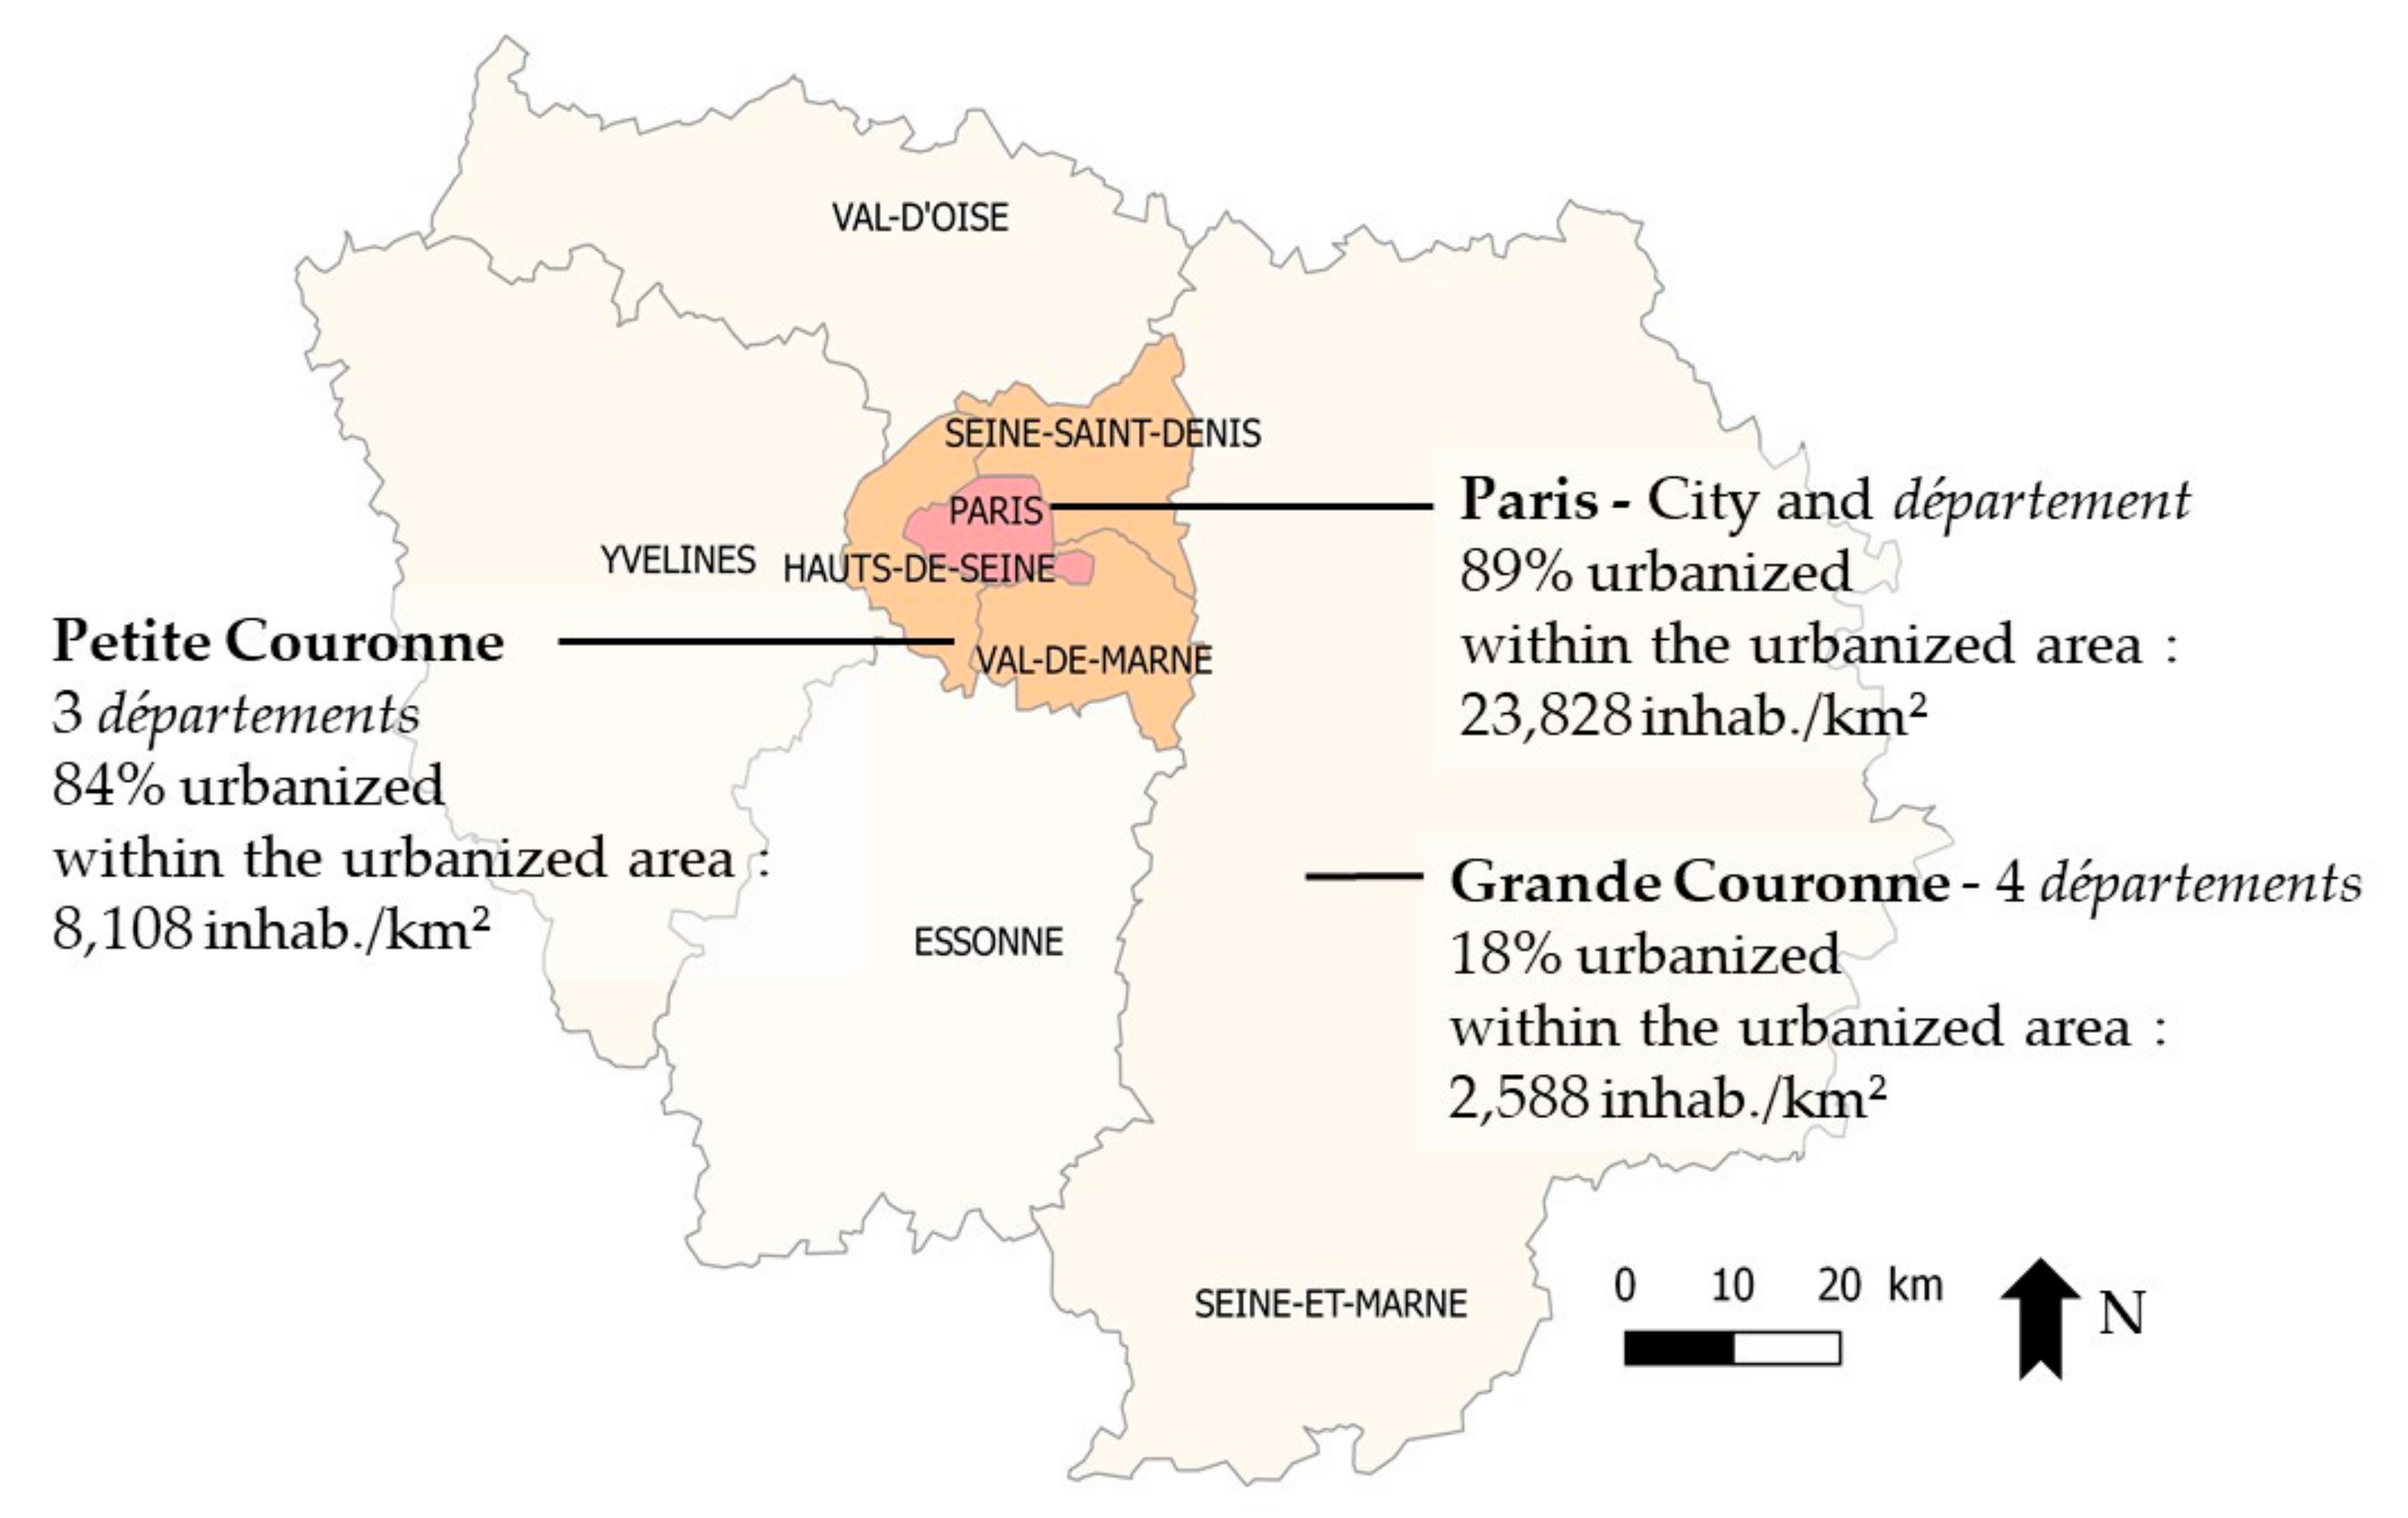
2.1. Study Area
2.2. Scope
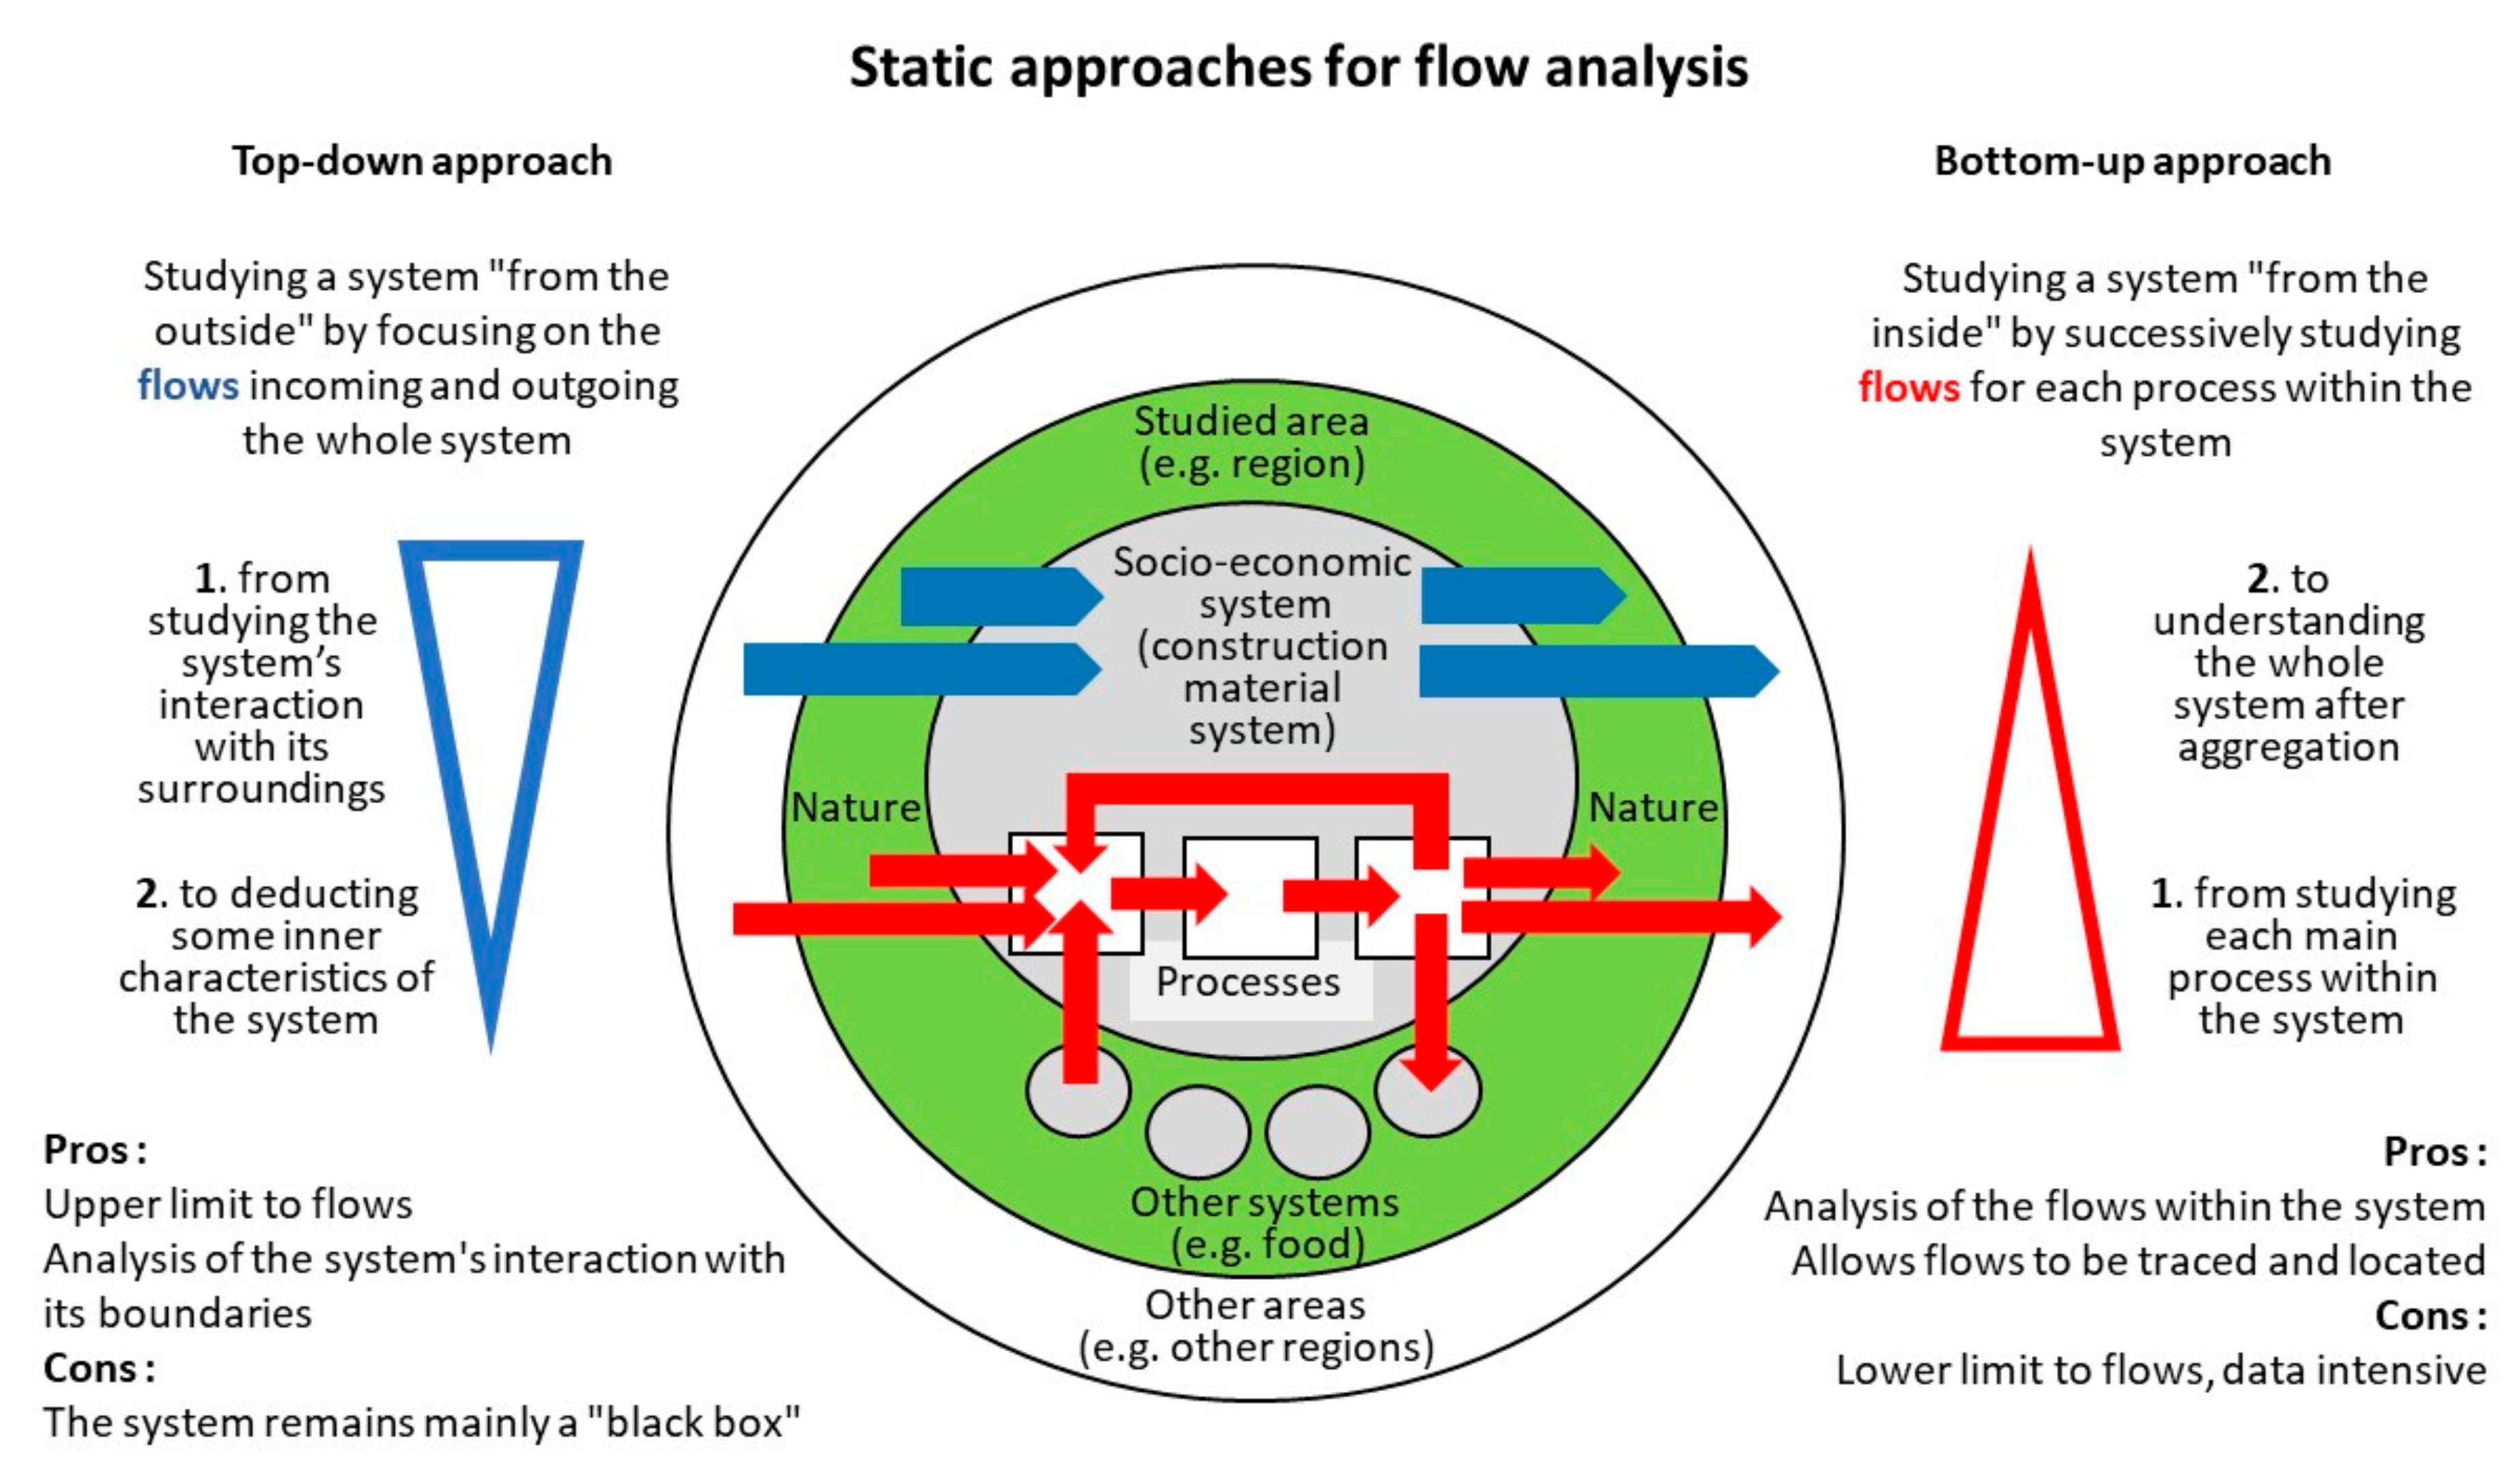
2.3. Overall Method
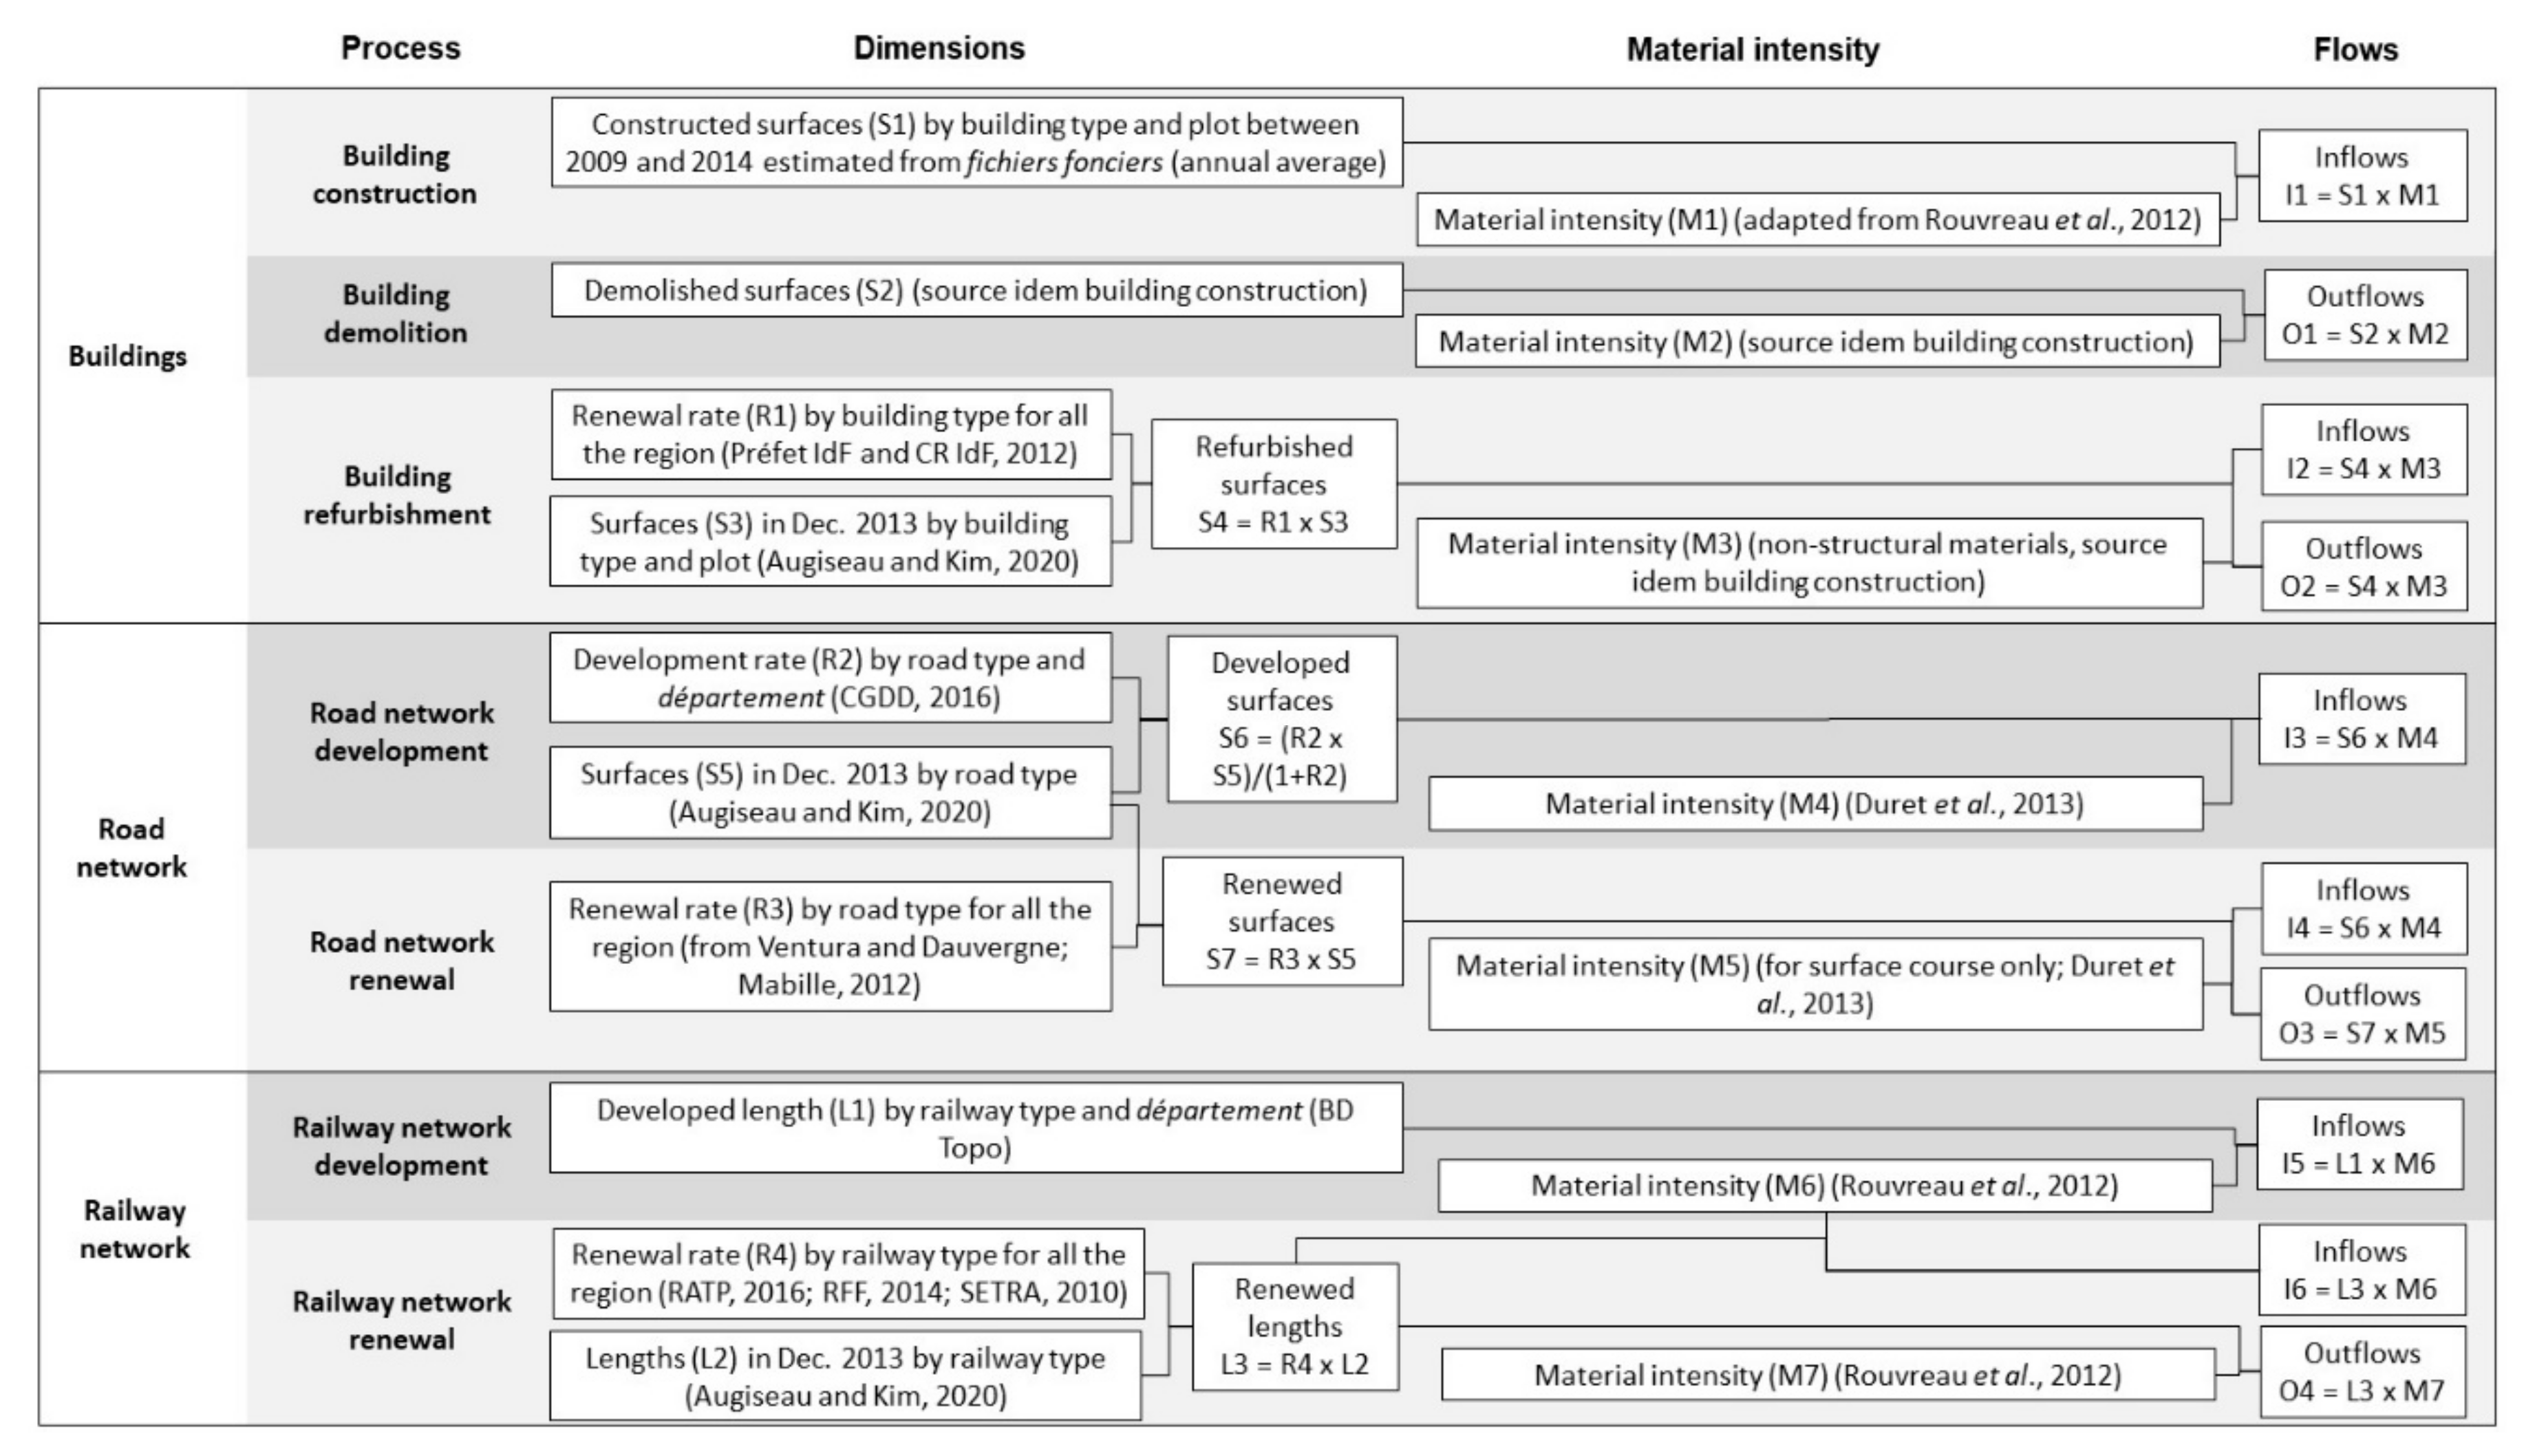
2.4. Method for Estimating Dimensions
2.5. Material Intensities
2.6. Urban Indicators
- Annual average road extension rate, %of total road surfaces observed on 31 December 2013
- Annual average construction rate, % of total building floor areas observed on 31 December 2013
- Annual average renewal rate, % of total building floor areas observed in stocks on 31 December 2013 (intermediate value)
- Annual average demolition rate, % of total building floor areas observed in stocks on 31 December 2013
- Urban density: the number of inhabitants on urbanized area, inhab./km2
- Building floor area to urbanized area ratio: ratio of the total gross building floor areas over urbanized area, ratio
- Share of single-family house, % of total building floor area
3. Results
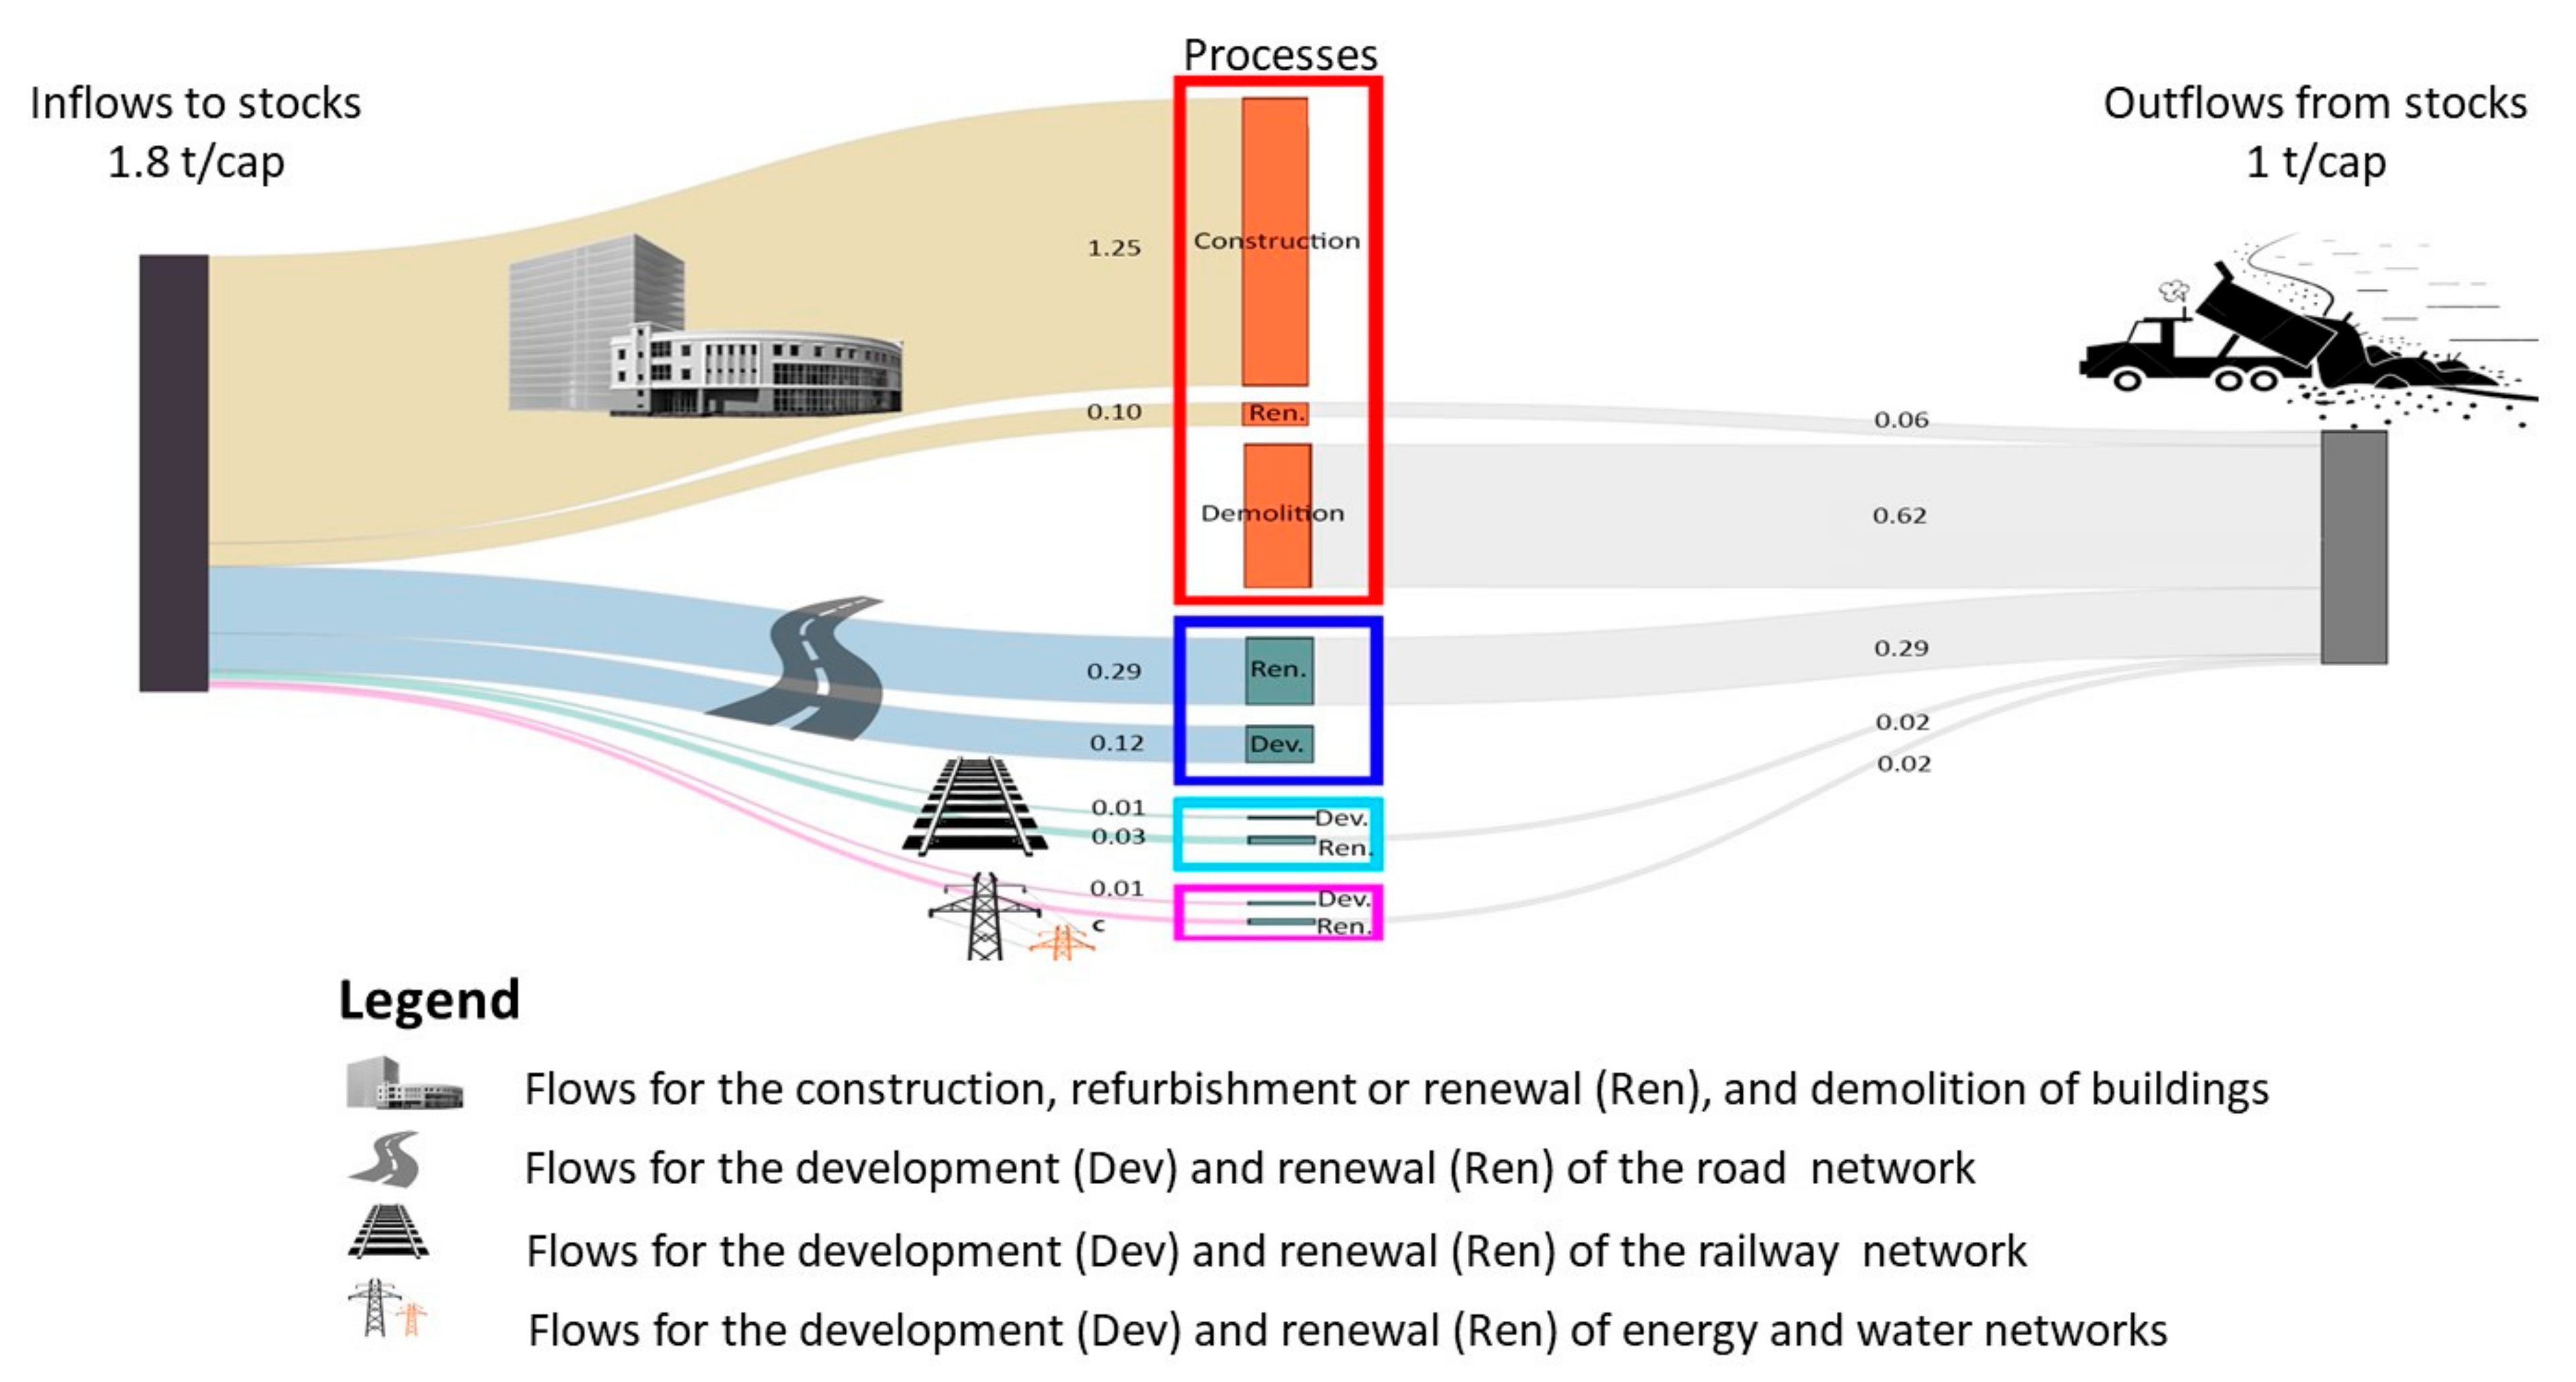
3.1. Flows by Process at the Regional Level
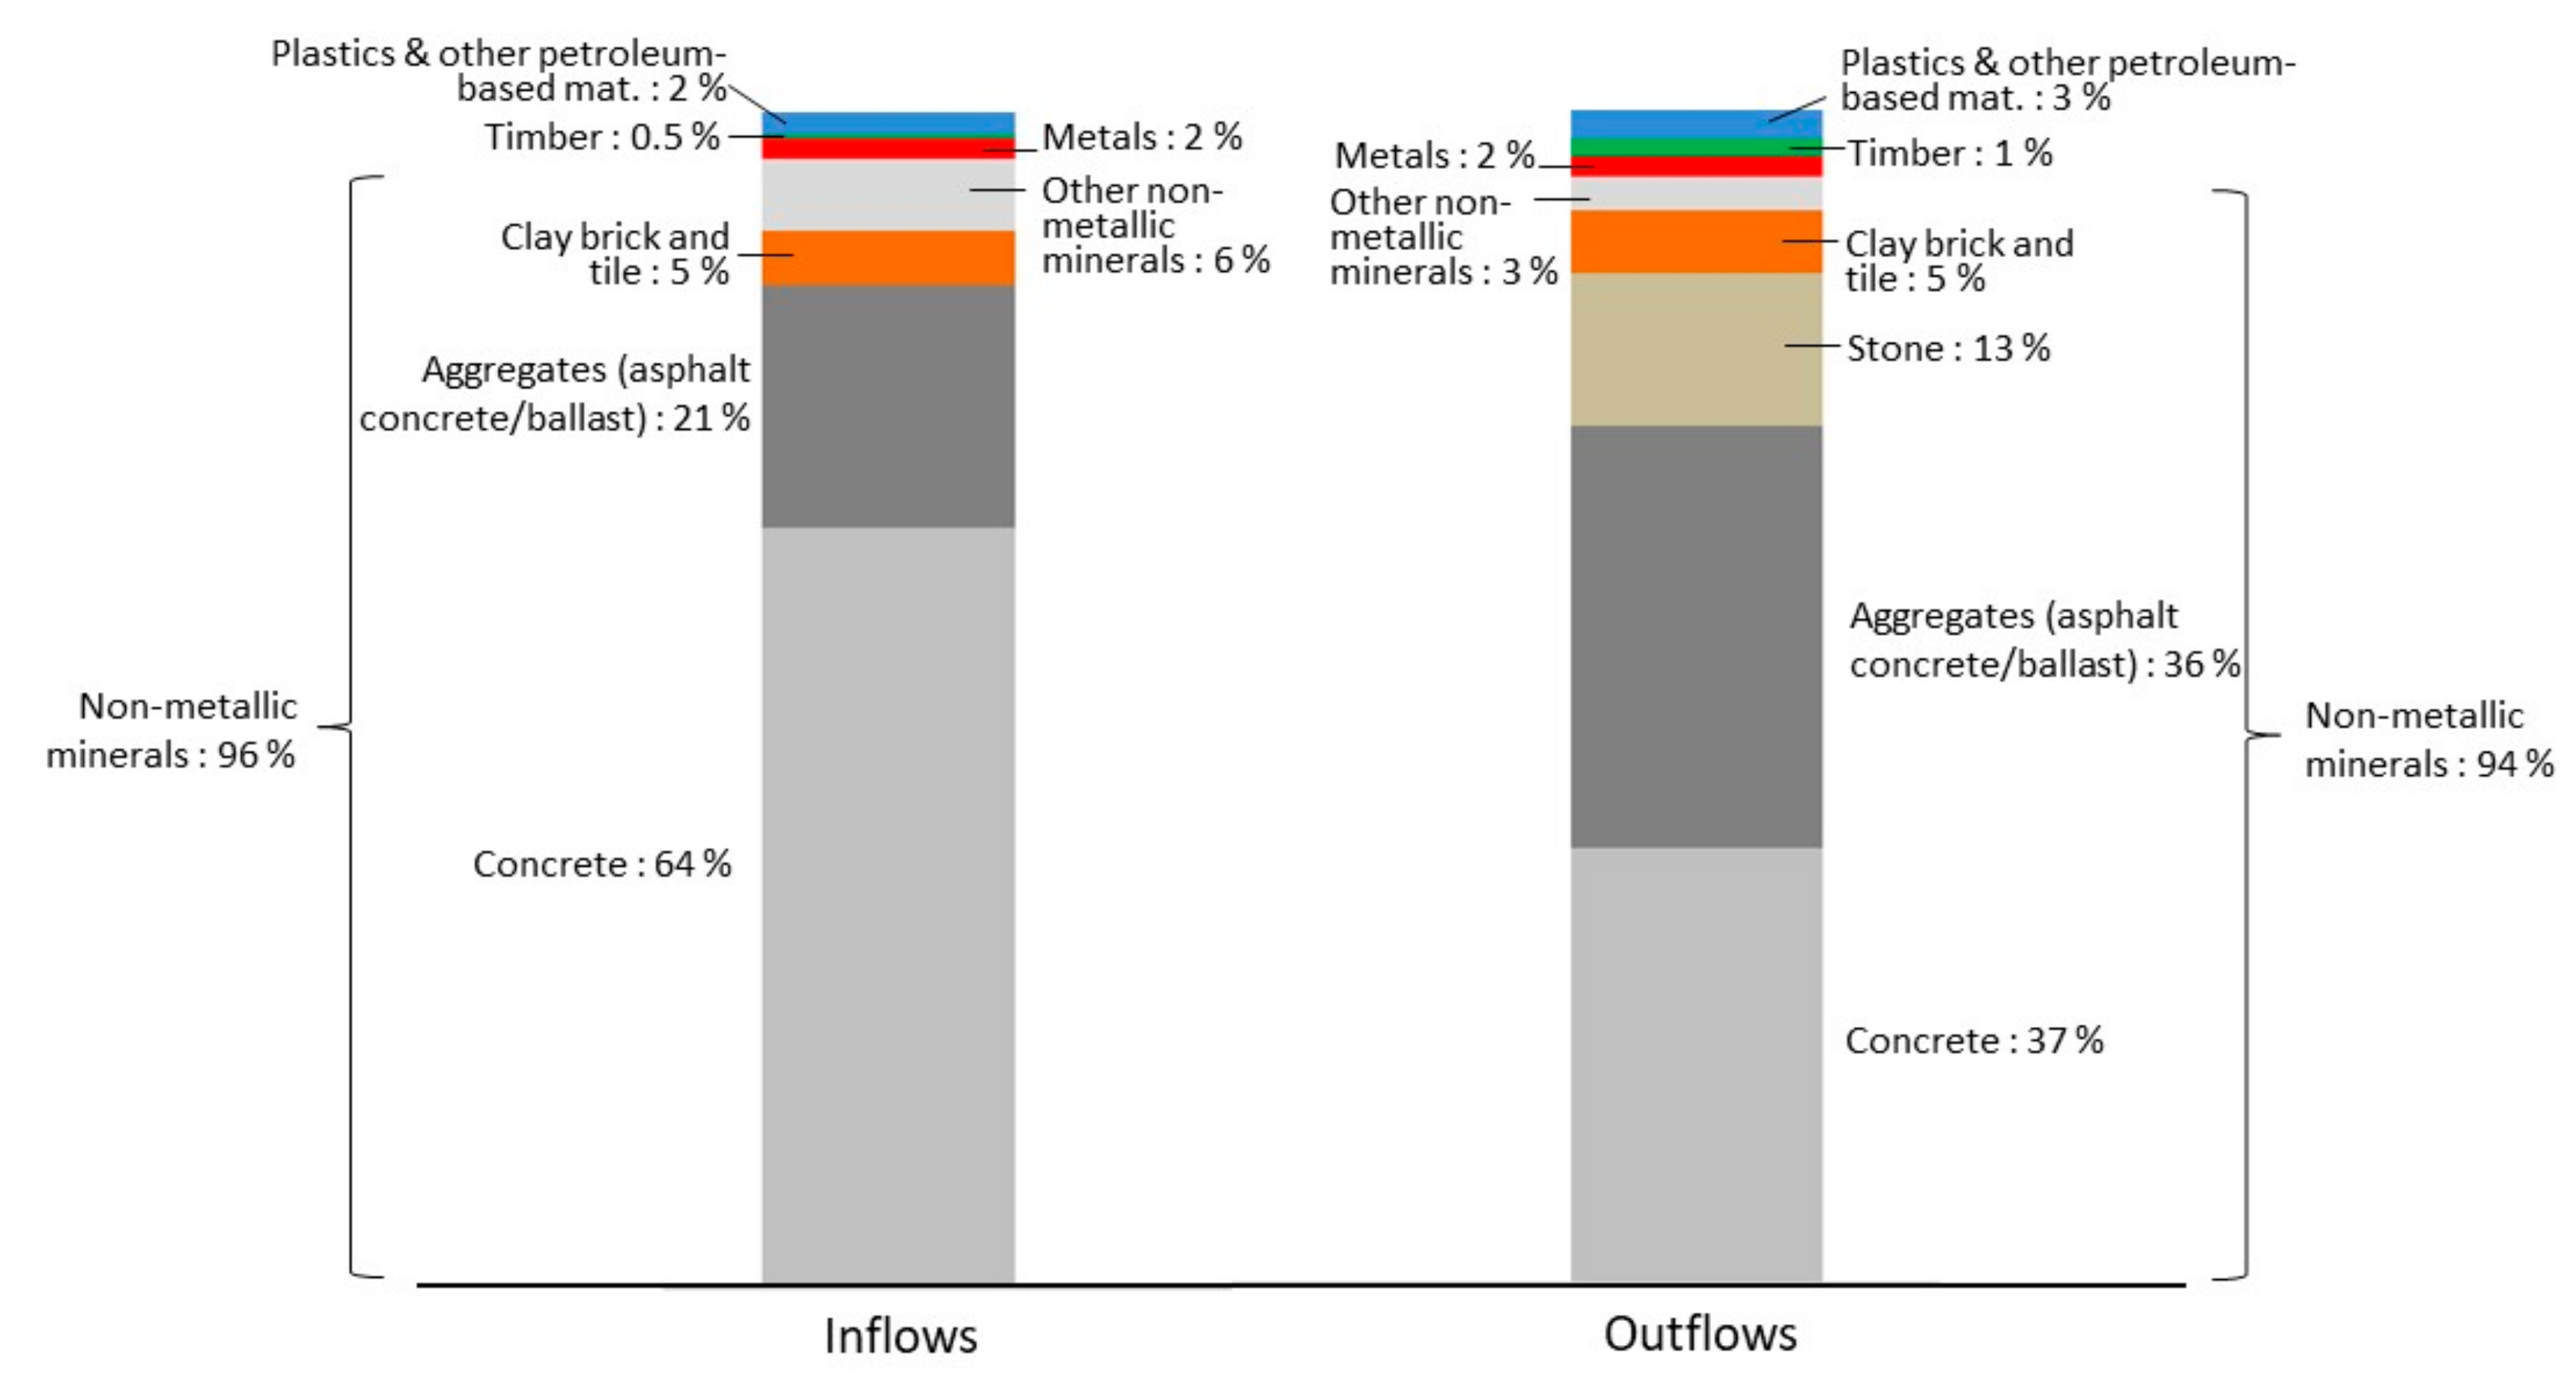
3.2. Flows by Material at the Regional Level
3.3. Characterizing the Three Sub-Urban Areas With Urban Indicators
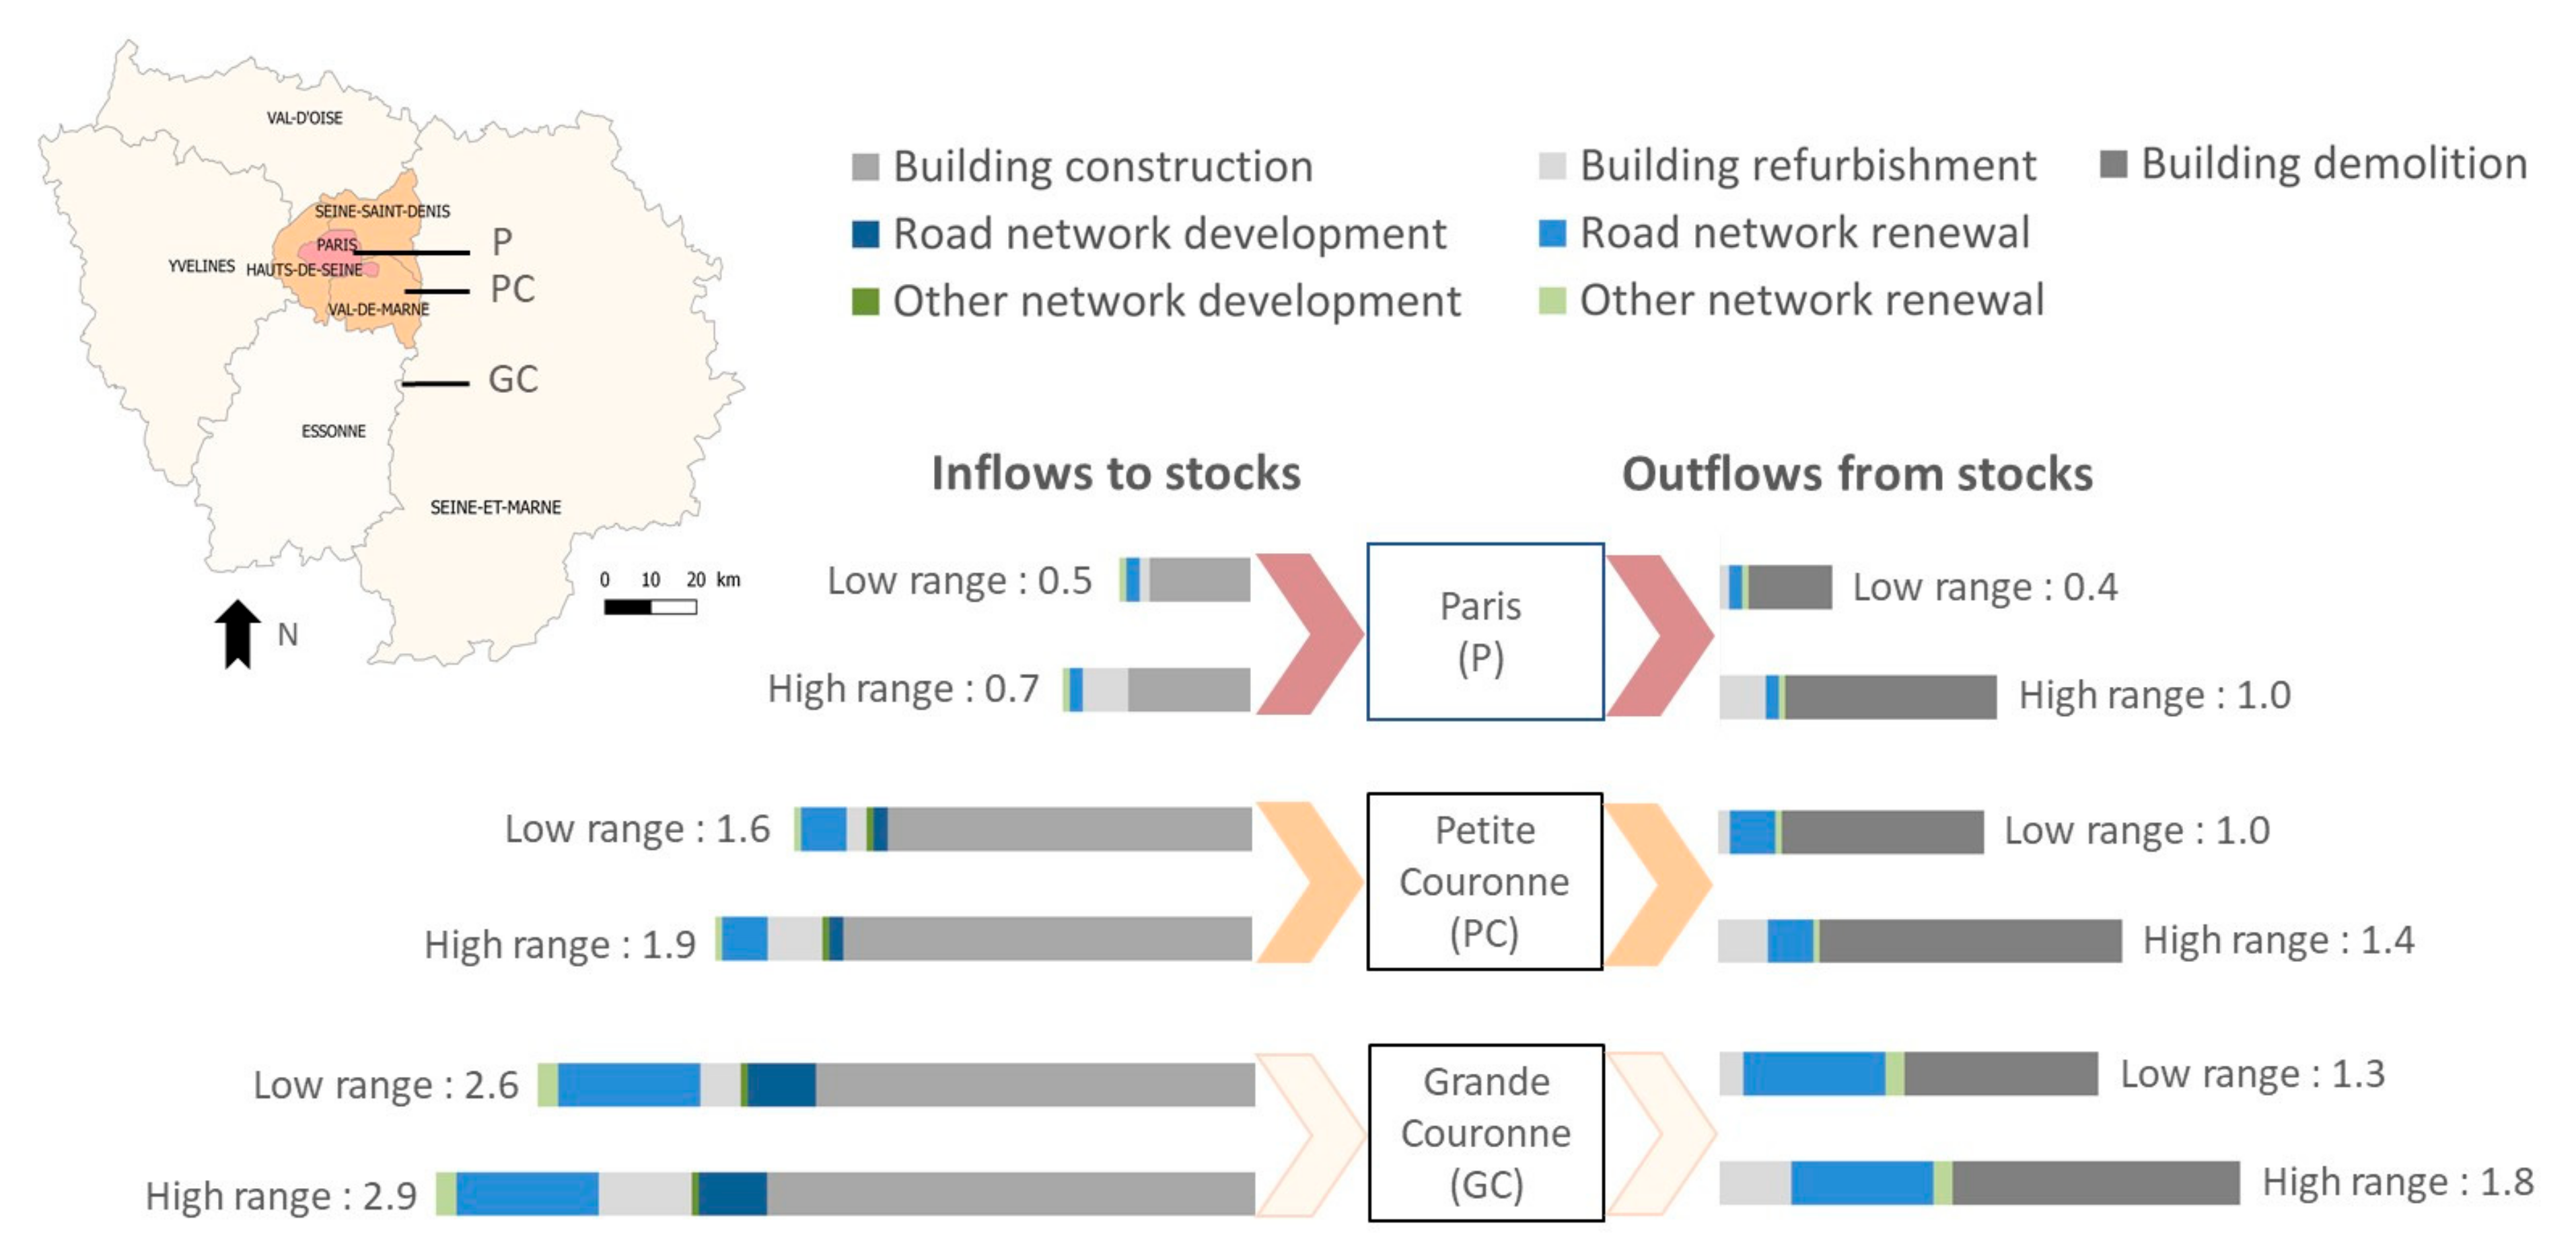
3.4. Construction Material Flows at Sub-Urban Level: Paris, Petite Couronne, and Grande Couronne
4. Technical Validation of the Results
4.1. Data Quality
4.2. Validation of the Results
5. Discussion
5.1. Urban Drivers Shaping Construction Material Flows
5.2. Insights for Defining Circular Economy Strategies in the Paris Region Based on Material Flow Analysis
5.3. Limits of the Study and Perspectives for Future Research
6. Conclusions
Supplementary Materials
Author Contributions
Funding
Acknowledgments
Conflicts of Interest
References
- Hodson, M.; Marvin, S.; Robinson, B.; Swilling, M. Reshaping urban infrastructure: Material flow analysis and transitions analysis in an urban context. J. Ind. Ecol. 2012, 16, 789–800. [Google Scholar] [CrossRef]
- Swilling, M.; Robinson, B.; Marvin, S.; Hodson, M. City-Level Decoupling: Urban resource flows and the governance of infrastructure transitions—A Report of the Working Group on Cities of the International Resource Panel; United Nations Environment Programme: Nairobi, Kenya, 2013; 95p. [Google Scholar]
- Krausmann, F.; Gingrich, S.; Eisenmenger, N.; Erb, K.H.; Haberl, H.; Fischer-Kowalski, M. Growth in global materials use, GDP and population during the 20th century. Ecol. Econ. 2009, 68, 2696–2705. [Google Scholar] [CrossRef]
- OECD. Global Material Resources Outlook to 2060—Economic Drivers and Environmental Consequences-Highlights; OECD Publishing: Paris, France, 2018; 23p. [Google Scholar]
- Krausmann, F.; Wiedenhofer, D.; Lauk, C.; Haas, W.; Tanikawa, H.; Fishman, T.; Haberl, H.; Miatto, A.; Schandl, H. Global socioeconomic material stocks rise 23-fold over the 20th century and require half of annual resource use. Proc. Natl. Acad. Sci. USA 2017, 114, 1880–1885. [Google Scholar] [CrossRef] [PubMed]
- International Resource Panel. The Weight of Cities: Resource Requirements of Future Urbanization. A Report by the International Resource Panel; United Nations Environment Programme: Nairobi, Kenya, 2018; 276p. [Google Scholar]
- European Commission; Communication from the Commission to the European Parliament, the Council and Social Committee and the Committee of the Regions. Closing the Loop—An EU action plan for the Circular Economy; European Commission: Brussels, Belgium, 2015; 21p. [Google Scholar]
- European Commission. Circular Economy Action Plan-The European Green Deal; European Commission: Brussels, Belgium, 2020; 28p. [Google Scholar]
- European Commission. Report from the Commission to the European Parliament, the Council, the European Economic and Social Committee and Committee of the Regions on the implementation of the Circular Economy Action Plan; European Commission: Brussels, Belgium, 2019; 11p. [Google Scholar]
- Reike, D.; Vermeulen, W.J.V.; Witjes, S. The circular economy: New or refurbished as CE 3.0? Exploring controversies in the conceptualization of the circular economy through a focus on history and resource value retention options. Resour. Conserv. Recycl. 2018, 135, 246–264. [Google Scholar] [CrossRef]
- Augiseau, V. Circular economy and construction. In Circular Economy: From Waste Reduction to Value Creation; Delchet-Cochet, K., Ed.; John Wiley & Sons: Hoboken, NJ, USA, 2020; pp. 139–158. [Google Scholar]
- Circle Economy; DGBC; Metabolic; SGS Search; REDEVCO Foundation. A Framework for Circular Buildings: Indicators for Possible Inclusion in BREEAM; Circle Economy: Amsterdam, The Netherlands, 2018; 26p, Available online: https://www.circle-economy.com/insights/a-framework-for-circular-buildings (accessed on 6 June 2019).
- Augiseau, V. Utiliser les ressources secondaires de matériaux de construction: Contraintes et pistes d’action pour des politiques territoriales. Flux 2019, 2, 26–41. [Google Scholar] [CrossRef]
- Oyedele, L.; Ajayi, S.O.; Kadiri, K.O. Use of recycled products in UK construction industry: An empirical investigation into critical impediments and strategies for improvement. Resour. Conserv. Recycl. 2014, 93, 23–31. [Google Scholar] [CrossRef]
- Petit-Boix, A.; Leipold, S. Circular economy in cities: Reviewing how environmental research aligns with local practices. J. Clean. Prod. 2018, 195, 1270–1281. [Google Scholar] [CrossRef]
- Obersteg, A.; Arlati, A.; Acke, A.; Berruti, G.; Czapiewski, K.; Dabrowski, M.; Heurkens, E.; Mezei, C.; Palestino, M.F.; Varjú, V. Urban regions shifting to circular economy: Understanding challenges for new ways of governance. Urban Plan. 2019, 4, 1–13. [Google Scholar] [CrossRef]
- Erkman, S. Vers Une Ecologie Industrielle: Comment Mettre en Pratique le Développement Durable dans une Société Hyper-Industrielle; Edition Charles Léopold Mayer; La Librairie FPH: Paris, France, 1998; 147p. [Google Scholar]
- Mercader-Moyano, P.; Esquivias, P.M. Decarbonization and Circular Economy in the Sustainable Development and Renovation of Buildings and Neighbourhoods. Sustainability 2020, 12, 7914. [Google Scholar] [CrossRef]
- Pomponi, F.; Moncaster, A. Circular economy for the built environment: A research framework. J. Clean. Prod. 2017, 143, 710–718. [Google Scholar] [CrossRef]
- ARUP. The Circular Economy in the Built Environment; ARUP: London, UK, 2016; 93p. [Google Scholar]
- Schandl, H.; Marcos-Martinez, R.; Baynes, T.; Yu, Z.; Miatto, A.; Tanikawa, H. A spatiotemporal urban metabolism model for the Canberra suburb of Braddon in Australia. J. Clean. Prod. 2020, 265, 121770. [Google Scholar] [CrossRef]
- Stephan, A.; Athanassiadis, A. Towards a more circular construction sector: Estimating and spatialising current and future non-structural material replacement flows to maintain urban building stocks. Resour. Conserv. Recycl. 2018, 129, 248–262. [Google Scholar] [CrossRef]
- Heeren, N.; Hellweg, S. Tracking Construction Material over Space and Time: Prospective and Geo-referenced Modeling of Building Stocks and Construction Material Flows. J. Ind. Ecol. 2018, 23, 253–267. [Google Scholar] [CrossRef]
- Luscuere, L. Materials Passports: Optimising value recovery from materials. Proc. Inst. Civ. Eng. Waste Resour. Manag. 2016, 170, 1–4. [Google Scholar] [CrossRef]
- Brunner, P.H. Urban mining, a contribution to reindustrializing the city. J. Ind. Ecol. 2011, 15, 339–341. [Google Scholar] [CrossRef]
- Lanau, M.; Liu, G.; Kral, U.; Wiedenhofer, D.; Keijzer, E.; Yu, C.; Ehlert, C. Taking stock of built environment stock studies: Progress and prospects. Environ. Sci. Technol. 2019, 53, 8499–8515. [Google Scholar] [CrossRef]
- Augiseau, V. La Dimension Matérielle de l’urbanisation. Flux et Stocks de Matériaux de Construction en Ile-de-France. Ph.D. Thesis, Université Panthéon-Sorbonne-Paris I, Paris, France, 2017; 554p. [Google Scholar]
- Sáez, P.V.; Osmani, M. Deliverable 1.1. In Recovery Technologies for Construction and Demolition Waste; MINEA COST Action Project: Brussels, Belgium, 2018; 81p. [Google Scholar]
- Augiseau, V.; Barles, S. Studying construction materials flows and stock: A review. Resour. Conserv. Recycl. 2017, 7123, 153–164. [Google Scholar] [CrossRef]
- Faist Emmenegger, M.; Frischknecht, R. Métabolisme Du Canton De Genève-Phase 1-Rapport Final Pour Le Compte Du Groupe De Travail Interdépartemental Écosite De La République Et Du Canton De Genève; Uster ESU Service: Geneva, Switzerland, 2003; 47p. [Google Scholar]
- Barles, S. Urban metabolism of Paris and its region. J. Ind. Ecol. 2009, 13, 898–913. [Google Scholar] [CrossRef]
- Rouvreau, L.; Michel, P.; Serrand, M.; Montfort Climent, D.; Jayr, E.; Papinot, P.-E. Projet ANR ASURET—Analyse de Flux de Matière du Secteur de la Construction à l’échelle de l’ouvrage et du Territoire (Tâche 4.2)—Rapport BRGM/RP-61849-FR; BRGM: Orléans, France, 2012; 142p. [Google Scholar]
- Schiller, G. Urban infrastructure: Challenges for resource efficiency in the building stock. Build. Res. Inf. 2007, 35, 399–411. [Google Scholar] [CrossRef]
- Huang, C.; Han, J.; Chen, W.-Q. Changing patterns and determinants of infrastructures’ material stocks in Chinese cities. Resour. Conserv. Recycl. 2017, 123, 47–53. [Google Scholar] [CrossRef]
- Wang, Y.; Chen, P.C.; Ma, H.W.; Cheng, K.L.; Chang, C.Y. Socio-economic metabolism of urban construction materials: A case study of the Taipei metropolitan area. Resour. Conserv. Recycl. 2018, 128, 563–571. [Google Scholar] [CrossRef]
- Brunner, P.H.; Rechberger, H. Practical Handbook of Material Flow Analysis; CRC Press: Boca Raton, FL, USA, 2004; 336p. [Google Scholar]
- Wiedenhofer, D.; Steinberger, J.K.; Eisenmenger, N.; Haas, W. Maintenance and expansion: Modeling material stocks and flows for residential buildings and transportation networks in the EU25. J. Ind. Ecol. 2015, 19, 538–551. [Google Scholar] [CrossRef] [PubMed]
- Schiller, G.; Bimesmeier, T.; Pham, A.T. Method for Quantifying Supply and Demand of Construction Minerals in Urban Regions—A Case Study of Hanoi and Its Hinterland. Sustainability 2020, 12, 4358. [Google Scholar] [CrossRef]
- Barles, S. L’écologie territoriale et les enjeux de la dématérialisation des sociétés: L’apport de l’analyse des flux de matières. Dév. Durable Territ. Écon. Géogr. Polit. Droit Sociol. 2014, 5. [Google Scholar] [CrossRef]
- Hashimoto, S.; Tanikawa, H.; Moriguchi, Y. Framework for estimating potential wastes and secondary resources accumulated within an economy—A case study of construction minerals in Japan. Waste Manag. 2009, 29, 2859–2866. [Google Scholar] [CrossRef]
- Kleemann, F.; Lederer, J.; Rechberger, H.; Fellner, J. GIS-based analysis of Vienna’s material stock in buildings. J. Ind. Ecol. 2017, 21, 368–380. [Google Scholar] [CrossRef]
- Stephan, A.; Athanassiadis, A. Quantifying and mapping embodied environmental requirements of urban building stocks. Build. Environ. 2017, 114, 187–202. [Google Scholar] [CrossRef]
- Augiseau, V.; Kim, E. Spatial characterization of construction material stocks: the case of the Paris region. Resour. Conserv. Recycl. 2020. [Google Scholar]
- Gervasio, H.; Dimova, S. Model for Life Cycle Assessment (LCA) of Buildings, EUR 29123 EN; Publications Office of the European Union: Brussels, Belgium, 2018; 107p, ISBN 978-92-79-79973-0. [Google Scholar] [CrossRef]
- Préfet Ile-de-France; Conseil Régional Ile-de-France. Schéma Régional du Climat, de l’Air et de l’Energie de l’Île-de-France; Préfet Ile-de-France et Conseil Régional Ile-de-France: Paris, France, 2012; 419p. [Google Scholar]
- CGDD. Comptes des Transports 2015, Annexe E Transport de Marchandises; CGDD: Paris, France, 2016. [Google Scholar]
- Duret, B.; Cerceau, J.; Mat, N. T13. Méthode de Détermination des Stocks de Matériaux de Construction, Exemple de la Ville de Lille; Projet ANR-08-VILL-0008 CONFLUENT: CONnaissances des FLux Urbains, EmpreiNTes environnementales et gouvernance durable; Barles, S., Ed.; CONFLUENT: Paris, France, 2013; 528p. [Google Scholar]
- Mabille, C. La gestion d’un patrimoine autoroutier. In Proceedings of the CETE de l’Est Conference La Route, un Patrimoine, Metz, France, 29 March 2012. [Google Scholar]
- RATP. Interruption Estivale sur le RER A: Les Réponses aux Questions des Voyageurs. 2016. Available online: http://scope.ratp.fr/interruption-estivale-sur-le-rer-a-les-reponses-aux-questions-des-voyageurs/ (accessed on 14 April 2017).
- RFF. Mobilisation Pour le réseau Ferré Français, Lancement d’un Programme Fiabilité Ile-de-France 2014–2020; RFF: Paris, France, 2014; 21p. [Google Scholar]
- SETRA. Modernisation des Infrastructures Ferroviaires—Opérations de Renouvellement de Voies Ballast, de Création de Voies Supplémentaires et D’électrification. Rapport D’études; SETRA: Paris, France, 2010; 41p. [Google Scholar]
- SIGEIF. Rapport Annuel; SIGEIF: Paris, France, 2013; 108p. [Google Scholar]
- SIGEIF. Rapport de Contrôle de la Concession de Distribution Publique D’électricité. Exercice 2015; SIGEIF: Paris, France, 2015; 119p. [Google Scholar]
- GRDF. Compte Rendu D’activité de la Concession; GRDF: Paris, France, 2015; 97p. [Google Scholar]
- SIGEIF. Rapport de Contrôle de la Concession de Distribution Publique de gaz. Exercice 2014; SIGEIF: Paris, France, 2014; 115p. [Google Scholar]
- CPCU. Rapport Annuel CPCU 2013; CPCU: Paris, France, 2013; 129p. [Google Scholar]
- Observatoire des Services Publics d’eau et D’assainissement. Services. 2017. Available online: http://www.services.eaufrance.fr/donnees (accessed on 14 April 2017).
- Mairie de Paris. Schéma Directeur des Usages et du Réseau d’eau non Potable de Paris 2015 2020; Marie de Paris: Paris, France, 2015; 43p. [Google Scholar]
- Duany, A.; Plater-Zyberk, E.; Speck, J. Suburban Nation: The Rise of Sprawl and the Decline of the American Dream; 10th Anniversary edition (September 2010); North Point Press: New York, NY, USA, 2010; ISBN 978-0865477506. [Google Scholar]
- Fouchier, V. Les Densités Urbaines et le Développement durable: Le cas de l’Ile-de-France et des villes Nouvelles; Edition du SGVN: Paris, France, 1997. [Google Scholar]
- Omhovère, M.; Foulard, S. Mos 2012: La ville se construit majoritairement en recyclage. Note Rapide Institut d’Aménagement d’Urbanisme d’Ile-de-France 2013, 636, 636. [Google Scholar]
- DRIEE, IAU IdF; UNICEM. Granulats en Île-de-France. Panorama Régional; DRIEE, IAU and UNICEM: Paris, France, 2017; 76p. [Google Scholar]
- UNICEM. L’industrie Française des Granulats en 2013; UNICEM: Paris, France, 2013; 4p. [Google Scholar]
- Augiseau, V. Note Méthodologique sur L’estimation des flux de Déchets de Chantiers du Bâtiment et des Travaux Publics; Géographie-Cités: Paris, France, 2018; 55p. [Google Scholar]
- Marchand, B. Paris, Histoire d’une ville, XIXe—XXe Siècle; Collection Points D’histoire, Seuil: Paris, France, 1993; 443p. [Google Scholar]
- Conseil Régional Ile-de-France. Plan Régional de Prévention et de Gestion des Déchets Issus des Chantiers du Bâtiment et des Travaux Publics; Conseil Régional Ile-de-France: Paris, France, 2015; 256p. [Google Scholar]
- Conseil Régional Ile-de-France. Plan Régional de Prévention et de Gestion des Déchets d’Ile-de-France-Synthèse; Conseil Régional Ile-de-France: Paris, France, 2019; 85p. [Google Scholar]
- Huuhka, S.; Lahdensivu, J. Statistical and geographical study on demolished buildings. Build. Res. Inf. 2016, 44, 73–96. [Google Scholar] [CrossRef]
- Darley, A.; Zeiger, P. Les sites industriels, enjeu de renouvellement urbain. In IAU IDF. MOS 1982—2012; De la carte au territoire; IAU IdF, Ed.; IAU IdF: Paris, France, 2014; Volume 2, 96p. [Google Scholar]
- INSEE. L’industrie francilienne: Des mutations de long terme toujours à l’œuvre. Insee Analyse 2018, 91, 795. [Google Scholar]
- Chesneau, I. La démolition des bureaux en Île-de-France: Renouvellement ou flexibilité? Géocarrefour 2003, 78, 337–348. [Google Scholar] [CrossRef]
- Chesneau, I. Le renouvellement des immeubles de bureaux. Le cas de l’Île-de-France. Ann. Rech. Urb. 2004, 97, 67–74. [Google Scholar] [CrossRef]
- Darley, A.; Davy, A.-C. Maisons individuelles: Un parc qui change davantage qu’il n’y paraît. In IAU IDF. MOS 1982–2012; De la carte au territoire; IAU IdF, Ed.; IAU IdF: Paris, France, 2014; Volume 2, 96p. [Google Scholar]
- Augiseau, V. Construction materials flows and stocks in Paris region: An overview. Ecocycles 2020, 6, 18–22. [Google Scholar] [CrossRef]
- PUCA. Vers des Politiques Publiques de Densification et D’intensification douces? Intérêts, Limites et Opportunités. Consultation Internationale de Recherche; PUCA: La Défense, France, 2013; 26p. [Google Scholar]
- Geldermans, R.J. Design for change and circularity—Accommodating circular material & product flows in construction. Energy Procedia 2016, 96, 301–311. [Google Scholar]
- Sandanayake, M.; Bouras, Y.; Haigh, R.; Vrcelj, Z. Current Sustainable Trends of Using Waste Materials in Concrete—A Decade Review. Sustainability 2020, 12, 9622. [Google Scholar] [CrossRef]
- IREX. Comment Recycler le Béton Dans le Béton-Recommandations du Projet National Recybéton; IREX: Paris, France, 2018. [Google Scholar]
- ONF IdF. Schéma Régional D’aménagement d’Ile-de-France; ONF: Paris, France, 2008; 98p. [Google Scholar]
- Omont, L. La filière bois en Ile-de-France: Un fonctionnement qui dépasse les limites régionales. A la page INSEE 2012, 394. [Google Scholar]
- CitéSource; Neo-Eco. Rapport Final du Lot 1 Pour Est Ensemble. Etude d’identification des Gisements de Matériaux et des Filières de Valorisation des Déchets du BTP; CitéSource and Neo-Eco: Hallennes-lez-Haubourdin, France, 2019; 164p. [Google Scholar]
- Balon, P.; Coussy, S.; Michel, P.; De Oliveira, H. Etude de Faisabilité et Définition Opérationnelle de Valorisation des Terres Excavées—Phase 1. Rapport Provisoire BRGM/RP-67205-FR; BRGM: Orléans, France, 2017; 82p. [Google Scholar]


| ee | Groups of Buildings or Networks | Partially or totally Included | If Partially Included, Buildings or Networks Excluded Due to Incomplete Data |
|---|---|---|---|
| Buildings | Buildings | Partially included | Sport buildings; buildings dedicated to art, entertainment, and recreation; agricultural buildings; greenhouses; silos; tolls; sport field stands; historical and religious buildings; underground car parks; light constructions, huts, meadows, awnings; sport grounds |
| Transport networks | Road network | Partially included | Gravel roads and paths, sidewalks, tunnels, bridges (excluding the binder courses and the surface courses overlying bridges); noise barriers; stairs |
| Railway network | Partially included | Tunnels, bridges, and viaducts (excluding rails, sleepers, and ballast located on bridges and viaducts); marshalling yards | |
| Aerodrome runways | Not included | / | |
| River network | Not included | / | |
| Energy and water networks | Electricity networks | Partially included | Pylons; transformers; wind turbines |
| Gas networks | Fully included | / | |
| Heating and cooling networks | Fully included | / | |
| Drinking water networks | Partially included | Aqueducts (excluding pipelines); water towers and other water reservoirs | |
| Non-potable water network | Partially included | Aqueducts (excluding pipelines) | |
| Sewerage networks | Partially included | Sewerage treatment plants | |
| Pipeline transportation of dangerous goods networks | Not included | / | |
| Telecommunication networks | Telephone cable and optical fiber | Not included | / |
| Type (Load-Bearing Structure) | Aboveground | Underground | ||
|---|---|---|---|---|
| Minimum | Maximum | Minimum | Maximum | |
| Collective housing before 1914 (stone) | 1979 | 1312 | ||
| Collective housing 1914–1947 (stone) | 1958 | 1312 | ||
| Collective housing 1948–1974 (concrete) | 1738 | 1590 | ||
| Collective housing 1975–2000 (concrete) | 1413 | 1590 | ||
| Collective housing since 2001 (concrete) | 1693 | 1590 | ||
| Collective housing with unknown construction year (stone or concrete) | 1413 | 1979 | 1312 | 1590 |
| Individual housing before 1914 (stone) | 1859 | 1457 | ||
| Individual housing 1914–1947 (stone) | 1859 | 1457 | ||
| Individual housing 1948–1974 (stone and concrete) | 1094 | 567 | ||
| Individual housing 1975–2000 (concrete) | 1045 | 567 | ||
| Individual housing since 2001 (mixed: concrete, brick, and timber) | 1403 | 567 | ||
| Individual housing with unknown construction year (stone, concrete, or mixed) | 1045 | 1859 | 567 | 1457 |
| Shopping malls and buildings dedicated to transport and storage (steel framed) | 484 | 1590 | ||
| Other commercial and administrative buildings before 1914 (stone) | 1958 | 1312 | ||
| Other commercial and administrative buildings 1914–1947 (stone) | 1565 | 1312 | ||
| Other commercial and administrative buildings 1948–1974 (concrete) | 1738 | 1590 | ||
| Other commercial and administrative buildings 1975–2000 (concrete) | 1413 | 1590 | ||
| Other commercial and administrative buildings since 2001 (concrete) | 1506 | 1590 | ||
| Other commercial and administrative buildings with unknown construction year (stone or concrete) | 1413 | 1958 | 1312 | 1590 |
| Industrial building before 1948 (brick) | 852 | 1590 | ||
| Industrial building since 1948 (steel framed) | 522 | 1590 | ||
| Industrial building with unknown construction year (brick or steel) | 522 | 852 | 1590 | 1590 |
| Non-residential building with unknown activity (use) built before 1914 (steel, brick, or stone) | 484 | 1958 | 1312 | 1312 |
| Non-residential building with unknown activity 1914–1947 (steel, brick, or stone) | 484 | 1565 | 1312 | 1312 |
| Non-residential building with unknown activity 1948–1974 (steel or concrete) | 484 | 1738 | 1590 | 1590 |
| Non-residential building with unknown activity 1975–2000 (steel or concrete) | 484 | 1413 | 1590 | 1590 |
| Non-residential building with unknown activity since 2001(steel or concrete) | 484 | 1506 | 1590 | 1590 |
| Non-residential building with unknown activity and unknown construction year (steel, brick, stone, or concrete) | 484 | 1958 | 1312 | 1590 |
| Before 1914 | 1914–1947 | 1948–1974 | 1975–2000 | Since 2001 | Unknown Year | ||
|---|---|---|---|---|---|---|---|
| Minimum | Maximum | ||||||
| Multi-family houses | 56 | 56 | 112 | 62 | 73 | 56 | 112 |
| Single-family houses | 88 | 88 | 88 | 113 | 122 | 88 | 153 |
| Shopping malls and buildings dedicated to transport and storage | 44 | 44 | 44 | ||||
| Other commercial and institutional buildings | 56 | 54 | 112 | 62 | 24 | 24 | 112 |
| Industrial buildings | 14 | 89 | 14 | 89 | |||
| Indicators | The Paris Region | Paris | Petite Couronne | Grande Couronne |
|---|---|---|---|---|
| Population density on urbanized area, inhab./km2 | 4479 | 23,828 | 8108 | 2588 |
| Building floor area to urbanized area, ratio | 0.4 | 2.0 | 0.5 | 0.2 |
| Share of single-family house, % of urbanized area | 27 | 2 | 17 | 36 |
| Annual average road extension rate, % | 0.5 | 0 | 0.3 | 0.5 |
| Annual average construction rate, % of building floor area | 0.6 | 0.3 | 0.7 | 0.7 |
| Annual average refurbishment rate, % of building floor area (intermediate value) | 2.1 | 1.9 | 2.0 | 2.2 |
| Annual average demolition rate, % of building floor area | 0.7 | 0.5 | 0.8 | 0.6 |
| Paris Region (Source) | Mainland France Excluding the Paris Region | Mainland France Including the Paris Region | |
|---|---|---|---|
| Aggregates consumption per capita (t/cap) | 1.1 (authors) | 6.5 | 5.8 |
| 2.5 [62] | |||
| Share of aggregates used for concrete production (%) | 68 (authors) | 31 | 33 |
| 50 [62] | |||
| Urban area extension rate from 2006 to 2012 (%) | 1.3 | 3.0 | 2.9 |
| Road extension rate in 2013 (%) | 0.3 | 0.6 | 0.6 |
| Share of single-family houses in residential construction in 2013 (%) (number of dwellings, started construction projects) | 14 | 53 | 47 |
Publisher’s Note: MDPI stays neutral with regard to jurisdictional claims in published maps and institutional affiliations. |
© 2021 by the authors. Licensee MDPI, Basel, Switzerland. This article is an open access article distributed under the terms and conditions of the Creative Commons Attribution (CC BY) license (http://creativecommons.org/licenses/by/4.0/).
Share and Cite
Augiseau, V.; Kim, E. Inflows and Outflows from Material Stocks of Buildings and Networks and their Space-Differentiated Drivers: The Case Study of the Paris Region. Sustainability 2021, 13, 1376. https://doi.org/10.3390/su13031376
Augiseau V, Kim E. Inflows and Outflows from Material Stocks of Buildings and Networks and their Space-Differentiated Drivers: The Case Study of the Paris Region. Sustainability. 2021; 13(3):1376. https://doi.org/10.3390/su13031376
Chicago/Turabian StyleAugiseau, Vincent, and Eunhye Kim. 2021. "Inflows and Outflows from Material Stocks of Buildings and Networks and their Space-Differentiated Drivers: The Case Study of the Paris Region" Sustainability 13, no. 3: 1376. https://doi.org/10.3390/su13031376
APA StyleAugiseau, V., & Kim, E. (2021). Inflows and Outflows from Material Stocks of Buildings and Networks and their Space-Differentiated Drivers: The Case Study of the Paris Region. Sustainability, 13(3), 1376. https://doi.org/10.3390/su13031376