Article

OVALI, Sustainability for Poultry®: A Method Co-Designed by Stakeholders to Assess the Sustainability of Chicken Supply Chains in Their Territories

1
INRAE, Université de Tours, BOA, 37380 Nouzilly, France
2
Institut Technique de l’Aviculture, 37380 Nouzilly, France
3
AgroParisTech, INRAE, Université Paris-Saclay, SADAPT, 75005 Paris, France
4
Institut Technique de l’Aviculture, 75009 Paris, France
*
Author to whom correspondence should be addressed.
Current address: Syndicat National des Labels Avicoles de France, 75009 Paris, France.
Sustainability 2021, 13(3), 1329; https://doi.org/10.3390/su13031329
Submission received: 22 December 2020 / Revised: 15 January 2021 / Accepted: 22 January 2021 / Published: 27 January 2021
(This article belongs to the Special Issue Sustainable Livestock Production)

Abstract

:
Sustainability is a challenging issue for livestock production, with many expectations from citizens and consumers. Thus, in order to improve existing production systems or design new ones, there is a need for sustainability assessment tools. We propose here a method based on a participatory approach to assess the sustainability of chicken supply chains. A participating group composed of various French stakeholders (poultry industry operators, research and development scientists, non-governmental organizations, etc.) was consulted to gather the various existing visions of sustainability. Each decision was validated by this group, and this resulted in the creation of a consensual assessment grid, based on economic, social, and environmental pillars, summarized in 9 goals, 28 criteria, and 45 indicators. Each item was weighted by the participating group according to their relative importance. The grid was then tested on two different French supply chains, producing either free-range or conventional standard chickens. The strengths, weaknesses, and improvement margins of each supply chain were identified. For conventional standard production, an improvement scenario was proposed, based on changes in chicken feed and the renovation of chicken houses. This new supply chain improved many criteria in the three pillars; such as economic competitiveness, European protein autonomy, social acceptance, and lower greenhouse gas emission. In conclusion, this method provides a robust and powerful tool to help stakeholders to start their own autonomous improvement process, and thus progress towards a more sustainable chicken production.

1. Introduction

According to the estimates of the Organization for Economic Co-operation and Development (OECD) and the Food and Agriculture Organization (FAO), in the decade to come, chicken will remain the most produced and consumed meat in the world, with a production increase by about 16% over the period [1]. Despite this worldwide growing demand, chicken production is currently facing many sustainability challenges, such as economic competitiveness, environmental impact, resource availability, animal welfare, meat quality, and episodic health alerts [2,3,4,5,6,7]. Furthermore, public institutions and non-governmental organizations (NGOs, e.g., environment protection, animal welfare) encourage citizens to behave responsibly and to become “citizen-consumers,” further increasing the pressure on livestock production [8].
In such a context, the following question has arisen: “how can the sustainability of chicken production be improved?” First put forward in 1987 in the “Brundtland report” [9], the complex notion of “sustainability” can be interpreted as a trajectory guiding constructive changes. Yet, it can also be perceived by stakeholders as a fuzzy concept, thus limiting their actions to improve their practices [10]. There is, therefore, a need for methods and tools to assess the sustainability of production systems and to identify their strengths and weaknesses, in order to propose sustainability goals and solutions to reach them. As reported by many authors, several aspects of sustainability can be considered during decision-making, and sustainability is generally represented with three interacting pillars: economic, environmental, and social [9,11,12,13]. Assessing the sustainability of production systems should, therefore, take into consideration all three pillars, in order to obtain a global view of sustainability and thus be able to identify innovations improving at least one pillar without compromising the others. Furthermore, when dealing with the sustainability of chicken production, the best approach should be the supply chain (SC) since poultry SC are highly structured with very specialized and interconnected links (hatcheries, feed producers, farms, slaughterhouses, etc.), numerous relationships between stakeholders and many money/capital, information, and matter flows [14,15,16]. This implies a shared responsibility of the stakeholders with regard to the sustainability of SC in their respective territories and requires a holistic approach of the issue [17]. A participatory approach should also be encouraged, since it allows considering the concerns of various stakeholders regarding sustainability [18,19,20,21]. Finally, such tools should be sufficiently generic to assess the diversity of production systems and products that can be found, in the perspective of increasingly segmented French and European markets (whole chicken, cut parts, processed products, etc. [22]).
In the literature, various methods are available to assess the sustainability of livestock, in species other than poultry [23,24,25,26]. Some methods focusing on poultry production are also described in the literature, but they do not necessarily allow the evaluation of chicken SC, as they were developed to assess sustainability on the chicken production unit scale (i.e., the farm) or focused on egg production [27,28,29,30,31]. To our knowledge, only one method reported in the literature, the AVIBIO method (previously developed by some authors of this paper) [32], has approached the sustainability of chicken production by considering the three pillars of sustainability on the SC scale (AVIBIO is a French acronym for “organic poultry”). However, although it was developed with a participatory approach, it only concerned organic chicken production, which is still a niche market in the EU [33]. This means that there is still a need for a more generic method to assess the sustainability of the non-organic chicken SC. Furthermore, this method had several methodological limitations, such as the composition of the participatory group involved in the project, which was rather limited in its size and its diversity (e.g., few operators from the private sector and no representative of NGOs). Finally, the conversion of indicators into scores was quite simple (i.e., conversion scales by “steps” rather than with continuous functions) and could be improved to provide more robustness and sensitivity to the method [34].
Therefore, by capitalizing on the experience of the AVIBIO project, the goal of this study was then to develop and test a method, to help stakeholders tackle sustainability issues in chicken SCs. In this paper, we firstly present the OVALI assessment method, and the way it was co-constructed with French stakeholders in a participatory approach (OVALI is a French acronym for “multicriterion evaluation tool to design innovative poultry production systems”). Then, we describe two case studies designed to test the OVALI method on two contrasted French chicken SCs (indoor vs. free-range production). Finally, we propose the ex-ante assessment of a third scenario designed to improve the sustainability of one of the two case studies.

2. Methods

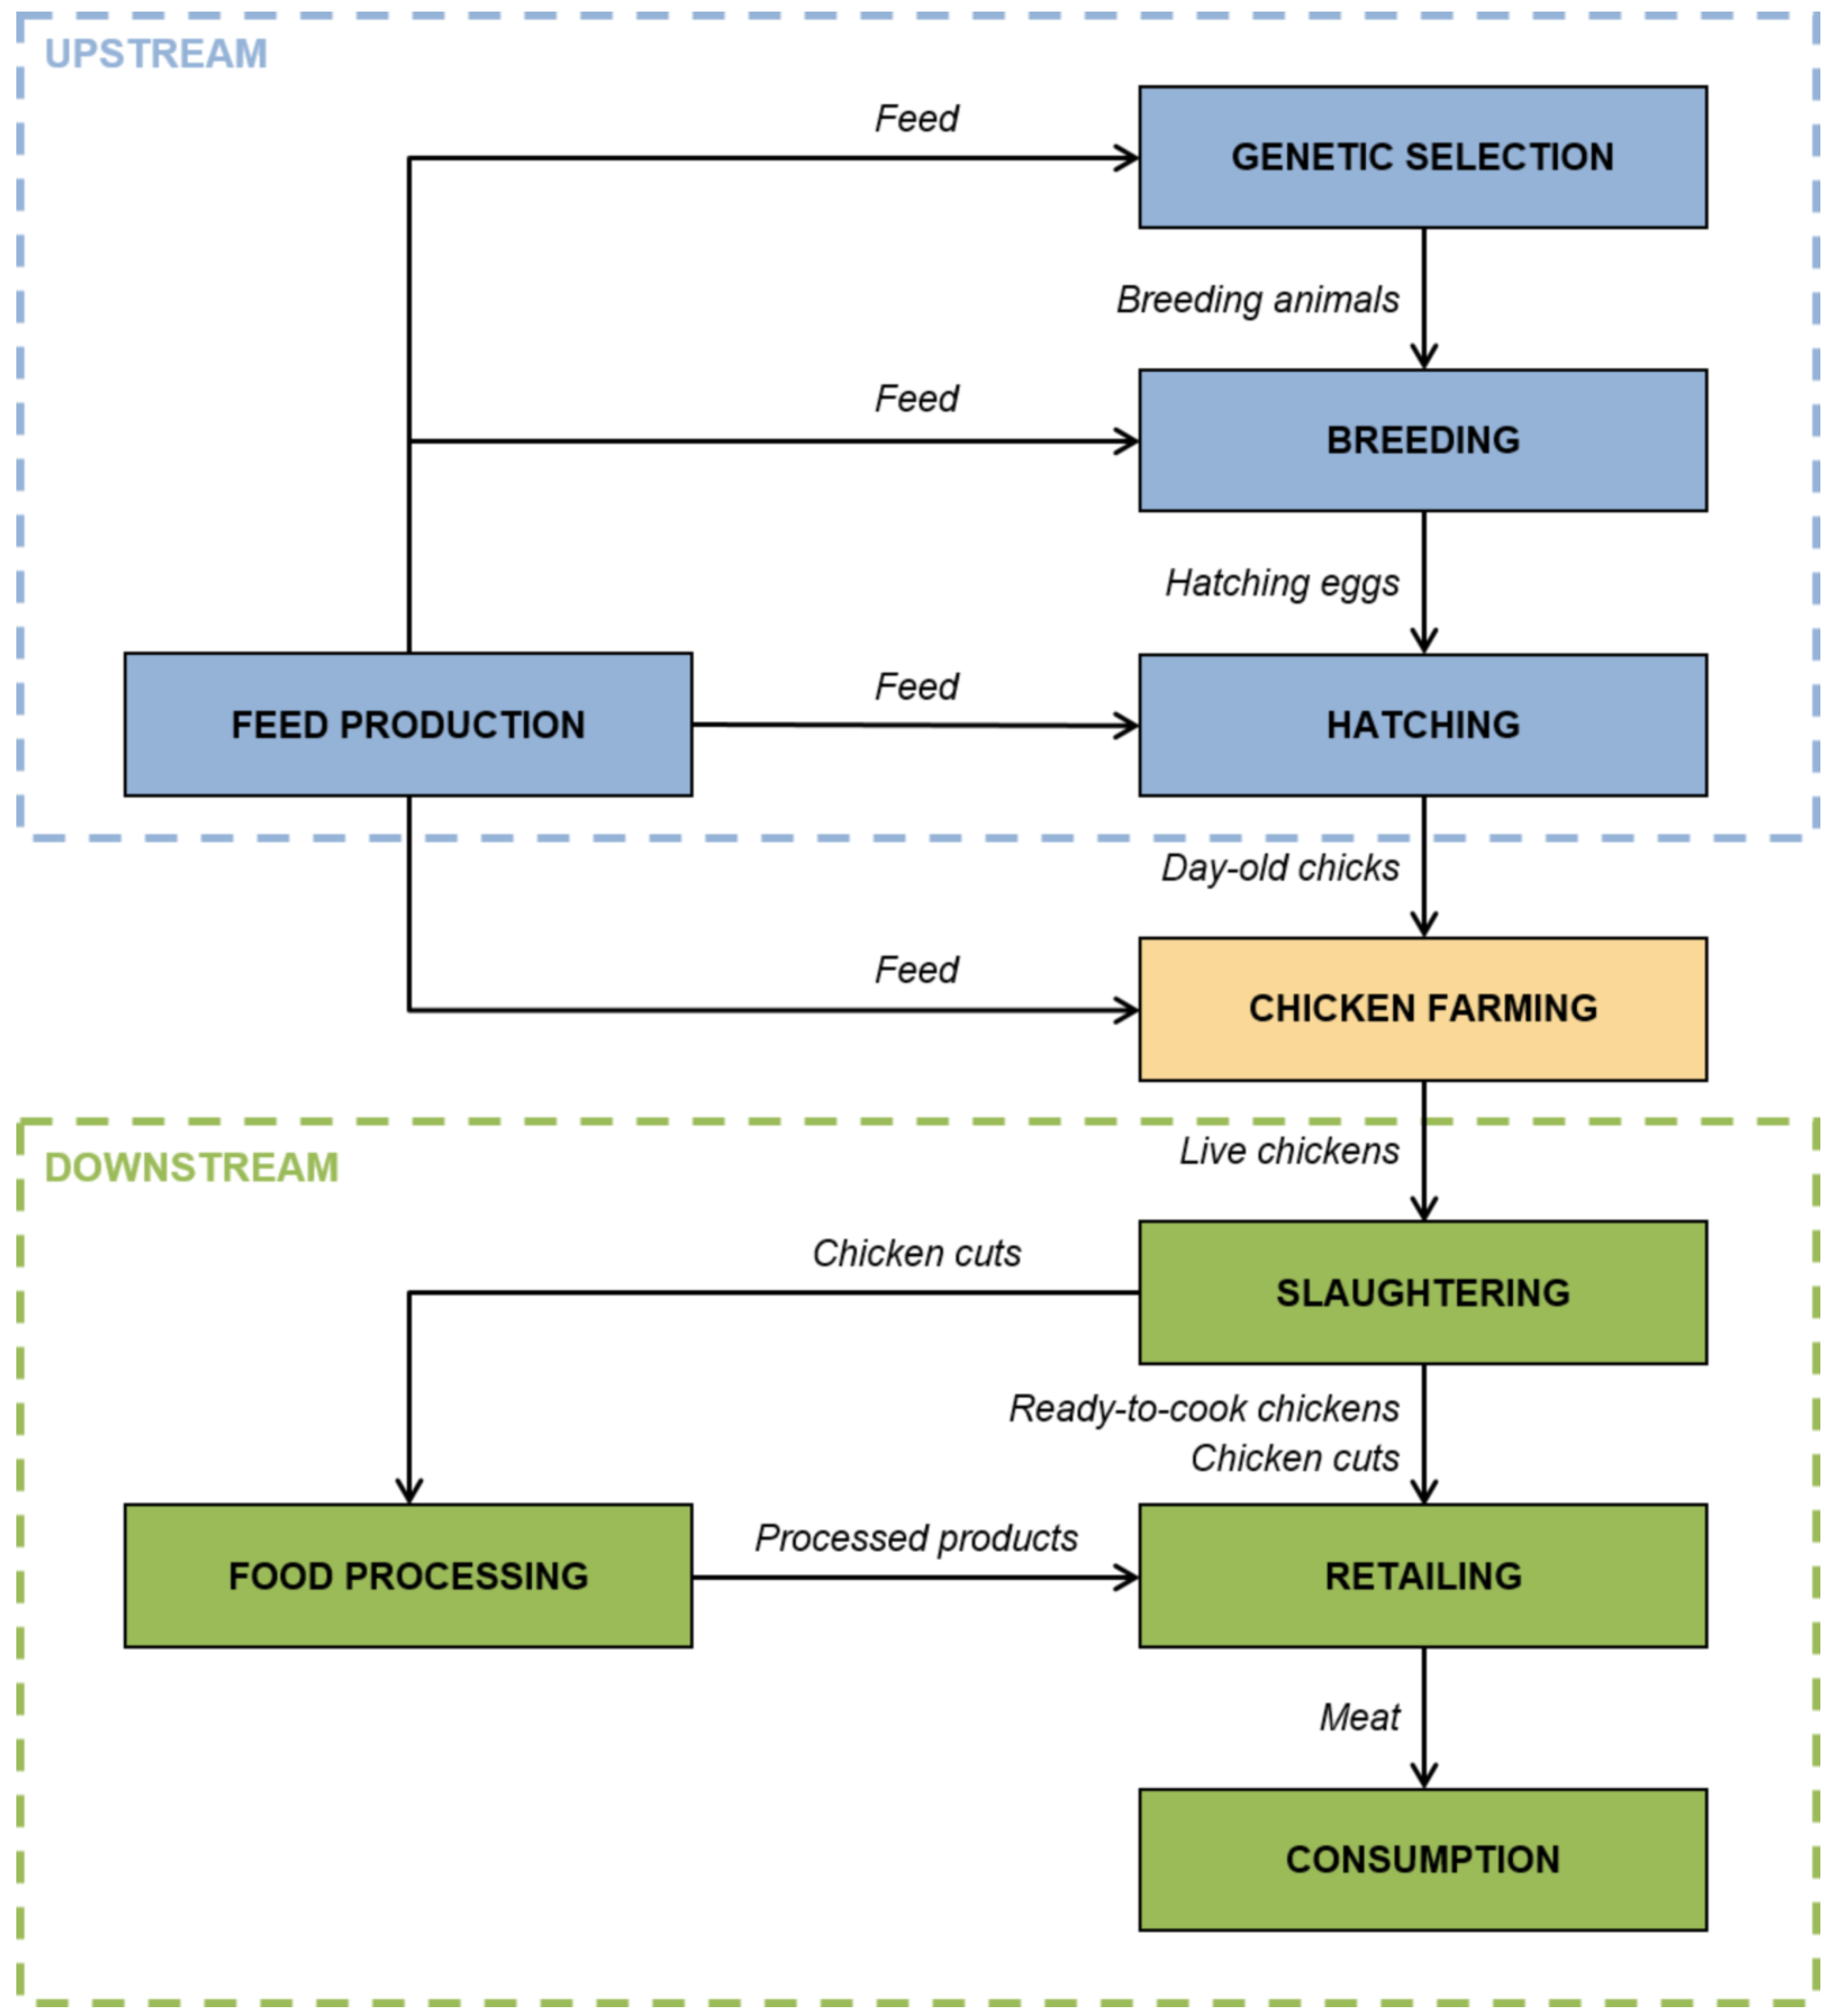
2.1. Choosing the System Boundaries, Sustainability Dimensions, and Assessment Grid Structure

To study the sustainability of chicken production, the whole chicken SC in its territory was considered, from breeding companies to consumers. The SC can be schematically represented as in Figure 1, with operators and activities both upstream and downstream of chicken farms.
The generic structure of the assessment grid was defined by the authors (i.e., the OVALI “core-team”) as follows:
  • The three pillars (economic, social, and environmental) should be considered [9,11,12,13];
  • Each sustainability pillar is divided into three main goals. A goal is a general concept or a main issue that would characterize sustainability in the system being studied [11] (in our case a chicken SC);
  • Each goal is described by criteria (between two and four per goal) to specify how to apprehend the sustainability goal [35];
  • Criteria are measured using indicators. The selected indicators were filled in using data provided by surveys, literature reviews, and expert opinions.

2.2. A Participatory Approach to Define Weighted Sustainability Goals, Criteria, and Indicators

Since many stakeholders are involved in the functioning of an SC, there are various points of view regarding what a sustainable chicken SC should be. In order to consider this diversity of opinions, preferences, experience, and knowledge, a bottom-up participatory approach was used which involved SC stakeholders at each stage of the development of the OVALI method [18,19,20,21,36]. A participating group (PG) composed of 26 various French stakeholders was, therefore, created in order to share and debate opinions. The same persons were involved during the entire co-construction process. All stakeholders were voluntary and were not paid to join to the PG.
The PG members were chosen to be representative of the diversity of the existing chicken SC in France and belonged to different categories of stakeholders [37]. They were considered to be either:
  • Involved directly in the decision-making processes (i.e., farmers, private companies, etc.);
  • Affected by the SC (i.e., stakeholders from the civil society);
  • Involved in proposing innovative solutions to be applied in the SC (research and development, education).
The PG involved 8 operators of the chicken SC (feed producers, farmers, slaughterers, food processers and retailers), 6 members of SC organizations, 10 research and development or education representatives, and 2 members of NGOs (consumer and environmental protection associations).
Shared meetings (six one-day meetings scheduled over 20 months) were preferred to individual interviews in order to promote the sharing of information and points of view, and to co-construct a shared vision of what a sustainable SC should be [18]. During these meetings, led by the OVALI core-team, the PG was asked to share information and experience, and to take consensual decisions (e.g., final selection and weighting of goals/criteria/indicators), which were not discussed further during subsequent meetings (steps forward in the decision-making process).
To provide the PG members with “context elements” and help them in their decision-making process, three focus groups were organized. The first one (“SC-society”) gathered 19 people (12 being also members of the PG). Within this group, chicken SC operators (6), representatives of society (6), and research and development representatives (7) discussed the following question “Which chicken production system should be aimed for in France.” In addition, two focus groups with French consumers (one in Paris, the other one in a small town of about 4000 inhabitants located about 20 km from Tours) were organized to better assess the expectations and perceptions of consumers regarding poultry production [38]. The results of these three meetings were then communicated to the PG members. Briefly, the main findings were:
  • The relevance or meaningfulness of the diversity of French production systems (indoor, free-range, organic, etc.);
  • The need to improve the value/image of French conventional standard chicken production;
  • The need for greater competitiveness compatible with reasonable economies of scale; (with larger poultry farms and geographical concentration of operators);
  • The need for practices aiming at improving animal welfare and environmental footprint in chicken SC;
  • Increased vegetal protein autonomy for feed production;
  • Greater coordination and dialogue between operators within a SC.
With these elements, the expertise of the OVALI core team, and a literature review, an initial list of sustainability goals and criteria was proposed to the PG, who discussed these items in small groups (one per pillar) to propose changes, before a collective discussion and validation by the whole PG. In particular, about 60% of the goals and criteria were inspired by those of the AVIBIO method [32] as shown in Figure A1. After the validation of sustainability goals and criteria, the same approach was carried out to select the indicators (initial list discussed, modified, and validated by the PG). Once again, about half of the indicators were taken and/or adapted (to concern all chicken SC) from the AVIBIO method [32] (Figure A1). The remaining goals/criteria were selected from the literature and the expertise of researchers consulted in dedicated meetings.
As explained above, indicators were used to describe sustainability criteria. According to many authors, indicators should present common characteristics in order to guarantee the success of the assessment method [12,27,28,29,39,40,41]. The indicators were, therefore, selected to be:
  • Relevant to the general issue addressed by the assessment method;
  • A reliable quantitative or qualitative measure of a criterion or goal;
  • Sensitive to variations;
  • Easy to understand and interpret.
When possible, indicators were chosen to consider the whole SC by measuring a synthetic variable, taking into account the entire production process (e.g., life cycle analysis indicators) or by collecting the same information for each link in the SC. However, some criteria only involved a limited number of SC links (e.g., those dealing with animal feed, which only concerned feed producers). In this case, specific indicators were chosen. Finally, certain indicators in our approach were composite indicators, meaning that they were based on several sub-indicators [42].
The three sustainability pillars (economic, social, and environmental) were given the same maximum score of 180 points, meaning that each pillar was of equal importance with regard to sustainability issues. Moreover, no compensation between pillars was allowed. Thus, a poor score for one pillar could not be compensated by a high score for another. For each pillar, the PG was then asked to distribute these 180 points between the different goals. Similarly, for each goal, the maximum score given to a goal was distributed between criteria, and the score given to a criterion was then distributed between the associated indicators. Such a participatory approach encouraged the members of the PG to shift from a personal point of view to a common and shared vision of sustainability in the chicken SC, and the final weighted grid reflected this consensual vision of sustainability in chicken SC [18].

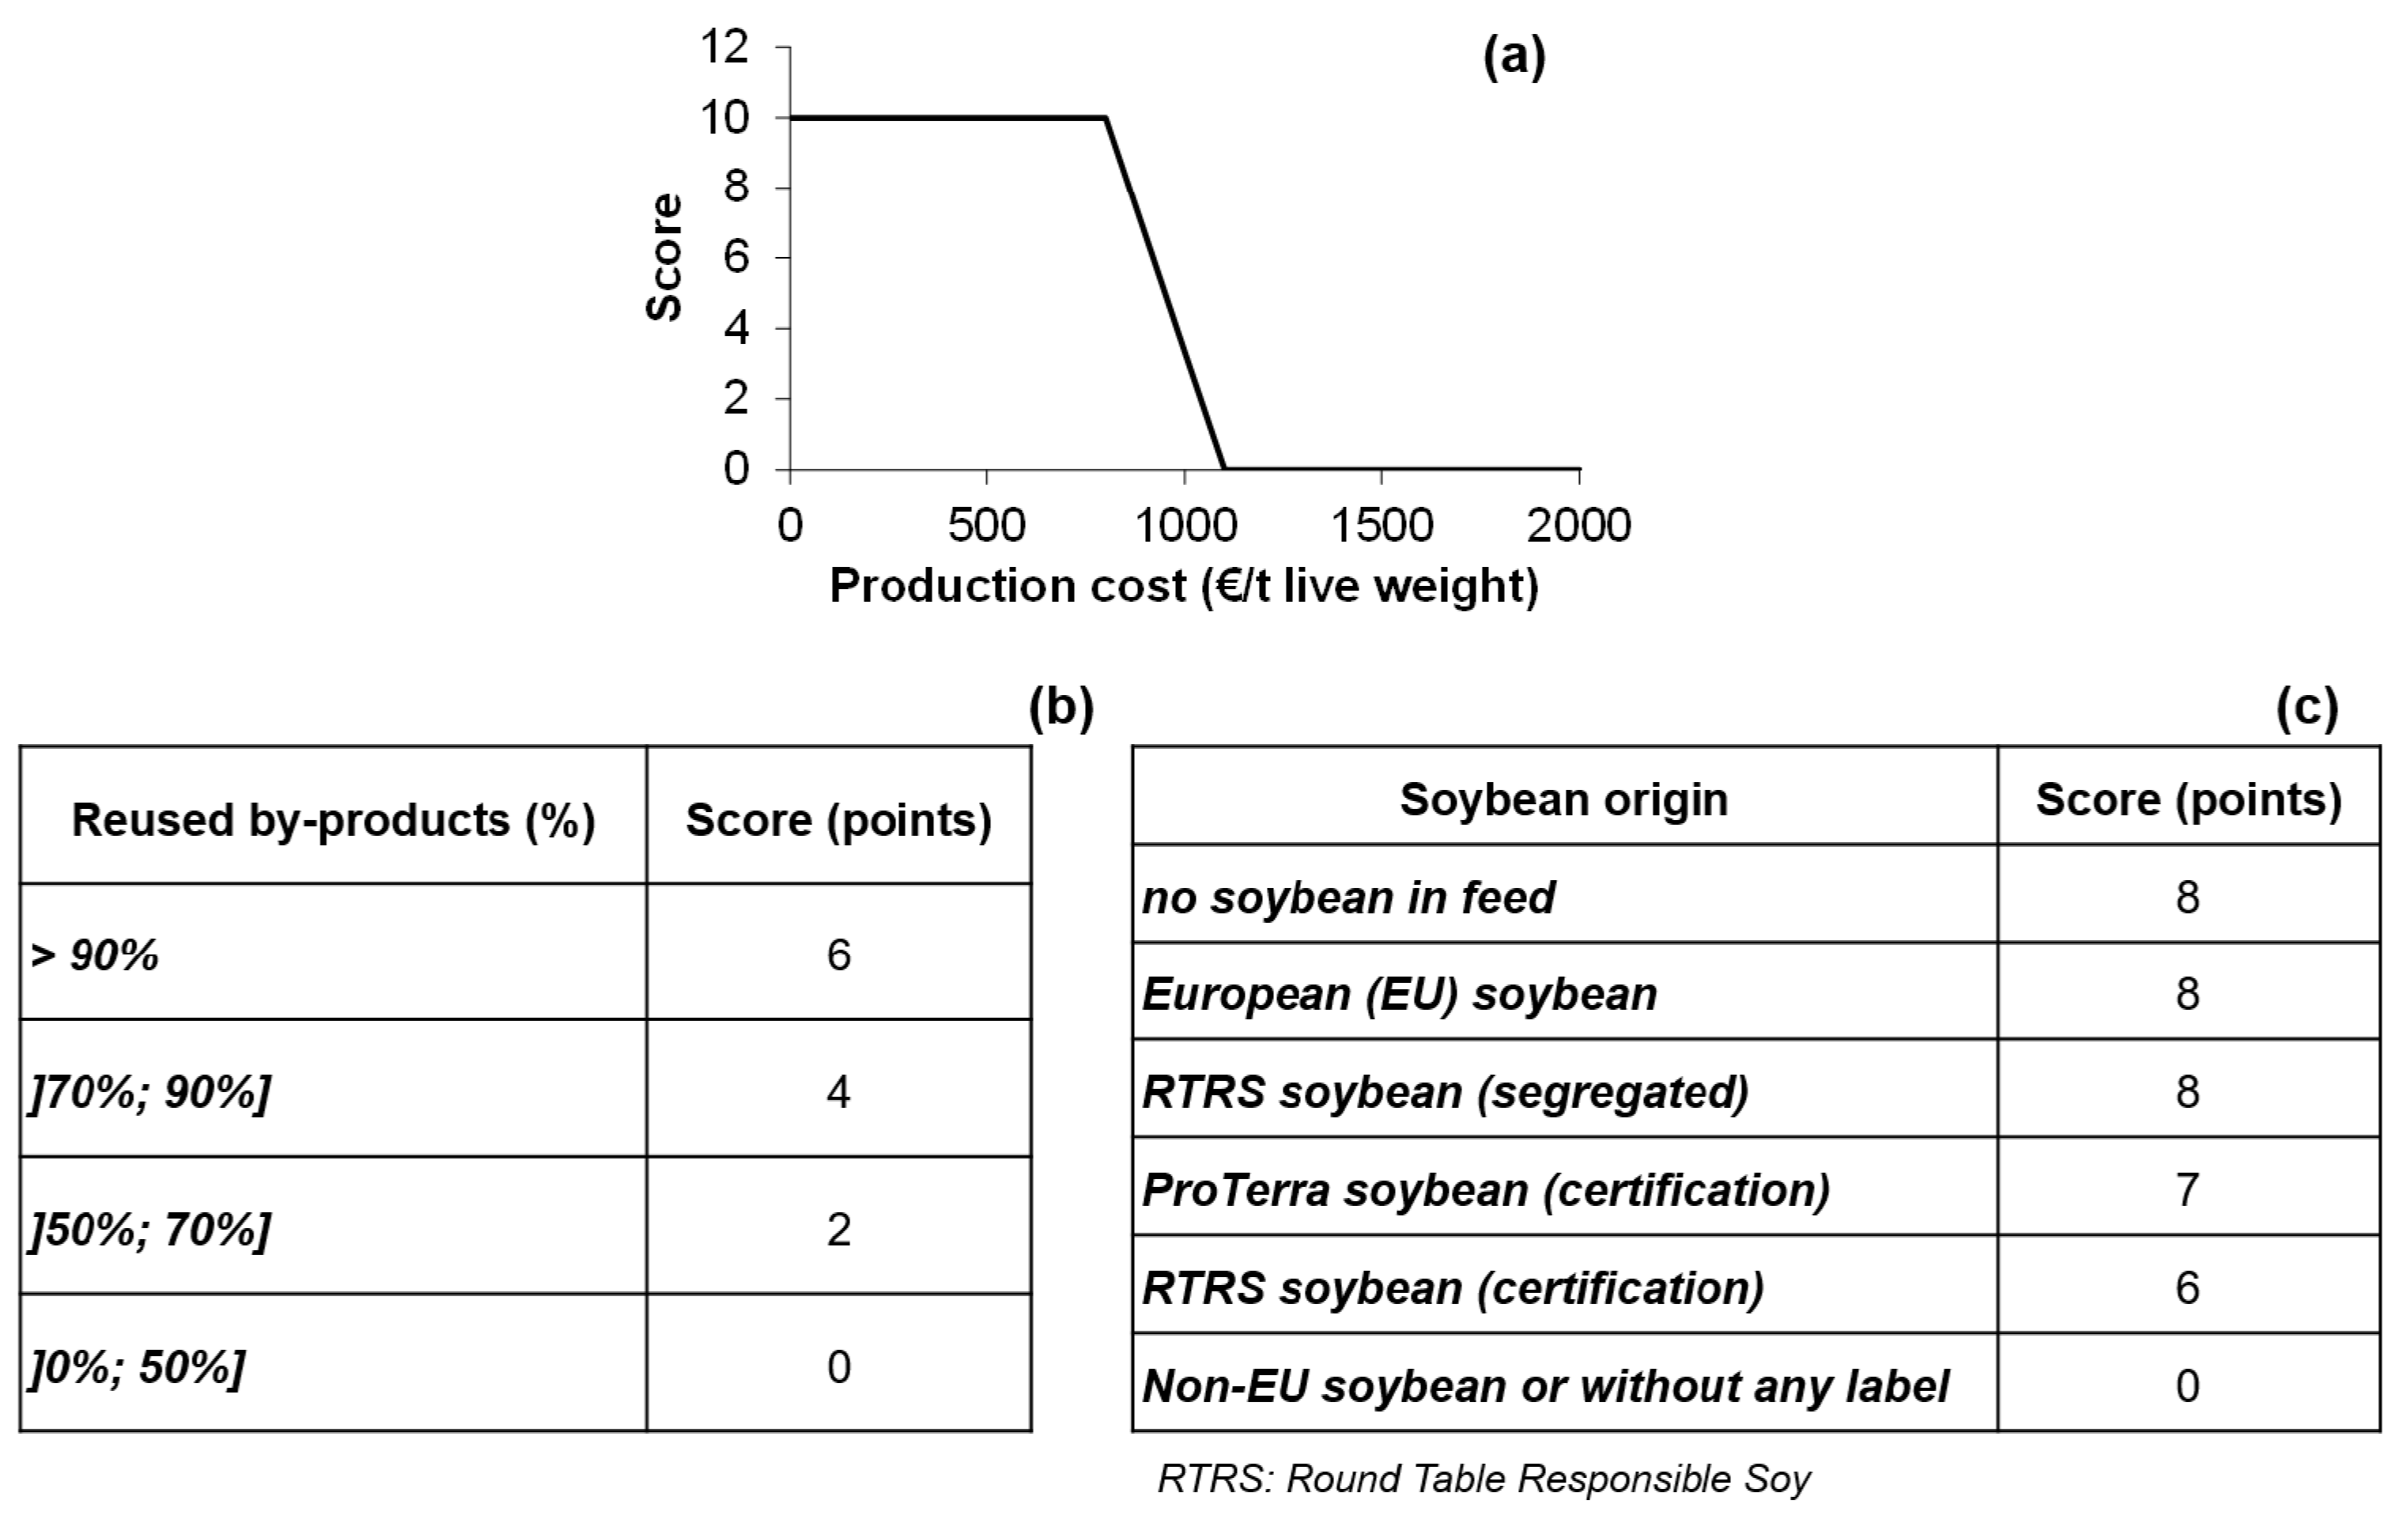
2.3. Converting Each Indicator into a Score and Setting out Assessment Results

In order to allow their aggregation into sustainability criteria, goals, and pillars, the results of the indicators were converted into scores (points). Score conversion scales were, therefore, constructed by the PG, sometimes with the preliminary help of experts (e.g., for indicators concerning animal welfare). The conversion of a quantitative indicator into a score can be based either on continuous functions or on class intervals (Figure 2a,b). Upper and lower thresholds were identified from literature reviews and expert opinions or, when possible, with regard to policy targets or legislation [36], and then discussed by the PG. For qualitative indicators, a specific score was given to each indicator modality as shown in Figure 2c. Scores were always rounded to the nearest integer value.
With this conversion method, a score at criterion, goal, or pillar level can be obtained by adding the scores of the indicators composing the considered criterion, goal, or pillar. The results of the assessment process can then be represented at different levels (pillars, goals, criteria) according to the aims of the user (simple/general diagnosis, detailed diagnosis for action, etc.). The indicator and criteria levels provide various details regarding the SC sustainability and are, thus, helpful for the identification and quantification of improvement margins. In contrast, the aggregation at goal and pillar levels is less detailed, but it provides a quick overview of SC sustainability.
At the pillar level, each pillar score was converted into a grade ranging from A+ to E, for each 30-point section, A+ being the best grade (Figure 3), in order to facilitate the understanding and communication of the results. At the criteria level, an achievement rate (actual score/maximum score, %) was calculated and represented using three different colors (green: score >65%, yellow: score between 50 and 65%, or red: score <50% of the maximum score, respectively) to help the user quickly identify the strong and weak points of the SC (Figure 3). The threshold of 50% was chosen because it represents the average score (i.e., maximum score/2) whereas the threshold of 65% was chosen to avoid being too restrictive (and hence too penalizing) while being high enough to encourage stakeholders to improve themselves.

2.4. Assessing the Initial Situation and Proposing Innovative Systems: Examples of Label Rouge and Conventional Standard Chicken Supply Chains in the Pays-de-la-Loire Region

During the development of the OVALI method, several case studies were chosen by the PG to test the assessment grid and generate new information regarding the sustainability of representative chicken SC in France in terms of products (chicken for cutting and processing vs. whole chicken) and economic importance for the French poultry sector. Two of these case studies are presented below to illustrate the OVALI approach: “traditional free-range” (labeled with the official “Label Rouge” quality sign; LR) and conventional standard (STD) chicken productions, which are both produced in the Pays-de-la-Loire region (western part of France); moreover, both contribute significantly to their respective national production (about 35% and 20%, respectively).
The LR case study focused on French “traditional free-range” production with specific production conditions described in official specifications. In the LR SC in the Pays-de-la-Loire region, chickens are slaughtered at 2.30 kg (88 days), and are sold as ready-to-cook whole chickens (Table A1). The main characteristics of this production are:
  • A low animal density (11 birds/m²);
  • The use of a slow-growing genetic strain (average daily gain below 28 g/d);
  • An unlimited access to an outdoor run for the animals (first access before 6 weeks of age);
  • A minimum slaughter age of 81 d;
  • A minimum of 75% of cereals (grain or by-products) in the feed.
The STD case study focused on fast-growing chickens reared in closed chicken houses with no outdoor access and at a high animal density (23.4 birds/m²), with no official specifications or quality label. Birds are slaughtered at 1.83 kg (36 days of age) mostly to produce breast meat (performance levels of 2013; Table A1).
After analysis of the sustainability assessment of STD SC by the PG and the OVALI core team, the strengths, weak points, and improvement margins of the chicken SC were identified. In particular, an emphasis was put on “top-priority” points to improve the sustainability of the SC. In our study, technical solutions were sought at the farm level, and an innovative scenario, based on optimization of the production process and low soybean use, was designed and ex-ante evaluated with the OVALI grid (STD+ scenario; Table A1). However, the selection of the most relevant innovations and their implementation in commercial farms was not carried out as part of the OVALI project, as these decisions only belong to SC operators.
For the three evaluated scenarios, local operators (hatcheries, feed producers, production organizations, slaughterhouses, etc.) were identified and surveyed confidentially to collect data throughout the SC. Public data provided by the French Poultry Technical Institute (ITAVI) or collected by the statistics department of the French Ministry of Agriculture, as well as professional data and expertise were used.

3. Results

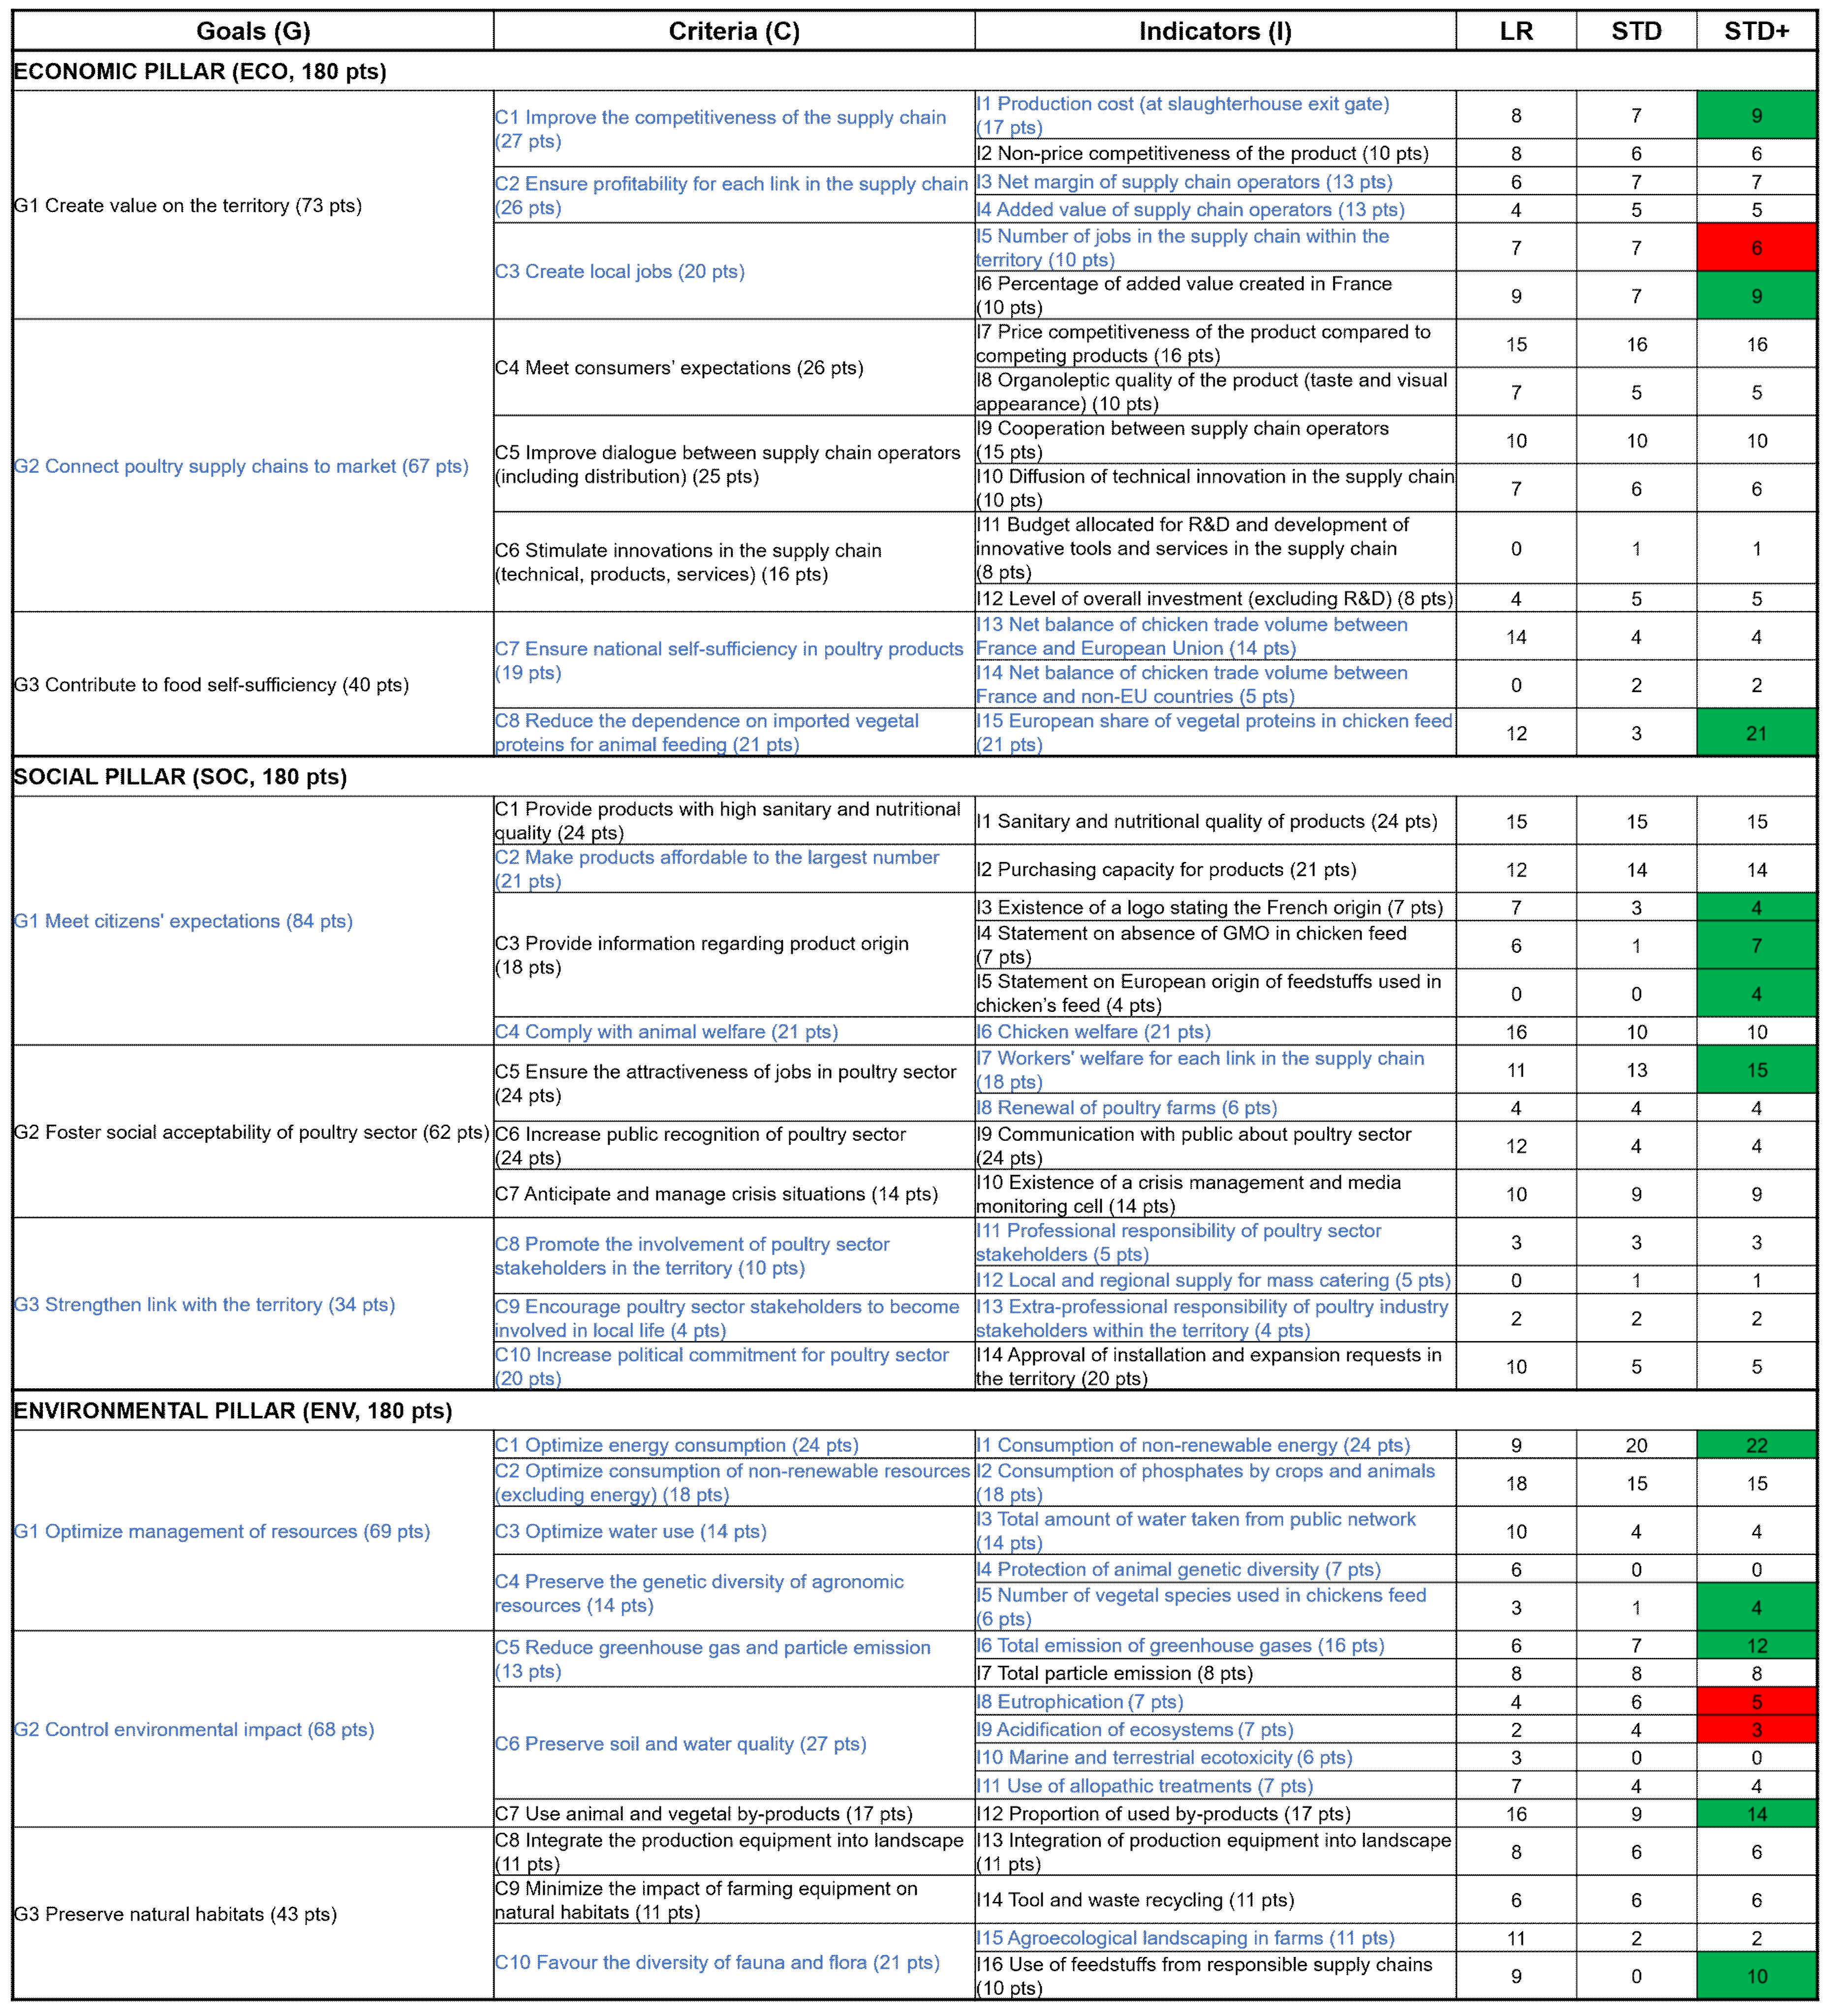
3.1. OVALI Grid for Assessment of Sustainability of Chicken Supply Chains

The final assessment grid comprises the three sustainability pillars (economic: ECO; social: SOC; environmental: ENV), 9 goals (G), 28 criteria (C), and 45 indicators (I) chosen, weighted, and validated by the PG (Figure 3; indicators are given in Appendix Figure A1; details on the indicators such as methodology, conversion scales, or origin of data are provided in Supplementary File S1).
The viability of the chicken SC depends on the creation of value in the considered territory (ECO.G1) with improved competitiveness (ECO.C1), profit for every SC link (ECO.C2), and the creation of local jobs (ECO.C3). Strong links between the industry and the market (ECO.G2) require meeting consumers’ expectations in terms of price and organoleptic quality (ECO.C4), improving dialogue between production operators (ECO.C5), and continuous adaptation through innovation (ECO.C6). Moreover, national food self-sufficiency (ECO.G3) relies on chicken production (ECO.C7) and the SC should be self-sufficient in vegetal proteins for animal feeding (ECO.C8).
Meeting citizens’ expectations (SOC.G1) implies selling products of good sanitary and nutritional quality (SOC.C1) that are not too expensive (SOC.C2). In response to current ethical issues, improving communication on product origin (SOC.C3) and respecting animal welfare (SOC.C4) are essential. Social acceptance of poultry production (SOC.G2) is illustrated by job attractiveness in the SC (SOC.C5) and recognition by the society (SOC.C6), but it also requires crisis management (SOC.C7). Moreover, the link between the industry and the territory can be improved (SOC.G3) by encouraging operator integration within their region (SOC.C8), operator involvement in local life (SOC.C9), and political commitment (SOC.C10).
Optimization of resources management (ENV.G1) means optimizing non-renewable resources (energy, phosphorus) and water use (ENV.C1, C2 and C3), as well as preserving the genetic diversity of the resources used to produce chicken meat (ENV.C4). Controlling the environmental impact (ENV.G2) means limiting air emissions (ENV.C5), preserving water and soil quality (ENV.C6), and using by-products (ENV.C7). Finally, the good integration of production equipment into the landscape (ENV.C8), low impact of production equipment on the environment (ENV.C9), and protection of flora and fauna (ENV.C10) guarantee the preservation of natural habitats (ENV.G3).

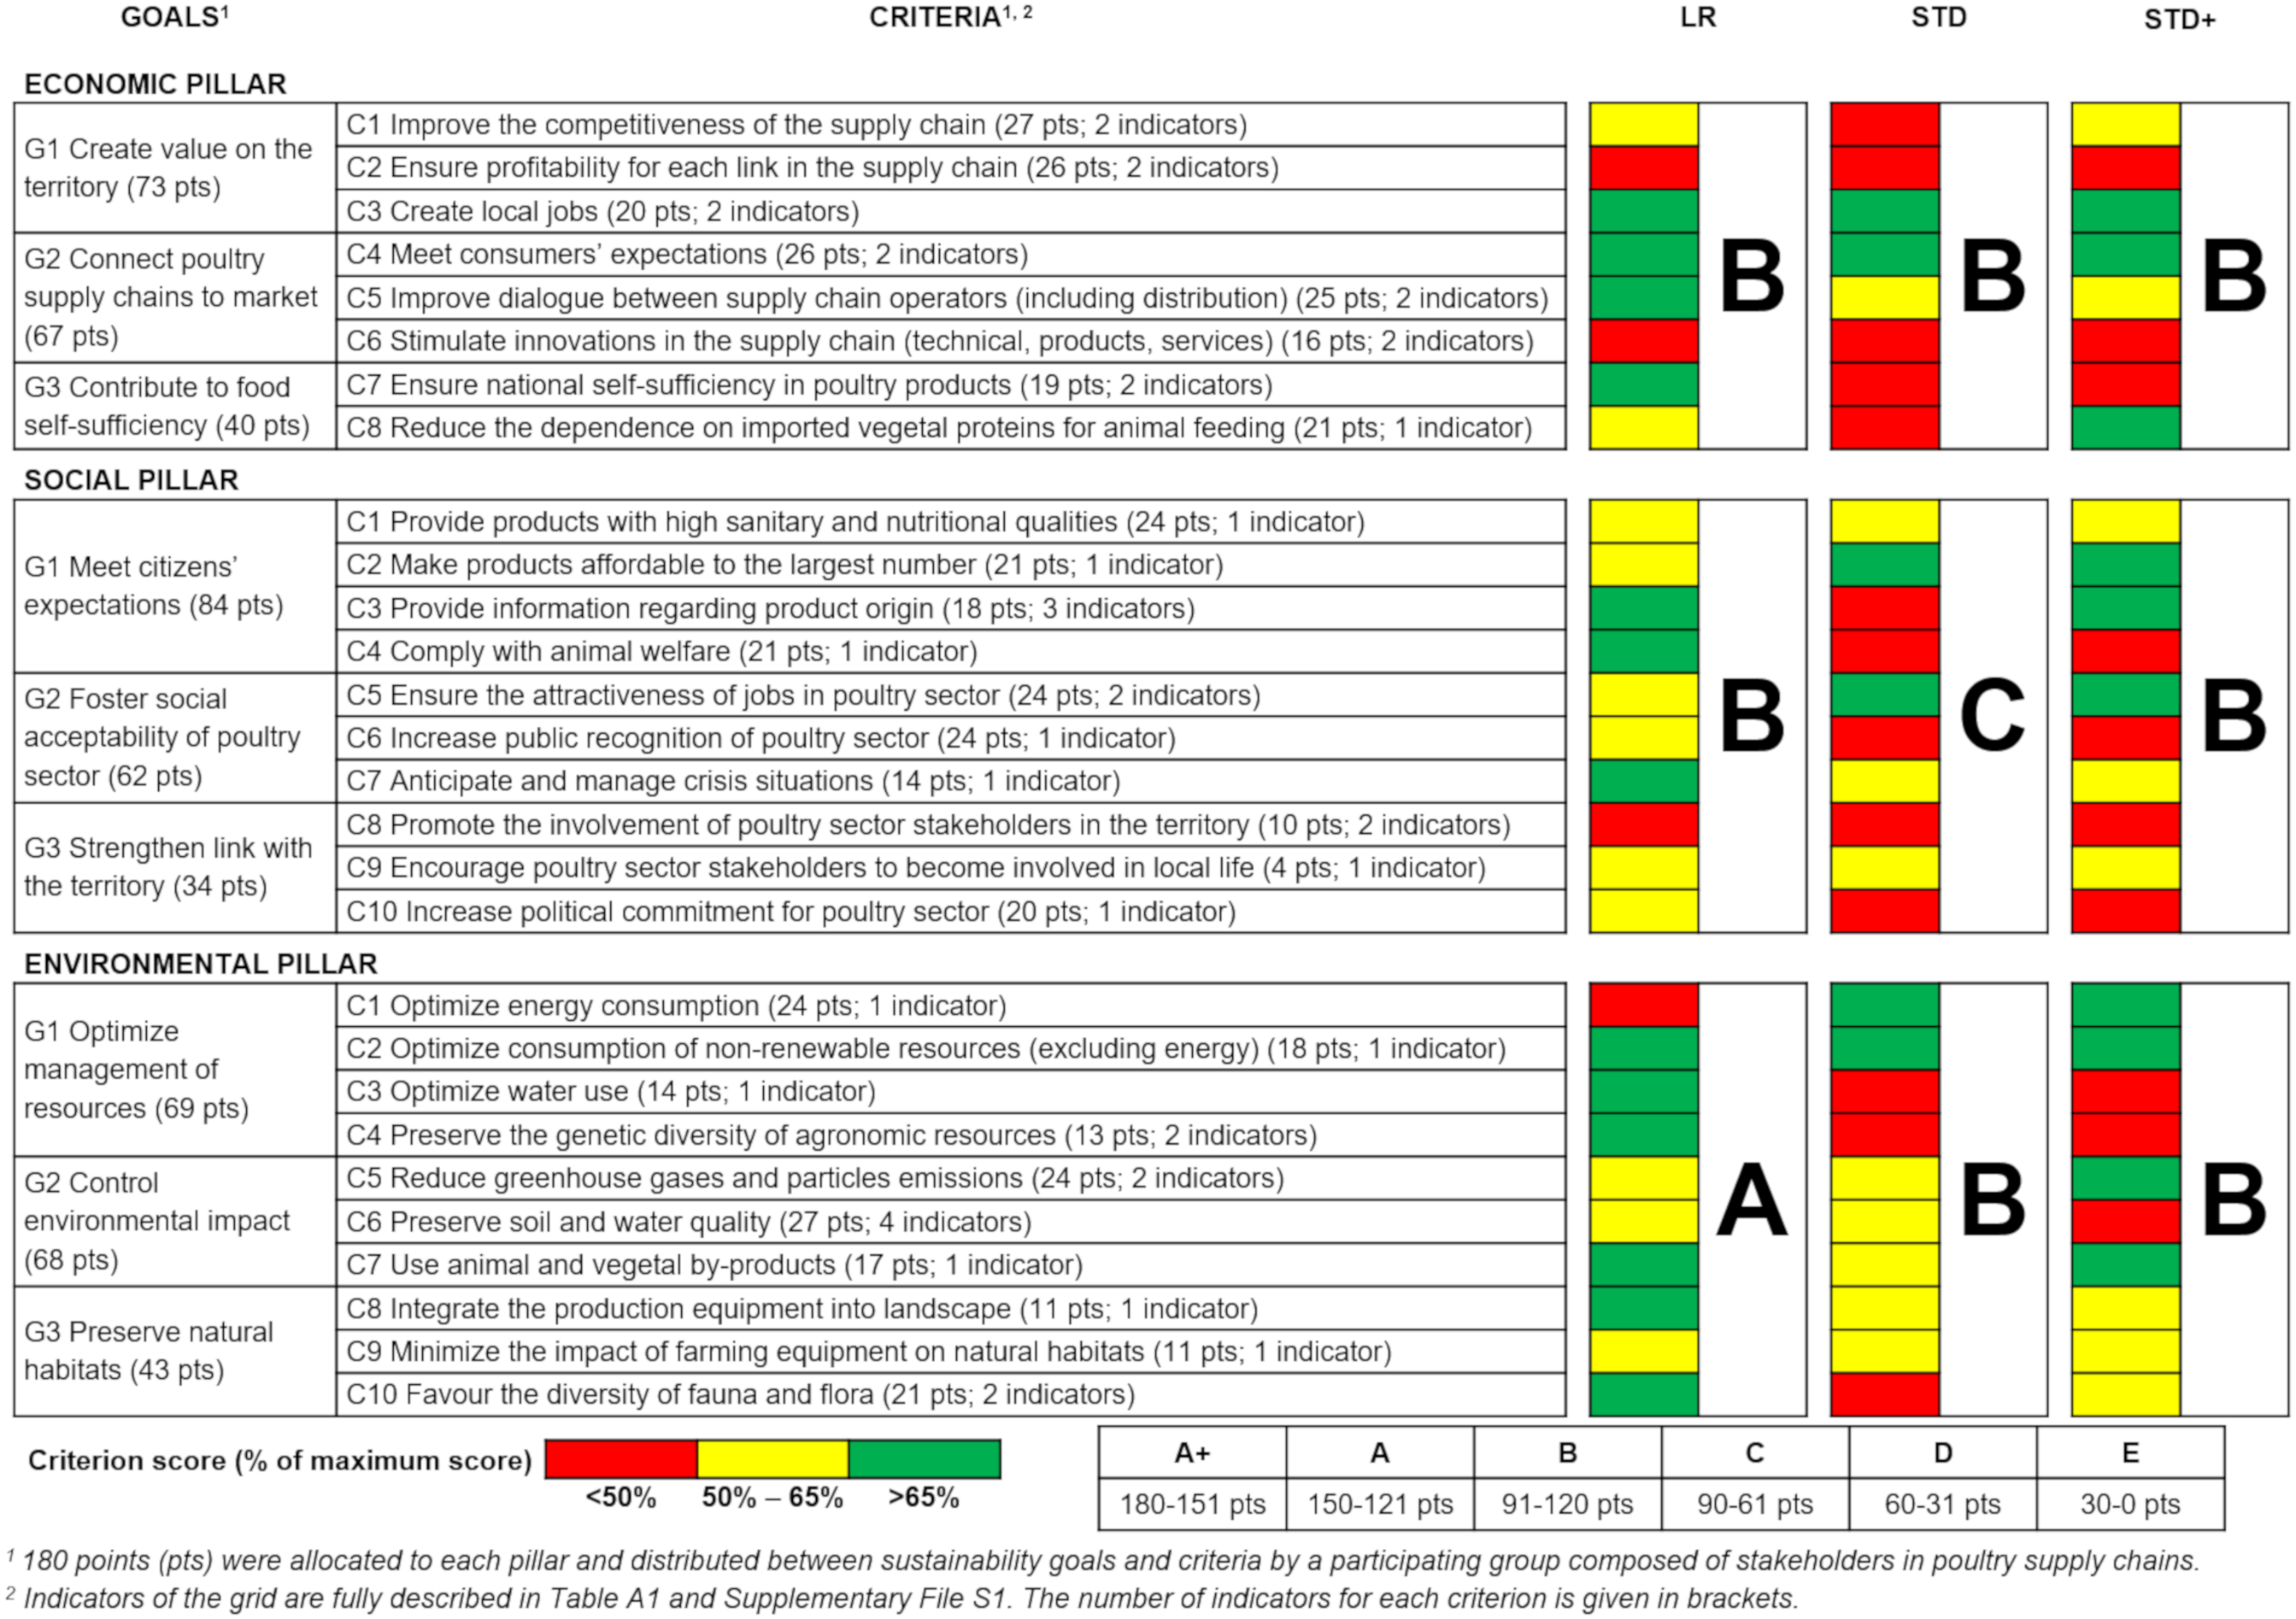
3.2. Sustainability of Label Rouge and Conventional Standard Chicken Supply Chains in the Pays-de-la-Loire Region

Results on the pillar, goal, and criterion levels for the assessments of Label Rouge (LR) and the conventional standard (STD) SC are given in Figure 3. Results on the indicator level are given in Figure A1. Both LR and the STD SC obtained rather good sustainability scores on the economic and environmental pillars, even though the maximum sustainability grade (A+ for >151 points) was not reached (LR: B and A, respectively; STD: B for both pillars). However, LR performed better on the social pillar with a B grade, whereas the STD SC was only graded C. Progresses in both SCs can, therefore, be made, and solutions were searched to improve these results. To that purpose, the analysis of the results at criteria level (Figure 3) helps to improve the understanding of the pillar results, and identify where the improvement margins might be.
The economic performance levels of LR and STD SC were contrasted as shown with the score for the pillar (111 and 91 points, respectively; Figure A1) and the number of “red criteria” (2 and 5; Figure 3). Both SCs produced chickens met consumers’ expectations in terms of price and organoleptic quality (ECO.C4), but profitability for SC operators was poor (ECO.C2) and there were few innovations in the SC (ECO.C6). Both SCs created many local jobs in the Pays-de-la-Loire region (ECO.C3). A lack of competitiveness was identified in the STD SC (ECO.C1), associated with high dependence on imported vegetal proteins (soybean meal) for animal feeding (ECO.C8), mainly because of the high protein requirements of fast-growing chickens. This lack of competitiveness also explains the low score for the ECO.C7 criterion (“Ensure national self-sufficiency in poultry products”), as the STD SC is facing strong European and world competition, whereas LR chickens are a specific French product, mostly sold on the French market [22]. Unexpectedly, both SCs were found to make very few investments in research and development and the development of innovative tools and services (ECO.C6; Figure A1).
The differences in levels of social performance between the LR and the STD SC were marked, as shown in Figure 3. While only one criterion scored below 50% of the maximum score (i.e., “red criteria”) in the LR SC, half of them were below 50% in the STD SC (Figure 3). Both SCs produce products with high sanitary and nutritional qualities, in agreement with consumers’ expectations (SOC.C1), at affordable prices (SOC.C2). However, in both SCs, it appeared that poultry stakeholders are not sufficiently involved in local life (SOC.C8), and that creating news farms or enlarging existing ones is very difficult, even in the LR SC (SOC.10). This “weak” relationship with the territory was also stressed in the SOC.I12 (Figure A1), with no local supply of chicken meat to mass catering operators. Furthermore, the LR SC had several assets, such as better communication regarding the origin of products (SOC.C3). The main reason for this is that “Label Rouge” is an official quality sign, acknowledging the higher organoleptic quality of the product (in relation to the use of a slow-growing genetic strain, the outdoor access, and the feed specifications), as well as greater compliance with animal welfare (SOC.C4) due to the outdoor access for the animals.
Most of the environmental criteria scored above 50% of the maximum score in the LR and STD SC (9 and 7 over 10, respectively; Figure 3). Both SCs were characterized by good use of non-renewable resources such as phosphorus (ENV.C2) and by-products in chicken diets (ENV.C7), with moderate impact on soil, water, and landscape quality (ENV.C6, C8, and C9). However, some differences between the two SC emerged. Regarding the environmental performance at the product scale (using a life-cycle approach; see Supplementary File S1 for details), the STD SC appeared to be more efficient when considering energy consumption and greenhouse gas emission (ENV.C1 and C5, respectively), which is related to the lower feed conversion ratio of chickens produced in this SC. In contrast, this SC was found to consume more water (ENV.C3) than the LR SC. Genetic diversity in chickens used for selection is very low in the STD SC compared to the LR SC (ENV.C4). Efforts should be made to improve the diversity of natural fauna and flora (ENV.C10) both on production sites (e.g., farms) and in countries producing imported feedstuffs (soybean or palm oil). On the opposite, the agrological infrastructures associated to the outdoor runs represent a real asset for the LR SC compared to the SC one (Figure A1).

3.3. Conception and Assessment of an Innovative Scenario to Improve the Conventional Standard Chicken Supply Chain in the Pays-de-la-Loire Region

As reported by the PG during the construction of the assessment grid, and confirmed by the analysis of the case study assessment, the STD SC lacks competitiveness, especially compared to similar products produced in other European countries (e.g., Poland and Germany [22]). Moreover, this SC is strongly dependent on the importation of soybean meal used for chicken feeding. Based on these results, we designed innovations at farm level and combined them in an innovative system to optimize the STD production with low soybean use, called STD+. The main changes compared to the initial STD SC were (see Table A1 for more details) as follows:
  • Production of heavier birds (2.48kg at 43 days) with intermediate slaughter of part of the flock at 1.83 kg (35 days; 27% of the flock) to meet French market criteria. Here, the animal density was reduced to 22.2 birds/m² in order to remain below the regulatory threshold of 39 kg/m²:
  • Renovation of existing chicken houses and construction of one additional house to obtain a greater total surface area (3 × 1300 m²) in farms, with concrete floors, improved wall insulation, and heat recovery ventilation to reduce energy consumption (low-energy houses);
  • Changes in chicken diet characteristics for better expression of the genetic potential of birds, especially the improvement of breast meat yield (+1.5 g digestible lysine and −50 kcal metabolizable energy per kg of diet);
  • Decreased use of soybean meal in the diets fed to chickens (by about 70%), the remaining soybean meal being produced in France.
The results of the assessment of the STD+ system with the OVALI grid are presented in Figure 3 and Figure A1. At the pillar level (Figure 3), the scores of the three pillars were largely improved (+15 to +25%) but only the grade of the social pillar was changed from C to B. At the criteria level, the scores of 10 criteria were positively affected by the scenario hypotheses (and one negatively), but changes were observed in only seven of them when using the representation code (Figure 3; six positively affected, and one negatively). Among the positively affected criteria, four were “top-priority” criteria for improvement in the STD SC (i.e., “red criteria”, Figure 3). The ENV.C6 criterion was negatively affected, mostly because of the changes in the feedstuffs used in the chicken diets, leading to an increase in acidification and eutrophication by 10% (data not shown). The STD+ system increased the protein autonomy (ECO.C8) and the competitiveness of the SC (ECO.C1), in particular due to lower live weight and breast meat production costs (−2 and −10%, respectively; data not shown). At the same time, environmental criteria were improved, such as the reduction of greenhouse gas emission (ENV.C5; −27%, data not shown), the use of by-products (ENV.C7), and the preservation of biodiversity (ENV.C10). Finally, the social criterion SOC.C3 was markedly improved (providing information regarding product origin; Figure 3), in relation to the possible improved image of the production due to the non-use of imported soybean meal.

4. Discussion

4.1. A Co-Constructed and Shared Vision of Sustainability in Chicken Supply Chains

The aim of this study was to develop and test a method to help stakeholders tackling sustainability issues in chicken SC [2]. In order to capture the different perceptions and expectations of stakeholders along the SC, the OVALI grid was developed using a participatory approach. For poultry production, only the study of Pottiez et al. [32] used such an approach to select and weight sustainability goals, criteria, and indicators, while in other studies, stakeholders were either never consulted or only at some development steps (Table 1). As reported by previous authors, participatory approaches are particularly relevant to (i) share information and experience between stakeholders, helping them to know and understand each other better (in particular by sharing the same “language”), and thus, improve their own practices. This generally results in a shared and consensual vision regarding a specific aim or issue [18,19,20,21,43]. Therefore, at the end of the six PG meetings, the co-constructed grid can be considered as one collective vision of what goals/criteria should chicken SC meet to be sustainable. Beyond this consensual vision, there were obviously sustainability issues for which different stakeholder categories had radically different views. For instance, during the PG meeting dedicated to the weighting, the maximal score for the ENV.C10 criterion (“Favor the diversity of fauna and flora,” 21 points; Figure 3) was found to be not very important (9 points) by operators from private companies or researchers, or, conversely, very important (25 points) by stakeholders from professional organizations. Surprisingly, the weight of this criterion given by NGO stakeholders was found to be intermediate (15 points). Moreover, the three focus groups organized to “enlighten” the PG members also provided very interesting elements. For instance, in the two focus groups with consumers, it is worthy to mention that even if consumers tend to give importance to some sustainability issues (e.g., origin of products or animal welfare), the words “sustainability” or “sustainable development” were never pronounced by the participants, proving that these concepts can still be perceived as fuzzy or unclear [44].
While several studies previously approached sustainability of poultry production by only considering the poultry production unit level (i.e., the chicken house and the outdoor run, in free-range systems) [27,28,29,30,31], this study proposes the AVIBIO method [32], which was designed to assess the sustainability of a whole SC (Table 1). This is particularly relevant for chicken production since SC are highly structured, with numerous relationships between SC links, meaning that changes occurring for one SC link can have induced effects on other SC links [14,15,16]. For example, increasing the slaughter weight/age in chicken farms in the STD+ scenario had positive consequences in slaughterhouses as chickens will have a higher breast meat yield (Table A1). However, since the study scale is larger, this also implies filling in a larger set of indicators compared to farm-scale approaches (≥45 vs. 8–24; Table 1), thus assessing case studies or scenarios could be perceived as difficult and/or long. This approach should, therefore, be carried out in a collective effort by several SC operators, rather than by an isolated operator.
The study scale of the OVALI method also allows considering more sustainability issues, which are not relevant on the farm scale. Thus, compared to methods such as those of Bokkers and de Boer [29] or Castellini et al. [30], new issues have been included in the OVALI method. For instance, in the economic pillar, the issues of communication and innovations in the SC (ECO.C5 and ECO.C6, respectively; Figure 3) are taken into account in the OVALI method. Similarly, as chicken SC are associated to a territory, new issues dealing with the relationships between the SC and the territory have also been considered. They concern, for instance, the creation of jobs, the local political support of poultry farmers (i.e., for new installations or expansion requests), or the landscape integration of chicken houses (ECO.C3, SOC.C1, and ENV.C8, respectively; Figure 3).
Finally, as previously mentioned, the AVIBIO method [32] is the only other sustainability tool dealing with sustainability of poultry SC. When comparing the two methods, it can also be observed that sustainability issues differ. For instance, in the AVIBIO method [32], the concept of “naturality” [46] of the production is considered in a dedicated criterion (social pillar), whereas in the OVALI method, this concept is no longer explicitly present (i.e., mentioned in a goal or a criterion). On the opposite, the issue of innovation and investment in the SC is considered in the OVALI method (ECO.C6), but not in the AVIBIO one [32]. This illustrates that, even if the studied object is the same (i.e., a chicken SC), both final grids are the “subjective vision” of the people involved in the co-construction process (i.e., a limited number of French stakeholders). Thus, the goals and criteria (and their weighting) may have been different in other political, socio-economic, and environmental contexts or with different stakeholders in the PG [30,47]. This could also slow down the acceptance of the OVALI results by stakeholders who did not take part to the co-construction process.
In particular, this method was developed between 2012 and 2014. The grid, therefore, reflects the concerns of stakeholders at this precise time. For example, in the social pillar, the PG only distributed 21 points (over 180) for animal welfare criteria (C4; Figure 3), which can be explained by two factors. Firstly, animal welfare NGOs were not involved in the PG during the co-construction of the grid (even though those organizations were consulted in the “SC-society” focus group). Secondly, at the time of the OVALI project, animal welfare was already a concern, but not as important as it is today. Since the end of the OVALI project, many efforts have been carried out both by SC operators to improve chicken welfare, such as the use of perches and natural light in chicken houses, the use of more robust genetic strains with lower growth rates, or improved stunning practices before slaughter [48,49,50]. At the same time, the pressure from NGOs for higher animal welfare has increased (e.g., the European Chicken Commitment approach [51]).
Therefore, it is very likely that if the members of the PG were asked today to select objectives/criteria and weight them, the objective and goals of the OVALI would remain the same, but with a different weighting (and probably a different indicator set). In particular, a higher weight (i.e., more points) would be given to the issue of animal welfare. Therefore, this raises the question of the validity over time of the OVALI approach (as for any other sustainability assessment method): sustainability issues should be reconsidered from time to time, to account for the evolution of socio-economic context, societal expectations, and controversies. However, in the future, the consultation of stakeholders to update the OVALI assessment grid is quite conceivable.
Furthermore, all stakeholders should, thus, be able to identify their own interests in the assessment grid, and should be encouraged to use the OVALI method as a diagnostic, action, and communication tool, especially by undertaking autonomous improvement processes [17]. Moreover, comparatively to the “priority levels” in Castellini et al. [30] and Rocchi et al. [31], it is very likely that the OVALI weighting system (i.e., points) allows a finer ranking of goals/criteria within a pillar, all the more so as the weighting was defined collectively by PG stakeholders (Table 1).
Finally, it can be assumed that the different concepts taken into account in the OVALI grid (i.e., goals and criteria) are generic enough to be considered as relevant for the sustainability assessment of poultry SC other than chicken ones (turkey, eggs, etc.). However, this would probably require some changes at the indicator level to propose indicators specific of the considered production and/or to adapt the conversion scales initially developed for chicken.

4.2. A method for Diagnosis, Innovation, and Continuous Progress in Supply Chains

The OVALI grid was developed to be generic in order to assess, with the same method, very different chicken SCs, such as the LR and STD SC presented in this study (Figure 1; Figure 3; Figure A1). However, it is important to note that this method was initially developed to identify strengths, weaknesses, and improvement margins of a given SC, rather than to compare/rank different SCs. Analysis of the sustainability scores obtained at pillar or criterion levels (Figure 3) should, therefore, indeed help users to identify the strengths and weaknesses of the SC studied. To that purpose, the best level of analysis is probably the criterion one (Figure 3) because pillar or goal levels might be too integrative while the indicator level is probably too complex, given the number of indicators in our method. Furthermore, representation of criterion scores using a visual representation code (Figure 3) should provide rapid visualization of “top-priority” criteria which have to be improved, especially red ones where scores are below the average (i.e., <50% of maximum score). This representation also allows the identification of negative consequences when evaluating innovations. Indeed, in the STD+ scenario (comparatively to STD scenario), the ENV.C6 criterion was impaired (Figure 3), due to the decrease of ENV.I8 and ENV. I9 (Figure A1). However, this negative effect was compensated by the improvement of other criteria (e.g., ENV.C7) so that the final grade of the pillar remained the same (i.e., compensation effects within a pillar; Figure 3).
The OVALI method does not directly provide the user with solutions and proposals for innovation, but it is a powerful framework to enable stakeholders to identify strengths, weaknesses, and improvement margins in their SC. Stakeholders can then propose appropriate strategies and innovative solutions to improve these points. In the case of the STD SC described above, the analysis of criteria (Figure 3) revealed a lack of competitiveness (compared to other countries) explained by many factors, such as older and smaller production units with lower technical performances at the farm level and with smaller slaughterhouses and more expensive workforce at the slaughterhouse level [22]. Moreover, the strong dependence of poultry SCs on the importation of soybean meal was also emphasized, in agreement with the literature [52].
Consequently, to improve those aspects, several changes in the current STD SC were proposed, leading to the STD+ system that was also evaluated using the OVALI grid (Figure 1; Figure 3). Other solutions to improve the sustainability of the STD SC were probably possible, for instance, to improve animal welfare (SOC.C4: 10 points over 21) with likely implications on the price of products and consumer’s willingness to pay [5,53]. In this new SC, many criteria in the three pillars were improved, suggesting that there is no systematic antagonism (i.e., trade-offs) between economic, social, and environmental performance. For instance, the removal of imported soybean meal in the STD+ (only 7% of French soy; Figure 1) had positive consequences on the three pillars (ECO.C8, SOC.C3, ENV.C5, and ENV.C10; Figure 3; Figure A1). Similarly, improving the insulation of chicken houses in the STD+ scenario is also relevant to improve simultaneously environmental and economic aspects, by reducing the energy required to heat chicken houses. Such a practice, therefore, leads to a decrease in the use of non-renewable fossil fuels and consequently, lower energy expenses for the farmer. However, even though increasing the slaughter weight of chickens can increase mortality rate and various welfare/health issues (e.g., lameness, pododermatitis, or thermal discomfort [5,54,55,56,57]), no change in the criterion focusing on animal welfare (SOC.C14) was observed. This may be explained by the fact that for the STD+ scenario, we were missing actual data from French operators to fill in the indicators associated to this criterion. Therefore, no (positive or negative) assumption was made regarding the effect of this farming practice. Since then, several methods to evaluate poultry welfare have been developed for poultry operators (e.g., Welfare Quality® [58], EBENE [59]).
This confirms that the criterion level can be considered as very relevant to assess innovations or scenarios, as it provides identification of both improved and impaired criteria, sufficiently synthesized for practical use by stakeholders. However, even though there is no possible compensation between pillars, compensation effects within the same pillar can still occur.
After the assessment step, the selection of relevant innovations (or scenarios) is a necessary step, in agreement with the stakeholders’ strategies. Yet, the STD+ system was only evaluated ex-ante in a research context by members of the OVALI core team, validated by the PG group, but not implemented by stakeholders through field application. This last step can only be carried out by stakeholders in their own SC, and decision-makers will certainly have to deal with trade-offs among the different sustainability issues [60,61,62,63]. For instance, improving animal welfare through radical changes in farming systems (such as switching from conventional to free-range or organic production) could be associated with a large increase in production costs for farmers. In that context, SC operators will be facing a trade-off between animal welfare and economic performance, and will be very likely to choose the best compromise between the two “extreme” options, such as farming systems based on birds with a slower growth rate, lower animal density and chicken houses with natural light and covered verandas (“winter gardens”) [64,65]. In that sense, the OVALI method can be seen as a trade-off analysis tool for chicken SC to increase dialogue and cooperation between stakeholders and improve decision-making processes i.e., bridging knowledge and diagnosis with action, as mentioned by Kanter et al. [63]. In the end, the final success of the OVALI method (such as other existing ones) could be measured though the changes in “field” practices or in the organization of chicken SC.
Furthermore, the use of the OVALI grid in a research context is also a relevant approach for a better assessment of the economic, social, and environmental consequences of promising innovations issued from research works (e.g., new feeding strategies). It should, thus, provide an overall view of the potential of these results once applied in an SC. It would also theoretically be possible to design a de novo SC that totally breaks away from existing ones [17]. In that context, modeling tools would probably be required to provide data for the indicators [66]. However, in either an SC or a research context, the use of the OVALI method is based on a large number of indicators (45; Figure A1), and thus, requires data from various sources that can sometimes be difficult to collect, especially from “private” stakeholders (e.g., confidential data) [24,38], especially compared to other existing methods (Table 1). The re-use of previous case studies and scenarios evaluated with the method should, therefore, be encouraged whenever possible to facilitate this difficult step.
Finally, sustainability can be seen as a “direction to follow” [13], meaning that continuous improvement based on a never-ending iterative process should be preferred to a single cycle of evaluation-innovation. In the case of a continuous improvement, the innovative system would then become the new reference system to be evaluated, before being further improved [67]. In that sense, to encourage stakeholders (especially private companies and farmers) to be proactive and to progress on that path, the PG has validated the proposition of the OVALI core-team to express sustainability goals and criteria as “action verbs” rather than “static verbs” or “nouns”. This first option naturally gave the OVALI grid a different orientation, the grid being descriptive of “what should be done/targeted” to improve sustainability in chicken SC, rather than “what is the state of the SC” or “what should be a sustainable SC”. Moreover, as mentioned by Rey-Valette et al. [68], the assessment step is crucial, as it represents an opportunity for the discussion and the design of a collective strategy. In other words, the created dynamic (i.e., discussion and action) as well as the chosen path are probably more important that the point of arrival [68].
Finally, it should be mentioned that this version of the grid should not be considered as “static” and that some goal/criteria should be reconsidered in the future (i.e., added/suppressed goals/criteria, maximum score changed, or changes in the conversion “indicator-score” scales), to account for the evolution of the socio-economic context.

5. Conclusions

The OVALI method described in this paper was co-constructed with chicken supply chain stakeholders and public representatives in a participatory approach. Through the sharing of different expertise and viewpoints, a consensual, shared assessment grid was developed. This grid is robust enough to assess various chicken supply chains in their territories. From the analysis of assessment results, strengths, weaknesses, and improvement margins can be identified. Because it considers any chicken supply chain with a holistic approach, innovative solutions can be proposed and combined in scenarios, before being assessed using the same grid. Thus, in this study, we assessed the sustainability of conventional standard and “traditional free-range” chicken productions, both located in France’s first producing area. Firstly, we showed that the LR supply chain performed well on the three sustainability pillars. Secondly, we showed that the STD supply chain lacked competitiveness and heavily relied on imported soybean meal. To improve those aspects, we then proposed improvement options (e.g., reduction of soybean meal use, renovation of chicken houses for energy saving purposes, improvement of nutritional strategy, etc.), with positive consequences on several sustainability criteria on the three sustainability pillars (e.g., economy: increased competitiveness; social: better acceptance of the product; environment: decrease in greenhouse gas emissions). This method could, therefore, help stakeholders in making their own diagnosis, finding their own solutions (i.e., improvement processes), relevant to their supply chains and their territories, with improved dialogue between stakeholders. Finally, this method could also help researchers to evaluate the consequences of research results on the three dimensions of sustainability on the SC scale.

Supplementary Materials

Full description of indicators and associated conversion scales are given in Supplementary File S1, available online at https://www.mdpi.com/2071-1050/13/3/1329/s1.

Author Contributions

Conceptualization, J.P., P.L., and I.B.; Data curation, B.M., L.D., and J.P.; Formal analysis, B.M., L.D., and J.P.; Funding acquisition, P.L., C.B., and I.B.; Investigation, B.M., L.D., J.P., P.L., C.B., P.M., and I.B.; Methodology, B.M., L.D., J.P., P.L., P.M., and I.B.; Project administration, C.B. and I.B.; Supervision, P.L., C.B., and I.B.; Validation, P.L., P.M., and I.B.; Visualization, B.M. and L.D.; Writing—original draft, B.M.; Writing—review and editing, L.D., J.P., P.L., C.B., P.M., and I.B. All authors have read and agreed to the published version of the manuscript.

Funding

This study was funded by the French Ministry of Agriculture, Agrifood and Forestry (CAS DAR grant; OVALI project 2012–2014) and was carried out in the framework of the UMT BIRD 2 program (Integrative Biology Research and Development).

Acknowledgments

The authors are very grateful to every stakeholder involved in the participating group and every expert who helped develop this method. We also wish to thank all the stakeholders from the private sector who provided confidential data and answered our surveys. Lastly, we are grateful to the English native speaker who helped to improve the English language of this manuscript.

Conflicts of Interest

The authors declare no conflict of interest.

Appendix A

Figure A1. OVALI grid for the assessment of sustainability of chicken supply chains. A total of 180 points (pts) were allocated and distributed for each pillar between sustainability goals, criteria, and indicators by a participating group composed of stakeholders in poultry supply chains. The final weighted grid reflects a consensual vision of sustainability in chicken supply chains. Three chicken supply chains in the Pays-de-la-Loire region were assessed using this grid: traditional free-range (labeled with the official “Label Rouge” quality sign; LR), conventional standard (STD), and optimized conventional standard with low soybean use (STD+). Blue: Goals, criteria, and indicators inspired by the AVIBIO method [32]. Green: Improvement of indicator score in STD+ scenario comparatively to the STD. Red: Impairment of indicator score in STD+ scenario comparatively to the STD.
Sustainability 13 01329 g0a1

Appendix B

Table A1. Main hypotheses of the three case studies evaluated with the OVALI assessment method: traditional free-range (labeled with the official “Label Rouge” quality sign; LR), conventional standard (STD), and optimized conventional standard with low soybean use (STD+).
LRSTDSTD+
TerritoryPays-de-la-Loire regionPays-de-la-Loire regionPays-de-la-Loire region
Breeding
Genetic strainJA 657Ross PM3Ross PM3
Hatching
Distance from hatchery to farm (km)45200200
Production capacity (chicks/week)500,0001,700,0001,700,000
Feed production
Soybean meal in feed (%)20257
Origin of soybean mealBrazilBrazilFrance
Distance from feed mill to farm (km)505050
Production capacity (t/year)160,000–340,000190,000190,000
Chicken farming
Number of chicken houses323
Surface per chicken house (m²)40013001300
Age of chicken house (year)888 (2 houses) + 1 new house 1
Chicken house characteristicsNatural ventilationDynamic ventilationDynamic ventilation with heat recovery 1
Dirt floorDirt floorConcrete floor 1
Classic insulationClassic insulationImproved insulation 1
Animal density (birds/m²)1123.422.2
Slaughter weight (kg)2.31.831.83 (27% of the flock)
2.48 (73% of the flock)
Slaughter age (days)883635 (27% of the flock)
43 (73% of the flock)
Mortality rate (%)1.804.19%4.19%
Average feed conversion ratio2.981.731.71
Breast meat yield (%)not applicable 218.318.7
Slaughtering
Productsready-to-cook chickenbreast meatbreast meat
Distance from farm to slaughterhouse (km)505050
Slaughtering capacity (birds/week)300,000 to 500,000225,000 to 600,000225,000 to 600,000
1 In this scenario, we considered that the two existing chicken houses were renovated (insulation, floor type, heat recovery) and that one additional house with improved environmental performance (low-energy house) was built. 2 LR chickens were considered to be sold as whole, ready-to-cook chickens.

References

  1. Organisation for Economic Co-operation and Development (OCDE); Food and Agrigulture Organisation (FAO). OECD-FAO Agricultural outlook 2020–2029; OECD: Paris, France; FAO: Rome, Italy, 2020; 330p. [CrossRef]
  2. Vaarst, M.; Steenfeldt, S.; Horsted, K. Sustainable development perspectives of poultry production. World’s Poult. Sci. J. 2015, 71, 609–620. [Google Scholar] [CrossRef] [Green Version]
  3. van Horne, P.L.M. Competitiveness of the EU Poultry Meat Sector, Base Year 2017: International Comparison of Production Costs; Wageningen Economic Research: Wageningen, The Netherlands, 2018; 40. [Google Scholar] [CrossRef]
  4. Steinfeld, H.; Gerber, P.; Wassenaar, T.; Castel, V.; Rosales, M.; Haan, C. Livestock’s Long Shadow: Environmental Issues and Options; FAO: Rome, Italy, 2006; 390p, Available online: http://www.fao.org/3/a0701e/a0701e.pdf (accessed on 21 December 2020).
  5. Bessei, W. Impact of animal welfare on worldwide poultry production. World’s Poult. Sci. J. 2018, 74, 211–224. [Google Scholar] [CrossRef]
  6. Petracci, M.; Cavani, C. Muscle Growth and Poultry Meat Quality Issues. Nutrients 2011, 4, 1–12. [Google Scholar] [CrossRef]
  7. Ligon, B.L. Avian Influenza Virus H5N1: A Review of Its History and Information Regarding Its Potential to Cause the Next Pandemic. Semin. Pediatr. Infect. Dis. 2005, 16, 326–335. [Google Scholar] [CrossRef]
  8. Rumpala, Y. “Sustainable consumption” as a new phase in a governmentalization of consumption. Theory Soc. 2011, 40, 669–699. [Google Scholar] [CrossRef]
  9. World Commission on Environment and Development (WCED). Our Common Future; Oxford University Press: Oxford, UK, 1987; 383p. Available online: https://sustainabledevelopment.un.org/content/documents/5987our-common-future.pdf (accessed on 21 December 2020).
  10. Vavra, M. Sustainability of animal production systems: An ecological perspective. J. Anim. Sci. 1996, 74, 1418–1423. [Google Scholar] [CrossRef] [PubMed]
  11. Mitchell, G.; May, A.; McDonald, A. PICABUE: A methodological framework for the development of indicators of sustainable development. Int. J. Sustain. Dev. World Ecol. 1995, 2, 104–123. [Google Scholar] [CrossRef]
  12. Becker, B. Sustainability Assessment: A Review of Values, Concepts, and Methodological Approaches—Issues in Agriculture 10; Consultative Group on International Agricultural Research: Washington, DC, USA, 1997; 63p, Available online: https://cgspace.cgiar.org/bitstream/handle/10947/5759/issues10.pdf?sequence=1&isAllowed=y. (accessed on 21 December 2020).
  13. Pope, J.; Annandale, D.; Morrison-Saunders, A. Conceptualising sustainability assessment. Environ. Impact Assess. Rev. 2004, 24, 595–616. [Google Scholar] [CrossRef] [Green Version]
  14. Bonaudo, T.; Coutinho, C.; Poccard-Chapuis, R.; Lescoat, P.; Lossouarn, J.; Tourrand, J.-F. Poultry industry and the sustainable development of territories: What links? What conditions? In Innovation and Sustainable Development in Agriculture and Food (ISDA) 2010, Montpellier, France. 2010, p. 11. Available online: https://hal.archives-ouvertes.fr/hal-00522800/document. (accessed on 21 December 2020).
  15. Lescoat, P.; Bonaudo, T.; Lossouarn, J.; Poccard-Chapuis, R.; Mior, L.C. Questioning poultry industry about sustainability and bonds to territories: A case study in France and Brazil. In Innovation and Sustainable Development in Agriculture and Food (ISDA) 2010, Montpellier, France. 2010, p. 12. Available online: https://hal.archives-ouvertes.fr/hal-00522035/document. (accessed on 21 December 2020).
  16. Lescoat, P.; Bonaudo, T.; Mior, L.C.; Bommel, P.; Lossouarn, J.; Poccard-Chapuis, R. How to link poultry industry and territory for a sustainable development? An interesting question to learn and practise transdisciplinarity. In Proceedings of the 9th European International Farming System Association Symposium (IFSA), Vienna, Austria, 4–7 July 2010; pp. 492–499. Available online: https://hal.archives-ouvertes.fr/hal-01198001/document. (accessed on 21 December 2020).
  17. Meynard, J.-M.; Dedieu, B.; Bos, A.P. Re-design and co-design of farming systems. An overview of methods and practices. In Farming Systems Research Into the 21st Century: The New Dynamic; Darnhofer, I., Gibbon, D., Dedieu, B., Eds.; Springer Netherlands: Dordrecht, The Netherlands, 2012; pp. 405–429. Available online: https://link.springer.com/content/pdf/10.1007%2F978-94-007-4503-2.pdf. (accessed on 21 December 2020).
  18. Marjolein, B.V.A.; Rijkens-Klomp, N. A look in the mirror: Reflection on participation in Integrated Assessment from a methodological perspective. Glob. Environ. Chang. 2002, 12, 167–184. [Google Scholar] [CrossRef]
  19. Blackstock, K.; Kelly, G.; Horsey, B. Developing and applying a framework to evaluate participatory research for sustainability. Ecol. Econ. 2007, 60, 726–742. [Google Scholar] [CrossRef]
  20. Reed, M.S. Stakeholder participation for environmental management: A literature review. Biol. Conserv. 2008, 141, 2417–2431. [Google Scholar] [CrossRef]
  21. Etienne, M. Companion Modelling: A Participatory Approach to Support Sustainable Development; Springer Netherlands: Dordrecht, The Netherlands, 2014. [Google Scholar] [CrossRef]
  22. Chatellier, V.; Magdelaine, P.; Trégaro, Y. La compétitivité de la filière volaille de chair française: Entre doutes et espoirs. INRAE Prod. Anim. 2015, 28, 411–428. [Google Scholar] [CrossRef]
  23. Van Calker, K.; Berentsen, P.; Romero, C.; Giesen, G.; Huirne, R. Development and application of a multi-attribute sustainability function for Dutch dairy farming systems. Ecol. Econ. 2006, 57, 640–658. [Google Scholar] [CrossRef]
  24. Ripoll-Bosch, R.; Díez-Unquera, B.; Ruiz, R.; Villalba, D.; Molina, E.; Joy, M.; Olaizola, A.; Bernués, A. An integrated sustainability assessment of mediterranean sheep farms with different degrees of intensification. Agric. Syst. 2012, 105, 46–56. [Google Scholar] [CrossRef]
  25. Bonneau, M.; Klauke, T.N.; Gonzàlez, J.; Rydhmer, L.; Ilari-Antoine, E.; Dourmad, J.-Y.; De Greef, K.; Houwers, H.W.J.; Cinar, M.U.; Fàbrega, E.; et al. Evaluation of the sustainability of contrasted pig farming systems: Integrated evaluation. Animal 2014, 8, 2058–2068. [Google Scholar] [CrossRef]
  26. Paraskevopoulou, C.; Theodoridis, A.; Johnson, M.; Ragkos, A.; Arguile, L.; Smith, L.G.; Vlachos, D.; Arsenos, G. Sustainability Assessment of Goat and Sheep Farms: A Comparison between European Countries. Sustainability 2020, 12, 3099. [Google Scholar] [CrossRef] [Green Version]
  27. De Boer, I.J.M.; Cornelissen, A.M.G. A Method Using Sustainability Indicators to Compare Conventional and Animal-Friendly Egg Production Systems. Poult. Sci. 2002, 81, 173–181. [Google Scholar] [CrossRef]
  28. Mollenhorst, H.; Berentsen, P.B.; De Boer, I.J.M. On-farm quantification of sustainability indicators: An application to egg production systems. Br. Poult. Sci. 2006, 47, 405–417. [Google Scholar] [CrossRef]
  29. Bokkers, E.A.M.; De Boer, I.J.M. Economic, ecological, and social performance of conventional and organic broiler production in the Netherlands. Br. Poult. Sci. 2009, 50, 546–557. [Google Scholar] [CrossRef] [Green Version]
  30. Castellini, C.; Boggia, A.; Cortina, C.; Bosco, A.D.; Paolotti, L.; Novelli, E.; Mugnai, C. A multicriteria approach for measuring the sustainability of different poultry production systems. J. Clean. Prod. 2012, 37, 192–201. [Google Scholar] [CrossRef]
  31. Rocchi, L.; Paolotti, L.; Rosati, A.; Boggia, A.; Castellini, C. Assessing the sustainability of different poultry production systems: A multicriteria approach. J. Clean. Prod. 2019, 211, 103–114. [Google Scholar] [CrossRef]
  32. Pottiez, E.; Lescoat, P.; Bouvarel, I. AVIBIO: A method to assess the sustainability of the organic poultry industry. In Proceedings of the 10th European International Farming System Association (IFSA) Symposium, Aarhus, Denmark, 1–4 July 2012; p. 7. Available online: http://ifsa.boku.ac.at/cms/fileadmin/Proceeding2012/IFSA2012_WS6.1_Pottiez.pdf (accessed on 21 December 2020).
  33. European Parliamentary Research Service (EPRS). The EU Poultry Meat and Egg Sector: Main Features, Challenges and Prospects; European Parliament: Brussels, Belgium, 2019; 20p. [CrossRef]
  34. Institut Technique de l’Aviculture. Guide Méthodologique AVIBIO: Evaluation de la Durabilité des Filières Avicoles Biologiques Françaises; ITAVI: Paris, France, 2011; 750p, Available online: https://www.itavi.asso.fr/download/9387. (accessed on 14 January 2021).
  35. Botreau, R.; Farruggia, A.; Martin, B.; Pomiès, D.; Dumont, B. Towards an agroecological assessment of dairy systems: Proposal for a set of criteria suited to mountain farming. Animal 2014, 8, 1349–1360. [Google Scholar] [CrossRef] [PubMed] [Green Version]
  36. Fraser, E.D.; Dougill, A.J.; Mabee, W.E.; Reed, M.; McAlpine, P. Bottom up and top down: Analysis of participatory processes for sustainability indicator identification as a pathway to community empowerment and sustainable environmental management. J. Environ. Manag. 2006, 78, 114–127. [Google Scholar] [CrossRef] [PubMed]
  37. Lairez, J.; Feschet, P.; Aubin, J.; Bockstaller, C.; Bouvarel, I. Agriculture et Développement Durable. Guide Pour l‘éValuation Multicritère; Quae: Versailles, France, 2015; 232p, Available online: https://www.quae.com/produit/1345/9782759224418/agriculture-et-developpement-durable (accessed on 21 December 2020).
  38. Protino, J.; Jacquinot, M.; Bouvarel, I.; Berri, C.; Magdelaine, P. Place du Développement Durable en Aviculture Dans les Attentes des Consommateurs. In 10èmes Journées de la Recherche Avicole et Palmipèdes à Foie Gras, La Rochelle, France. 2013, pp. 40–45. Available online: https://www.itavi.asso.fr/download/10427 (accessed on 14 January 2021).
  39. Van Asselt, E.; Van Bussel, L.G.J.; Van Der Voet, H.; Van Der Heijden, G.; Tromp, S.; Rijgersberg, H.; Van Evert, F.K.; Van Wagenberg, C.; Van Der Fels-Klerx, H. A protocol for evaluating the sustainability of agri-food production systems—A case study on potato production in peri-urban agriculture in The Netherlands. Ecol. Indic. 2014, 43, 315–321. [Google Scholar] [CrossRef]
  40. Dantsis, T.; Douma, C.; Giourga, C.; Loumou, A.; Polychronaki, E.A. A methodological approach to assess and compare the sustainability level of agricultural plant production systems. Ecol. Indic. 2010, 10, 256–263. [Google Scholar] [CrossRef]
  41. Bélanger, V.; Vanasse, A.; Parent, D.; Allard, G.; Pellerin, D. Development of agri-environmental indicators to assess dairy farm sustainability in Quebec, Eastern Canada. Ecol. Indic. 2012, 23, 421–430. [Google Scholar] [CrossRef]
  42. Gómez-Limón, J.A.; Sanchez-Fernandez, G. Empirical evaluation of agricultural sustainability using composite indicators. Ecol. Econ. 2010, 69, 1062–1075. [Google Scholar] [CrossRef]
  43. Welp, M.; De La Vega-Leinert, A.; Stoll-Kleemann, S.; Jaeger, C.C. Science-based stakeholder dialogues: Theories and tools. Glob. Environ. Chang. 2006, 16, 170–181. [Google Scholar] [CrossRef]
  44. Mathé, T. Comment les consommateurs définissent-ils l’alimentation durable? Cahier de recherche CREDOC 2009, 270, 68. Available online: https://www.credoc.fr/download/pdf/Rech/C270.pdf. (accessed on 14 January 2021).
  45. Mollenhorst, H.; De Boer, I.J.M. Identifying Sustainability Issues Using Participatory SWOT Analysis. Outlook Agric. 2004, 33, 267–276. [Google Scholar] [CrossRef]
  46. Boogaard, B.K.; Oosting, S.J.; Bock, B.B.; Wiskerke, J.S.C. The sociocultural sustainability of livestock farming: An inquiry into social perceptions of dairy farming. Animal 2011, 5, 1458–1466. [Google Scholar] [CrossRef] [PubMed] [Green Version]
  47. Pretty, J.N. Participatory learning for sustainable agriculture. World Dev. 1995, 23, 1247–1263. [Google Scholar] [CrossRef]
  48. De Jong, I.C.; Gunnink, H. Effects of a commercial broiler enrichment programme with or without natural light on behaviour and other welfare indicators. Animal 2019, 13, 384–391. [Google Scholar] [CrossRef] [PubMed]
  49. Wilhelmsson, S.; Yngvesson, J.; Jönsson, L.; Gunnarsson, S.; Wallenbeck, A. Welfare Quality® assessment of a fast-growing and a slower-growing broiler hybrid, reared until 10 weeks and fed a low-protein, high-protein or mussel-meal diet. Livest. Sci. 2019, 219, 71–79. [Google Scholar] [CrossRef]
  50. EFSA Panel on Animal Health and Welfare (AHAW); More, S.; Bicout, D.; Bøtner, A.; Butterworth, A.; Calistri, P.; Depner, K.; Edwards, S.; Garin-Bastuji, B.; Good, M.; et al. Low atmospheric pressure system for stunning broiler chickens. EFSA J. 2017, 15, 4. [Google Scholar] [CrossRef] [Green Version]
  51. European Chicken Commitment. Available online: https://welfarecommitments.com/europeletter/ (accessed on 23 December 2020).
  52. De Visser, C.; Schreuder, R.; Stoddard, F. The EU’s dependency on soya bean import for the animal feed industry and potential for EU produced alternatives. OCL 2014, 21, D407. [Google Scholar] [CrossRef] [Green Version]
  53. Mulder, M.; Zomer, S. Dutch Consumers’ Willingness to Pay for Broiler Welfare. J. Appl. Anim. Welf. Sci. 2017, 20, 137–154. [Google Scholar] [CrossRef] [Green Version]
  54. Baéza, E.; Arnould, C.; Jlali, M.; Chartrin, P.; Gigaud, V.; Mercerand, F.; Durand, C.; Meteau, K.; Le Bihan-Duval, E.; Berri, C. Influence of increasing slaughter age of chickens on meat quality, welfare, and technical and economic results1. J. Anim. Sci. 2012, 90, 2003–2013. [Google Scholar] [CrossRef]
  55. Manning, L.; Chadd, S.; Baines, R. Key health and welfare indicators for broiler production. World’s Poult. Sci. J. 2007, 63, 46–62. [Google Scholar] [CrossRef]
  56. Knowles, T.G.; Kestin, S.C.; Haslam, S.M.; Brown, S.N.; Green, L.E.; Butterworth, A.; Pope, S.J.; Pfeiffer, D.; Nicol, C.J. Leg Disorders in Broiler Chickens: Prevalence, Risk Factors and Prevention. PLoS ONE 2008, 3, e1545. [Google Scholar] [CrossRef] [Green Version]
  57. Shepherd, E.; Fairchild, B. Footpad dermatitis in poultry. Poult. Sci. 2010, 89, 2043–2051. [Google Scholar] [CrossRef] [PubMed]
  58. Tuyttens, F.A.M.; Federici, J.F.; Vanderhasselt, R.F.; Goethals, K.; Duchateau, L.; Sans, E.C.O.; Molento, C.F.M. Assessment of welfare of Brazilian and Belgian broiler flocks using the Welfare Quality protocol. Poult. Sci. 2015, 94, 1758–1766. [Google Scholar] [CrossRef] [PubMed]
  59. Bignon, L.; Mika, A.; Mindus, C.; Litt, J.; Souchet, C.; Bonnaud, V.; Picchiottino, C.; Warin, L.; Dennery, G.; Brame, C.; et al. Une méthode pratique et partagée d’évaluation du bien-être en filières avicole et cunicole: EBENE. In 12èmes Journées de la Recherche Avicole et Palmipèdes à Foie Gras, Tours, France. 2017, pp. 1015–1019. Available online: https://www.itavi.asso.fr/download/10217 (accessed on 14 January 2021).
  60. Tälle, M.; Wiréhn, L.; Ellström, D.; Hjerpe, M.; Huge-Brodin, M.; Jensen, P.; Lindström, T.; Neset, T.-S.; Wennergren, U.; Metson, G.S. Synergies and Trade-Offs for Sustainable Food Production in Sweden: An Integrated Approach. Sustainability 2019, 11, 601. [Google Scholar] [CrossRef] [Green Version]
  61. Darnhofer, I.; Fairweather, J.; Moller, H. Assessing a farm’s sustainability: Insights from resilience thinking. Int. J. Agric. Sustain. 2010, 8, 186–198. [Google Scholar] [CrossRef]
  62. Salmon, G.; Teufel, N.; Baltenweck, I.; Van Wijk, M.; Claessens, L.; Marshall, K. Trade-offs in livestock development at farm level: Different actors with different objectives. Glob. Food Secur. 2018, 17, 103–112. [Google Scholar] [CrossRef]
  63. Kanter, D.R.; Musumba, M.; Wood, S.L.; Palm, C.; Antle, J.; Balvanera, P.; Dale, V.H.; Havlik, P.; Kline, K.L.; Scholes, R.; et al. Evaluating agricultural trade-offs in the age of sustainable development. Agric. Syst. 2018, 163, 73–88. [Google Scholar] [CrossRef]
  64. Gocsik, É.; Lansink, A.O.; Saatkamp, H. Mid-term financial impact of animal welfare improvements in Dutch broiler production. Poult. Sci. 2013, 92, 3314–3329. [Google Scholar] [CrossRef]
  65. Gocsik, É.; Brooshooft, S.D.; De Jong, I.C.; Saatkamp, H.W. Cost-efficiency of animal welfare in broiler production systems: A pilot study using the Welfare Quality® assessment protocol. Agric. Syst. 2016, 146, 55–69. [Google Scholar] [CrossRef]
  66. Martin, G.; Allain, S.; Bergez, J.-E.; Burger-Leenhardt, D.; Constantin, J.; Duru, M.; Hazard, L.; Lacombe, C.; Magda, D.; Magne, M.-A.; et al. How to Address the Sustainability Transition of Farming Systems? A Conceptual Framework to Organize Research. Sustainability 2018, 10, 2083. [Google Scholar] [CrossRef] [Green Version]
  67. López Ridaura, S. Multi-Scale Sustainability Evaluation. A framework for the derivation and quantification of indicators for natural resource management systems. Wageningen University, The Netherlands. 2005. Available online: https://edepot.wur.nl/121701 (accessed on 21 December 2020).
  68. Rey-Valette, H.; Clément, O.; Avelange, I. “ Retour réflexif sur l’évaluation du développement durable: L’expérience d’une école chercheurs”. Natures Sciences Sociétés 2009, 17, 176–184. [Google Scholar] [CrossRef] [Green Version]
Figure 1. Diagram representing the general organization of French chicken supply chains. Boxes represent the main activities leading to the production of chicken meat (blue: upstream of chicken farming; yellow: chicken farming; green: downstream of chicken farming). Arrows represent the matter flows (feed, animals, meat) in the supply chain.
Sustainability 13 01329 g001
Figure 2. Examples of indicator conversion into scores using continuous functions, class intervals, or modalities. Examples for (a) the live weight production cost of conventional standard chicken; (b) the reuse of slaughter by-products; (c) the use of responsible soybean in chicken feeds. Increasing the score of an indicator means improving it.
Sustainability 13 01329 g002
Figure 3. Final sustainability goals and criteria of the OVALI grid, and sustainability assessment at the criterion and pillar levels for three chicken supply chains in the Pays-de-la-Loire region: “traditional free-range” (labelled with the official “Label Rouge” quality sign; LR), conventional standard (STD), and optimized conventional standard with low soybean use (STD+).
Sustainability 13 01329 g003
Table 1. Comparison of different methods to assess the sustainability of poultry production.
de Boer and Cornelissen [27]Mollenhorst et al. [28]Bokkers and de Boer [29]Castellini et al. [30]Pottiez et al. [32]Rocchi et al. [31]This Study
ScaleProduction unit 1Production unit 1Production unit 1Production unit 1Supply chainProduction unit 1Supply chain
Participatory ApproachNoYes (sustainability issues selection) 2NoYes (only to rank indicators) 2YesYes (only to rank indicators) 3Yes
ProductEggsEggsChickenChickenEggs
Chicken
ChickenChicken
Production TypeNon-organic
Organic
Non-organic
Organic
Non-organic
Organic
Non-organic
Organic
OrganicNon-organic
Organic
Non-organic
Number of Indicators8151924471945
Weighting of IndicatorsNoNoNoYes (ranking with three priority levels)YesYes (ranking with three priority levels)Yes
Data Used to Perform the AssessmentLiterature
National datasets
Farm dataLiterature
National datasets
Farm data
Literature
Literature
National datasets
Surveys
Farm data LiteratureLiterature
National datasets
Surveys
1 Production unit: chicken house (+ outdoor run for free-range systems). 2 Selection by SWOT (Strengths, Weaknesses, Opportunities, and Threats) analysis by Mollenhorst et al. [45]. 3 Three categories of stakeholders: scientists, consumers, and producers.
Publisher’s Note: MDPI stays neutral with regard to jurisdictional claims in published maps and institutional affiliations.

