Abstract
Decisions in social sustainability assessment of mobility services often pose a multi-criteria decision-making issue, as trade-offs can occur between multiple alternatives and a participatory process should be used. Thus, the goal of this research is to support decision-making through determining weightings for different criteria and indicators for social sustainability assessment of mobility services. For the weighting process, the analytical hierarchy process (AHP) method was used. A participatory analysis was chosen to identify those weightings. In total, 48 experts in the field of sustainable urban mobility were questioned from three different groups: academic institutions, city authorities, and mobility service providers in order to analyze differences and similarities between these groups. While some indicators resulted in clear prioritization, other indicators revealed large differences between the expert groups. For the majority of indicators, the weighting results were similar for all three groups of experts. Consequently, the results provide clear guidance for decision-makers in the field of sustainable urban mobility.
1. Introduction
Mobility is a basic need of humans. This need for mobility in combination with urbanization causes far-reaching implications and problems. The transportation sector is among the top three polluters, with 14.3% of the world’s CO2 emissions [1]. However, rising traffic volumes not only significantly contribute to climate change. Among others, declining air quality, traffic congestion, traffic noise, stress, fatigue, and aggression leads to health impacts and generally reduces quality of life, especially in urban areas. Mobility services are often seen as an opportunity to reduce transport related impacts within cities by reducing private car ownership and offering the possibility to introduce alternatively fueled vehicles [2]. Mobility services are defined as transportation options that deliver users’ transport needs through an interface of a services provider which facilitates getting from A to B [3]. Some examples are car sharing, ride hailing, or ride pooling. Assessing sustainability impacts of mobility services is more complex than assessing impacts of private car ownership, especially with regard to social sustainability. Particularly the use phase plays an important role as mobility services are used in a different way than cars in private ownership.
To be able to capture all impacts of mobility services during the use phase in a holistic way, Gompf et al. [4] suggested, for the first time, a holistic set of indicators to be used for the assessment of mobility services. This set of indicators is clustered in five stakeholder groups, in line with the UNEP/SETAC Guidelines for the social life cycle assessment (S-LCA) [5]: Local Community, User, Worker, Value Chain Actors, and Society. The revised and updated version of the UNEP/SETAC Guidelines also include a sixth group: the stakeholder group, Children [6]. Due to the fact that children are not allowed to drive cars and are therefore only indirectly affected by mobility services such as car sharing, the stakeholder group children is not included in this study.
Within the mentioned stakeholder groups, trade-offs can occur, for example when improved air quality due to electric driving leads to a deterioration of working conditions due to a higher demand for conflict minerals that are needed for electric mobility. Trade-off can occur between stakeholder groups as well as among indicators for the same stakeholder group. Therefore, for decision-makers, a clear communication of results is difficult and poses a multi-criteria decision issue. To better support decision-makers, a transparent participatory process is needed with the involvement of experts to identify the preferable alternative in the case of trade-offs [7,8]. One approach is introducing weights to the criteria in order to come to an aggregated evaluation [9]. In order to implement an operationalized framework for the assessment of different mobility services, the identification of the optimal weighting of sustainability criteria would support the decision-making process.
The framework given for Life Cycle Assessment (LCA) [10] and the UNEP/SETAC Guidelines for S-LCA [5,6] leaves decision-makers with the challenge of appropriately integrating information into their decisions. According to the UNEP/SETAC Guidelines, a social and socioeconomic Life Cycle Assessment (S-LCA) is a social impact (and potential impact) assessment technique that aims to assess the social and socioeconomic aspects of products and their potential positive and negative impacts along their life cycle. S-LCA complements the LCA with social and socioeconomic aspects. It can either be applied on its own or in combination with LCA [5]. Principally, the results are a list of environmental and social impacts that may be understood as performance indicators of the product system under analyses. Given the fact that, especially for S-LCA, a huge variety of indicators exist, not only choosing the relevant indicators but also interpreting the results can be demanding. In the case of trade-offs between several alternative scenarios that fulfill the same function, interpreting the results becomes even more complicated [11]. Therefore, a remaining methodological challenge is the construction of a comprehensive judgment of social and environmental performance from the many indicators assessed in S-LCA and LCA. This challenge can be approached using multi-criteria decision-making (MCDM). Several authors suggested the MCDM methodology in the context of sustainability assessment and stated positive results [12,13,14,15]. Conceptually, MCDM is introduced in the LCA framework and standards as the ‘weighting’ step [11].
Many different MCDM methods exist to introduce and establish weights, such as the critic method [16], Simon’s procedure [17], the data envelopment analysis [9], and the conjoint analysis [8]. The most frequently used and well known method for weighting of different criteria is the analytical hierarchy process method (AHP) [18,19]. The AHP method was introduced by Tomas Saaty [20] and is widely employed in different multi-criteria decision-making areas, with manufacturing being the most frequently used application area, followed by logistics and government [19]. Within the field of sustainability assessment, the AHP method is the most frequently used weighting method [15] and was used in various studies in the last years to determine weighting of environmental and social aspects [21,22,23].
One of the main advantages of the AHP technique is that a complex problem is broken down into several simple problems. The conversion of a problem into a hierarchical structure is considered as the most important part of the analytical hierarchy process. In that way, AHP simplifies complex problems into partial elements, which are hierarchically related to each other. Following the hierarchy formation, the criteria are ranked via paired comparisons. The advantage of a paired comparison is that the decision-maker deals with the prioritization of only two options under comparison, irrespective of the other options. In addition, the AHP technique is well equipped for dealing with numerous criteria of various types, e.g., quantitative measurable data as well as qualitative subjective assessments [23,24,25,26]. Due to these advantages, the AHP method was also chosen for this research to determine weights.
Thus, the goal of this research is to support decision-making by transparently identifying an accepted set of weighting for different social indicators chosen with a participatory process through the use of the AHP method for the evaluation of mobility services. To do so, decision-makers from mobility service providers, city authorities, and research institutes were questioned as to how they evaluate trade-offs between the various social criteria suggested by Gompf et al. [4] to evaluate the impacts of mobility services.
2. Materials and Methods
2.1. Analytical Hierarchy Process Method (AHP)
AHP research is based on organizing the problem into a hierarchical structure, with the overall goal at the top level and the various criteria arranged in the subsequent level [27]. Figure 1 illustrates the hierarchy tree used for this study with the previously defined social indicators by Gompf et al. [4] for the assessment of mobility services.
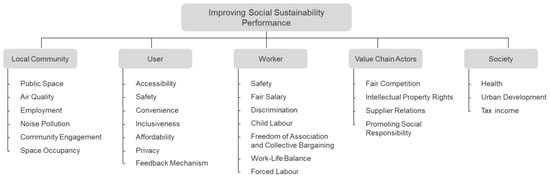
Figure 1.
Hierarchy tree including all social indicators to be weighted within each stakeholder group.
A ranking of all criteria is achieved by using a pairwise comparison system of the hierarchy elements. These pairwise comparisons are conducted to convert verbal judgements into numerical values on a scale from 1 to 9, where 1 means that two criteria are of equal importance and 9 means a very strong importance of one criterion over another. Mathematically, we have a set of criteria {x1, x2, …, xn} and we want to associate each criterion xi with a weight wi based on n × n comparisons gathered in a comparison matrix A. The principal eigenvector w is acquired by solving the system of equations:
where I is the unit matrix; λmax the largest or principal eigenvalue of A; and w the principal eigenvector (vector of priority factors) [28]. For more information, see Saaty [29,30], Winston [31], or Handfield et al. [32].
2.2. Design of the Study and Study Execution
The comparison of criteria was conducted by questioning experts in Germany in the field of sustainable urban mobility from three different groups: (1) mobility services providers, (2) city authorities, and (3) academic institutions. That way, different perspectives from experts of these three groups can be gathered and compared to expert judgements within one group as well as with expert judgements of the other two groups. In total, 48 experts completed the pairwise comparison, with 46% representing mobility service providers, 29% academic institutions, and 25% city authorities, which corresponds to a large enough sample to conduct hypothesis from, according to Saaty [27]. The data collection was done during a period of four months from April to July 2020.
For the experts to be able to evaluate each pair of criteria within the stakeholder groups in a systematic way, an online survey was setup. The online survey started with a short introduction to the study background and the goal of weighting different social indicators for the evaluation of mobility services. Then, the evaluation started with an example of how the pairwise comparison works. After the example, all social indicators of one stakeholder group were compared with each other. For a better understanding of the different indicators, a short explanation was given for every indicator. This was done for all five stakeholder groups. The question for every pair of indicators was always the same: With respect to improving sustainability performance of mobility services, which of the two criteria on each row is more important and how much more important is it? In Figure 2, an extract of the questionnaire can be seen for the stakeholder group, Local Community.
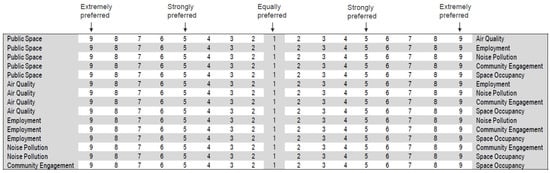
Figure 2.
Extract of the questionnaire for the stakeholder group, Local Community.
In presenting the pairwise comparisons, there are three possible groups of answers [27,28]:
- The two indicators are equally important for the evaluation of mobility services, meaning the ratio between the two criteria is 1:1 or the estimation is 1, situated in the middle of the assessment scale, see Figure 2.
- The indicator on the left-hand side is more important for the evaluation of mobility services. This means that the ratio of the left criterion against the right criterion is from 2:1 to 9:1 or the estimation is form 2 to 9 on the left side of the scale.
- The indicator on the right-hand is more important for the evaluation of mobility services than the one on the left-hand side. The ratios are reciprocal to the ratios in 2.
In order to reduce individual estimation subjectivity and potential personal bias, mean estimation values were used for the ratios and a consistency check was done. For the consistency check, Saaty [30] proposed the consistency index (CI) to verify the consistency of the comparison matrix. The CI of the derived weights can be calculated by: CI = (λmax − n)/n − 1. If CI is less than 0.1, the set of judgments can be regarded as reliable.
2.3. Evaluation and Presentation of Results
From the mean values, the overall pairwise comparison matrices were conducted for all three groups of experts and for every stakeholder group. An example of the pairwise comparison matrix, based on the answers of the first group of experts (mobility service providers) for the stakeholder group Local Community, can be seen in the following:
With the help of the AHP Calculation software by CGI, the system of Equation (1) was solved to get the vector of priority factors w:
Using these results, the indicators within each stakeholder group were ranked for all three groups of experts. That way, it can be evaluated which sustainability aspects are prioritized by which group and what are the similarities and differences.
3. Results
In Figure 3, an overview of the weighting results from all three groups of experts can be seen. All weighting results are presented on a scale from 0.0 to 0.7 for better comparability and the indicators are given a ranking according to their weights. The Consistency Index (CI) of each matrix can be seen at the top right of all weighting results in Figure 3. The weighting results of the three groups of experts show clear similarities for some indicators; however, there were significant differences for other indicators. Regarding the stakeholder group Local Community, the indicator air quality received the highest weighting from all three groups, thus was seen as the most important indicator with respect to improving sustainability performance of mobility services. City authorities and mobility service providers ranked public space second (0.18 and 0.25), whereas academic institutions ranked noise pollution second (0.21) and public space in fifth place (0.09). There was no consensus between the three groups for the indicator space occupancy, as mobility service providers ranked in third place (0.18), city authorities in fourth place (0.16), and academia in last place (0.05). Local employment and community engagement received low weighting by mobility service providers (0.08 and 0.07), the participants from city authorities ranked these two indicators considerably higher (0.11 and 0.15), and the respondents from academic institutions even higher (0.16 and 0.17).
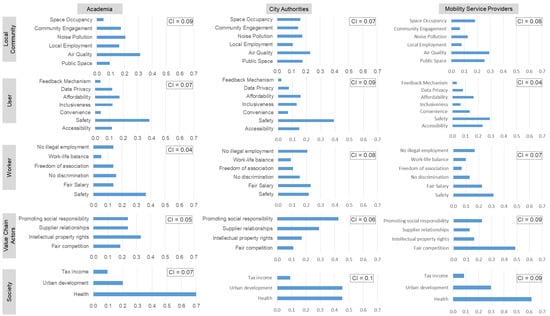
Figure 3.
Overview of weighting results for the three expert groups.
Similar to the stakeholder group Local Community, where air quality was ranked highest by all three groups, for the stakeholder group User the indicator representing safety was ranked highest by all three groups of experts. Especially academia and city authorities gave this indicator a very high ranking (both 0.39). These two groups ranked affordability second (0.17 and 0.16), whereas mobility service providers ranked accessibility second (0.23), which is on the third place for city authorities and even on the fifth place for academia. Data privacy, inclusiveness, and convenience received all medium to low weights, while the possibility to give feedback (feedback mechanism) clearly received the lowest prioritization by all three groups of experts.
Concerning the stakeholder group Worker, no indicator was consistently ranked high for all three groups, although the safety of workers received the highest ranking by academia (0.37) and mobility service providers (0.32) was ranked second by city authorities (0.22). Fair salary received also high ranking and was even regarded as the most important indicator by city authorities (0.23). While no illegal employment and no discrimination received medium weights, work-life balance, and freedom of association were ranked lowest by city authorities and mobility service providers. For academia, work-life balance clearly received the lowest prioritization.
For the stakeholder group Value Chain Actors, the weighting and prioritization for the various indicators differ greatly among the three groups. While academia ranked intellectual property rights highest (0.33), city authorities promoting social responsibility received the highest prioritization (0.43), whereas for mobility service providers fair competition was regarded as most important (0.49). In contrast, for city authorities and academia, fair competition received the lowest weighting (0.11 and 0.19). For mobility service providers, having good supplier relationships was regarded least important (0.13), whereas city authorities and academia ranked good supplier relationships second (0.29 and 0.24).
The stakeholder group Society, on the other hand, showed very similar ranking throughout all three groups of experts. Health was consistently given the highest weights (0.7, 0.45, and 0.62), while urban development was ranked second by academia and mobility service providers and received equal weighting as the health indicator by city authorities. Tax income, however, was clearly given the lowest prioritization by all three groups (0.1 and 0.09).
4. Discussion
4.1. Discussion and Implications
The results clearly show that there are some obvious similarities between the three expert groups, yet significant differences were also identified. For the stakeholder group Local Community, the indicator air quality consistently received the highest ranking. This result gives a clear guidance and suggests to prioritize efforts and alternatives that improve air quality. In addition, the fact that local employment received low weighting by city authorities and mobility service providers can be regarded as a tendency that should not be neglected, although academic institutions prioritized this aspect differently. For all of the other indicators within this stakeholder group, however, it is very difficult to conclude a statement that is valid for all three groups, which clearly shows the different prioritization of aspects for academic institutions, city authorities, and mobility service providers.
For the stakeholder group User, the safety of the user was ranked the highest by all three groups, which also clearly indicates that the focus of sustainability efforts within this stakeholder group should be on safety. Due to the fact that the possibility for users to give feedback was consistently ranked lowest, this aspect can be regarded as less important for all three groups compared to the other indicators. Except for the highest and lowest rank, it is again difficult to draw overall valid conclusions, as weighting results differs too much between groups.
The stakeholder group Worker showed a clear tendency towards high weighting of safety of the worker and fair salary, which suggests that in the case of having to choose between multiple alternatives, a focus on these two aspects is justified. Work-life balance and freedom of association, however, was given the lowest weighting by all three groups of experts. This of course does not mean that these two aspects are not important. The low weighting just gives additional information for decision-makers in case of multi-criteria decision-making. Overall, the ranking by city authorities and mobility service providers for the stakeholder group Worker is almost identical. The prioritization by academic institutions, however, differs greatly, which is why no overall consistent ranking can be concluded.
The most inconsistent ranking among the three groups can be found for the indicators of the stakeholder group Value Chain Actors. Especially city authorities and mobility service providers, which showed similar or almost identical rankings for the previous stakeholder groups, now show partly opposing weighting. This makes it impossible to conclude an overall valid weighting in this case. Contrarily, the indicators of the stakeholder group Society received almost identical weighting and prioritization. Here, the prioritization of society’s health is a very obvious result, as well as the low prioritization of tax income. This result, however, can be influenced by the fact that for this stakeholder group only three indicators needed to be weighted and therefore fewer prioritization options where possible which again leads to a higher chance of a consistent ranking of all three groups.
Overall, it should also be highlighted that each individual weighting within one group of experts differ from one another. Through the use of average weighting in the evaluation of indicators within one group, especially extreme weighting by single respondents, was mitigated and weakened. Nevertheless, general tendencies as outlined above can be regarded as valuable input in case of multi-criteria decision-making. Should decision-makers from academic institutions, city authorities, or mobility service providers aim to implement a weighting for the mentioned indicators, there are two options:
- Implementation of the set of weighting from one of the three groups, depending on which group decision-makers associate with.
- Implementation of the overall average weighting. This research suggests the first option, as clear differences among the three groups exist and that way a group specific weighting can be achieved.
4.2. Limitations and Further Research Needs
The main limitations of this research is the sample size, the geographical scope, and the focus on only three groups representing decision-makers in the field of sustainable urban mobility, namely academic institutions, city authorities, and mobility service providers. Further research could look at expanding the sample size and the geographical scope, as it would be interesting to see if decision-makers in the field of sustainable urban mobility in other countries outside Germany would come up with similar or different weighting. In addition, further research could be done on finding additional decision-makers in relevant fields to further expand the group of respondents. It would also be interesting to see whether decision-makers in similar geographic regions independent from the country would come up with similar weighting, for example decision-makers in high density urban areas like Manhattan or Hong Kong, compared to decision-makers in lower density urban areas like Copenhagen or Amsterdam. Having a large enough sample in different countries and different geographical regions would allow to draw respective conclusions and could lead to country specific or even city type specific weighting.
5. Conclusions
The goal of this paper was to support decision-makers in the field of sustainable urban mobility by determining weights for different indicators within the five stakeholder groups defined by the UNEP/SETAC Guidelines [5]: Local Community, User, Worker, Value Chain Actors, and Society. The selected indicators to be weighted were adopted from Gompf et al. [4], which conducted an intensive literature review and suggested for the first time a holistic set of indicators for the evaluation of mobility services. The method used to determine weights was the AHP method. For the weighting process, experts in the field of sustainable urban mobility were questioned. These experts were chosen from three different groups: academic institutions, city authorities, and mobility service providers in order to be able to analyze differences as well as similarities between these groups. In total, 48 experts completed the weighting process.
The results showed clear similarities for some indicators but also significant differences for other indicators. For example, all three groups of experts consistently ranked indicators regarding air quality highest within the stakeholder group Local Community. For the stakeholder group User, all three groups of experts ranked indicators regarding safety highest. The stakeholder group Worker showed a clear tendency towards high weighting of safety of the workers and fair salary. For the stakeholder group Society, health indicators were clearly prioritized. However, for the stakeholder group Value Chain Actors, no consistent ranking could be concluded, as results partly differ greatly between the three groups of experts.
This result can give guidance for decision-makers in the field of sustainable urban mobility, however it makes it difficult to suggest a weighting that represents the opinion of all three groups. Therefore, there are two options for weighting adoptions: (1) implementation of the set of weighting from one of the three groups or (2) implementation of the overall average weighting. As the research results makes it difficult to propose a weighting set that represents all three groups and average weighting would weaken group specific results, it is suggested that decision-makers in the field of sustainable urban mobility adopt the results from one of the three groups that they associate with. That way, transport related impacts can be reduced and quality of life in cities can be improved.
Author Contributions
K.G. is the first and main author of the article. The development of the research design and the research implementation, including expert interviews and AHP analysis, was carried out by her. M.T. and J.H. provided the overall research idea. All authors contributed to revising, proofreading and approving the final manuscript. All authors have read and agreed to the published version of the manuscript.
Funding
This research received no external funding.
Institutional Review Board Statement
Not applicable.
Informed Consent Statement
Not applicable.
Data Availability Statement
Data sharing not applicable.
Conflicts of Interest
The authors declare no conflict of interest.
References
- IPCC. Climate Change 2014: Mitigation of Climate Change. Contribution of Working Group III to the Fifth Assessment Report of the Intergovernmental Panel on Climate Change; Cambridge University Press: New York, NY, USA, 2014. [Google Scholar]
- Gould, E.; Wehrmeyer, W.; Leach, M.; Electric, S. Transition pathways of e-mobility services. Trans. Ecol. Environ. 2015, 194, 349–359. [Google Scholar] [CrossRef]
- Hietanen, S. Mobility as a Service—The new transport model? ITS & Transport Management Supplement. Eurotransport 2014, 12, 2–4. [Google Scholar]
- Gompf, K.; Traverso, M.; Hetterich, J. Towards social life cycle assessment of mobility services: Systematic literature review and the way forward. Int. J. Life Cycle Assess. 2020. [Google Scholar] [CrossRef]
- UNEP/SETAC Guidelines for Social Life Cycle Assessment of Products. Available online: http://wedocs.unep.org/handle/20.500.11822/7912 (accessed on 30 December 2019).
- UNEP Guidelines for Social Life Cycle Assessment of Products and Organizations. Available online: https://www.lifecycleinitiative.org/library/guidelines-for-social-life-cycle-assessment-of-products-and-organisations-2020/ (accessed on 18 January 2021).
- Bond, A.; Morrison-saunders, A.; Pope, J. Sustainability assessment: The state of the art. Sustainability 2012, 5517, 5517. [Google Scholar] [CrossRef]
- Tarne, P. Introducing weights to life cycle sustainability assessment—How do decision-makers weight sustainability dimensions? Int. J. Life Cycle Assess. 2018, 24, 530–542. [Google Scholar] [CrossRef]
- Yang, G.; Yang, J.; Xu, D.; Khoveyni, M. A three-stage hybrid approach for weight assignment in MADM $. Omega 2017, 71, 93–105. [Google Scholar] [CrossRef]
- ISO 14040. Environmental Management—Life Cycle Assessment—Principles and Framework; CEN: Brussels, Belgium, 2006. [Google Scholar]
- Zanghelini, G.M.; Cherubini, E.; Soares, S.R. How Multi-Criteria Decision Analysis (MCDA) is aiding Life Cycle Assessment (LCA) in results interpretation. J. Clean. Prod. 2018, 172, 609–622. [Google Scholar] [CrossRef]
- Jeswani, H.K.; Azapagic, A.; Schepelmann, P.; Ritthoff, M. Options for broadening and deepening the LCA approaches. J. Clean. Prod. 2010, 18, 120–127. [Google Scholar] [CrossRef]
- Cinelli, M.; Coles, S.R.; Kirwan, K. Analysis of the potentials of multi criteria decision analysis methods to conduct sustainability assessment. Ecol. Indic. 2014, 46, 138–148. [Google Scholar] [CrossRef]
- Laurin, L.; Amor, B.; Bachmann, T.M.; Bare, J. Life cycle assessment capacity roadmap (section 1): Decision-making support using LCA. Int. J. Life Cycle Assess. 2016, 21, 443–447. [Google Scholar] [CrossRef]
- Angelo, A.C.M.; Marujo, L.G. Life cycle sustainability assessment and decision-making under uncertainties. Life Cycle Sustain. Assess. Decis. 2020, 253–268. [Google Scholar] [CrossRef]
- Diakoulaki, D.; Mavrotas, G.; Papayannakis, L. Determining objective weights in multiple criteria problems: The critic method. Comput. Oper. Res. 1995, 22, 763–770. [Google Scholar] [CrossRef]
- Figueira, J.; Roy, B. Determining the weights of criteria in the ELECTRE type methods with a revised Simos’ procedure. Eur. J. Oper. Res. 2002, 139, 317–326. [Google Scholar] [CrossRef]
- Dos Santos, P.H.; Neves, S.M.; Sant’Anna, D.; De Oliveira, C.H.; De Carvalho, H.D.; Neves, S.M.; Ornaghi, D.; Anna, S. The analytical hierarchy process supporting decision making for sustainable development: An overview of applications. J. Clean. Prod. 2018. [Google Scholar] [CrossRef]
- Ho, W. The state-of-the-art integrations and applications of the analytic hierarchy process William Ho. Eur. J. Oper. Res. 2018, 267, 399–414. [Google Scholar] [CrossRef]
- Saaty, T.L. The Analytic Hierarchy Process; McGraw-Hill Book, Co.: New York, NY, USA, 1980. [Google Scholar]
- Shapira, A.; Shoshany, M.; Nir-Goldenberg, S. Combining Analytical Hierarchy Process and Agglomerative Hierarchical Clustering in Search of Expert Consensus in Green Corridors Development Management. Environ. Manag. 2013, 52, 123–135. [Google Scholar] [CrossRef]
- Portman, M.E.; Shabtay-Yanai, A.; Zanzuri, A. Incorporation of socioeconomic features’ ranking in multicriteria analysis based on ecosystem Services for Marine Protected Area Planning. PLoS ONE 2016, 11, e0154473. [Google Scholar] [CrossRef]
- Opher, T.; Friedler, E.; Shapira, A. Comparative life cycle sustainability assessment of urban water reuse at various centralization scales. Int. J. Life Cycle Assess. 2019, 24, 1319–1332. [Google Scholar] [CrossRef]
- Dekamin, M.; Barmaki, M.; Kanooni, A. Selecting the Best Environmental Friendly Oilseed Crop by Using Life Cycle Assessment, Water Footprint and Analytic Hierarchy Process Methods; Elsevier: Amsterdam, The Netherlands, 2018; Volume 198, ISBN 9821770843. [Google Scholar]
- Nikkhah, A.; Firouzi, S.; El Haj Assad, M.; Ghnimi, S. Application of analytic hierarchy process to develop a weighting scheme for life cycle assessment of agricultural production. Sci. Total Environ. 2019, 665, 538–545. [Google Scholar] [CrossRef]
- Ong, M.S.; Chang, M.Y.; Foong, M.J.; Chiew, J.J.; Teh, K.C.; Tan, J.; Lim, S.S.; Foo, D.C.Y. An integrated approach for sustainability assessment with hybrid AHP-LCA-PI techniques for chitosan-based TiO2 nanotubes production. Sustain. Prod. Consum. 2020, 21, 170–181. [Google Scholar] [CrossRef]
- Saaty, T.L. Decision making with the Analytic Hierarchy Process. Int. J. Serv. Sci. 2008, 1, 83–98. [Google Scholar] [CrossRef]
- Lipušček, I.; Bohanec, M.; Oblak, L.; Zadnik Stirn, L. A multi-criteria decision-making model for classifying wood products with respect to their impact on environment. Int. J. Life Cycle Assess. 2010, 15, 359–367. [Google Scholar] [CrossRef]
- Saaty, T.L. Fundamentals of Decision Making and Priority Theory with the Analytic Hierarchy Process; RWS Publications: Pittsburg, CA, USA, 1994. [Google Scholar]
- Saaty, T.L. Decision-making with the AHP: Why is the principal eigenvector necessary. Eur. J. Oper. Res. 2003, 145, 85–91. [Google Scholar] [CrossRef]
- Winston, W.L. Operations Research: Applications and Algorithms; Wadsworth Publishing Company: Belmont, CA, USA, 1994. [Google Scholar]
- Handfield, R.; Walton, S.V.; Sroufe, R.; Melnyk, S.A. Applying environmental criteria to supplier assessment: A study in the application of the Analytical Hierarchy Process. Eur. J. Oper. Res. 2002, 141, 70–87. [Google Scholar] [CrossRef]


Publisher’s Note: MDPI stays neutral with regard to jurisdictional claims in published maps and institutional affiliations. |
© 2021 by the authors. Licensee MDPI, Basel, Switzerland. This article is an open access article distributed under the terms and conditions of the Creative Commons Attribution (CC BY) license (http://creativecommons.org/licenses/by/4.0/).