Article

Green Agricultural Development Based on Information Communication Technology and the Panel Space Measurement Model

College of Economics and Management, Northeast Forestry University, Harbin 150040, China
*
Author to whom correspondence should be addressed.
Sustainability 2021, 13(3), 1147; https://doi.org/10.3390/su13031147
Submission received: 22 December 2020 / Revised: 14 January 2021 / Accepted: 19 January 2021 / Published: 22 January 2021
(This article belongs to the Special Issue Sustainability and Agricultural Economics)

Abstract

:
This study was conducted to promote the construction of China’s ecological civilization; to reduce harm to the environment; to quantify the performance of agricultural green development (GD); and to truly achieve green, sustainable, and healthy agricultural development. From the perspectives of resources and the environment, first, information communication technology and the panel space measurement (PSM) model were adopted to analyze relevant indicator data from 2000 to 2019 in China’s 30 provinces. Second, China’s agriculture was measured to explore the overall characteristics, temporal changes, and regional differences of agricultural development. A panel data measurement model was constructed using the generalized least squares method, and the main factors affecting performance development were analyzed, which were verified by giving examples. Third, the governance countermeasures and improvement directors were proposed for agricultural GD in China. It is found that the driving force of performance of agricultural GD in China mainly depends on technological progress and that technological efficiency determines the speed of agricultural development. The regional differences in performance of agricultural GD are obvious in China. The growth in the performance of agricultural GD in the eastern region is much higher than that of the central, western, and northeast regions. In addition, the results show that the performance of agricultural GD is extremely positively correlated with the agricultural economic level, fiscal support for agriculture policy, and the industrialization process and that it is extremely negatively correlated with the level of opening-up, adjustment of agricultural structure, and the environmental regulatory capability of the government. As a result, this study can provide some ideas for the realization of agriculture GD in China.

1. Introduction

Agriculture is a cornerstone for the development and survival of human society, and it is also a key pillar in ensuring development of the national economy and social progress [1]. Since China’s implementation of the reform and opening-up policy, China’s agriculture developed rapidly. For instance, grain output increased from 462.51 million tons in 2000 to 663.84 million tons in 2019, with a year-on-year increase of 30.33%; the total output value of agriculture, forestry, animal husbandry, and fishery increased from 256.78 billion Yuan in 2000 to 8670.54 billion Yuan in 2019, with a year-on-year increase of 97.04% [2]. China is proud to have only 7% of the world's arable land yet to feed 20% of the world's population. However, China's resource output continues to decline, its demand for food is increasing year by year, and its environmental problems (land degradation, soil erosion, and water pollution) are becoming increasingly serious. Therefore, the conflict between China’s economic development, and social resources and the environment is a scientific problem that must be solved urgently [3]. In order to ensure the stability of an economy and the gradual improvement in people’s living standards, the Chinese government has proposed a major strategic issue of green development and explored this issue deeply on the government level [4]. The Chinese government is committed to establishing concepts of innovation, coordination, green, openness, and sharing and to raising green development and high-quality development to a higher level. Agriculture, as the key to the construction of ecological civilizations, has become a key issue for sustainable agricultural development. It is necessary to emphasize the need to strengthen structural reform in agricultural supply and to improve the quality and efficiency of the agricultural supply system, so as to achieve effective supply of agricultural products with a reasonable structure and strong guarantee [5].
The key to advancing agricultural green development (GD) is to improve the quality and efficiency of the agricultural supply system, to persist in saving resources and protecting the environment, and to form a green way of development and life [6]. To realize agricultural GD, it is first necessary to evaluate its performance. The current agricultural development and environmental protection have more prominent contradictions. It is difficult to achieve economic growth by relying on traditional rough development methods. Therefore, China needs to develop in a green manner to increase agricultural output and to improve the quality and efficiency of agricultural development [7]. The question of how to improve the performance of agricultural GD is not only related to the coordinated development of agriculture and the adjustment of agricultural industrial structures but also related to the improvement of overall benefits and the sustainable development of agriculture [8]. Therefore, it is of great theoretical and practical significance to accurately measure and evaluate the performance of agricultural GD and to explore the regional differences and influencing factors of agricultural GD performance.
Based on an analysis of performance evaluation for the existing agricultural industry development, in this study, a performance rating model of agricultural GD was proposed in combination with information communication technology. Next, the problems of agricultural GD across the country and different regions were analyzed through measurements. Based on the above results, the panel space measurement (PSM) model was adopted to construct an analysis model of the influencing factors. The correlation analysis of different indicators reflects the key factors that affect the indicators for performance of agricultural GD, putting forward some reasonable governance methods and measures. Therefore, this study can provide a theoretical foundation and practical value for the evaluation of agricultural GD and for policy formulation of relevant government departments.

2. Literature Overview

2.1. Evaluation on Performance of Agricultural GD

The performance of an agricultural GD measurement system was studied using the Solow residual [9], the stochastic frontier analysis (SFA) [10], and the data envelopment analysis (DEA) [11]. However, the Solow residual, algebraic index, and SFA could only fit the production process of one output, so they often lead to overestimation in the performance of agricultural GD. The specific literature analysis results are shown in Table 1. Compared with other methods, the DEA does not need to set a specific production function form, thus avoiding defects in parameterization that may cause model setting errors and the normal distribution assumption of random interference items not being satisfied. Therefore, it has an incomparable advantage over other methods in measuring the agricultural GD involving resource and environmental factors and in evaluating China’s performance of agricultural GD [12].

2.2. Regional Differences in Performance of Agricultural GD

The research on regional differences of agricultural GD focuses on the performance of agricultural development from 1985 to 2005. The specific results and methods are shown in Table 2. The current research on regional differences of China’s performance of agricultural GD roughly includes two aspects: comparison of agricultural development performance in different regions and empirical study of the convergence of regional agricultural development performance. The former mainly adopts the traditional three-region division method, and it does not further reveal the degree and source of regional differences in the growth of agricultural development performance under resource and environmental constraints. The latter ignores the variable slack in the indicator measurement.

2.3. Influencing Factors on Performance of Agricultural GD

Table 3 shows the specific results and methods of the influencing factors on performance of agricultural GD. Among the various factors included in the previous literature, technological progress, labor capital, level of opening-up, education level of agricultural employees, percentage of irrigation area, proportion of wage income, the investment in agricultural infrastructure, the proportion of agricultural fiscal expenditures, and fiscal support policies show positive impacts on improvement in the performance of agricultural GD. However, there are still some limitations in such literatures. The chemical input is undertaken as a pollution variable, so the nutrients lost after excessive use constitute pollution are ignored, and there are too few pollution variables, so the objects are relatively single.

3. Research Methods

3.1. Information Communication Technology

Information communication technology is a data-processing method which is a data-oriented nonparametric method as well as one of the main tools for efficiency evaluation [27]. This study was conducted to analyze the performance of agricultural GD and to realize a comprehensive analysis and evaluation of related performance. It requires full consideration of the intermediate links of agricultural production and analysis on the impacts of different factors on agricultural GD as much as possible. Information communication technology has attracted the attention of many scholars. It can fully consider the connection between the continuity of agricultural production and intermediate links. As a result, it can be applied to construct an appropriate evaluation model to scientifically analyze the performance of agricultural GD in different regions. The traditional literature fails to include an analysis to measure the efficiency value, which seriously affects the evaluation of the performance of agricultural GD. Therefore, an unexpected output model under the global benchmark was constructed to make up for the above shortcomings in this study [28].

3.2. PSM Model

The PSM model is a regression analysis on spatial effects with different processing methods that can find the influences of various factors on explanatory variables. It is a network effect analysis method. When two factors are close together, it indicates that they have a strong correlation effect. In this study, descriptive statistical analysis and regional statistical analysis were adopted to describe the overall change, indicator accumulation changes, and the characteristics of different regions for the performance of agricultural GD. The feasible generalized least squares method was applied to construct a PSM model to empirically identify the influencing factors of China’s performance of agricultural GD and to then provide theoretical support for proposing feasible governance countermeasures [29].

3.3. Construction of Indicator System

According to the above methods, it is essential to determine the appropriate indicator system first. According to the relevant literature, the evaluation indicator system shown in Table 4 can be obtained for the performance of agricultural GD evaluation [30,31]. Among them, water resource is an important natural resource and critical economic source, and the allocation of water resources is related to the sustainable development of agriculture. Therefore, agricultural water consumption is considered to evaluate the input level of water resources. Labor input is a basic condition for agriculture and for the development of the national economy and society. Employees in agriculture, forestry, animal husbandry, and fishery are undertaken as evaluation indicators. Land is the basic support for agricultural development, and it is also the material condition necessary for human production activities. The index of total sown area of crops is used as a proxy variable of land elements. The total power of agricultural machinery refers to the sum of the rated power of all agricultural machinery power. In recent years, the amount of chemical fertilizers used in China increased year by year and the rational use of chemical fertilizers helped increase agricultural production and income. In the process of measuring the performance of agricultural GD in this study, the input indicators include agricultural water consumption, land, labor, and capital and the output indicators include expected output and unexpected output.

3.4. Construction of Performance Model

It is assumed that there are L indicators, using m types of factor inputs, s1 types of expected output (“good” output), and s1 types of unexpected output (“bad” output), which are expressed as X = (x1,…,xL) ∊ R + m*L, Yg = (y1g,…,yLg) ∊ R + s1*L, and Yb = (y1b,…,yLb) ∊ R + s2*L, respectively. On the basis of satisfying the environmental production technology assumptions (including closed output set, strongly disposable input variables and expected output, weakly disposable unexpected output, and zero combination), the environmental production possibility set EPPSp at each period p (p = 1, 2, …, P) can be expressed as follows:
E P P S p = ( x p , y p g , y p b ) x p j = 1 J λ j p x j p , y p g j = 1 J λ j p x j p g , y p b j = 1 J λ j p x j p b
with EPPSp being able to construct a production technology frontier using the global benchmark technology based on the sample data of all periods, as shown in Equation (2):
E P P S g l o b a l = ( E P P S 1 E P P S 2 , , E P P S p )
where EPPSglobal represents the set of production possibilities based on the global benchmark technology and EPPSp (p = 1, 2, …, P) is the set of production possibilities in different periods. Under global benchmark technology, the fractional planning of the model can be written as Equation (3):
ρ = min λ , s , s g , s b = 1 1 m i = 1 m S i x i o 1 + 1 s 1 + s 2 ( r = 1 s 1 s r g y r 0 g + k = 1 s 2 s k b y k 0 b )
s . t .   x 0 = j = 1 L p = 1 P λ j p y j p + s
s . t .   y 0 g = j = 1 L p = 1 P λ j p y j p g s g
s . t .   y 0 b = j = 1 L p = 1 P λ j p y j p b + s b
s . t .   y 0 b = j = 1 L p = 1 P λ j p y j p b s b
As the production frontier, the global benchmark technology applied in the model can ensure that each period and every indicator are in accordance with the same production technology frontier, so the efficiency measurement results are comparable across periods [32]. This is the advantage of this model. As a deterministic frontier production function method, the Malmquist index is a special index used to measure the agricultural development performance. Under the assumption of constant returns to scale, agricultural development performance is decomposed into technological efficiency change (EC) and technological change (TC). The proposed DEA–Malmquist index method can be decomposed as Equation (8) from period t to t + 1:
m i ( x t + 1 · y t + 1 , x t , y t ) = d i t ( x t + 1 , y t + 1 ) d i t ( x t , y t ) × d i t + 1 ( x t + 1 , y t + 1 ) d i t + 1 ( x t , y t ) 1 / 2
where the former term represents the EC, the latter term represents the TC, and di represents the input-oriented distance function. If the Malmquist index of the decision-making unit is greater than 1, the production level has increased; <1 indicates that the production level has decreased; and =1 indicates that the production level remains unchanged. Under the assumption of variable returns to scale (VRS), the EC can be further decomposed into pure EC (PEC) and scale EC (SEC), so Equation (8) can be further decomposed as Equation (9):
m i ( x t + 1 · y t + 1 , x t , y t ) = d i t ( x t , y t ) d i t ( x t + 1 , y t + 1 ) × d i t ( x t + 1 , y t + 1 / V R S ) d i t ( x t , y t / V R S )
The first term of Equation (9) represents SEC, the second term represents PEC, and the last term represents TC. Therefore, total factor productivity can be decomposed into SEC, PEC, and technological progress.

3.5. Data Acquisition Mode

The data for 2000–2019 comes from the China Water Resources Statistical Bulletin and the National Bureau of Statistics. Except for Gansu Province, the data of employees in the primary industry in the other provinces are all from the statistical yearbooks of those province. The data published in the statistical yearbooks of those provinces are year-end figures, and a few missing data are supplemented by interpolation. The data for total sown area of crops and the total power of agricultural machinery come from the website of the National Bureau of Statistics. Since the data is published at the end of each year, it is found through a data search that the added value of the primary industry published in the China Statistical Yearbook is slightly different from that published on the official website of the National Bureau of Statistics. With rapid development of the economy and society, water pollution in China’s agriculture has become increasingly prominent. Taking into account the sensitivity of this method to abnormal data and the special resource endowment conditions in Tibet, data for this study do not include data from Tibet.

4. Results

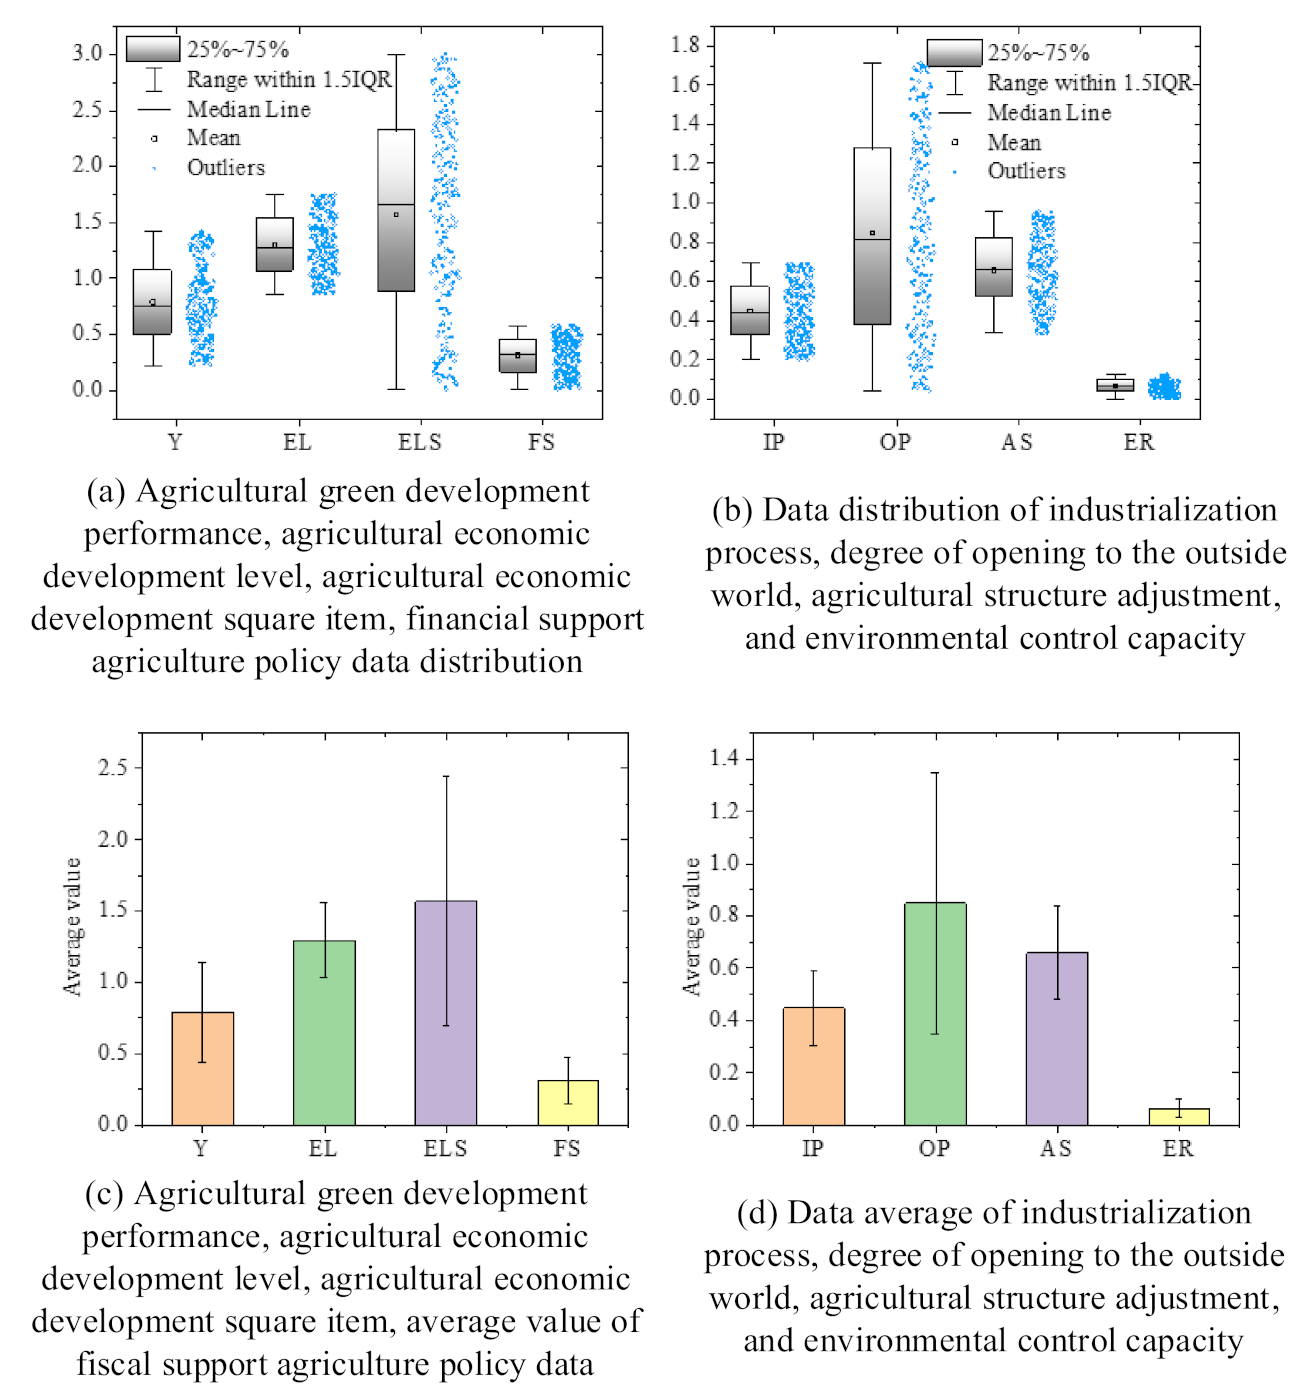
4.1. Descriptive Analysis of Variables

As shown in Figure 1, the national average value of agricultural water consumption is 28.148 billion cubic meters; the average number of employees in the primary industry is 18.3471 million; the average total sown area of agriculture is 7555.87 thousand hectares; the average total power of agricultural machinery is 68.685 million kilowatts; the Scalar amount of agricultural fertilizer application is 3.5955 million kilowatts; the average increase of the primary industry is 134.449 billion yuan; the average COD is 822.3 thousand tons; and the average TN and TP are 405.0 and 644.00 thousand tons, respectively. The above results reveal that the proposed model can effectively integrate the data and can obtain actual results.

4.2. Analysis on Overall Characteristics in China

As shown in Figure 2, the overall performance of agricultural GD in China has shown a steady increase trend, with relatively large fluctuations in 2005 and 2006. This is mainly because the state proposed an agricultural GD plan in 2005, which was strictly implemented in 2006, which caused its sharp decline together with severe pollution and natural disasters. However, there was a short peak in 2017. In the past few years, smart agriculture and ecological agriculture technologies have continued to develop, increasing the indicators on agricultural GD greatly. It suggests that the improvement in China’s performance of agricultural GD is mainly driven by technology and that the development of agricultural technology can effectively promote development of the agricultural industry.

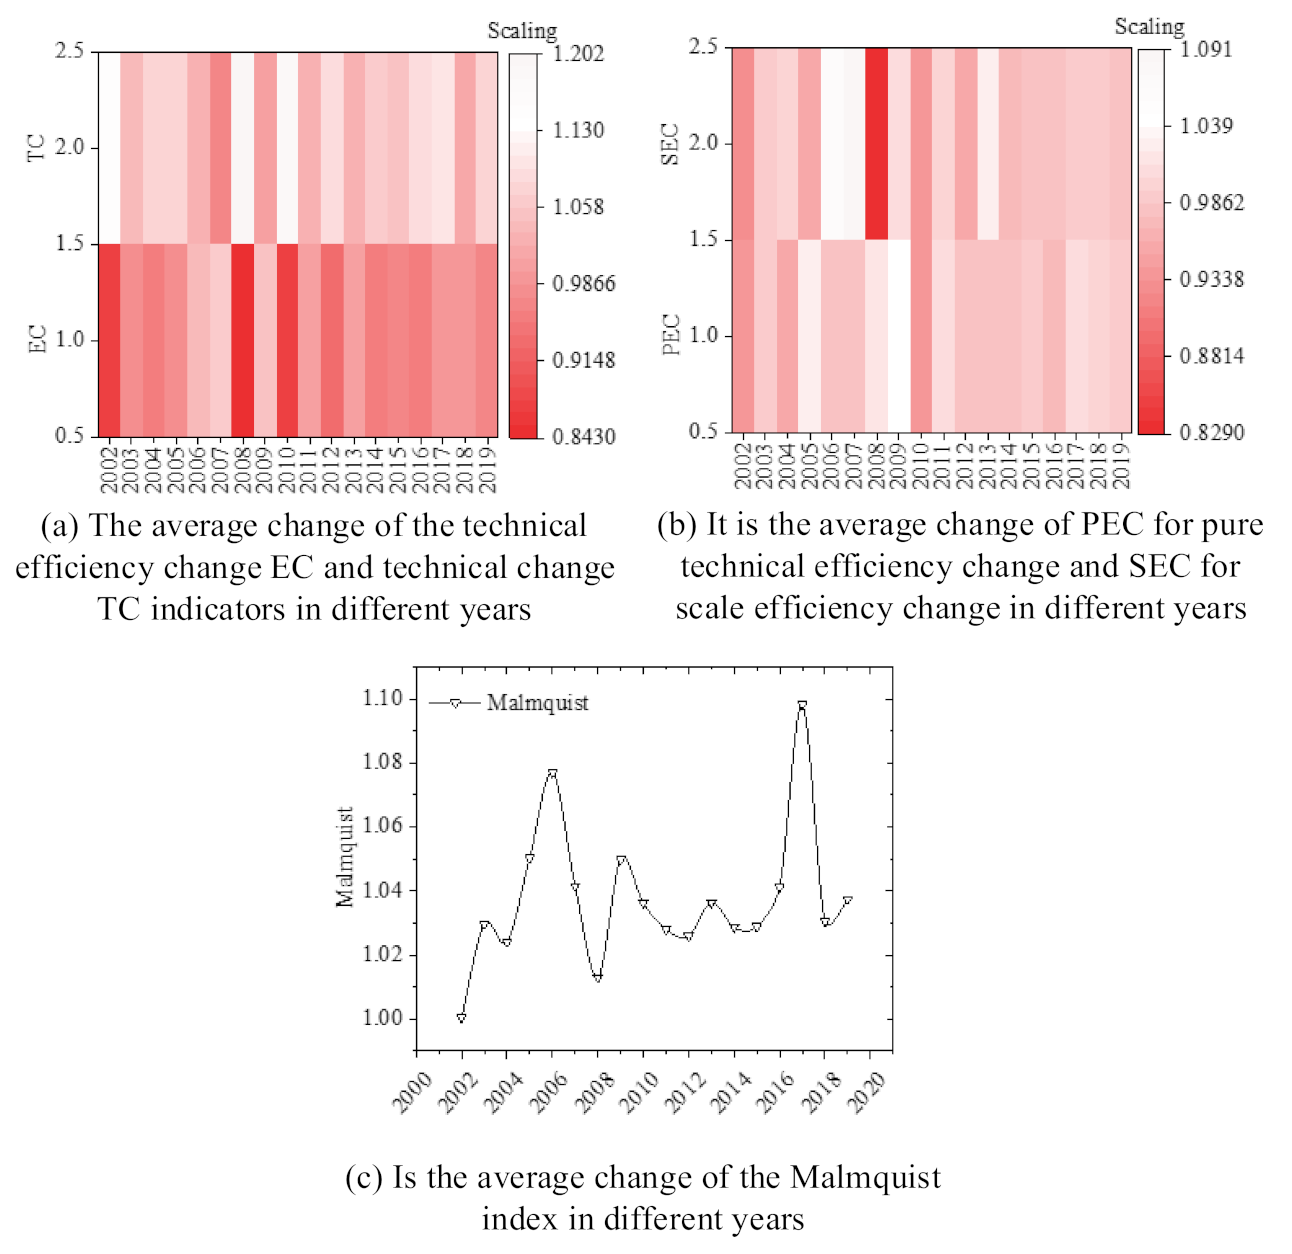
4.3. Cumulative Changes

China’s performance on agricultural GD level has seen steady growth since 2000, with an average value of 1.33, as given in Figure 3. The sample analysis in this study reveals that, compared with other technical indicators, the magnitude of agricultural TC is much higher than that of EC. Among them, EC and PEC have declined from 2000 to 2019, and EC shows the lowest change value, with an average value of only 0.7312. As a result, the main growth driver for green development in China’s agricultural industry comes from technology, which is also consistent with the above results in this study.

4.4. Changes in Different Regions

Figure 4 illustrates that Zhejiang has the highest performance on agricultural GD level in the eastern region, with an overall evaluation value of 1.0869; in the central region, Henan has the highest performance (1.0742); in the western region, Guangxi has the highest performance (1.0744); and in the eastern region, Liaoning has the highest performance (1.0387). A comparison of the different regions discloses that the order of performance of agricultural GD level is the eastern > central > western > northern regions, which reflects the EC contributing less to the improvement of China’s performance in agricultural GD. In addition, the comparison also indicates that agricultural GD across the country shows higher levels in the south and lower levels in the north.

4.5. PSM Results

The factors affecting the performance of agricultural GD were analyzed deeply based on an analysis of the national and regional agricultural GD and related literature, as given in Table 5. The performance of agricultural GD was undertaken as the explained variable. The explanatory variables included the agricultural economic level, the square item of agricultural economic level, the fiscal support of agriculture policy, the industrialization process, the level of opening-up, the adjustment of agricultural structure, and the environmental regulatory capability of government.
Figure 5 shows the descriptively statistical results of different indicators. It reveals that the average values on Y, EL, ELS, FS, IP, OP, AS, and ER are 0.789, 1.297, 1.572, 0.31, 0.447, 0.848, 0.658, and 0.064, respectively. Therefore, OP has an important impact on the performance of agricultural GD.
Figure 6 shows the estimation result of an empirical panel. It illustrates that EL shows a significant level (p < 0.001), which indicates that it is extremely positively correlated with the performance of agricultural GD. The higher the support for agriculture at the regional government, the higher the performance of agricultural GD in the region. IP significantly promoted an improvement in the performance of agricultural GD. OP and proportion of sown food crops in the total sown area of agricultural crops have significant negative impacts on the performance of agricultural GD. ER is negatively correlated with the performance of agricultural GD, which means that the existing pollution charging system may face some problems, such as unreasonable charging standards and insufficient supervision. Therefore, it is urgent for the government to design and reform the pollution charging policies.

5. Governance Recommendations

5.1. Monitoring the Pollution Source and Implementing both Rewards and Punishments

The control of agricultural pollution sources is a prerequisite in the development of green agriculture. Due to the lack of data support in the traditional regulatory field, it is difficult to determine the impact of pollutants on agriculture, so many companies discharge sewage at will. With support for the development of green agriculture in China, it is necessary to establish a comprehensive pollution source monitoring system to realize dynamic supervision of different enterprises. In addition, sensors can be set up from different water sources and land to ensure the acquisition of effective data. Secondly, it is necessary to establish appropriate green mechanism systems in accordance with market guidelines for farmers and to increase penalties for polluting enterprises. When rewards and punishments are clearly distinguished, farmers are encouraged to adopt more green methods for planting through multiple channels to promote the development of green agriculture.

5.2. Enhancing Environmental Supervision and Optimizing Government Functions

Government supervision is the basis for ensuring green and sustainable development, so corresponding policies should be formulated at the government level for restricting and regulating the unification of enterprise development and environmental protection and for clarifying the importance of environmental protection [33]. For pollution, the Chinese government needs to supervise related enterprises reasonably and to monitor the agricultural production process. In the past few years, large-scale use of pesticides and fertilizers has caused serious environmental pollution, which aggravates the health of humans. Therefore, a comprehensive environmental performance evaluation system should be established to greatly restrict the agricultural activities of companies and individuals that pollute or to reduce energy-consuming and polluting companies through industrial restructuring. Only in this way can the Chinese government strengthen the guidance of related work; improve the coordination, supervision, and comprehensive management level; and earnestly optimize each link in agricultural production.

5.3. Utilizing Various Policies and Establishing the Indicator System

A complete policy and performance appraisal system is an important measure to ensure a green and safe market. Due to the complexity of the agricultural production process, the types of pollution are also diversified. An effective environmental management system requires a variety of policy supports, and a complete agricultural GD indicator system has to be constructed to quantify the complex agricultural issues and to achieve assessment. A variety of policy systems include direct government intervention, stimulation of economic policies, market adjustment operating mechanisms, and public participation policies. The use of policies combined with quantitative indicators can effectively control agricultural GD [34].

5.4. Accelerating Technological Innovation and Exerting the Technological Strengths

An improvement in agricultural technology is the cornerstone to ensuring its rapid development. China’s performance in agricultural GD is lower than other countries. At both the national and regional levels, it is necessary to pay special attention to the role of technological development in promoting agricultural GD, increasing the R&D investments in universities and research institutions; accelerating the transformation of production, education, and research; promoting the development of green agriculture, enhancing the promotion and publicity of new technologies; and popularizing basic agricultural knowledge. Under the premise of existing resource utilization policies and green agriculture policies, efforts should be made to develop agricultural water-saving technologies, irrigation water-saving technologies, and engineering water-saving technology [35]. In addition, it can further tap the potential of agricultural water saving through sprinkler irrigation, micro-irrigation, and canal irrigation, thereby further improving the performance of agricultural GD in China.

6. Conclusions

Based on a summary of the previous studies and information communication technology, an agricultural GD evaluation indicator system was constructed in this study. The driving force of agricultural GD in China mainly comes from technological progress. The efficiency improvement in agricultural technology is relatively weak, which has become the key factor restricting agricultural GD in China. On the other hand, the level of agricultural GD in China has shown a steady growth trend but the regional differences are obvious. The level in the eastern region is significantly higher than that in the western and central regions. The PSM model is adopted to evaluate the influencing factors on the performance of agricultural GD in depth. The performance of agricultural GD shows extremely positive correlations with agricultural economic level, fiscal support for agricultural policies, and industrialization process; it shows obviously negative correlations with level of opening-up, adjustment of agricultural structure, and the environmental regulatory capability of government. As a result, agricultural technology and government supervision should be reinforced.
However, there are many shortcomings in this study. The analysis is implemented based on input, output, and expected output only, but the relevant indicator system is a summary from previous articles, with less involved contents. Besides, it only deeply analyzes the impact of different industries on agricultural development, but how relevant factors affect the performance of agricultural through corresponding indicators has to be further studied in the future. The performance of agricultural GD in the future has to be more refined and specific, so that it can be better applied to practical application analysis, such as the establishment of farmer performance evaluation models and enterprise performance evaluation models. Therefore, an in-depth analysis and study will continually be made in these aspects to modify the proposed evaluation model on the performance of agricultural GD.

Author Contributions

Formal analysis, X.Z.; Investigation, X.Z. and H.C.; Writing—original draft, X.Z.; Writing—review & editing, H.C. All authors have read and agreed to the published version of the manuscript.

Funding

This research received no external funding.

Institutional Review Board Statement

The study was conducted according to the guidelines of the Declaration of Helsinki, and approved by the Institutional Review Board of Northeast Forestry University (protocol code 20201204 and date of approval was 12 October 2020).

Informed Consent Statement

Not applicable.

Data Availability Statement

The raw data supporting the conclusions of this article will be made available by the authors, without undue reservation, to any qualified researcher.

Acknowledgments

No acknowledgements.

Conflicts of Interest

There is no conflicts of interest among the authors, data, and results of this study.

References

  1. Githiru, M.; Njambuya, J.W. Globalization and biodiversity conservation problems: Polycentric REDD+ solutions. Land 2019, 8, 35–43. [Google Scholar] [CrossRef] [Green Version]
  2. Yu, J.; Wu, J. The sustainability of agricultural development in China: The agriculture–environment nexus. Sustainability 2018, 10, 1776–1782. [Google Scholar] [CrossRef] [Green Version]
  3. Cao, Y.; Chai, L.; Yan, X.; Liang, Y. Drivers of the Growing Water, Carbon and Ecological Footprints of the Chinese Diet from 1961 to 2017. Int. J. Environ. Res. Public Health 2020, 17, 1803–1812. [Google Scholar] [CrossRef] [Green Version]
  4. Long, H.; Liu, H.; Li, X.; Chen, L. An Evolutionary Game Theory Study for Construction and Demolition Waste Recycling Considering Green Development Performance under the Chinese Government’s Reward–Penalty Mechanism. Int. J. Environ. Res. Public Health 2020, 17, 6303–6312. [Google Scholar] [CrossRef] [PubMed]
  5. Melović, B.; Cirović, D.; Backovic-Vulić, T.; Dudić, B.; Gubinova, K. Attracting Green Consumers as a Basis for Creating Sustainable Marketing Strategy on the Organic Market—Relevance for Sustainable Agriculture Business Development. Foods 2020, 9, 1552–1562. [Google Scholar] [CrossRef]
  6. Xu, J.; Zhang, Z.; Zhang, X.; Ishfaq, M.; Zhong, J.; Li, W.; Zhang, F.; Li, X. Green Food Development in China: Experiences and Challenges. Agriculture 2020, 10, 614–623. [Google Scholar] [CrossRef]
  7. Castillo-Henríquez, L.; Alfaro-Aguilar, K.; Ugalde-Álvarez, J.; Vega-Fernández, L.; Montes de Oca-Vásquez, G.; Vega-Baudrit, J.R. Green Synthesis of Gold and Silver Nanoparticles from Plant Extracts and Their Possible Applications as Antimicrobial Agents in the Agricultural Area. Nanomaterials 2020, 10, 1763–1773. [Google Scholar] [CrossRef]
  8. Yacamán Ochoa, C.; Ferrer Jiménez, D.; Mata Olmo, R. Green Infrastructure Planning in Metropolitan Regions to Improve the Connectivity of Agricultural Landscapes and Food Security. Land 2020, 9, 414–425. [Google Scholar] [CrossRef]
  9. Choi, Y.J.; Baek, J. Does FDI really matter to economic growth in India? Economies 2017, 5, 20–26. [Google Scholar] [CrossRef] [Green Version]
  10. Hsiao, W.-L.; Hu, J.-L.; Hsiao, C.; Chang, M.-C. Energy efficiency of the Baltic Sea countries: An application of stochastic frontier analysis. Energies 2019, 12, 104–113. [Google Scholar] [CrossRef] [Green Version]
  11. Niu, D.; Song, Z.; Xiao, X.; Wang, Y. Analysis of wind turbine micrositing efficiency: An application of two-subprocess data envelopment analysis method. J. Clean. Prod. 2018, 170, 193–204. [Google Scholar] [CrossRef]
  12. Tapia, J.F.D.; Promentilla, M.A.B.; Tseng, M.-L.; Tan, R.R. Screening of carbon dioxide utilization options using hybrid Analytic Hierarchy Process-Data Envelopment Analysis method. J. Clean. Prod. 2017, 165, 1361–1370. [Google Scholar] [CrossRef]
  13. Shen, J.; Zhu, Q.; Jiao, X.; Ying, H.; Wang, H.; Wen, X.; Xu, W.; Li, T.; Cong, W.; Liu, X. Agriculture green development: A model for China and the world. Front. Agric. Sci. Eng. 2020, 7, 5–13. [Google Scholar] [CrossRef] [Green Version]
  14. Shen, N.; Liao, H.; Deng, R.; Wang, Q. Different types of environmental regulations and the heterogeneous influence on the environmental total factor productivity: Empirical analysis of China’s industry. J. Clean. Prod. 2019, 211, 171–184. [Google Scholar] [CrossRef]
  15. Han, Z.; Han, C.; Yang, C. Spatial econometric analysis of environmental total factor productivity of animal husbandry and its influencing factors in China during 2001–2017. Sci. Total Environ. 2020, 723, 137726–137736. [Google Scholar] [CrossRef]
  16. Guo, B.; He, D.; Zhao, X.; Zhang, Z.; Dong, Y. Analysis on the spatiotemporal patterns and driving mechanisms of China’s agricultural production efficiency from 2000 to 2015. Phys. Chem. Earth Parts A/B/C 2020, 120, 102909–102916. [Google Scholar] [CrossRef]
  17. Li, M.; Wang, J. Spatial-temporal distribution characteristics and driving mechanism of green total factor productivity in China’s logistics industry. Pol. J. Environ. Stud. 2020, 30, 201–213. [Google Scholar] [CrossRef]
  18. Zhu, Y.; Liang, D.; Liu, T. Can China’s underdeveloped regions catch up with green economy? A convergence analysis from the perspective of environmental total factor productivity. J. Clean. Prod. 2020, 255, 120216–120226. [Google Scholar] [CrossRef]
  19. Qin, Q.; Yan, H.; Liu, J.; Chen, X.; Ye, B. China’s agricultural GHG emission efficiency: Regional disparity and spatial dynamic evolution. Environ. Geochem. Health 2020, 1–17. [Google Scholar] [CrossRef]
  20. Chen, Y.; Liu, B.; Shen, Y.; Wang, X. Spatial analysis of change trend and influencing factors of total factor productivity in China’s regional construction industry. Appl. Econ. 2018, 50, 2824–2843. [Google Scholar] [CrossRef]
  21. Feng, C.; Huang, J.-B.; Wang, M. Analysis of green total-factor productivity in China’s regional metal industry: A meta-frontier approach. Resour. Policy 2018, 58, 219–229. [Google Scholar] [CrossRef]
  22. Wang, K.-L.; Pang, S.-Q.; Ding, L.-L.; Miao, Z. Combining the biennial Malmquist–Luenberger index and panel quantile regression to analyze the green total factor productivity of the industrial sector in China. Sci. Total Environ. 2020, 739, 140280–140286. [Google Scholar] [CrossRef] [PubMed]
  23. Baležentis, T.; Blancard, S.; Shen, Z.; Štreimikienė, D. Analysis of environmental total factor productivity evolution in European agricultural sector. Decis. Sci. 2019, 365–373. [Google Scholar] [CrossRef]
  24. Liu, J.; Dong, C.; Liu, S.; Rahman, S.; Sriboonchitta, S. Sources of Total-Factor Productivity and Efficiency Changes in China’s Agriculture. Agriculture 2020, 10, 279–286. [Google Scholar] [CrossRef]
  25. Li, N.; Jiang, Y.; Yu, Z.; Shang, L. Analysis of agriculture total-factor energy efficiency in China based on DEA and malmquist indices. Energy Procedia 2017, 142, 2397–2402. [Google Scholar] [CrossRef]
  26. Wu, L.; Zhang, Z. Impact and threshold effect of Internet technology upgrade on forestry green total factor productivity: Evidence from China. J. Clean. Prod. 2020, 271, 122657–122669. [Google Scholar] [CrossRef]
  27. Ratheeswari, K. Information communication technology in education. J. Appl. Adv. Res. 2018, 3, S45–S47. [Google Scholar] [CrossRef] [Green Version]
  28. Han, J.-H.; Park, C.-H.; Kwon, J.H.; Lee, J.; Kim, T.S.; Jang, Y.Y. Performance Evaluation of Autonomous Driving Control Algorithm for a Crawler-Type Agricultural Vehicle Based on Low-Cost Multi-Sensor Fusion Positioning. Appl. Sci. 2020, 10, 4667–4673. [Google Scholar] [CrossRef]
  29. Bevilacqua, I.; Capello, G.; Biddoccu, M. Local- and Plot-Scale Measurements of Soil Moisture: Time and Spatially Resolved Field Techniques in Plain, Hill and Mountain Sites. Adv. Hydro Meteorol. Monit. 2018, 21–36. [Google Scholar]
  30. Feng, Z.; Chen, W. Environmental regulation, green innovation, and industrial green development: An empirical analysis based on the Spatial Durbin model. Sustainability 2018, 10, 223–236. [Google Scholar] [CrossRef] [Green Version]
  31. Shen, C.-W.; Min, C.; Wang, C.-C. Analyzing the trend of O2O commerce by bilingual text mining on social media. Comput. Hum. Behav. 2019, 101, 474–483. [Google Scholar] [CrossRef]
  32. Liu, Q.; Cheng, Z.; Chen, M. Effects of environmental education on environmental ethics and literacy based on virtual reality technology. Electron. Libr. 2019, 37, 860–877. [Google Scholar] [CrossRef]
  33. Feng, B.; Sun, K.; Chen, M.; Gao, T. The Impact of Core Technological Capabilities of High-Tech Industry on Sustainable Competitive Advantage. Sustainability 2020, 12, 2980. [Google Scholar] [CrossRef] [Green Version]
  34. Liu, Y.; Chen, M. From the Aspect of STEM to Discuss the Effect of Ecological Art Education on Knowledge Integration and Problem-Solving Capability. Ekoloji 2018, 27, 1705–1711. [Google Scholar]
  35. Chen, M.; Liu, Q.; Huang, S.; Dang, C. Environmental cost control system of manufacturing enterprises using artificial intelligence based on value chain of circular economy. Enterp. Inf. Syst. 2020. [Google Scholar] [CrossRef]
Figure 1. Descriptive statistics of the input and output variables. (a): the data distribution of input indicators A11-A51; (b): the data distribution of output indicators B11-C13; (c): the average value of input indicators; (d): the average value of output indicators.
Sustainability 13 01147 g001
Figure 2. Overall analysis in the national agricultural development. (a): the average change of EC for technical efficiency change and TC for technical change in different years; (b) the average change of PEC for pure technical efficiency change and SEC for scale efficiency change in different years; (c) the average change of the Malmquist index in different years.
Sustainability 13 01147 g002
Figure 3. Indicator changes compared to the last year. (a): the cumulative time series changes of EC for technical efficiency change and TC for technical change in different years; (b): the cumulative time series changes of PEC for pure technical efficiency change and SEC for scale efficiency change in different years; (c): the cumulative time series changes of the Malmquist index in different years.
Sustainability 13 01147 g003
Figure 4. Levels of agricultural GD in various regions in China. (a): agricultural green development performance results of key provinces in eastern China; (b): agricultural green development performance results of key provinces in central China; (c): agricultural green development performance results of key provinces in western China; (d): agricultural green development performance results of key provinces in northern China; (e): summary results of agricultural green development performance in different regions of China.
Sustainability 13 01147 g004
Figure 5. Descriptive statistics of variables. (a): the performance of agricultural green development, the level of agricultural economic development, the square item of agricultural economic development, and the distribution of data on fiscal support for agriculture; (b): data distribution of industrialization process, degree of opening to the outside world, agricultural structure adjustment, and environmental control capacity; (c): performance of agricultural green development, the level of agricultural economic development, the square item of agricultural economic development, and the average value of data on fiscal support to agriculture; (d): average data of industrialization process, degree of opening to the outside world, agricultural structure adjustment, and environmental control capacity.
Sustainability 13 01147 g005
Figure 6. The estimation result of empirical panel. (a): the empirical estimation result of panel F-value; (b): the estimation result of test panel p-value.
Sustainability 13 01147 g006
Table 1. Evaluation on performance of agricultural green development (GD).
LiteratureTimeMethodInputsOutputs
Shen et al. (2020) [13]1978–2005DEAHuman capital, land, agricultural machinery, fertilizers, draught animals, and irrigationTotal output value of agriculture, forestry, animal husbandry, and fishery
Neng et al. (2019) [14]1978–2007SFALand, labor, agricultural capital stock, and intermediate inputTotal output value of agriculture, forestry, animal husbandry, and fishery
Han et al. (2020) [15]1992–2007DEAMachinery, fertilizer, labor, and landTotal output value of agriculture, forestry, animal husbandry, and fishery
Guo et al. (2020) [16]1999–2008DEALabor, capital, and technological progressTotal output value of agriculture, forestry, animal husbandry, and fishery and pollution from a nonpoint agricultural source
Li et al. (2020) [17]1998–2009DEALand, labor, draught animals, chemical fertilizers, Machinery, and water resourcesTotal output value of agriculture, forestry, animal husbandry, and fishery and pollution from a nonpoint agricultural source
Zhu et al. (2020) [18]1991–2010SFALabor and capitalTotal output value of agriculture, forestry, animal husbandry, and fishery
Table 2. Regional differences in performance of agricultural GD.
LiteratureTimeSample RangeConclusion
Qin et al. (2020) [19]1985–200529 provinces in ChinaThere is no shrinking trend in agricultural TFP differences among provinces.
Chen et al. (2018) [20]1978–2008The whole country and three major regionsAgricultural GD growth shows significant regional imbalance.
Feng et al. (2018) [21]1993–201029 provinces in ChinaThe growth of China’s agricultural green TFP shows a downward trend in the eastern, western, and central regions.
Wang et al. (2020) [22]1978–200828 provinces in ChinaChina’s agricultural GD shows the fastest growth in the east, followed by the west.
Baležentis et al. (2019) [23]1978–201129 provinces in ChinaChina’s agricultural GD shows the fastest growth in the east.
Table 3. Influencing factors on performance of agricultural GD.
LiteratureTimeInfluencing FactorsConclusion
Liu et al. (2020) [24]1991–2008Rural employees, technological progress, financial support for agriculture, and the status of agriculture in the overall economyRural employees have significant impacts on agriculture, and technological progress is the main reason for the growth of agricultural TFP.
Liu et al. (2020) [24]1995–2008Characteristics of agricultural production structure, regional characteristics, government fiscal policy, and education levelThe improvement in the education levels of agricultural employees has played a positive role in the improvement of China’s agriculture.
Li et al. (2017) [25]1998–2011The level of rural economic development, investment in agricultural infrastructure, the proportion of aquaculture in the agricultural structure, expansion of the urban–rural income gap, and the fiscal support of agriculture policiesThe improvement of rural economic development and the investment increases in agricultural infrastructure effectively improve the agricultural performance.
Wu and Zhang (2020) [26]1992–2012Labor capital content, proportion of irrigated area, proportion of wage income, proportion of agricultural fiscal expenditure, proportion of agricultural output value, and proportion of grain sown areaLabor capital content, proportion of irrigated area, proportion of wage income, and proportion of agricultural fiscal expenditure have positive impacts on agricultural performance.
Table 4. Evaluation indicator system for performance of agricultural GD.
ItemPrimary IndicatorSecondary IndicatorUnit
Input indicators (A)Water resource input (A1)Agricultural water consumption (A11)Hundred million cubic meters
Labor input (A2)Employees in agriculture, forestry, animal husbandry, and fishery (A21)Ten thousand people
Land input (A3)Total sown area of crops (A31)Thousand hectares
Capital input (A4)The total power of agricultural machinery (A41)Ten thousand kilowatts
Chemical fertilizer input (A5)Scalar amount of agricultural fertilizer application (A51)Ten thousand tons
Expected indicators (B)Expected output (B1)Added value of primary industry (B11)100 billion Yuan
Output indicators (C)Unexpected output (C1)Chemical oxygen demand (COD, C11)Ten thousand tons
Total nitrogen (TN, C12)Ten thousand tons
Total phosphorus (TP, C13)Ten thousand tons
Table 5. Descriptive statistics of variables.
VariableSymbol
Performance of agricultural GDY
Agricultural economic levelEL
Square item of agricultural economic levelELS
Fiscal support of agriculture policiesFS
Industrialization processIP
Level of opening-upOP
Adjustment of agricultural structureAS
Environmental regulatory capability of governmentER
Publisher’s Note: MDPI stays neutral with regard to jurisdictional claims in published maps and institutional affiliations.

