
Improved Vulnerability Assessment Table for Retaining Walls and Embankments from a Working-Level Perspective in Korea


Abstract
1. Introduction
2. Literature Review
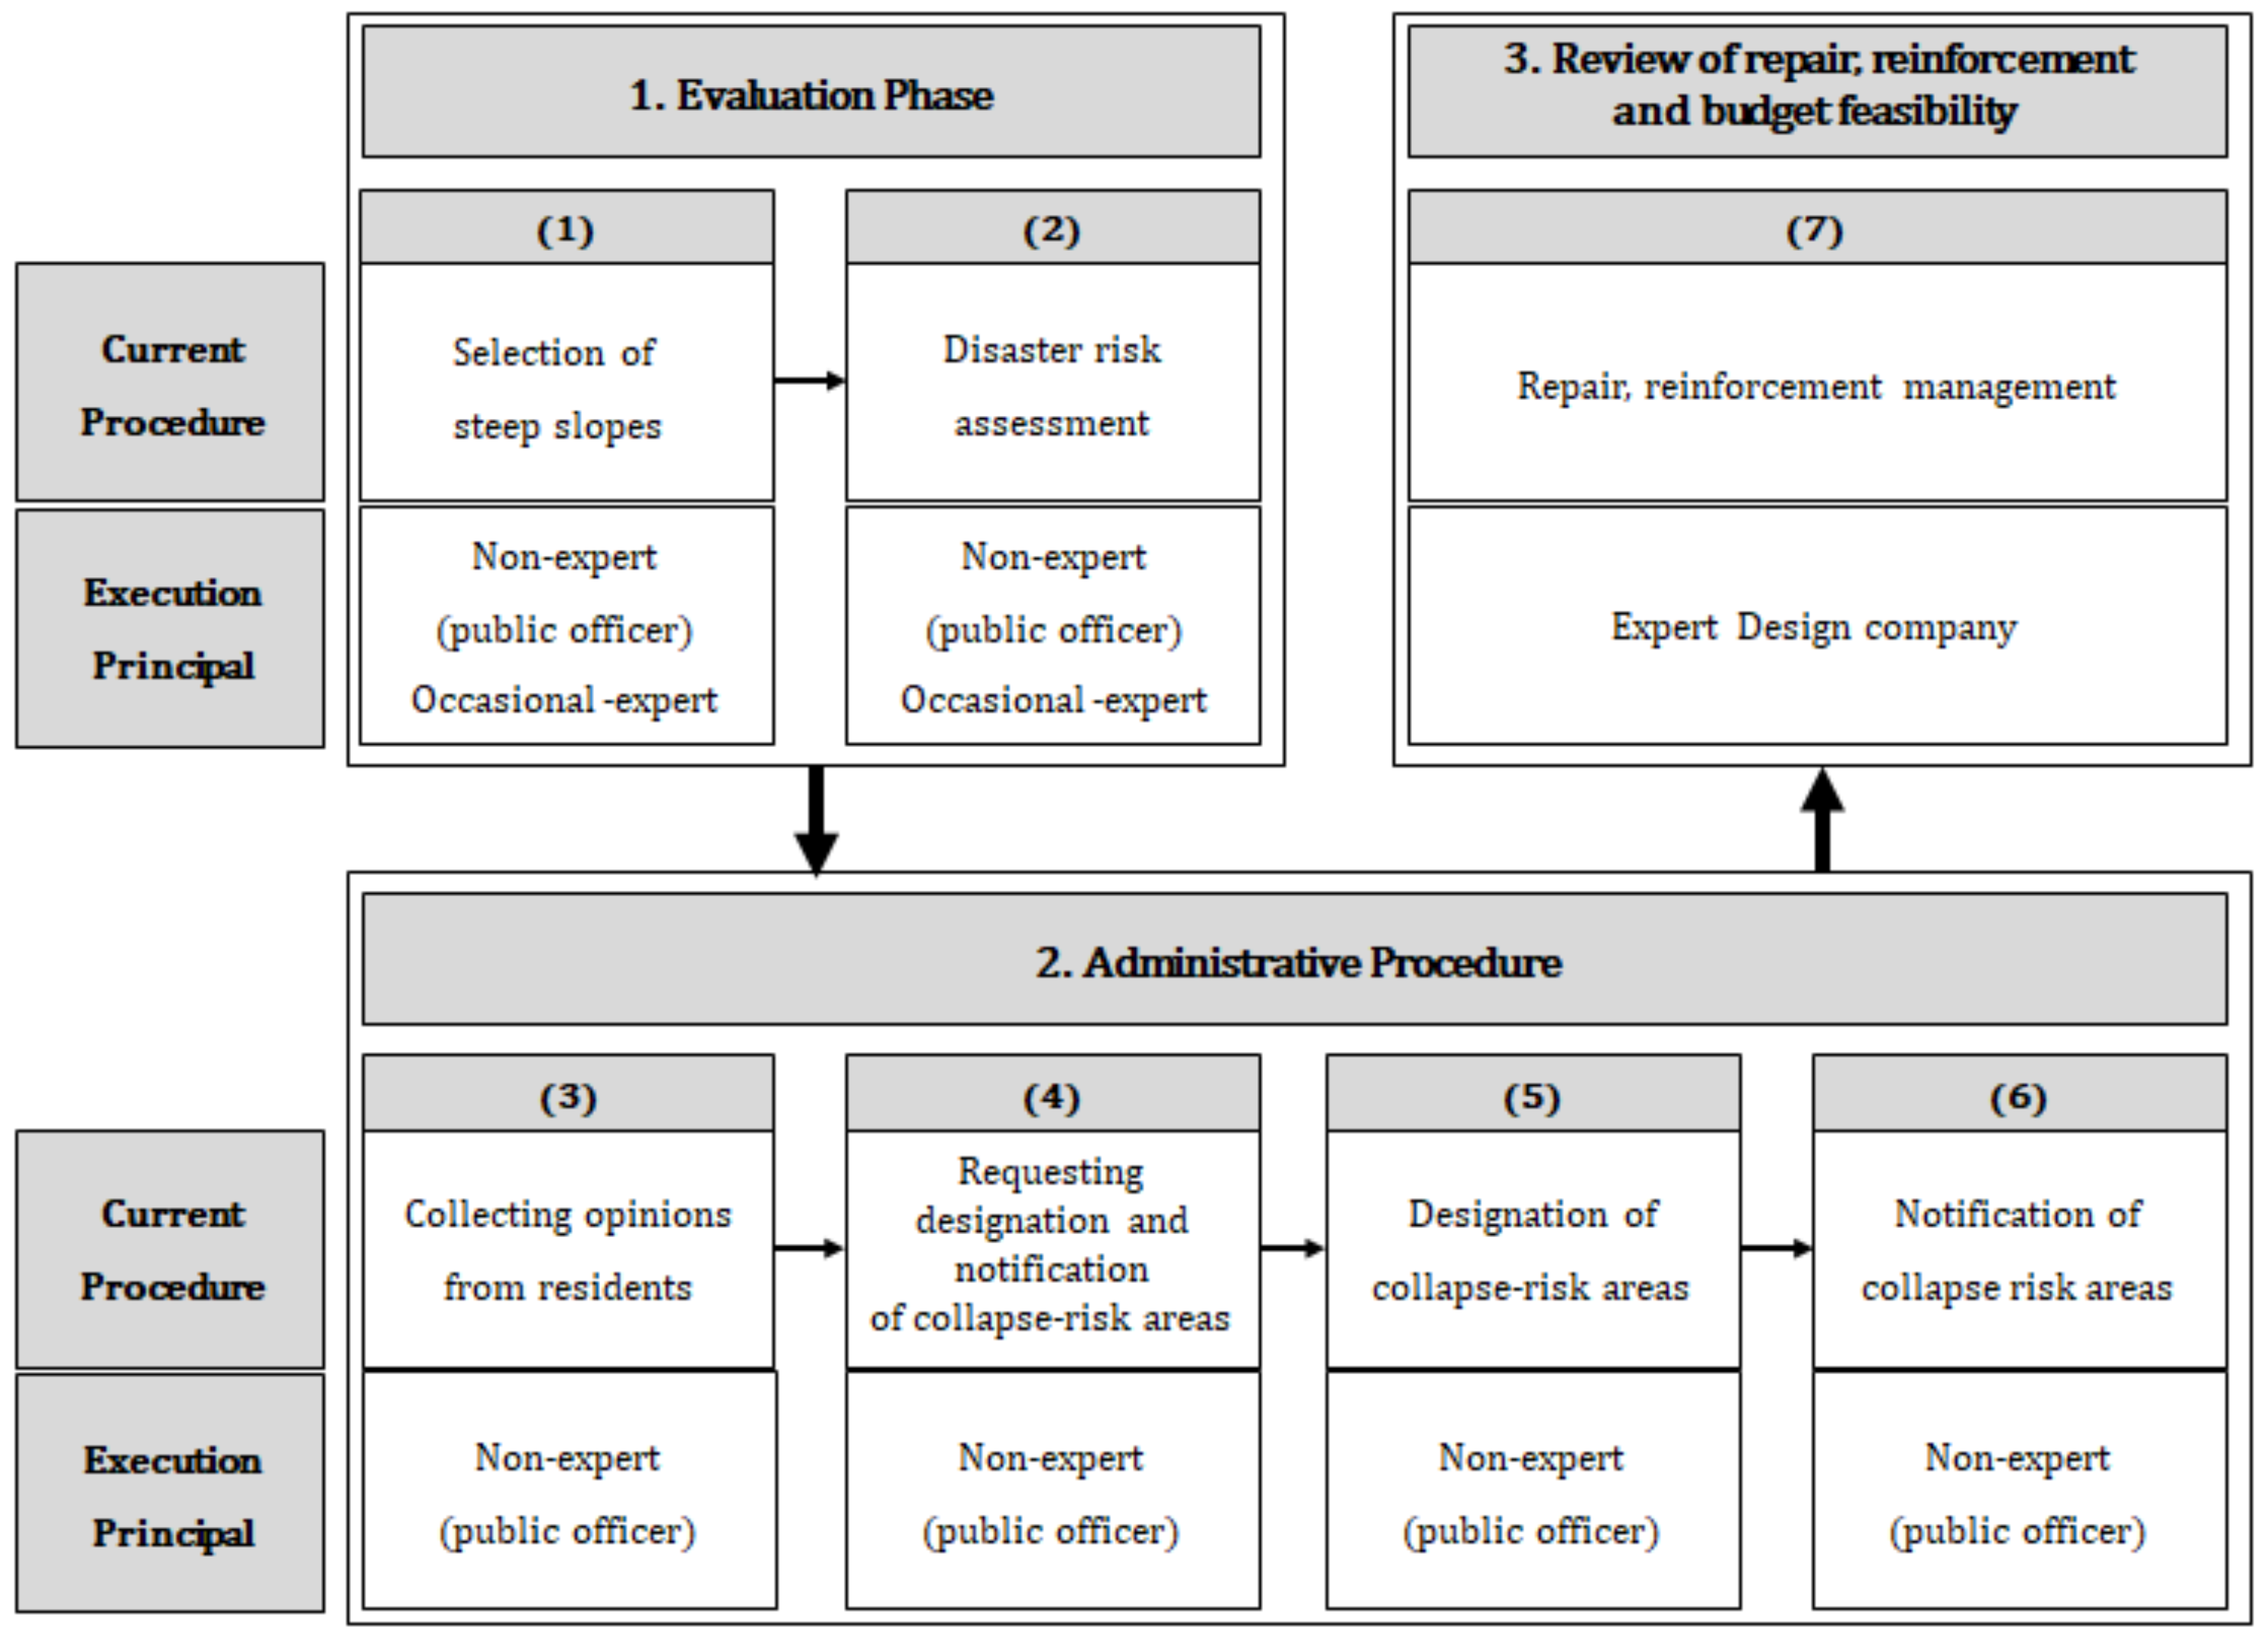
3. Review of Current Assessment Table for RW&Es
4. Development of the Assessment Table
5. Summary of Approaches for the Development of the Assessment Table
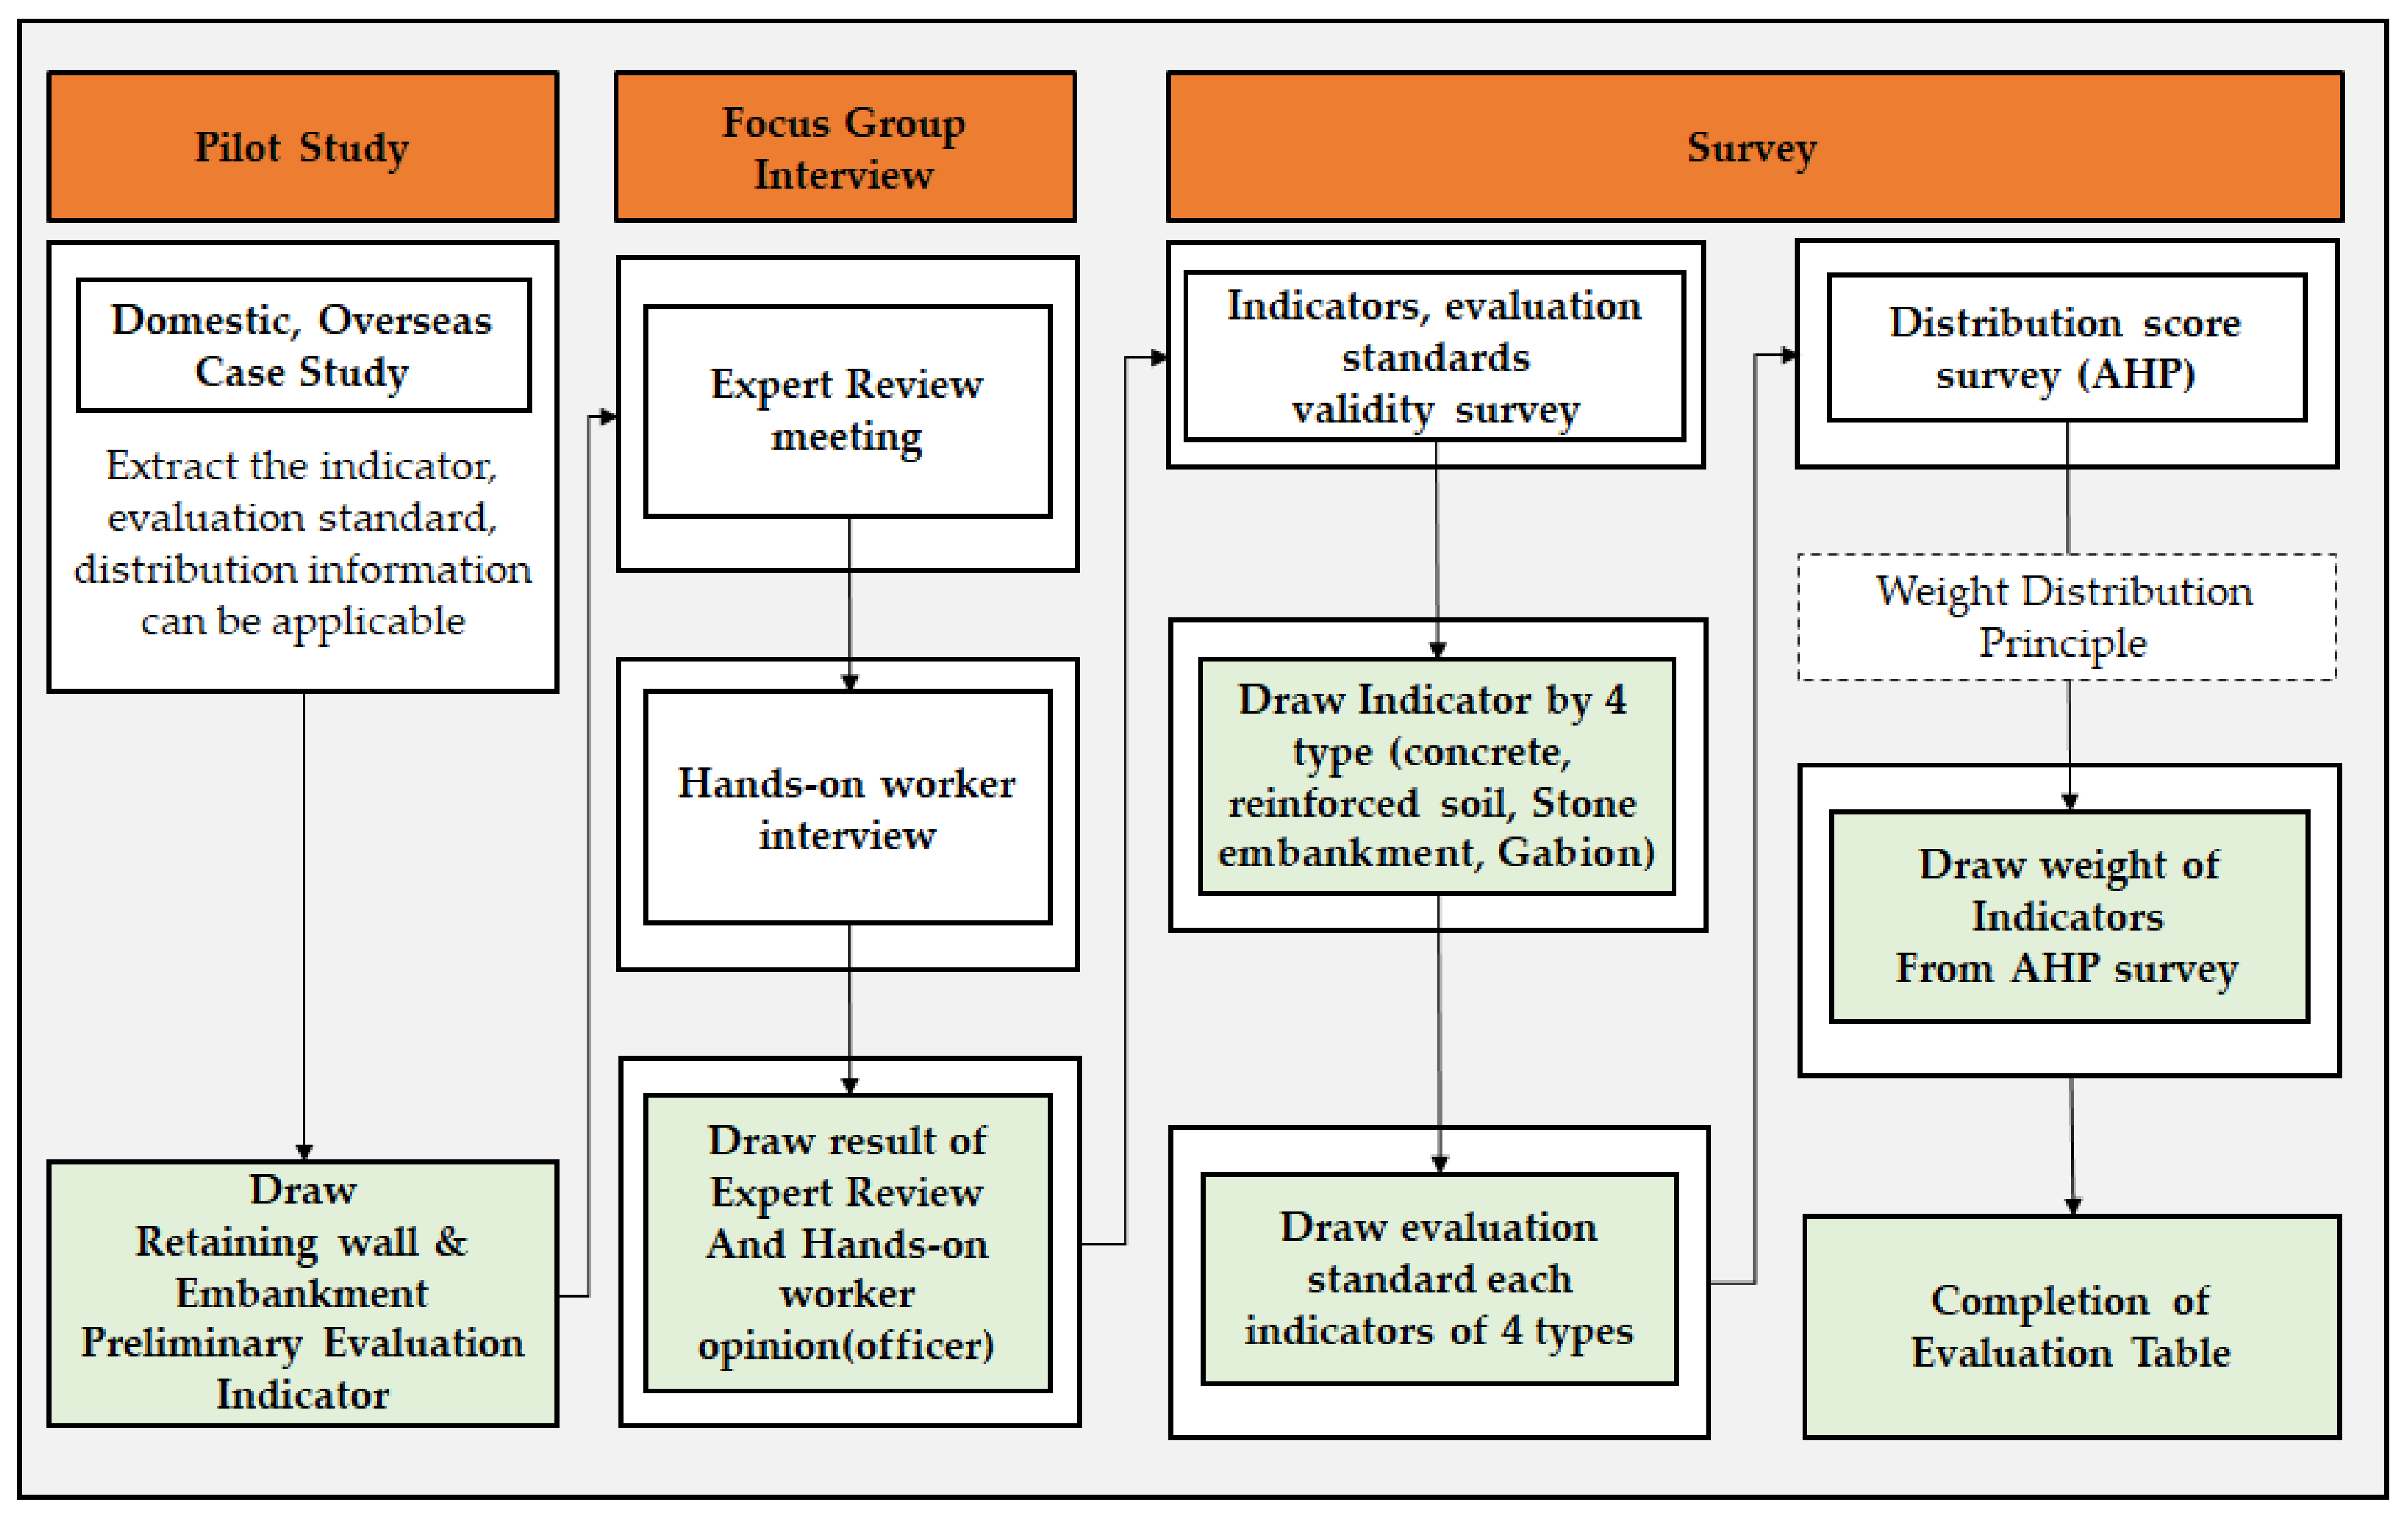
5.1. Deriving Evaluation Indicators and Standards
5.2. Weight Analysis by Indicators
5.2.1. Weight Analysis Methodology
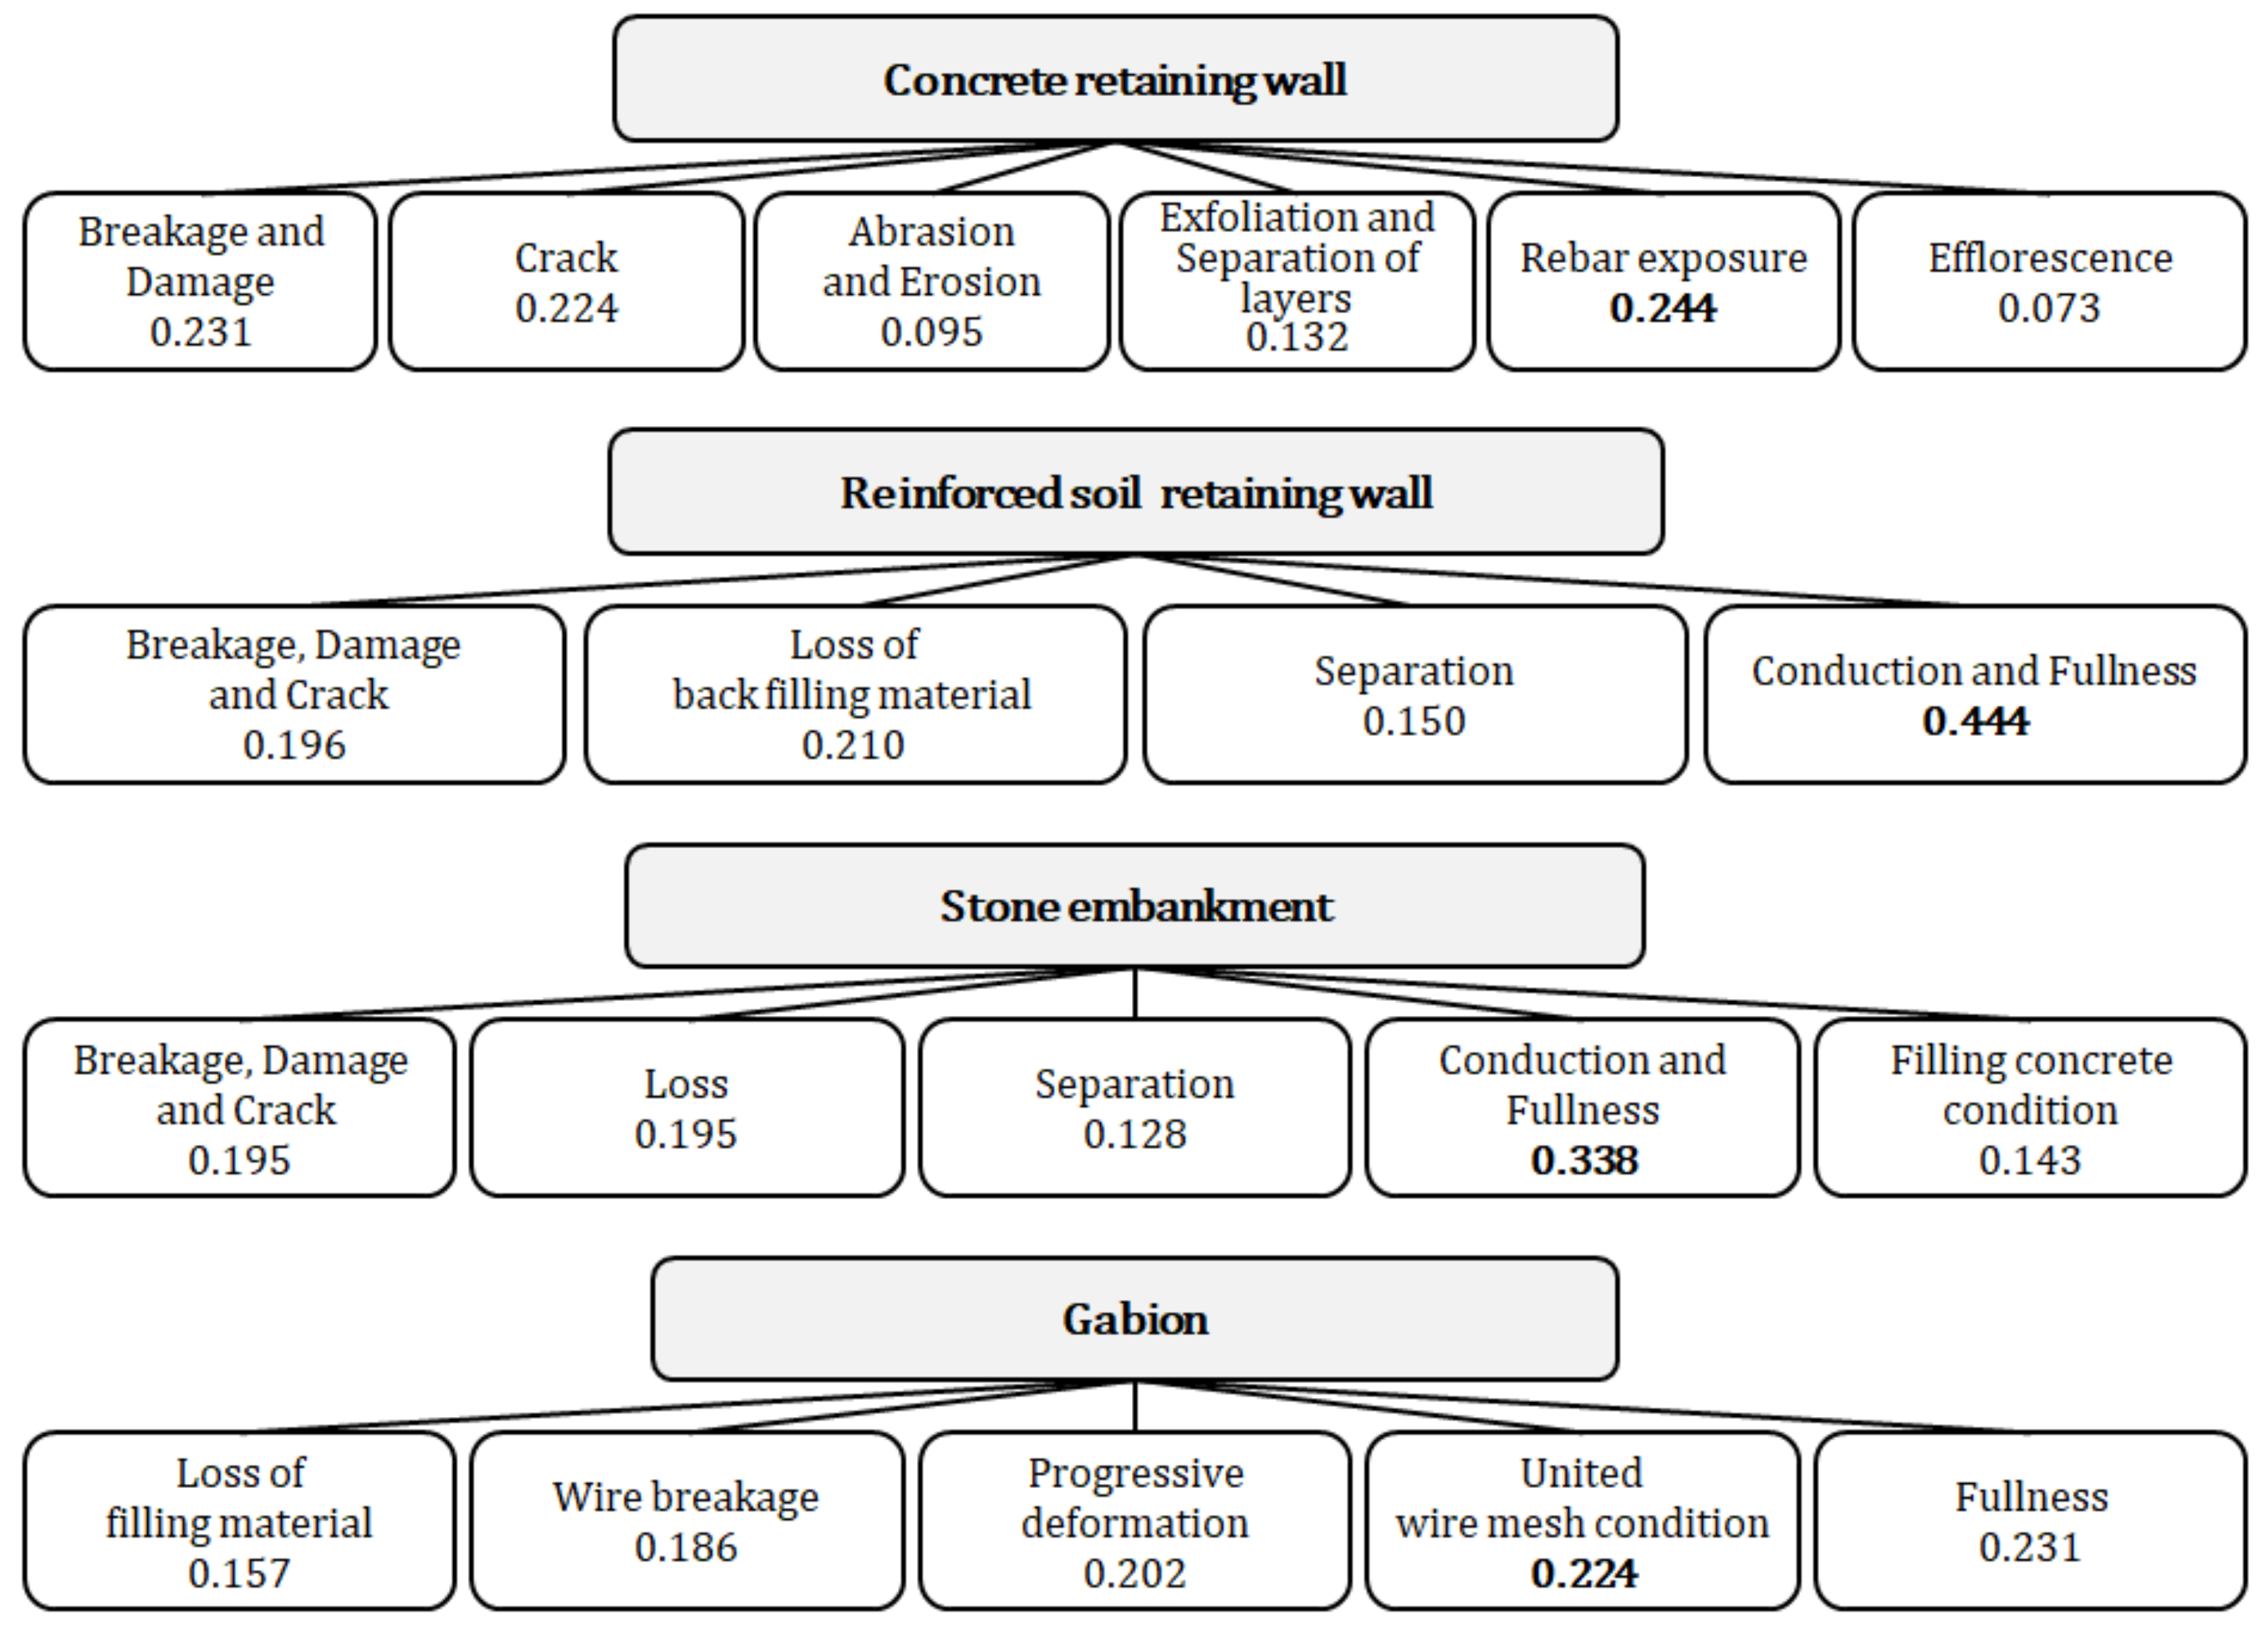
5.2.2. Results of Weight Analysis
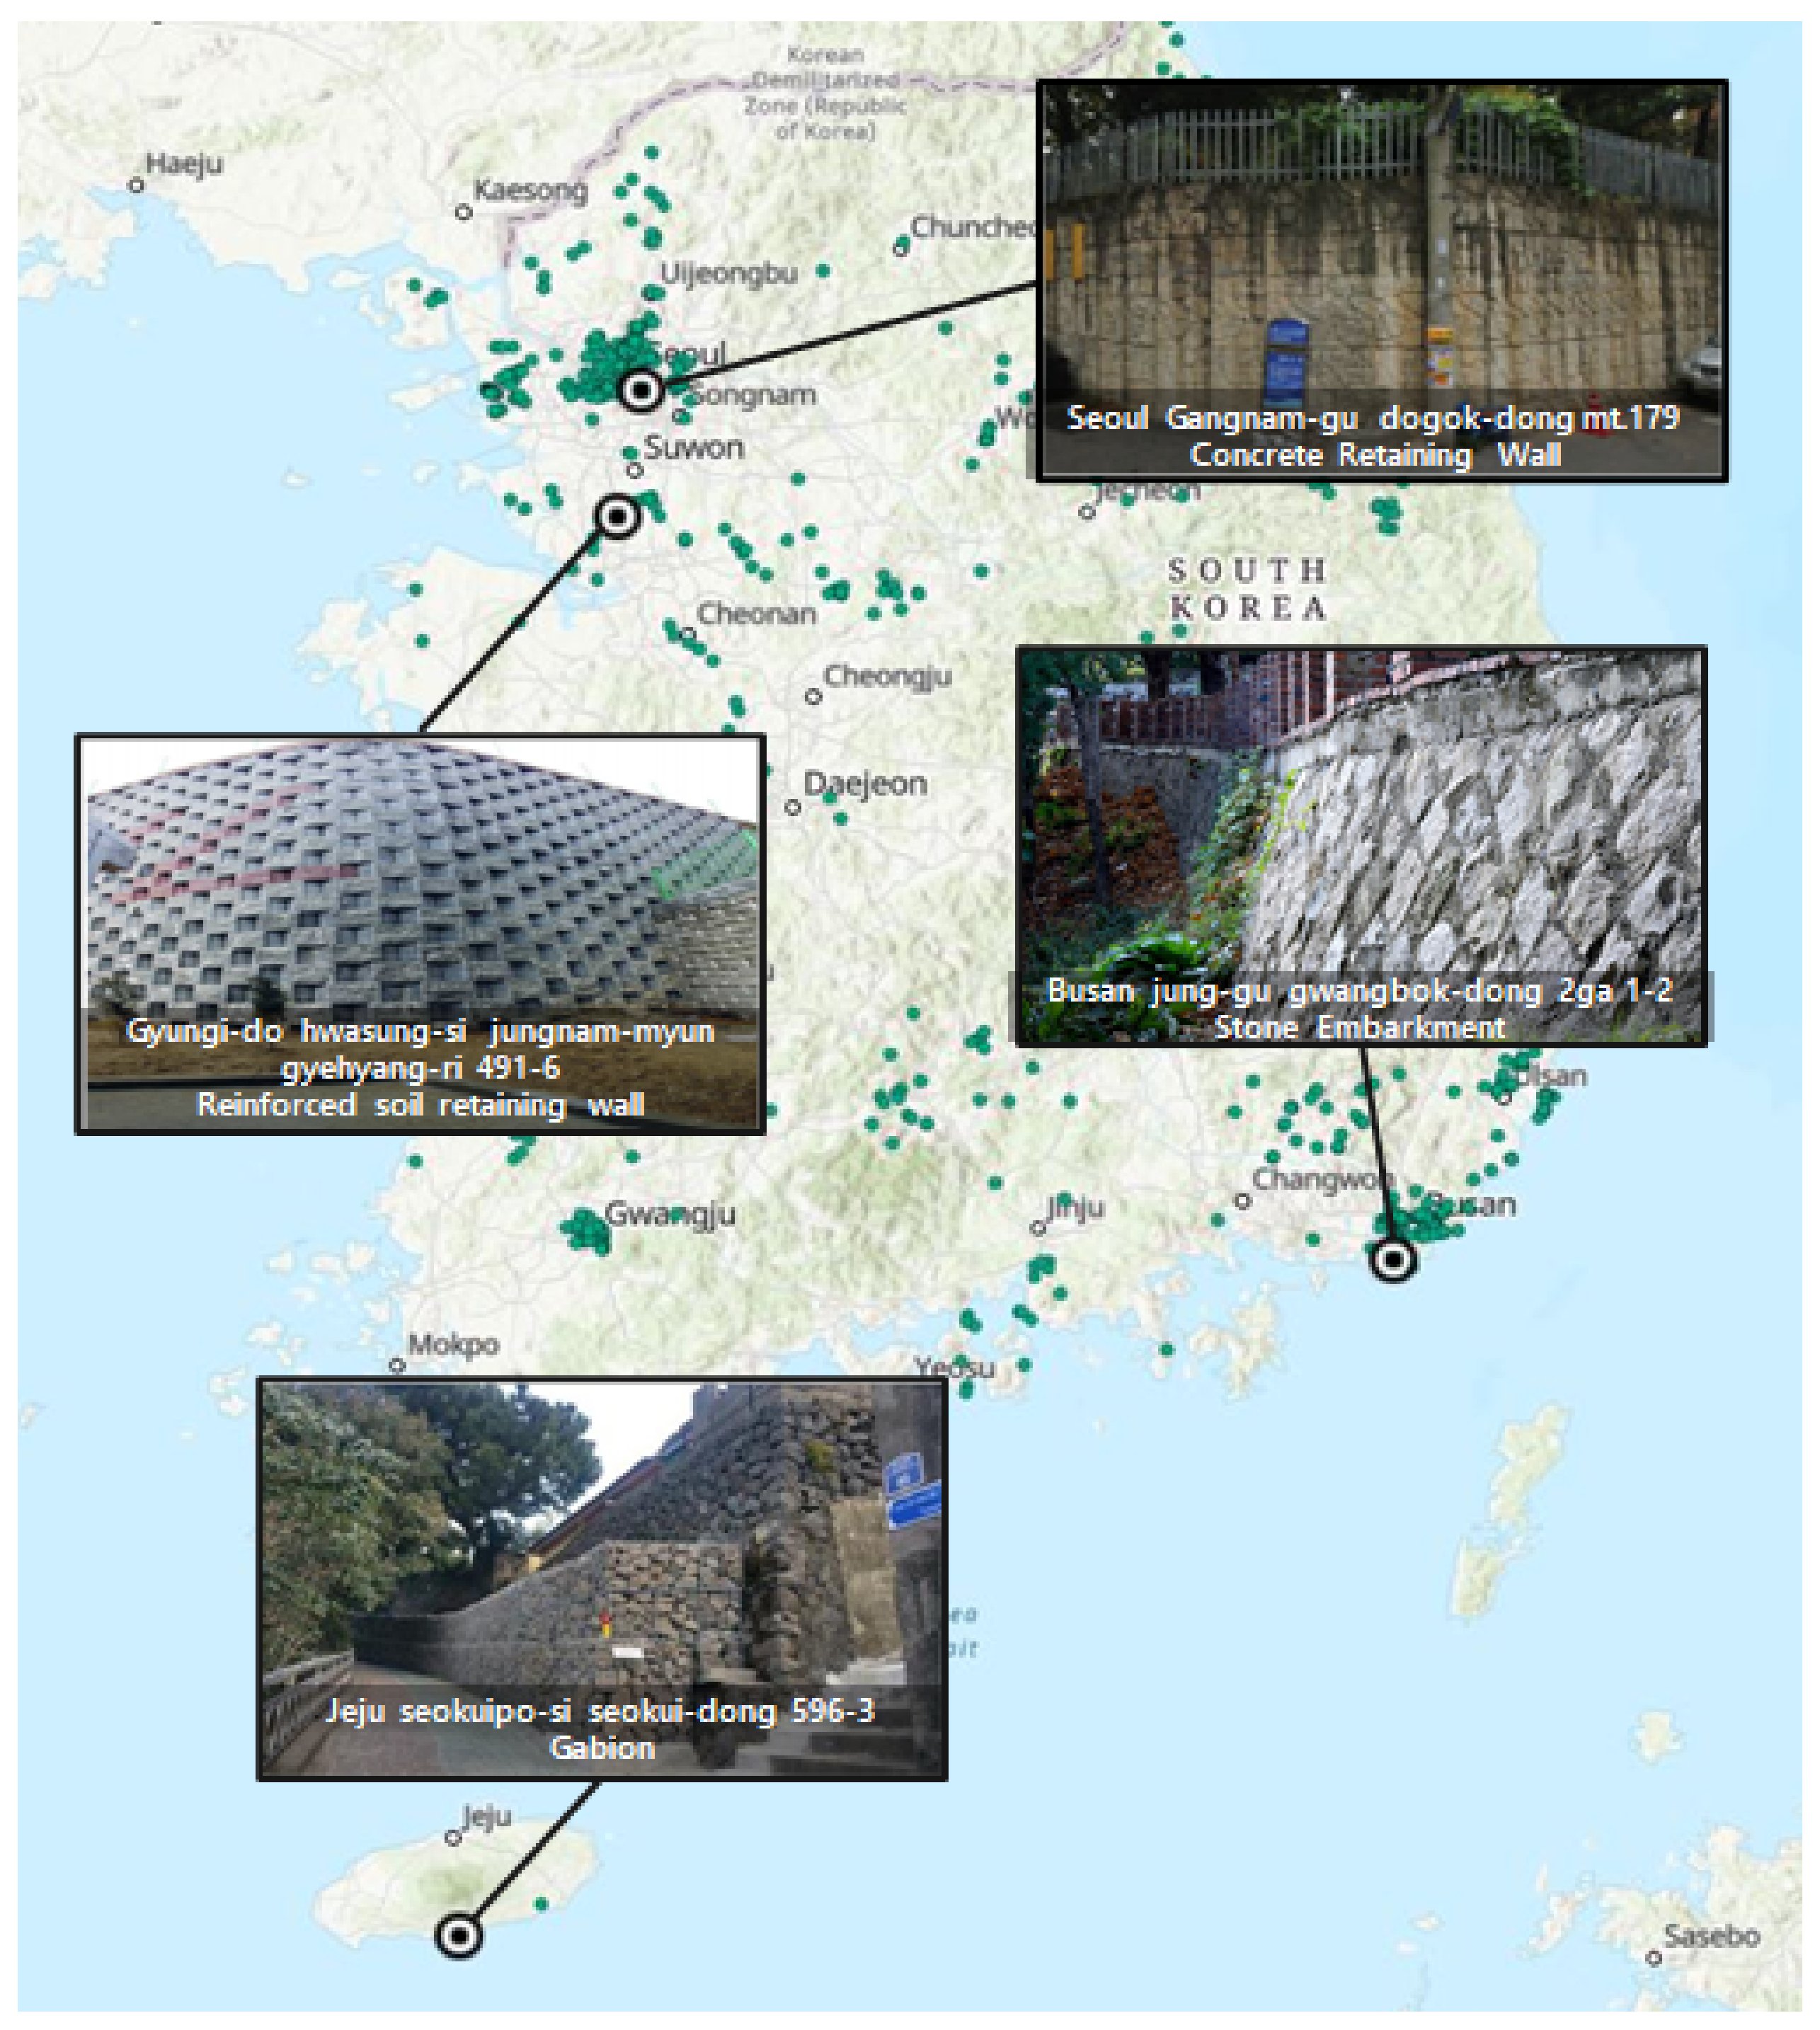
- Concrete Retaining Wall
- Reinforced Soil-Retaining Wall
- Stone Embankment
- Gabion
5.3. Producing Weights by Assessment Table Indicators
5.3.1. Principle of Scoring Criteria by Indicators
5.3.2. Results
- Concrete Retaining Wall
- Reinforced Soil-Retaining Wall
- Stone Embankment
- Gabion
6. Discussion and Conclusions
- The RW&E hazard assessment table for the front part, which was previously evaluated as a single type, was classified into four types.
- The person in charge of the assessment should select an evaluation indicator to ensure accuracy with minimal indicators and develop an evaluation table.
- The weights of each evaluation indicator were derived from an expert AHP analysis. As a result, objectivity and scientificity were guaranteed, and existing evaluation indicators were improved.
Author Contributions
Funding
Institutional Review Board Statement
Informed Consent Statement
Data Availability Statement
Conflicts of Interest
References
- Korea Forest Service (KFS). Forest Protection Act; Korea Ministry of Government Legislation (MOLEG): Seoul, Korea, 2020.
- Kyungbook National University (KNU). A Study on the Integrated Management of Landslide Hazardous Areas; Korea Forest Service (KFS): Daejeon, Korea, 2013.
- Ministry of Land, Infrastructure and Transport (MOLIT). National Land Planning and Utilization Act; Korea Ministry of Government Legislation (MOLEG): Seoul, Korea, 2020.
- Korea Expressway Corporation (KEC). Risk Assessment and Prevention of Debris Flows on Expressway; Korea Expressway Corporation (KEC): Gimcheon, Korea, 2017.
- Korea Forest Service (KFS). Guidelines for the Investigation and Designation and Management of Vulnerable Areas in Case of Landslides (Evaluation Table of Basic Surveys of Areas Feared to Cause Landslides); Korea Forest Service (KFS): Seoul, Korea, 2020.
- Korea Expressway Corporation (KEC). Development of Safety Evaluation and Reinforcement Techniques in the Reinforced Earth Retaining Walls; Korea Expressway Corporation (KEC): Gimcheon, Korea, 2017.
- Ministry of Land, Infrastructure and Transport (MOLIT). Special Act on the Safety Control and Maintenance of Establishments; Korea Ministry of Government Legislation (MOLEG): Seoul, Korea, 2020.
- Facility Management System. Available online: http://www.fms.or.kr/ (accessed on 20 October 2020).
- The Korea Infrastructure Safety Corporation (KISTEC). Safety Rating Manual for Class III Facilities; Ministry of Land Infrastructure and Transport (MOLIT): Seoul, Korea, 2018.
- The Korea Infrastructure Safety Corporation (KISTEC). Detailed Guidelines for Safety and Maintenance of Facilities (Safety Inspection and Diagnosis); Ministry of Land Infrastructure and Transport (MOLIT): Seoul, Korea, 2019. [Google Scholar]
- Choi, J.S. A Study on Selection of Target Performance for Performance Evaluation and Maintenance of Retaining Wall in Korea. J. Korean Geotech. Soc. 2019, 35, 111–121. [Google Scholar] [CrossRef]
- WisDOT. WisDOT Structure Inspection Manual Part 4—Ancillary Structures Chapter 4—Retaining Walls; WisDOT: Madison, WI, USA, 2017.
- EBA Engineering Consultants Ltd. Retaining Wall Guideline; City of Nanaimo: Nanaimo, BC, Canada, 2012. [Google Scholar]
- Butler, C.J. Evaluating Condition, Criticality, and Risk Through the Development of a Retaining Wall Inventory and Condition Assessment System. Master’s Thesis, North Carolina State University, Raleigh, NC, USA.
- Hearn, G. Feasibility of a Management System for Retaining Walls and Sound Barriers; Colorado Department of Transportation: Denver, CO, USA, 2003. [Google Scholar]
- Director of Civil Engineering and Development, The Government of the Hong Kong Special Administrative Region. Slope Safety Technical Review Board; Civil Engineering and Development Department: Kowloon, Hong Kong, 2018.
- Minnesota Department of Transportation—Office of Policy Analysis Research & Innovation Research Services. Transportation Research Synthesis—Asset Management for Retaining Walls; Minnesota Department of Transportation: Roseville, MN, USA, 2013.
- Zhou, X.; Sun, Z. Quantitative assessment of landslide risk using Monte Carlo material point method. Eng. Comput. (Swans., Wales) 2019, 37, 1577–1596. [Google Scholar] [CrossRef]
- Lin, G.F.; Chang, M.J.; Huang, Y.C.; Ho, J.Y. Assessment of susceptibility to rainfall-induced landslides using improved self-organizing linear output map, support vector machine, and logistic regression. Eng. Geol. 2017, 224, 62–74. [Google Scholar] [CrossRef]
- Aditian, A.; Kubota, T.; Shinohara, Y. Comparison of GIS-based landslide susceptibility models using frequency ratio, logistic regression, and artificial neural network in a tertiary region of Ambon, Indonesia. Geomorphology 2018, 318, 101–111. [Google Scholar] [CrossRef]
- Bǎlteanu, D.; Chendeş, V.; Sima, M.; Enciu, P. A country-wide spatial assessment of landslide susceptibility in Romania. Geomorphology 2010, 124, 102–112. [Google Scholar] [CrossRef]
- Depicker, A.; Jacobs, L.; Delvaux, D.; Havenith, H.B.; Maki Mateso, J.C.; Govers, G.; Dewitte, O. The added value of a regional landslide susceptibility assessment: The western branch of the East African Rift. Geomorphology 2020, 353, 106886. [Google Scholar] [CrossRef]
- Fan, L.; Lehmann, P.; McArdell, B.; Or, D. Linking rainfall-induced landslides with debris flows runout patterns towards catchment scale hazard assessment. Geomorphology 2017, 280, 1–15. [Google Scholar] [CrossRef]
- Basu, T.; Pal, S. RS-GIS based morphometrical and geological multi-criteria approach to the landslide susceptibility mapping in Gish River Basin, West Bengal, India. Adv. Sp. Res. 2019, 63, 1253–1269. [Google Scholar] [CrossRef]
- Kolat, Ç.; Doyuran, V.; Ayday, C.; Lütfi Süzen, M. Preparation of a geotechnical microzonation model using Geographical Information Systems based on Multicriteria Decision Analysis. Eng. Geol. 2006, 87, 241–255. [Google Scholar] [CrossRef]
- Lyu, H.M.; Shen, J.S.; Arulrajah, A. Assessment of geohazards and preventative countermeasures using AHP incorporated with GIS in Lanzhou, China. Sustainability 2018, 10, 304. [Google Scholar] [CrossRef]
- Wu, C.H.; Chen, S.C. Determining landslide susceptibility in Central Taiwan from rainfall and six site factors using the analytical hierarchy process method. Geomorphology 2009, 112, 190–204. [Google Scholar] [CrossRef]
- Komac, M. A landslide susceptibility model using the Analytical Hierarchy Process method and multivariate statistics in perialpine Slovenia. Geomorphology 2006, 74, 17–28. [Google Scholar] [CrossRef]
- Yoshimatsu, H.; Abe, S. A review of landslide hazards in Japan and assessment of their susceptibility using an analytical hierarchic process (AHP) method. Landslides 2006, 3, 149–158. [Google Scholar] [CrossRef]
- Ayalew, L.; Yamagishi, H.; Marui, H.; Kanno, T. Landslides in Sado Island of Japan: Part II. GIS-based susceptibility mapping with comparisons of results from two methods and verifications. Eng. Geol. 2005, 81, 432–445. [Google Scholar] [CrossRef]
- Du, J.; Glade, T.; Woldai, T.; Chai, B.; Zeng, B. Landslide susceptibility assessment based on an incomplete landslide inventory in the Jilong Valley, Tibet, Chinese Himalayas. Eng. Geol. 2020, 270, 105572. [Google Scholar] [CrossRef]
- Erener, A.; Mutlu, A.; Sebnem Düzgün, H. A comparative study for landslide susceptibility mapping using GIS-based multi-criteria decision analysis (MCDA), logistic regression (LR) and association rule mining (ARM). Eng. Geol. 2016, 203, 45–55. [Google Scholar] [CrossRef]
- Vega, J.A.; Hidalgo, C.A. Quantitative risk assessment of landslides triggered by earthquakes and rainfall based on direct costs of urban buildings. Geomorphology 2016, 273, 217–235. [Google Scholar] [CrossRef]
- Ghosh, S.; Carranza, E.J.M.; van Westen, C.J.; Jetten, V.G.; Bhattacharya, D.N. Selecting and weighting spatial predictors for empirical modeling of landslide susceptibility in the darjeeling himalayas (india). Geomorphology 2011, 131, 35–56. [Google Scholar] [CrossRef]
- Forman, E.H. Random indices for incomplete pairwise comparison matrices. Eur. J. Oper. Res. 1990, 48, 153–155. [Google Scholar] [CrossRef]
- Duan, X. Risk evaluation method for slope treatment works based on judgment matrix and aggregated AHP. Int. J. Simul. Syst. Sci. Technol. 2016, 17, 28.1–28.5. [Google Scholar] [CrossRef]
- Chaturvedi, P.; Srivastava, S.; Bhutiyani, M.R. Application of analytical hierarchy process in decision support software for control measure (DSSCM) to mitigate landslide risk. J. Eng. Geol. 2017, 42, 147–154. [Google Scholar]
- Liu, Y.C.; Chen, C.S. A new approach for application of rock mass classification on rock slope stability assessment. Eng. Geol. 2007, 89, 129–143. [Google Scholar] [CrossRef]
- Hung, L.Q.; Van, N.T.H.; Duc, D.M.; Ha, L.T.C.; Van Son, P.; Khanh, N.H.; Binh, L.T. Landslide susceptibility mapping by combining the analytical hierarchy process and weighted linear combination methods: A case study in the upper Lo River catchment (Vietnam). Landslides 2016, 13, 1285–1301. [Google Scholar] [CrossRef]
- Ma, F.; Wang, J.; Yuan, R.; Zhao, H.; Guo, J. Application of analytical hierarchy process and least-squares method for landslide susceptibility assessment along the Zhong-Wu natural gas pipeline, China. Landslides 2013, 10, 481–492. [Google Scholar] [CrossRef]
- Daneshvar, M.R.M. Landslide susceptibility zonation using analytical hierarchy process and GIS for the Bojnurd region, northeast of Iran. Landslides 2014, 11, 1079–1091. [Google Scholar] [CrossRef]
- Mandal, B.; Mandal, S. Analytical hierarchy process (AHP) based landslide susceptibility mapping of Lish river basin of eastern Darjeeling Himalaya, India. Adv. Sp. Res. 2018, 62, 3114–3132. [Google Scholar] [CrossRef]
- Yan, F.; Zhang, Q.; Ye, S.; Ren, B. A novel hybrid approach for landslide susceptibility mapping integrating analytical hierarchy process and normalized frequency ratio methods with the cloud model. Geomorphology 2019, 327, 170–187. [Google Scholar] [CrossRef]
- Ministry of the Interior and Safety (MOIS). Prevention of Steep Slope Disasters Act; Korea Ministry of Government Legislation (MOLEG): Seoul, Korea, 2020.
- The Board of Audit and Inspection of Korea (BAI). Audit Report on the Safety Management of Accident Hazardous Slope; The Board of Audit and Inspection of Korea (BAI): Seoul, Korea, 2019.
- Ministry of the Interior and Safety (MOIS). Criteria for Evaluating the Hazard of Steep Slopes; Ministry of the Interior and Safety (MOIS): Sejong, Korea, 2018.
- Saaty, L.T. A scaling method for priorities in hierarchical structures. J. Math. Psychol. 1977, 15, 234–281. [Google Scholar] [CrossRef]
- Saaty, L.T. The Analytic Hierarchy Process; McGraw-Hill International: New York, NY, USA, 1980. [Google Scholar]
- Zahedi, F. The Analytic Hierarchy Process—A Survey of the Method and its Applications. Interfaces (Providence) 1986, 16, 96–108. [Google Scholar] [CrossRef]
- Yoon, J.G. Application effects and limitations of AHP as a research methodology—A comparison of 3 statistical technique for evaluation MIS success factor. J. Korean Oper. Res. Manag. Science Soc. 1996, 21, 109–125. [Google Scholar]
- Korea Occupational Safety and Health Agency (KOSHA). Statement of Work for Disaster Risk Assessment Items; Ministry of the Interior and Safety (MOIS): Sejong, Korea, 2017.


| Affiliated Organization | Number of Steep Slopes |
|---|---|
| Local Government | 10,383 |
| Local Forest Service | 357 |
| Korea Rural Community Corporation | 30 |
| Korea Land & Housing Corporation | 45 |
| Korea Rail Network Authority | 1968 |
| Metropolitan Transit Corporation | 27 |
| Korea National Park Service | 467 |
| Other (e.g., individuals, corporations) | 1798 |
| Total | 15,075 |
| Performance | Sub-Performance | Indicator | Concrete | Reinforced | Stone | Gabion | ||
|---|---|---|---|---|---|---|---|---|
| Safety | Condition safety | Settlement | ○ | ○ | ○ | ○ | ||
| Sliding | ○ | ○ | ○ | ○ | ||||
| Drainage, slope angle, rockfall, leaching water | ○ | ○ | ○ | |||||
| Planned linear error (overturing, inclination) | ○ | ○ | ||||||
| Breakage damage cracking | ○ | |||||||
| Breakage damage (material separation) | ○ | |||||||
| Cracks | ○ | |||||||
| Surface degradation (wear, erosion, peeling, fall) | ○ | ○ | ||||||
| Condition of the drain | ○ | |||||||
| Various phases | ○ | |||||||
| Rebar exposure | ○ | ○ | ○ | ○ | ||||
| Scour | ○ | ○ | ||||||
| Front progressive filling | ○ | |||||||
| Progressive deformation | ○ | ○ | ||||||
| Washout | ○ | ○ | ||||||
| Spacing | ○ | |||||||
| Filling concrete condition | ○ | |||||||
| Filling material loss | ○ | |||||||
| Wire mesh breakage and damage | ○ | |||||||
| Wire mesh binding condition | ○ | |||||||
| Safety | Structural safety | External structural safety | Bottom sliding (normal/earthquake) | ○ | ○ | ○ | ○ | |
| Circle sliding (normal/earthquake) | ○ | ○ | ○ | ○ | ||||
| Overturing (normal/earthquake) | ○ | ○ | ○ | ○ | ||||
| Settlement | ○ | ○ | ○ | ○ | ||||
| Bearing capacity (normal/earthquake) | ○ | ○ | ○ | ○ | ||||
| Internal structural safety | Concrete wall | Design shear strength | ○ | |||||
| Design bending moment | ○ | |||||||
| Reinforced concrete wall | Safety of tensile destruction | ○ | ||||||
| Safety of breaking | ○ | |||||||
| Stone wall | Average width of wall | ○ | ||||||
| Durability | Concrete/Reinforced | Deterioration growing | Chloride penetration | ○ | ○ | |||
| Carbonation depth | ○ | ○ | ||||||
| Concrete quality of surface concrete | ○ | ○ | ||||||
| Deterioration condition | Salty condition | ○ | ○ | |||||
| Freezing condition | ○ | |||||||
| Stone condition | Estimated strength | ○ | ||||||
| Weathering degree | ○ | |||||||
| Country/Institution | Potential Indicators from Literature Review |
|---|---|
| South Korea/KALIS | subsidence, activity, breakage, damage, drainage, scour, back-filling material, corrosion, loss |
| Japan/MLIT | drainage facilities, cracks, lateral drifts, subsidence, and fullness |
| Japan/JRA | wall damage (i.e., cracks and defects), fullness, foundation conditions, drainage facilities, structures, auxiliary structures, topographic characteristics, and damage target facilities |
| United States/FHWA | corrosion, deterioration, cracks, damage, subsidence, scour, wire mesh, drainage |
| United States/DOT for each state | capping, draining, joint sidewalls, roadways, slopes, backfills |
| Canada/City of Nanaimo | (wall) tiling, joint, cracks, missing, timber, and staining (soil) settlement, tension cracks, hazard historical data, erosion, and excessive moisture in the backfill |
| France/LCPC | range of influence, drainage facility, structure |
| 1st Category | 2nd Category | 3rd Category, Indicators | 4th Category, Evaluation Standard and Distribution | |
|---|---|---|---|---|
| Collapse risk (70) | Foundation part | Subsidence (cm) | - Selection of indicators and evaluation standard by type through feasibility review Determination of distribution by evaluation standard through AHP | |
| Lateral Drift (cm) | ||||
| Scour | Concrete retaining wall | |||
| Reinforced soil-retaining wall | ||||
| Stone embankment | ||||
| Front part (major revision object) | Breakage and Damage (mm) | |||
| Cracks (mm) | ||||
| Abrasion/erosion | ||||
| Exfoliation and Separation of layers (mm) | ||||
| Rebar exposure (%) | ||||
| Conduction and Fullness | ||||
| Efflorescence | ||||
| Outlet | ||||
| Social influence (30) | Circumstances | |||
| Number of people affected/road lanes, traffic volume | A ‘steep slope’ adjacent to the road | Road lane number (one way) | ||
| Traffic volume (number of cars/day) | ||||
| Other areas | The estimated number of people affected | |||
| Distance from ‘steep slope’ (i.e., to land and adjacent facilities) | ||||
| Grade | Risk Assessment Criterion | Note | ||
|---|---|---|---|---|
| Natural Slope or Mountainous Region | Artificial Slope | Retaining Wall & Embankment | ||
| A | 0–20 | 0–20 | 0–20 |
|
| B | 21–40 | 21–40 | 21–40 |
|
| C | 41–60 | 41–60 | 41–60 |
|
| D | 61–80 | 61–80 | 61–80 |
|
| E | >81 | >81 | >81 |
|
| Collapse risk (70) | Front part | Conduction • Fullness | Non-existence | Existence |
| 0 | 5 | |||
| Efflorescence | Non-existence | Existence | ||
| 0 | 5 |
| Collapse risk (70) | Front part | Cracks (mm) | <0–0.1 | >0.1–<0.2 | >0.2–<0.3 | >0.3–<0.5 | >0.5 |
| 1 | 3 | 5 | 7 | 10 |
| Division | 09.09 | 11.11.25 | 15.4.2 | 15.10.20 | 17.4.21 | 17.7.26 | 18.1.29 | 20.4.3 | ||
|---|---|---|---|---|---|---|---|---|---|---|
| Collapse risk (70) | Foundation part | Subsidence | ● | ● | ● | ● | ● | ● | ● | ● |
| Lateral Drift | ● | ● | ● | ● | ● | ● | ● | ● | ||
| Scour | ● | ● | ● | ● | ●(1) | ● | ● | ● | ||
| Front part | Breakage and Damage | ● | ● | ● | ● | ●△ | ● | ● | ● | |
| Cracks | ● | ● | ● | ● | ●△ | ● | ● | ●(2) | ||
| Abrasion/erosion | ● | ● | ● | ●■ | ● | ● | ● | ● | ||
| Exfoliation | ● | ● | ● | |||||||
| Exfoliation and Separation of Layers | ● | ● | ● | ●(3) | ● | ● | ● | ● | ||
| Rebar exposure | ● | ● | ● | ● | ● | ● | ● | ● | ||
| Efflorescence | ● | ● | ●■ | ● | ● | ● | ●△■ | |||
| Conduction and Fullness | ● | ● | ● | ● | ●(4) | |||||
| Chloride | ● | |||||||||
| Outlet | ● | ● | ● | ●■ | ● | ● | ● | ● | ||
| Social influence (30) | Circumstances | ● | ● | ● | ● | ● | ● | ● | ● | |
| The estimated number of people affected | ● | ●(5) | ● | ● | ● | ● | ● | ● | ||
| Distance from ‘steep slope’-land and the adjacent facilities | ● | ● | ●△■ | ●△■(6) | ●(7) | ● | ● | ● | ||
| Traffic volume | ● | ● | ● | ● | ● | ● | ||||
| Road lane number | ● | ●■ | ● | ● | ● | ● | ● | |||
| Divisions | Indicators | Evaluation Standards | ||||
|---|---|---|---|---|---|---|
| 1st Layer | 2nd Layer | 3rd Layer | ||||
| Concrete | Breakage and Damage (mm) | None | >0–<5 | >5–<10 | >10–<20 | >20 |
| Cracks (mm) | <0–0.1 | >0.1–<0.2 | >0.2–<0.3 | >0.3–<0.5 | >0.5 | |
| Abrasion/erosion | None | Slight | Slightly bad | Bad | Very bad | |
| Exfoliation and Separation of layers (mm) | 0–10 | 11–15 | 16–20 | 21–25 | >26 | |
| Rebar exposure(%) | 0 | 0.1–1 | 1.1–3 | 3.1–5 | >5.1 | |
| Efflorescence | None– partial discovery | Found many places–Distributed carefully and widely | ||||
| Reinforced soil-retaining wall | Breakage, Damage, and Cracks | None | Surface damage | Surface damage, Damage progressible status | Partial damage and damage scale expansion status | Very Severe, Broken Function |
| Loss | Non-existent | Observed | ||||
| Separation | None | Slight | Slightly bad | Bad | Very bad | |
| Conduction • Fullness | None | Slight Inactive state | Slightly bad State in progress | Bad Condition affecting structural stability | Very bad Condition that significantly affects structural stability | |
| Stone embankment | Breakage, Damage, and Cracks | None | Surface damage | Surface damage, Damage progressible status | Partial damage and damage scale expansion status | Very Severe, Broken Function |
| Loss | None | Slight | Slightly bad | Bad | Very bad | |
| Separation | None | Slight | Slightly bad | Bad | Very bad | |
| Conduction • Fullness | None | Slight Inactive state | Slightly bad State in progress | Bad Condition affecting structural stability | Very bad Condition that significantly affects structural stability | |
| Filling concrete | Good | Micro -crack generation | Partial crack occurrence not serious condition | Filled concrete, weathering condition | Lost state | |
| Delete (hard to determine grade) | ||||||
| Gabion | Loss of filling material | None | >0–<5 | >5–<10 | >10–<20 | >20 |
| Progressive deformation | None | Slight | Slightly bad | Bad | Very bad | |
| United wire mesh condition | Strain-proof wire mesh with three or more layers horizontally and vertically | Strain-proof wire mesh with two or more layers horizontally and vertically | Strain-proof wire mesh with one or more layers horizontally and vertically | Strain-proof wire mesh with one horizontally and vertically | No strain-proof wire mesh | |
| Fullness | None | Slight Inactive state | Slightly bad State in progress | Bad Condition affecting structural stability | Very bad Condition that significantly affects structural stability | |
| Wire Breakage | None | Slightness | Slightness Possible additional damage | Breakage progress Loss of fillings in progress | Wire breakage Impaction on structural stability | |
| Expert’s No. | Concrete | Reinforced Soil | Stone Embankment | Gabion |
| RI | 1.21 | 0.90 | 1.12 | 1.12 |
| 1 | 0.028234 | 0.017057 | 0.027232 | 0.015268 |
| 2 | 0.091508 | 0.096377 | 0.028571 | 0.047411 |
| 3 | 0.053532 | 0.000000 | 0.027679 | 0 |
| 4 | 0.029911 | 0.044327 | 0.031339 | 0.042054 |
| 5 | 0.112556 | 0.053369 | 0.03402 | 0.056518 |
| 6 | 0.013113 | 0.007670 | 0.007411 | 0.008125 |
| 7 | 0.013113 | 0.011497 | 0.015268 | 0.015268 |
| 8 | 0.035153 | 0.068682 | 0.053839 | 0.016786 |
| 9 | 0.019169 | 0.032781 | 0.040089 | 0.005893 |
| 10 | 0.033250 | 0.026258 | 0.120893 | 0.063571 |
| 11 | 0.296516 | 0.000000 | 0.002946 | 0.022946 |
| 12 | 0.077371 | 0.007634 | 0.033929 | 0.017589 |
| 13 | 0.018169 | 0.003844 | 0 | 0 |
| 14 | 0.316710 | 0.077729 | 0.161161 | 0.091518 |
| 15 | 0.068024 | 0.097966 | 0.121071 | 0.003723 |
| 16 | 0.071177 | 0.059134 | 0.071786 | 0.194554 |
| 17 | 0.009613 | 0.007643 | 0.004464 | 0.002946 |
| 18 | 0.000000 | 0.072272 | 0.004464 | 0 |
| 19 | 0.021241 | 0.045084 | 0.043661 | 0.06625 |
| 20 | 0.192430 | 0.193428 | 0.189107 | 0.189107 |
| 21 | 0.098955 | 0.044128 | 0.105893 | 0.141071 |
| <0.1 | 0.004 | 0.0017 | 0.00071 | 0.005 |
| Indicator by Type | Risk of Collapse (45) | Front Part | ||||
|---|---|---|---|---|---|---|
| Division | Evaluation Standard and Distribution | |||||
| Concrete | Breakage and Damage (mm) | None | >0–<5 | >5–<10 | >10–<20 | >20 |
| 0 | 2.65 | 5.3 | 7.95 | 10.5 | ||
| Cracking (mm) | <0–0.1 | >0.1–<0.2 | >0.2–<0.3 | >0.3–<0.5 | >0.5 | |
| 1.92 | 3.84 | 5.76 | 7.68 | 9.5 | ||
| Abrasion/erosion | None | Slight | Slightly bad | Bad | Very bad | |
| 0 | 1.05 | 2.1 | 3.15 | 4.2 | ||
| Exfoliation and Separation of layers (mm) | 0–10 | 11–15 | 16–20 | 21–25 | >26 | |
| 1.16 | 2.32 | 3.48 | 4.64 | 5.8 | ||
| Rebar exposure (%) | 0 | 0.1–1 | 1.1–3 | 3.1–5 | >5.1 | |
| 0 | 2.9 | 5.8 | 8.7 | 11.6 | ||
| Efflorescence | None ~partial discovery | Found many places ~Distributed carefully and widely | ||||
| 0 | 3.4 | |||||
| Reinforced soil -retaining wall | Breakage, Damage (mm), and Cracks | None | Surface damage | Surface damage, Damage progressible status | Partial damage and damage scale expansion status | Very Severe, Broken Function |
| 0 | 2.125 | 4.25 | 6.375 | 8.5 | ||
| Loss | Non-existent | Existence | ||||
| 0 | 9.6 | |||||
| Separation | None | Slight | Slightly bad | Bad | Very bad | |
| 0 | 1.725 | 3.45 | 5.175 | 6.9 | ||
| Fullness | None | Slight Inactive state | Slightly bad State in progress | Bad Condition affecting structural stability | Very bad Condition that significantly affects structural stability | |
| 0 | 5 | 10 | 15 | 20 | ||
| Stone embankment | Breakage, Damage (mm), and Cracks | None | Surface damage | Surface damage, Damage progressible status | Partial damage and damage scale expansion status | Very severe, Broken Function |
| 0 | 2.2 | 4.4 | 6.6 | 8.8 | ||
| Loss | None | Slight | Slightly bad | Bad | Very bad | |
| 0 | 2.2 | 4.4 | 6.6 | 8.8 | ||
| Separation | None | Slight | Slightly bad | Bad | Very bad | |
| 0 | 1.45 | 2.9 | 4.35 | 5.8 | ||
| Fullness | None | Slight Inactive state | Slightly bad State in progress | Bad Condition affecting structural stability | Very bad Condition that significantly affects structural stability | |
| 0 | 3.8 | 7.6 | 11.4 | 15.2 | ||
| Filling concrete | Good | Micro -crack generation | Partial crack occurrence Not serious condition | Filled concrete Weathering condition | Lost state | |
| 0 | 1.6 | 3.2 | 4.8 | 6.4 | ||
| Weathering degree of rock | Delete | |||||
| Gabion | Loss of filling material | None | >0–<5 | >5–>10 | >10–<20 | >20 |
| 0 | 1.625 | 3.25 | 4.875 | 6.5 | ||
| Progressive deformation | None | Slight | Slightly bad | Bad | Very bad | |
| 0 | 2.225 | 4.45 | 6.675 | 8.9 | ||
| United wire mesh condition | Strain-proof wire mesh with three or more layers horizontally and vertically | Strain-proof wire mesh with two or more layers horizontally and vertically | Strain-proof wire mesh with one or more layers horizontally and vertically | Strain-proof wire mesh with one horizontally and vertically | No strain-proof wire mesh | |
| 1.76 | 3.52 | 5.28 | 7.04 | 8.8 | ||
| Fullness | None | Slight Inactive state | Slightly bad State in progress | Bad Condition affecting structural stability | Very bad Condition that significantly affects structural stability | |
| 0 | 2.4 | 4.8 | 7.2 | 9.6 | ||
| Wire Breakage | None | Slight | Slight Possible Additional Damage | Breakage progress Loss of fillings in progress | Wire breakage Impaction on structural stability | |
| 0 | 2.8 | 5.6 | 8.4 | 11.2 | ||
Publisher’s Note: MDPI stays neutral with regard to jurisdictional claims in published maps and institutional affiliations. |
© 2021 by the authors. Licensee MDPI, Basel, Switzerland. This article is an open access article distributed under the terms and conditions of the Creative Commons Attribution (CC BY) license (http://creativecommons.org/licenses/by/4.0/).
Share and Cite
Lee, J.; Lee, H.; Yun, H.; Kang, C.; Song, M. Improved Vulnerability Assessment Table for Retaining Walls and Embankments from a Working-Level Perspective in Korea. Sustainability 2021, 13, 1088. https://doi.org/10.3390/su13031088
Lee J, Lee H, Yun H, Kang C, Song M. Improved Vulnerability Assessment Table for Retaining Walls and Embankments from a Working-Level Perspective in Korea. Sustainability. 2021; 13(3):1088. https://doi.org/10.3390/su13031088
Chicago/Turabian StyleLee, Jaejoon, Hyunji Lee, Hongsik Yun, Chol Kang, and Moonsoo Song. 2021. "Improved Vulnerability Assessment Table for Retaining Walls and Embankments from a Working-Level Perspective in Korea" Sustainability 13, no. 3: 1088. https://doi.org/10.3390/su13031088
APA StyleLee, J., Lee, H., Yun, H., Kang, C., & Song, M. (2021). Improved Vulnerability Assessment Table for Retaining Walls and Embankments from a Working-Level Perspective in Korea. Sustainability, 13(3), 1088. https://doi.org/10.3390/su13031088