
Traffic Simulation Analysis of Bicycle Highways in Urban Areas

 ,
,  ,
,
Abstract
1. Introduction
2. Literature Review
2.1. Bicycle Highways
2.2. Design Guidelines for Bicycle Highways
2.3. Bicycle Traffic Control
2.4. Review Summary
3. Methodology
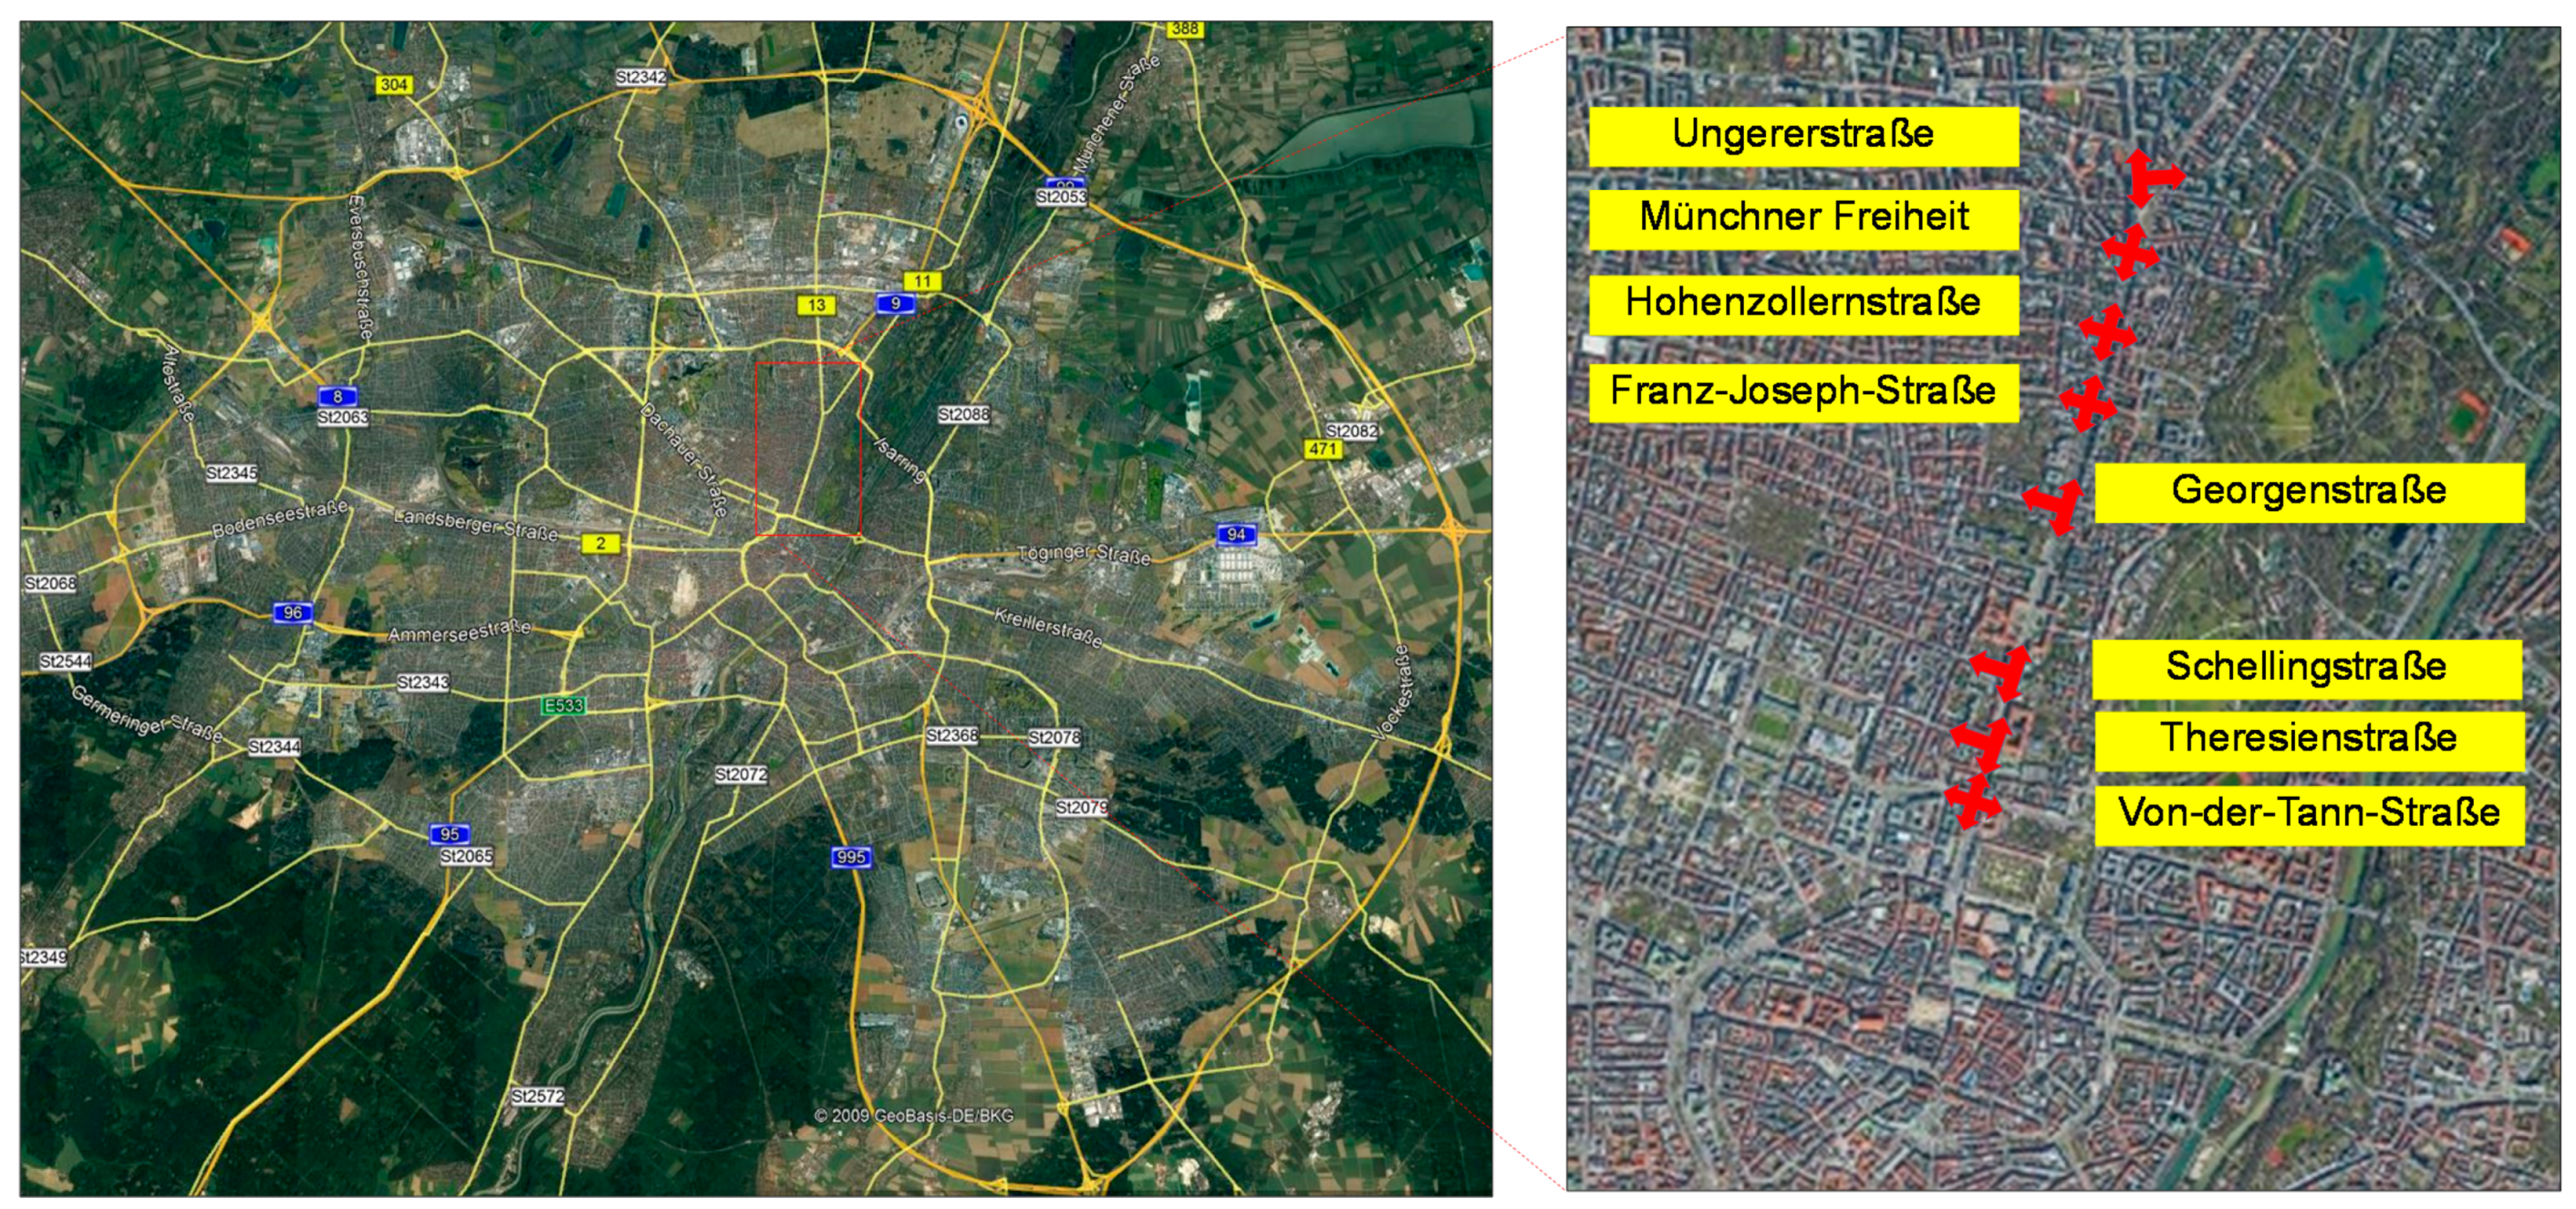
3.1. Study Area
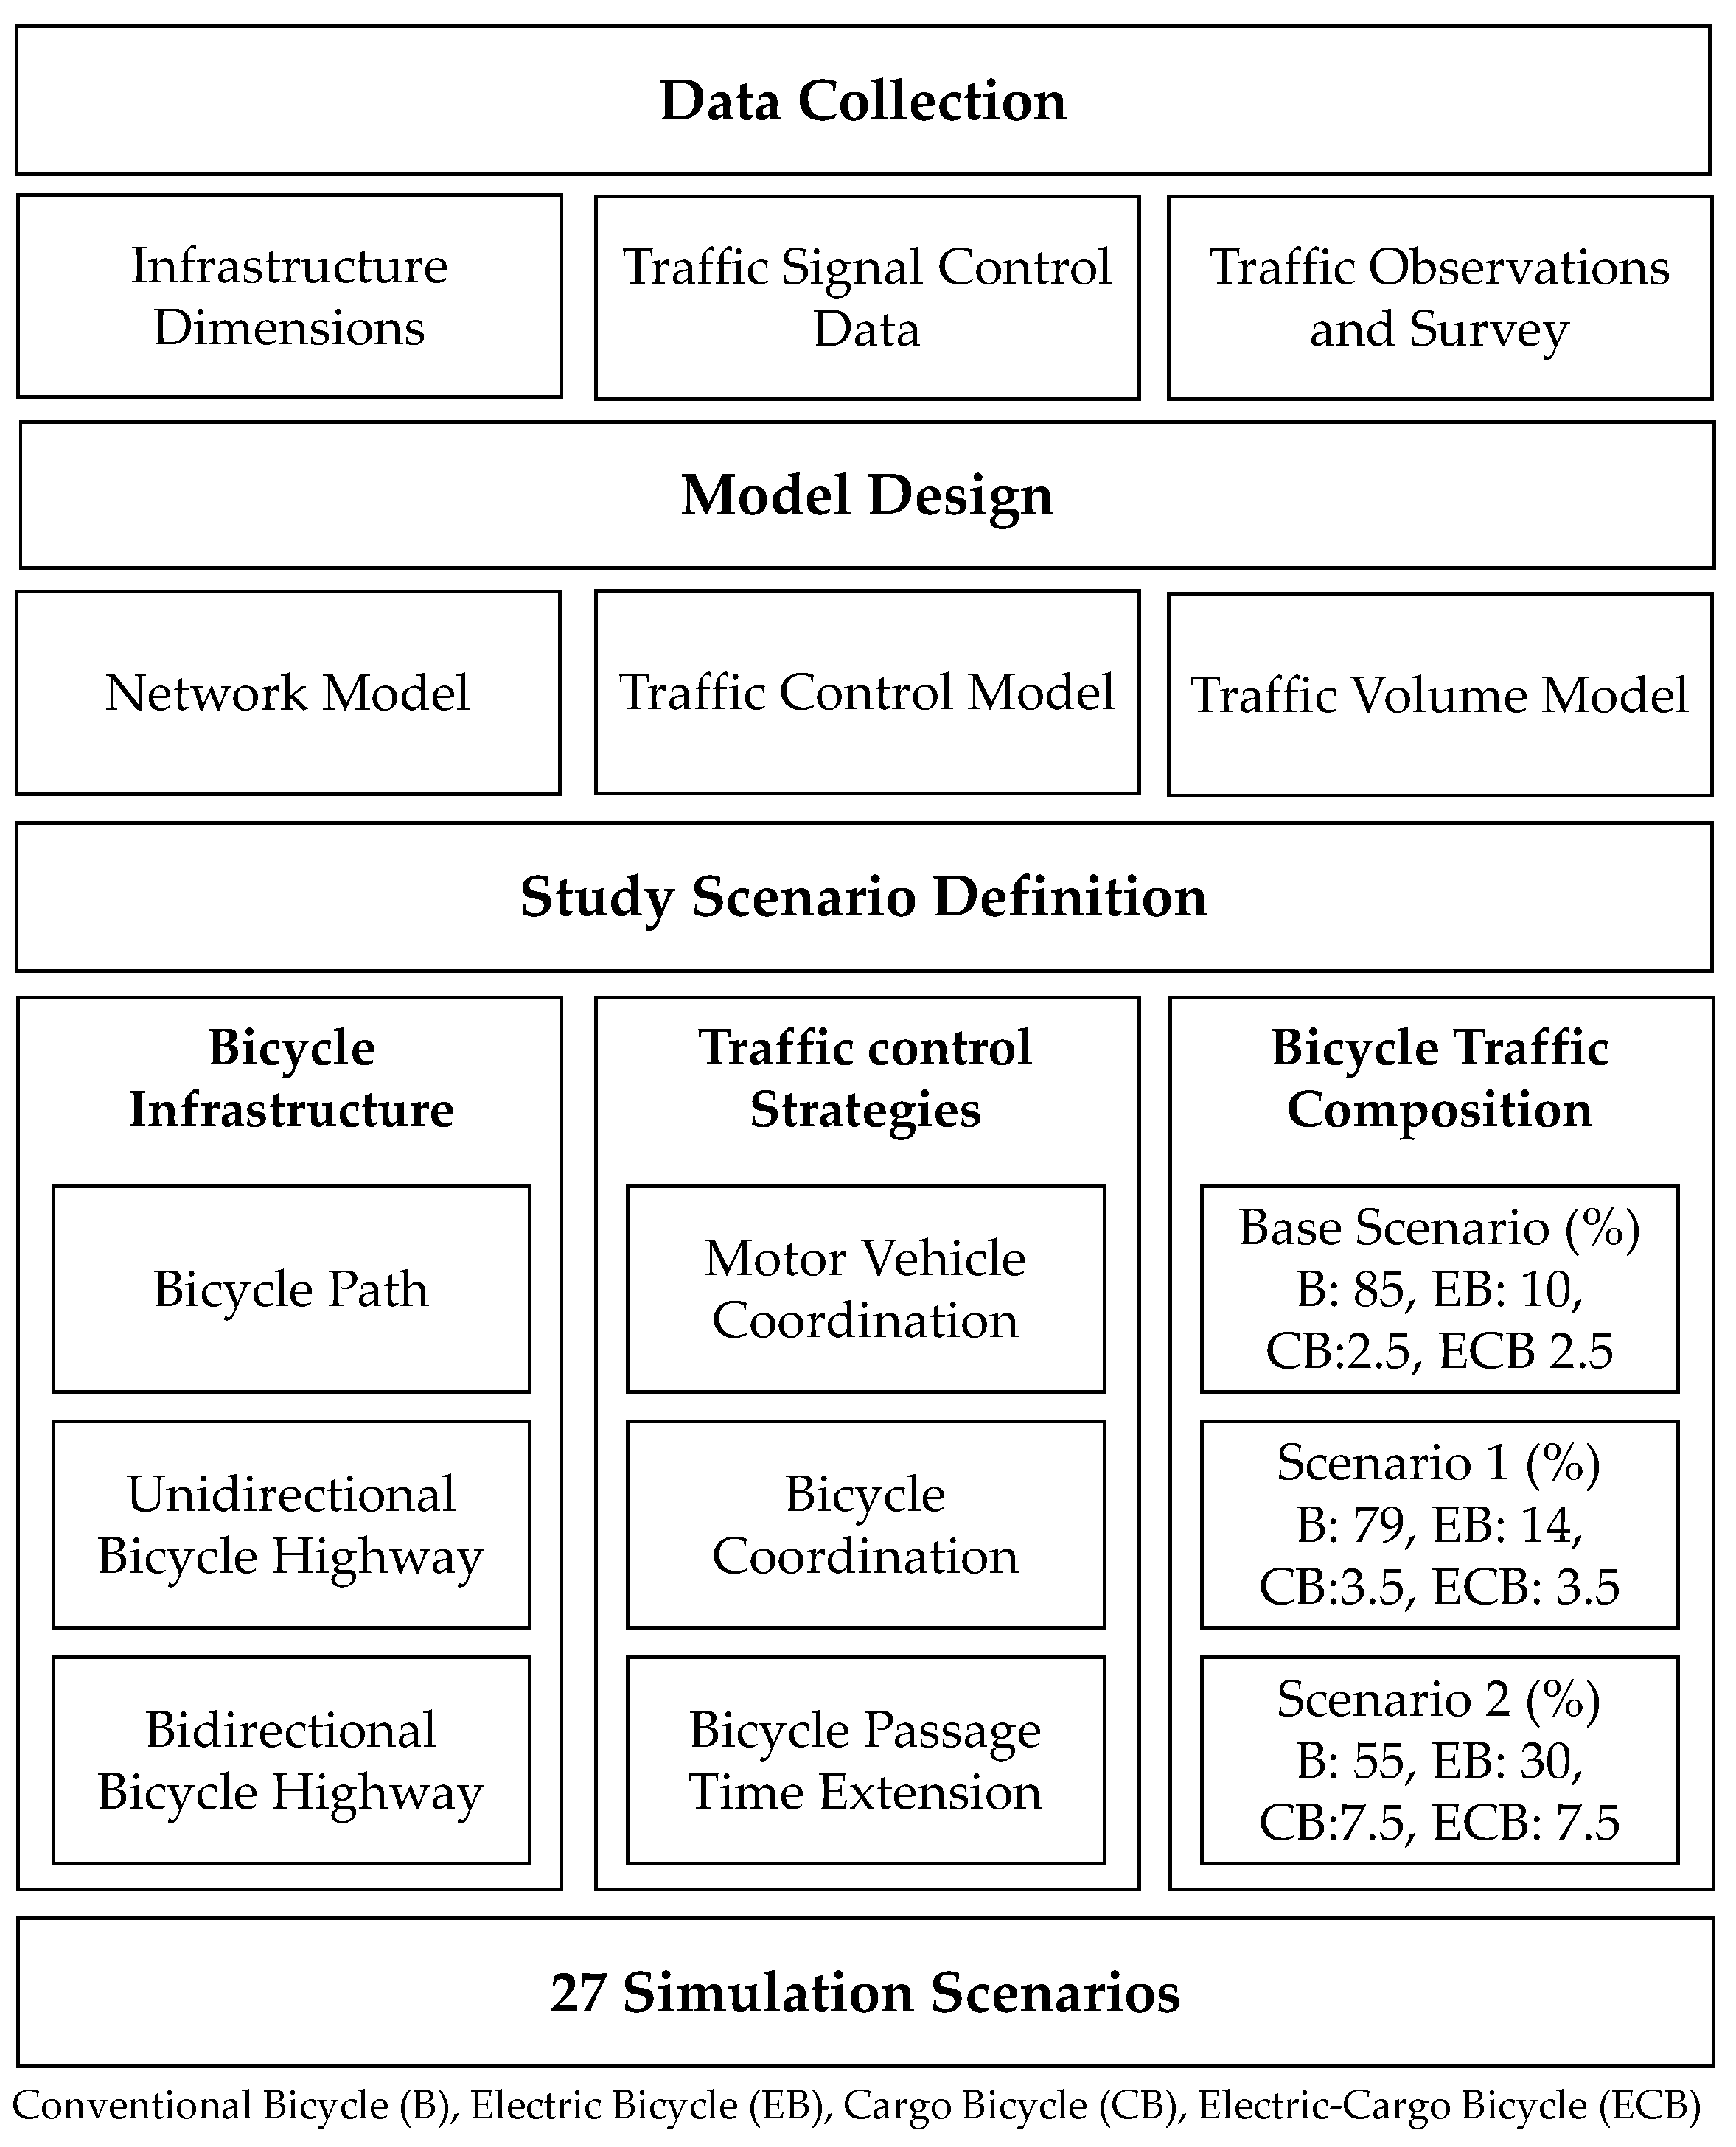
3.2. Data Collection
3.3. Scenario Definition
3.4. Model Design
3.4.1. Simulation Model
3.4.2. Traffic Composition
3.5. Traffic Control Strategies
3.5.1. Bicycle Traffic Signal Coordination
3.5.2. Bicycle Prioritization through Passage Time Extension
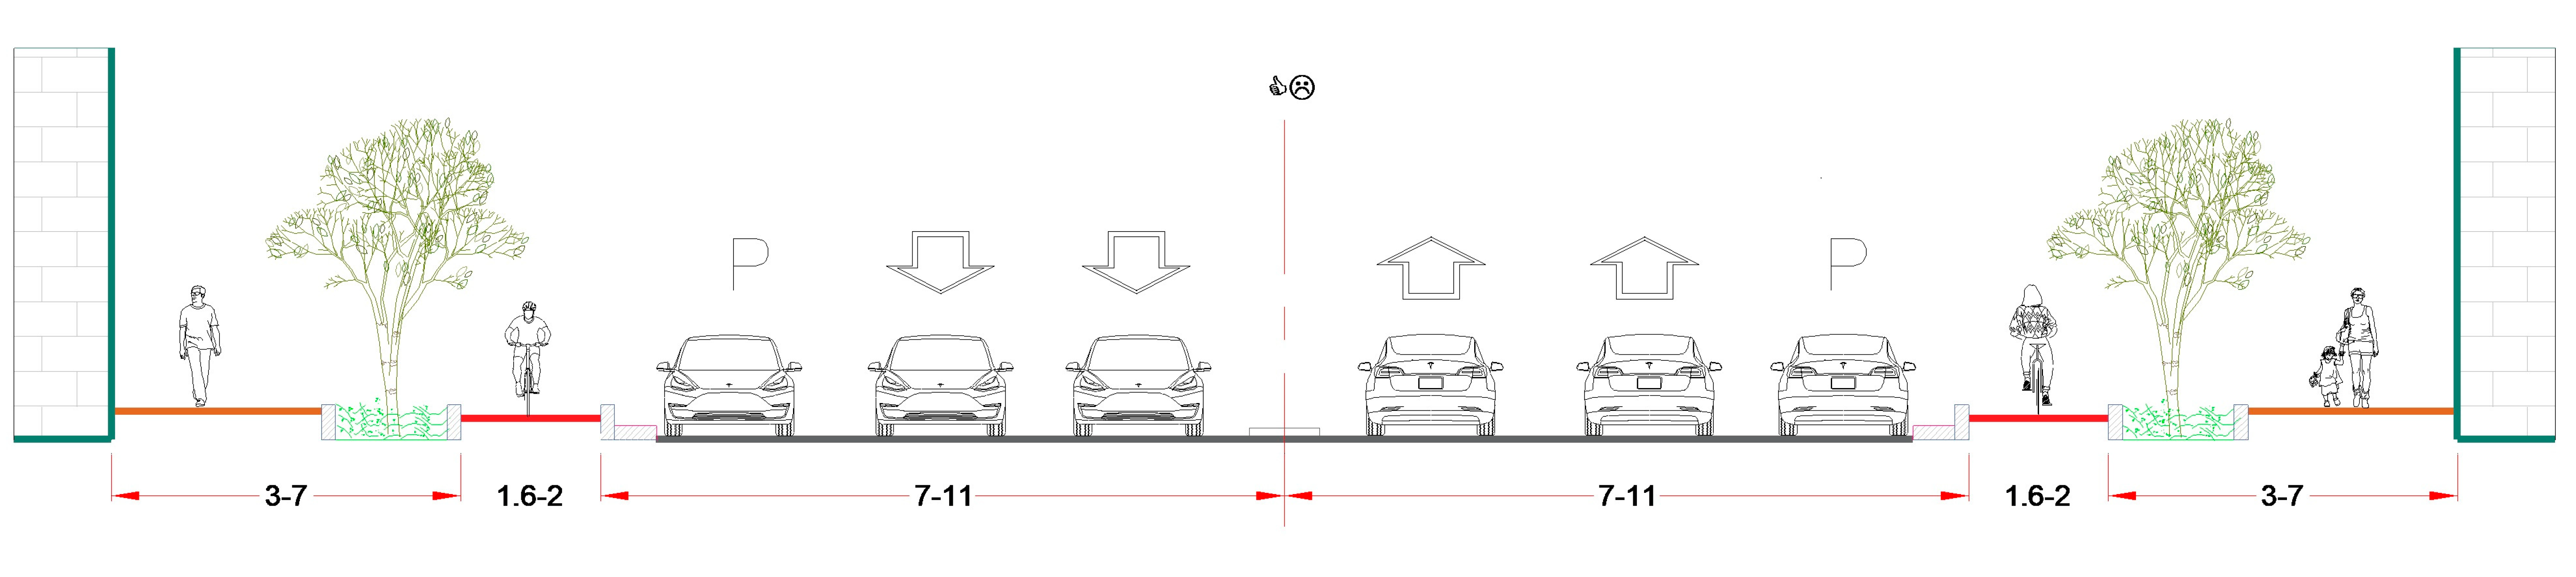
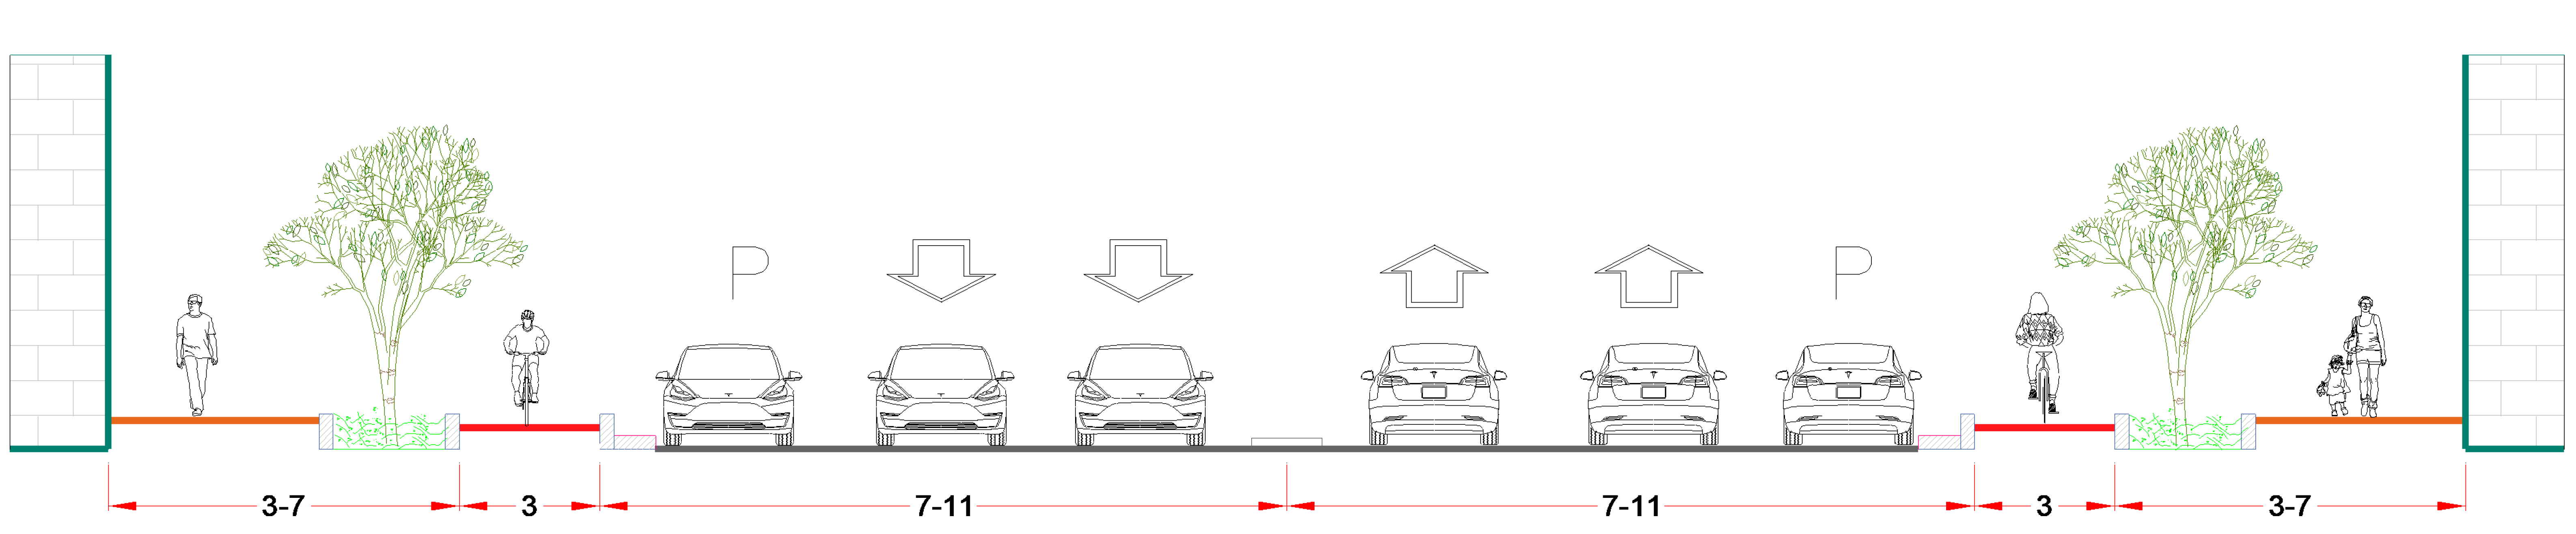
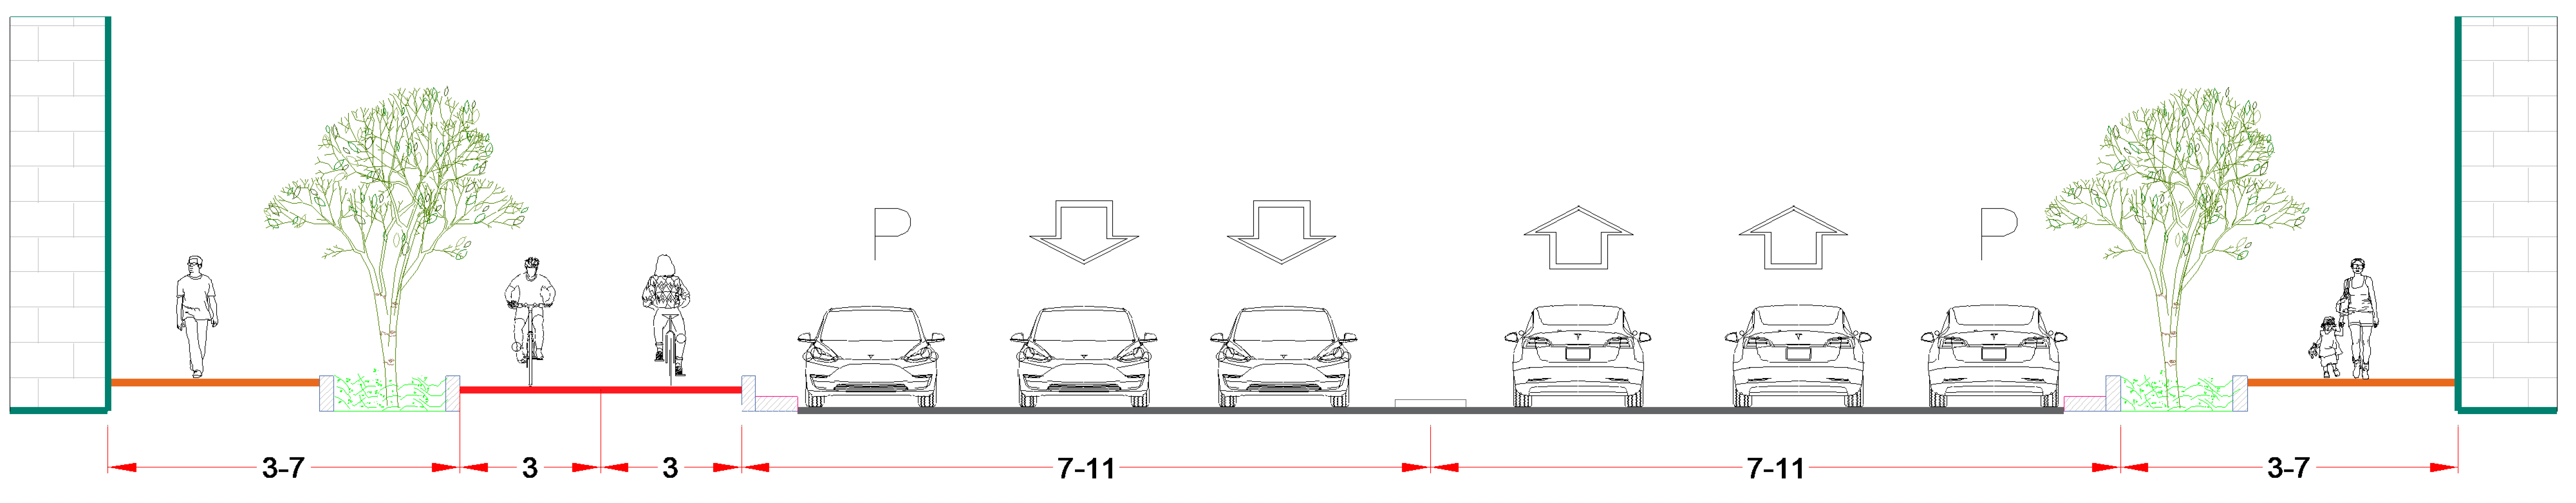
3.5.3. Bicycle Highway Design
3.5.4. Calibration and Validation
4. Results
4.1. Bicycle Traffic Performance
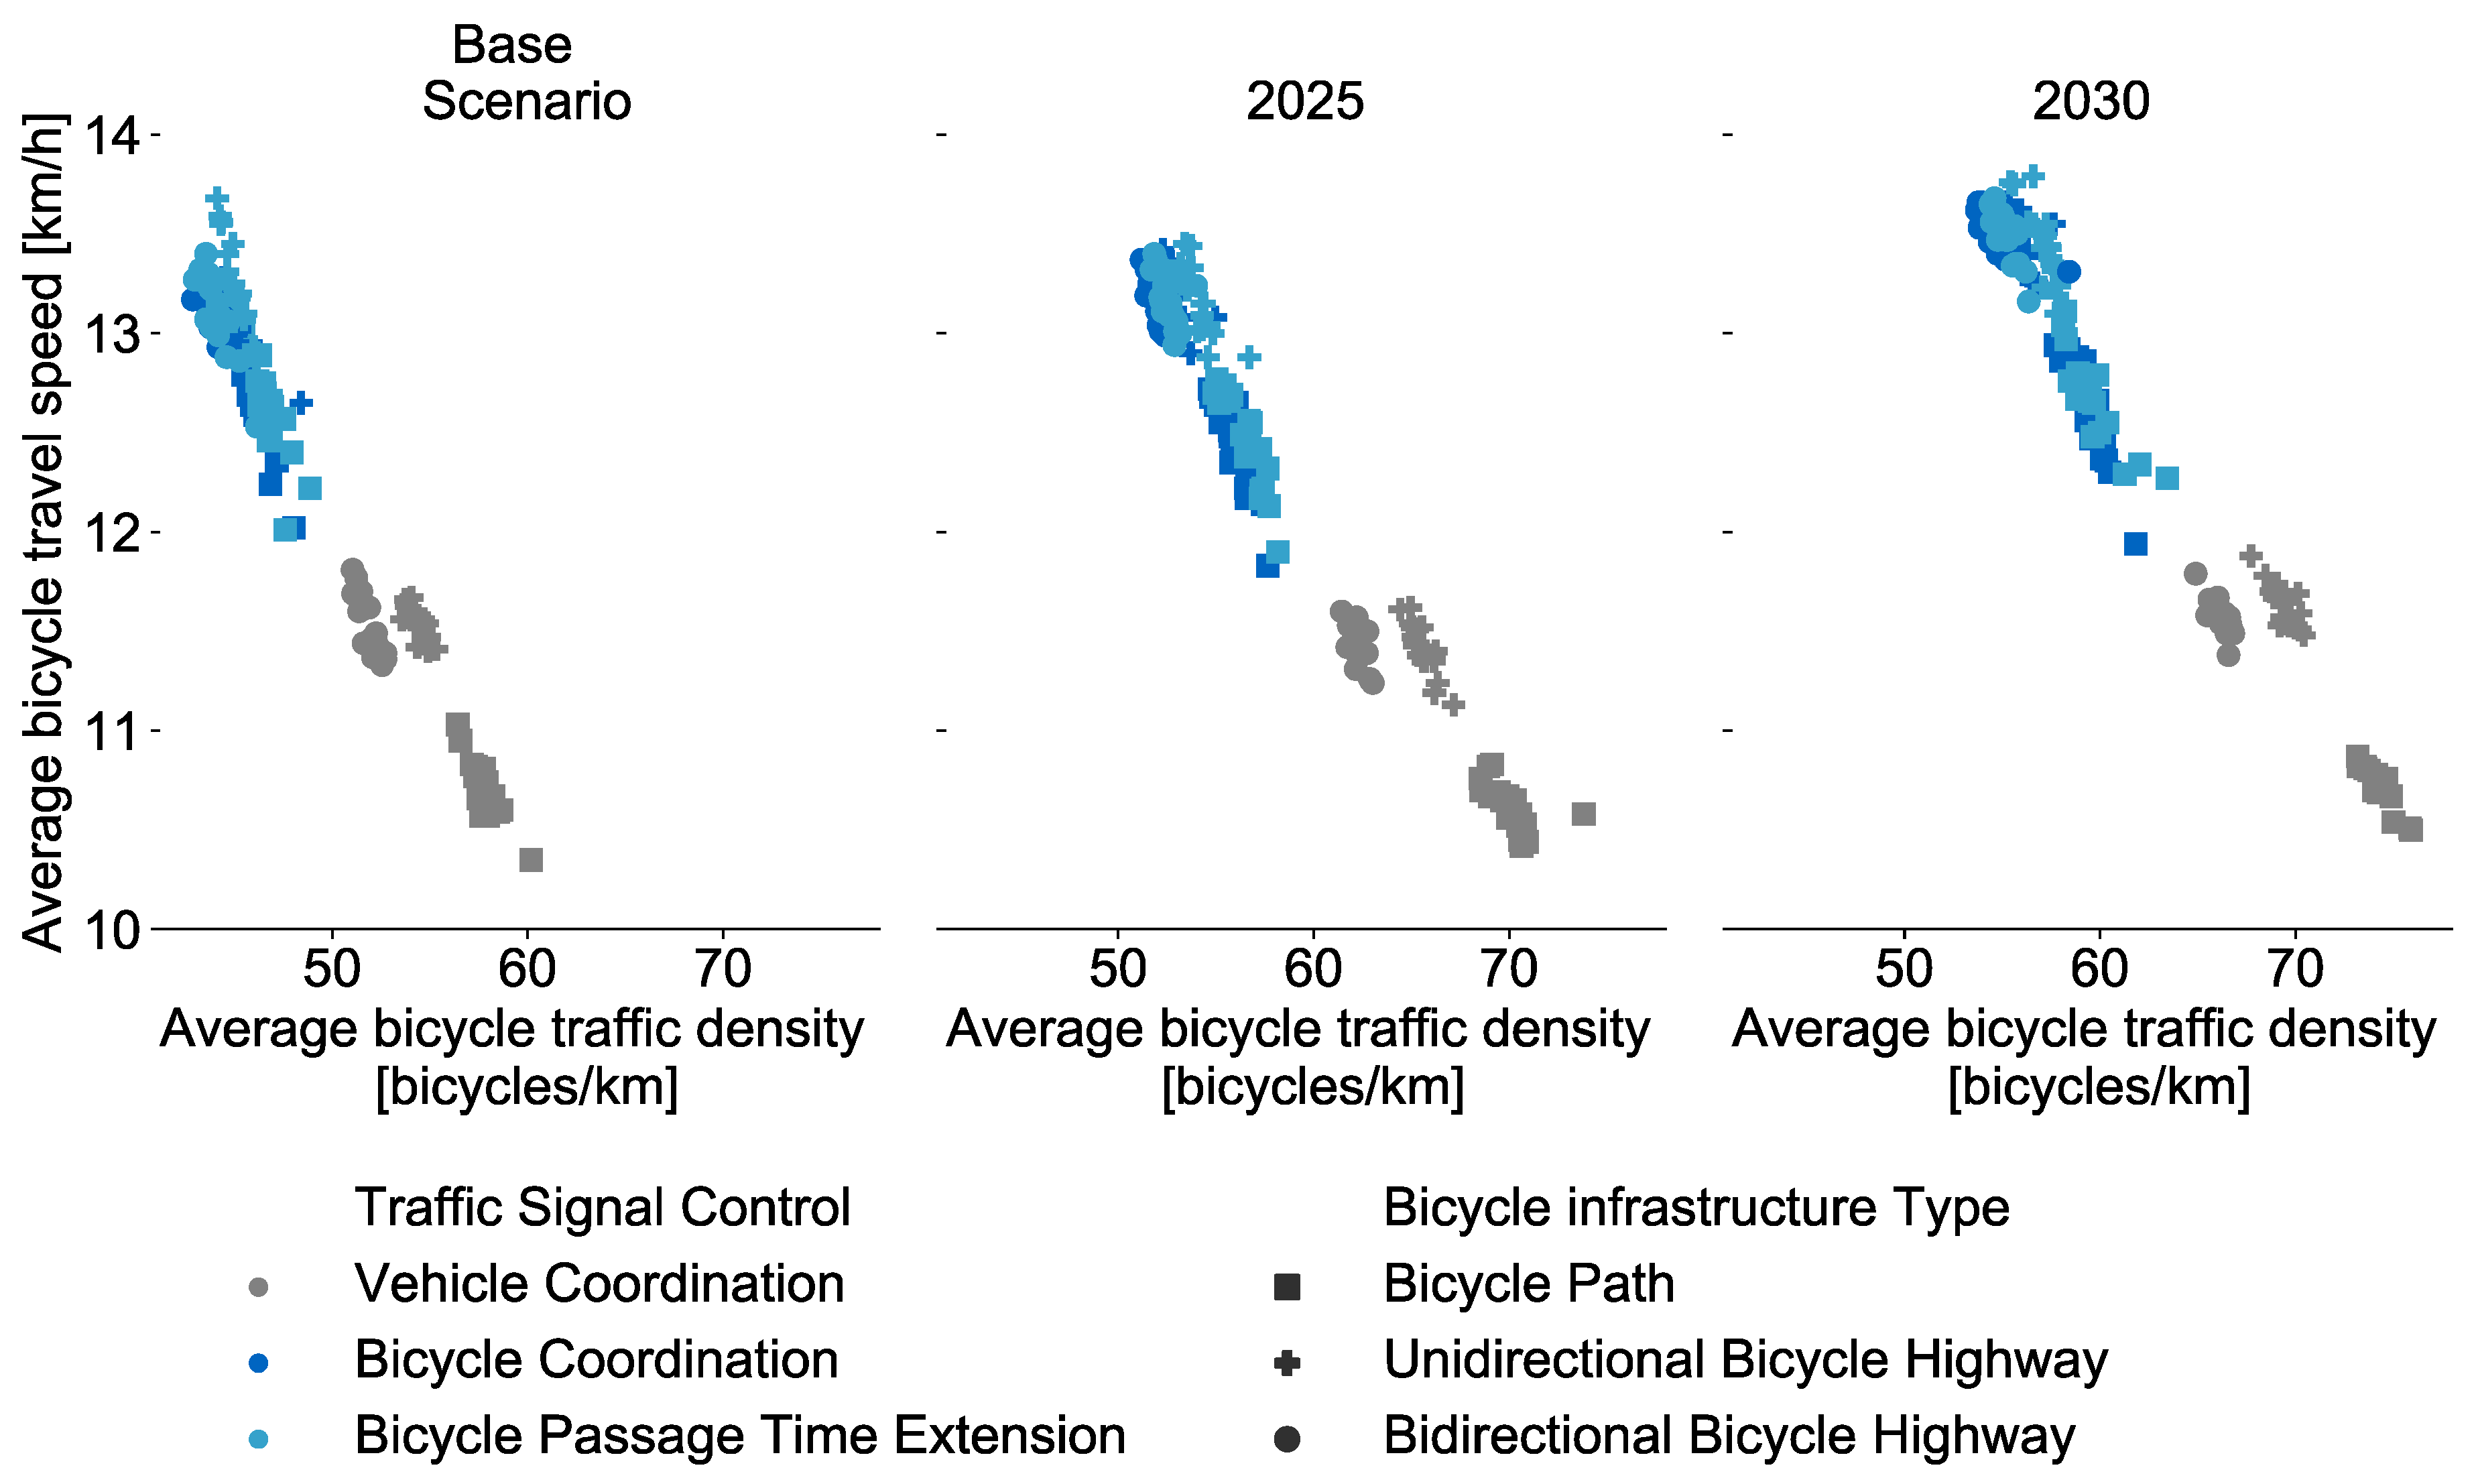
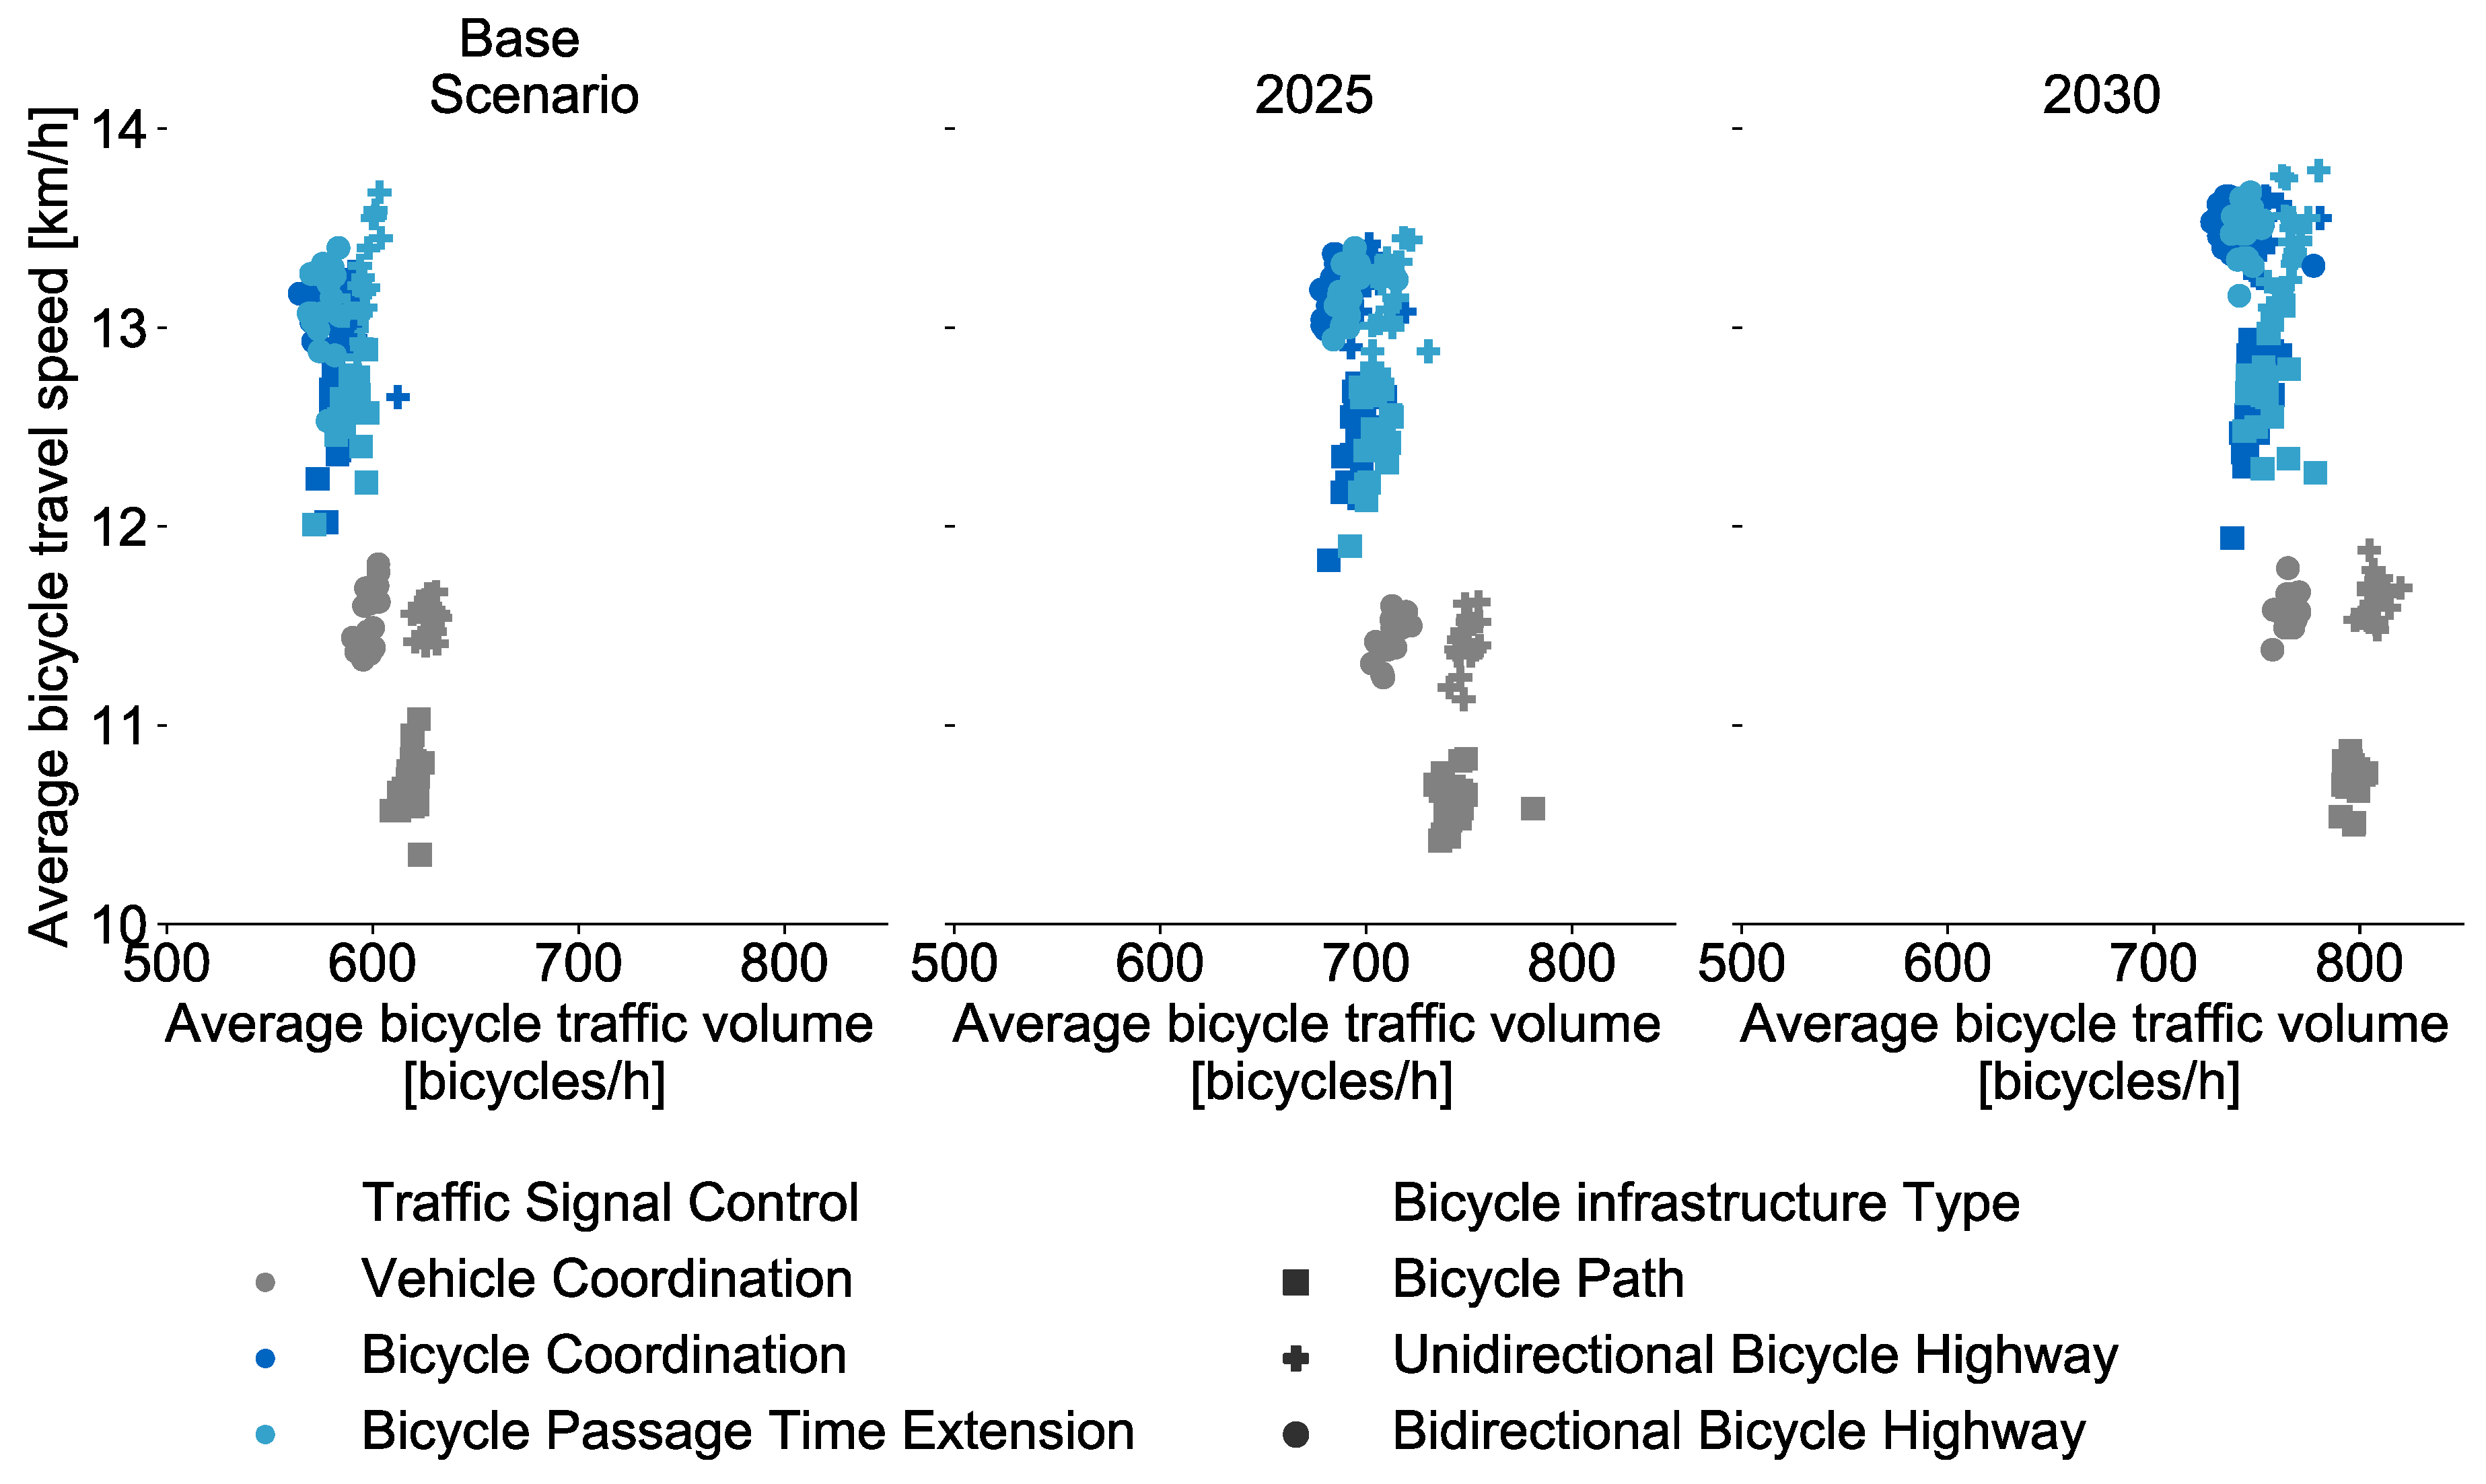
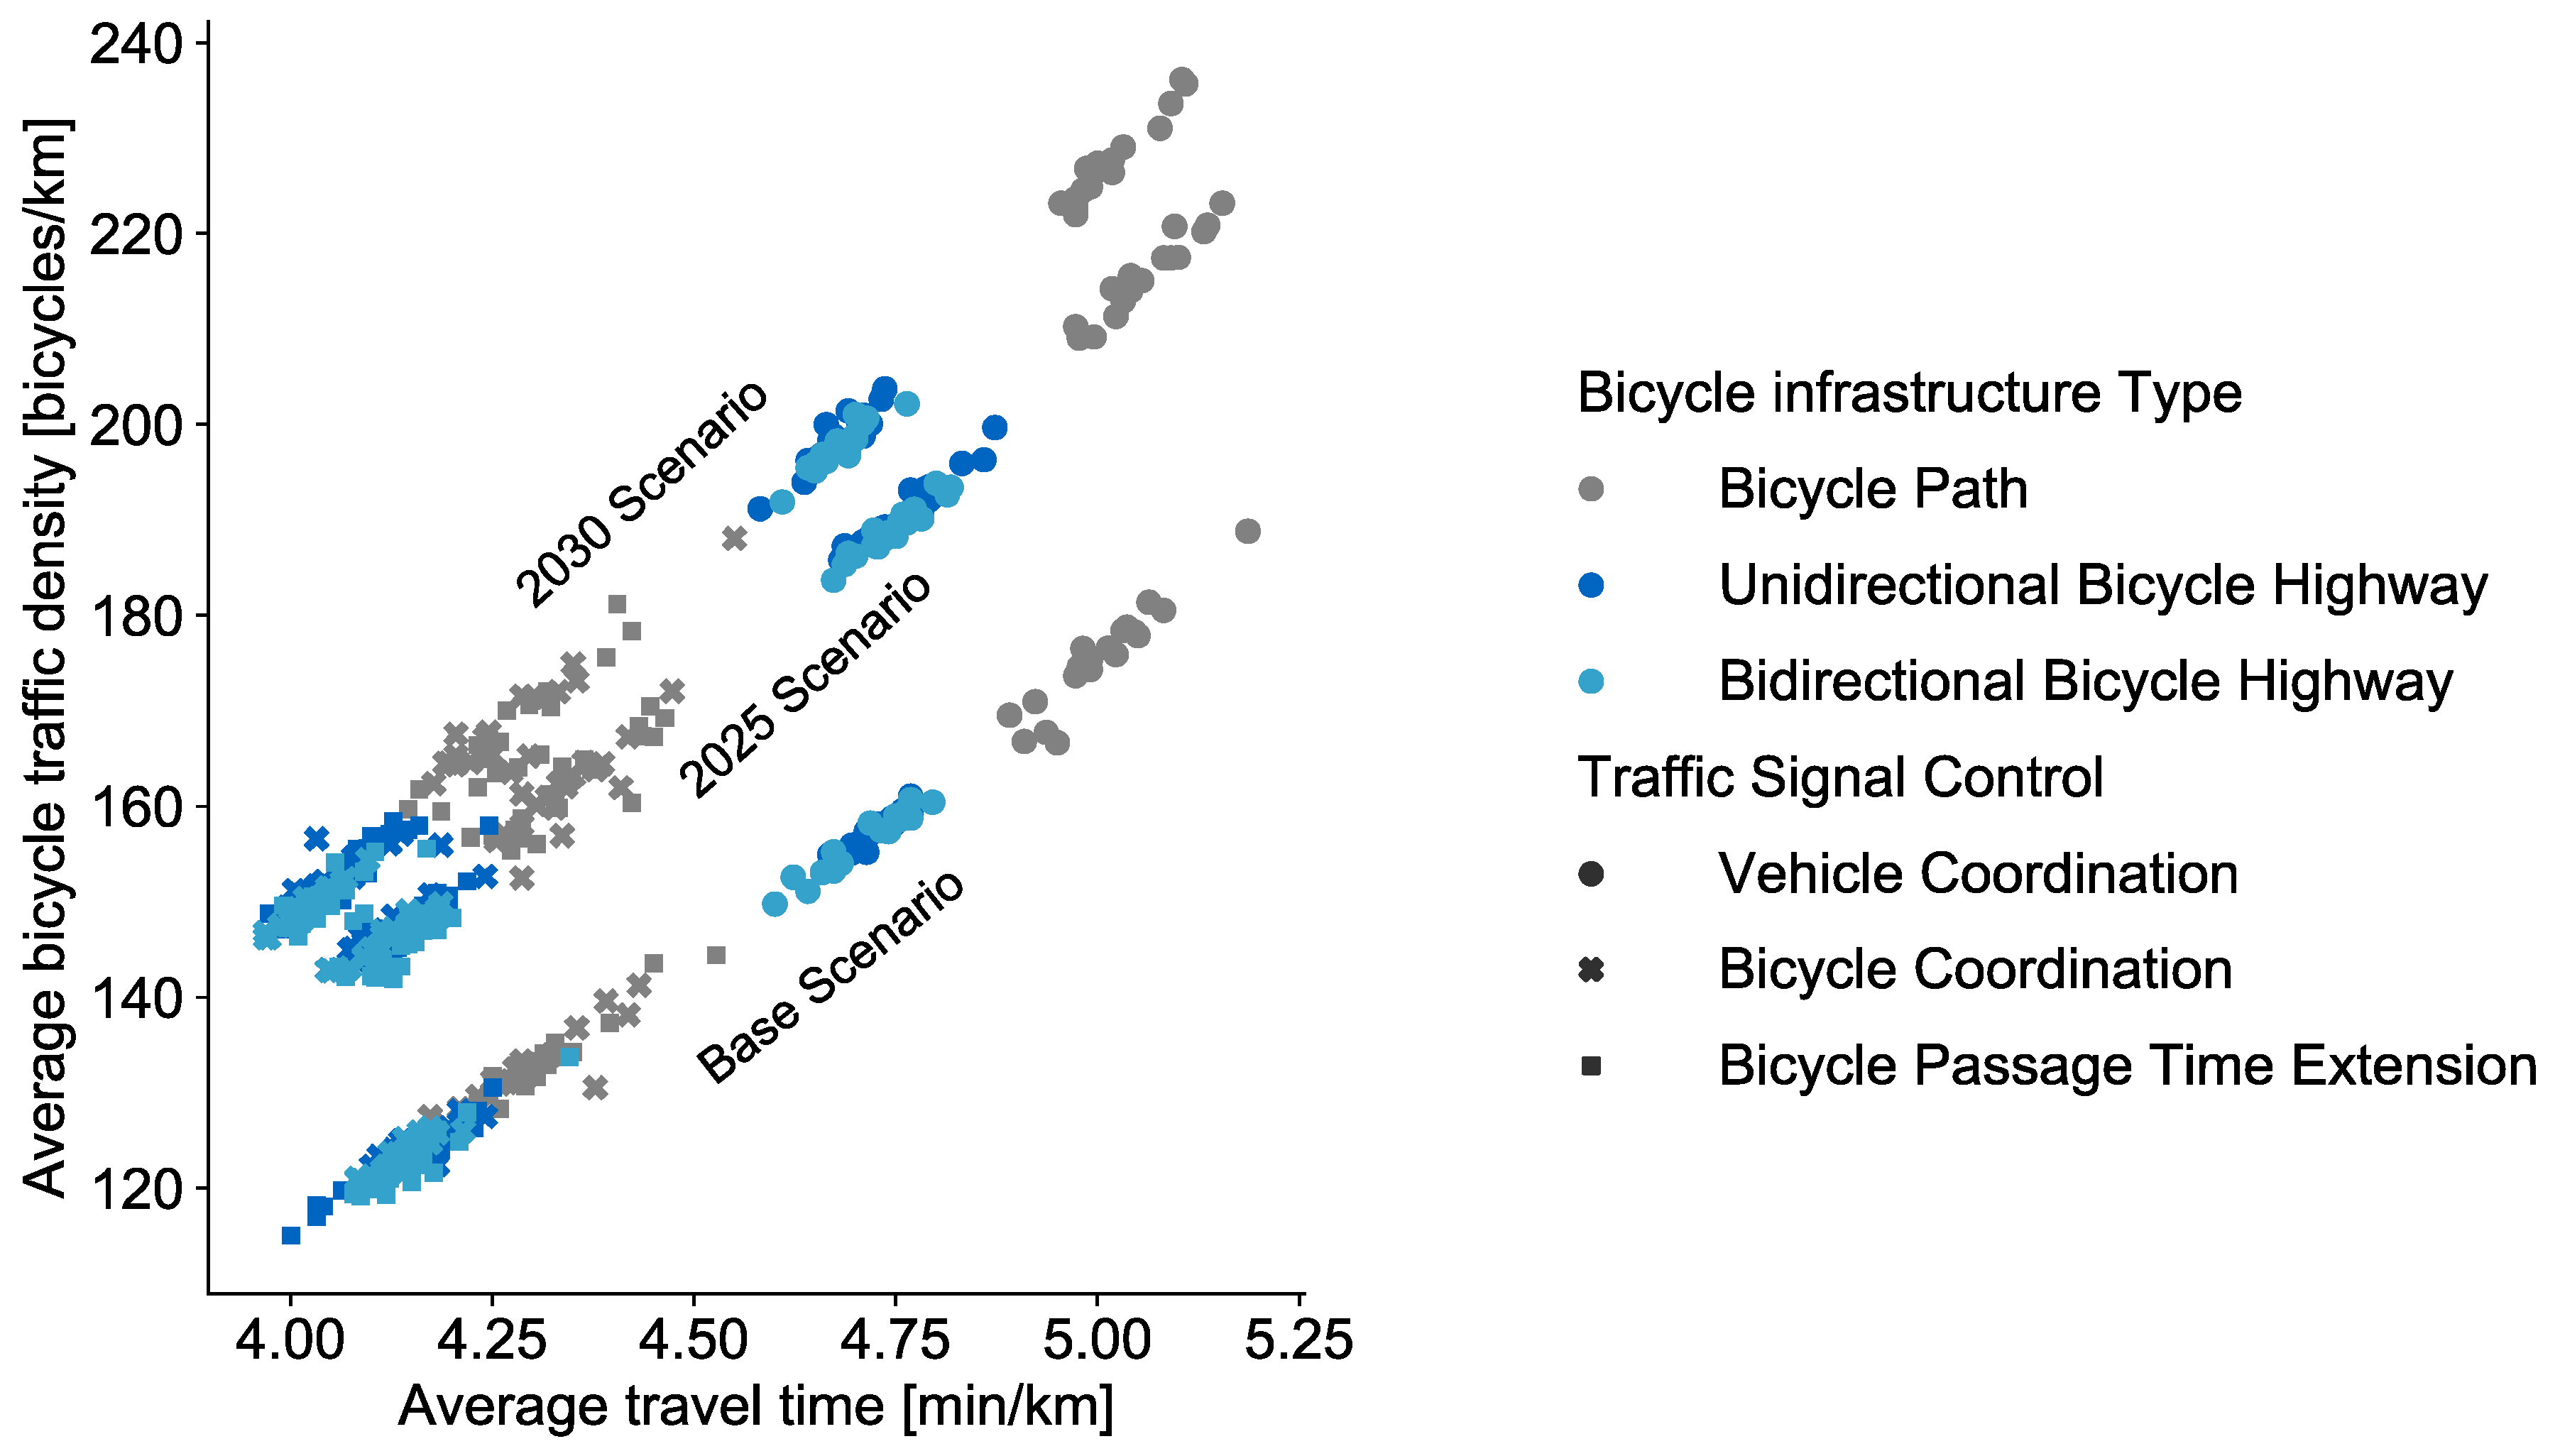
4.1.1. Bicycle Traffic Flow
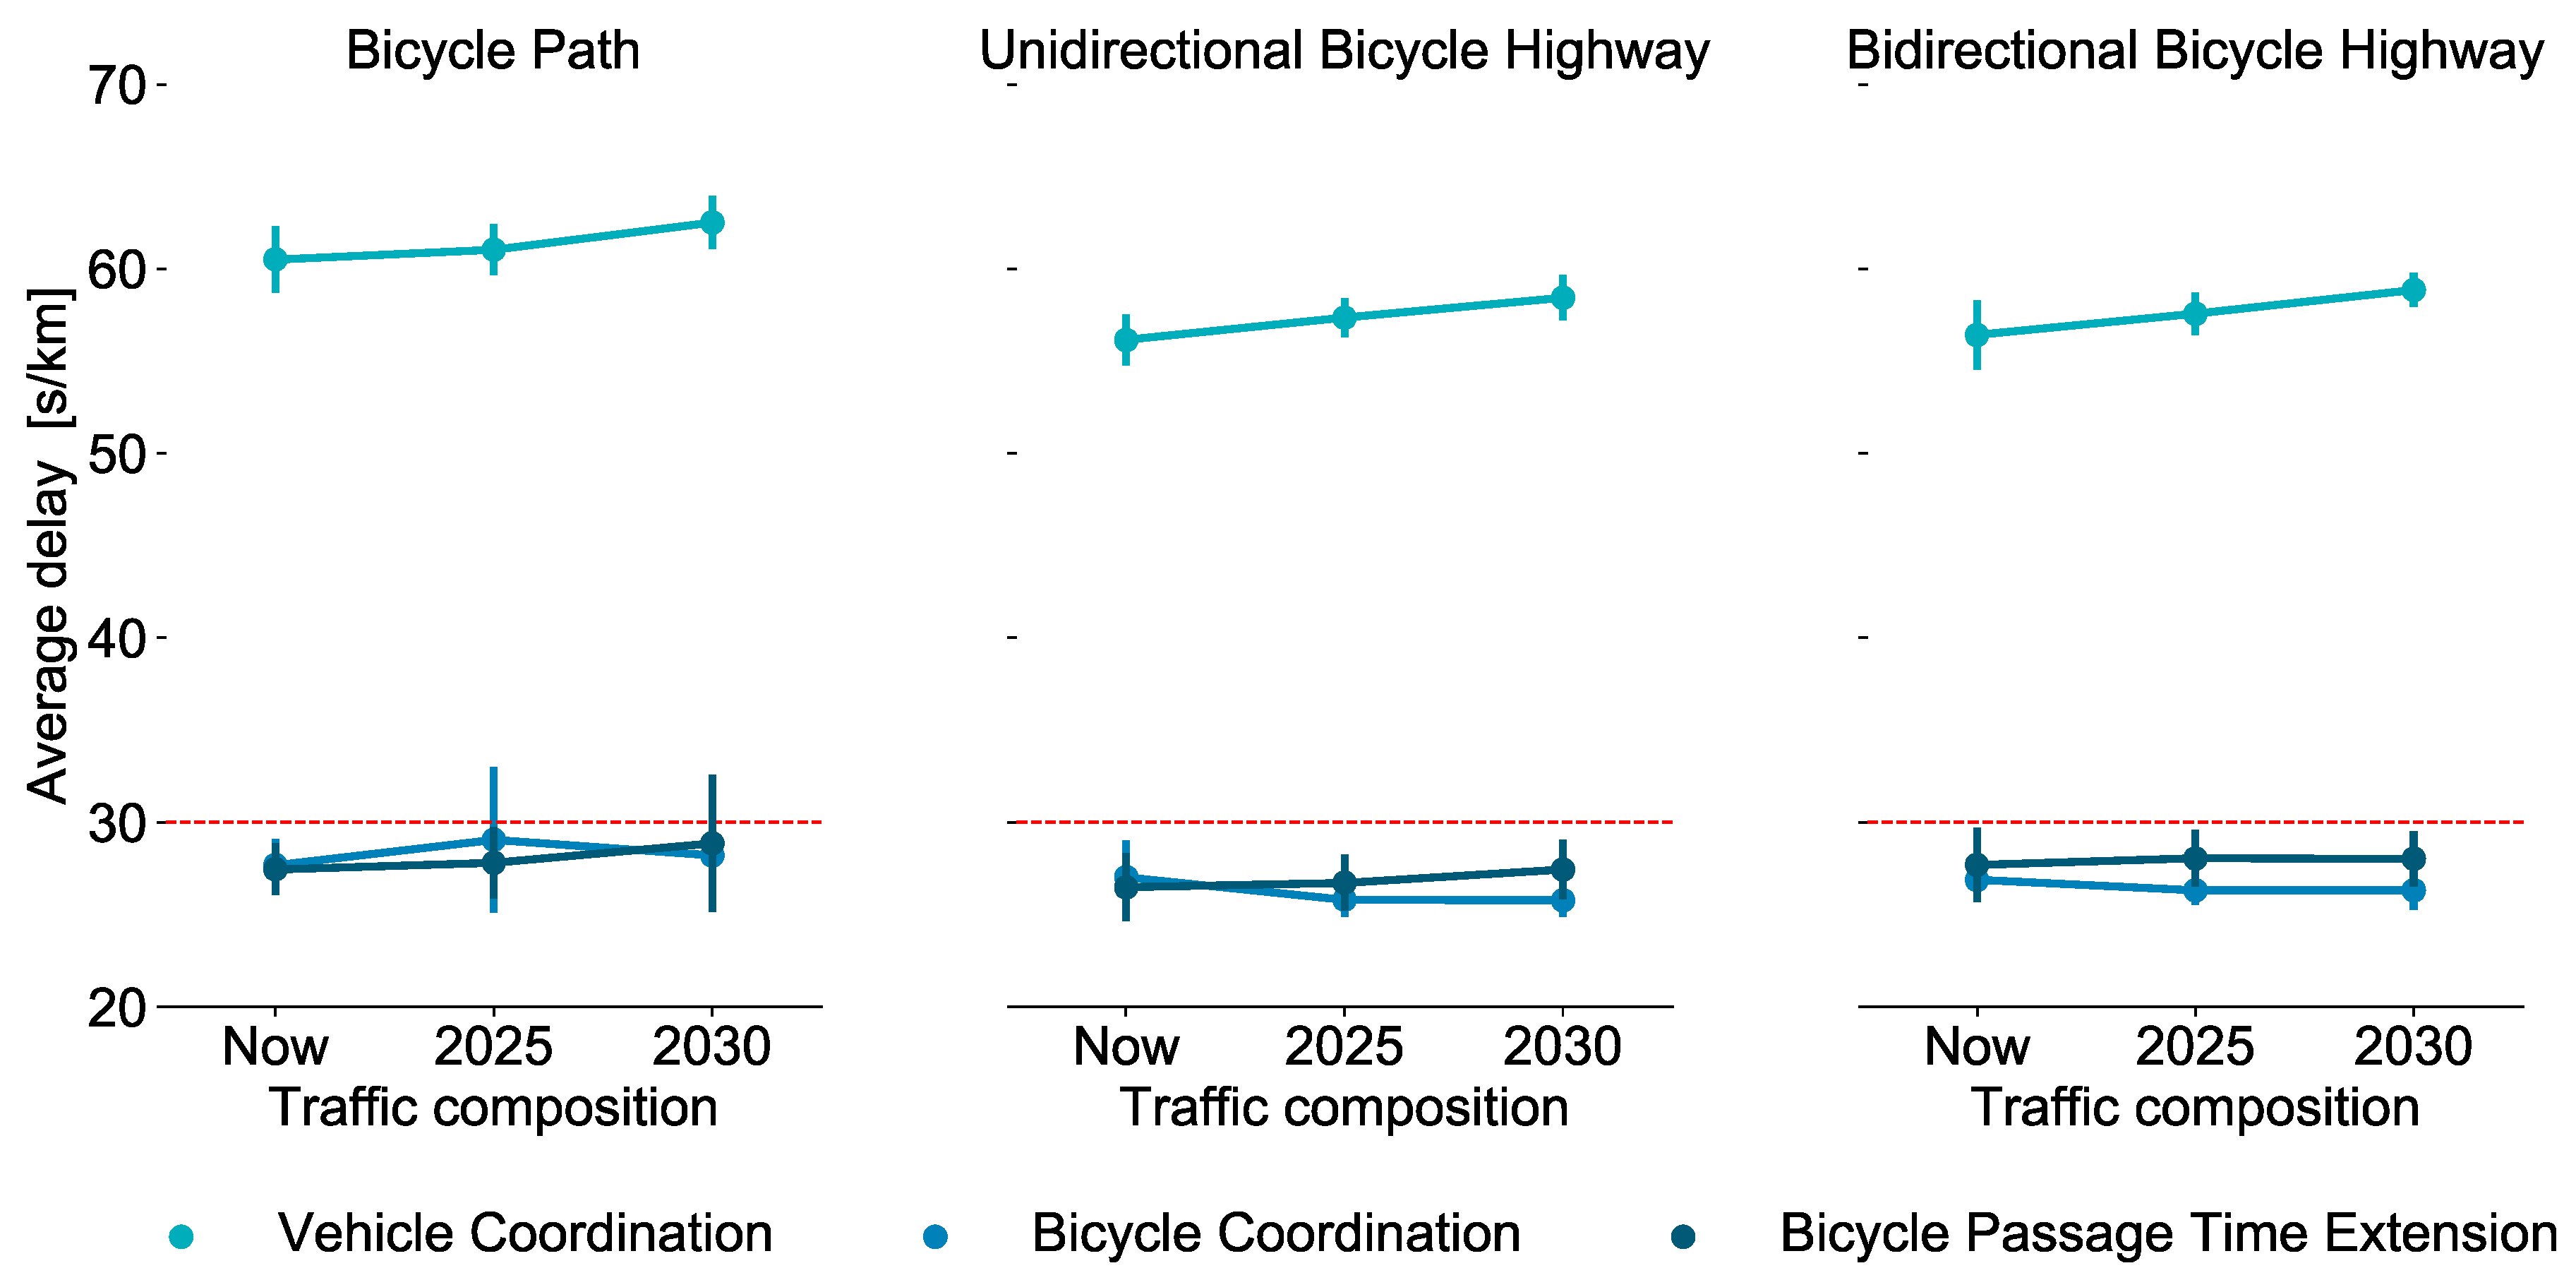
4.1.2. Delay
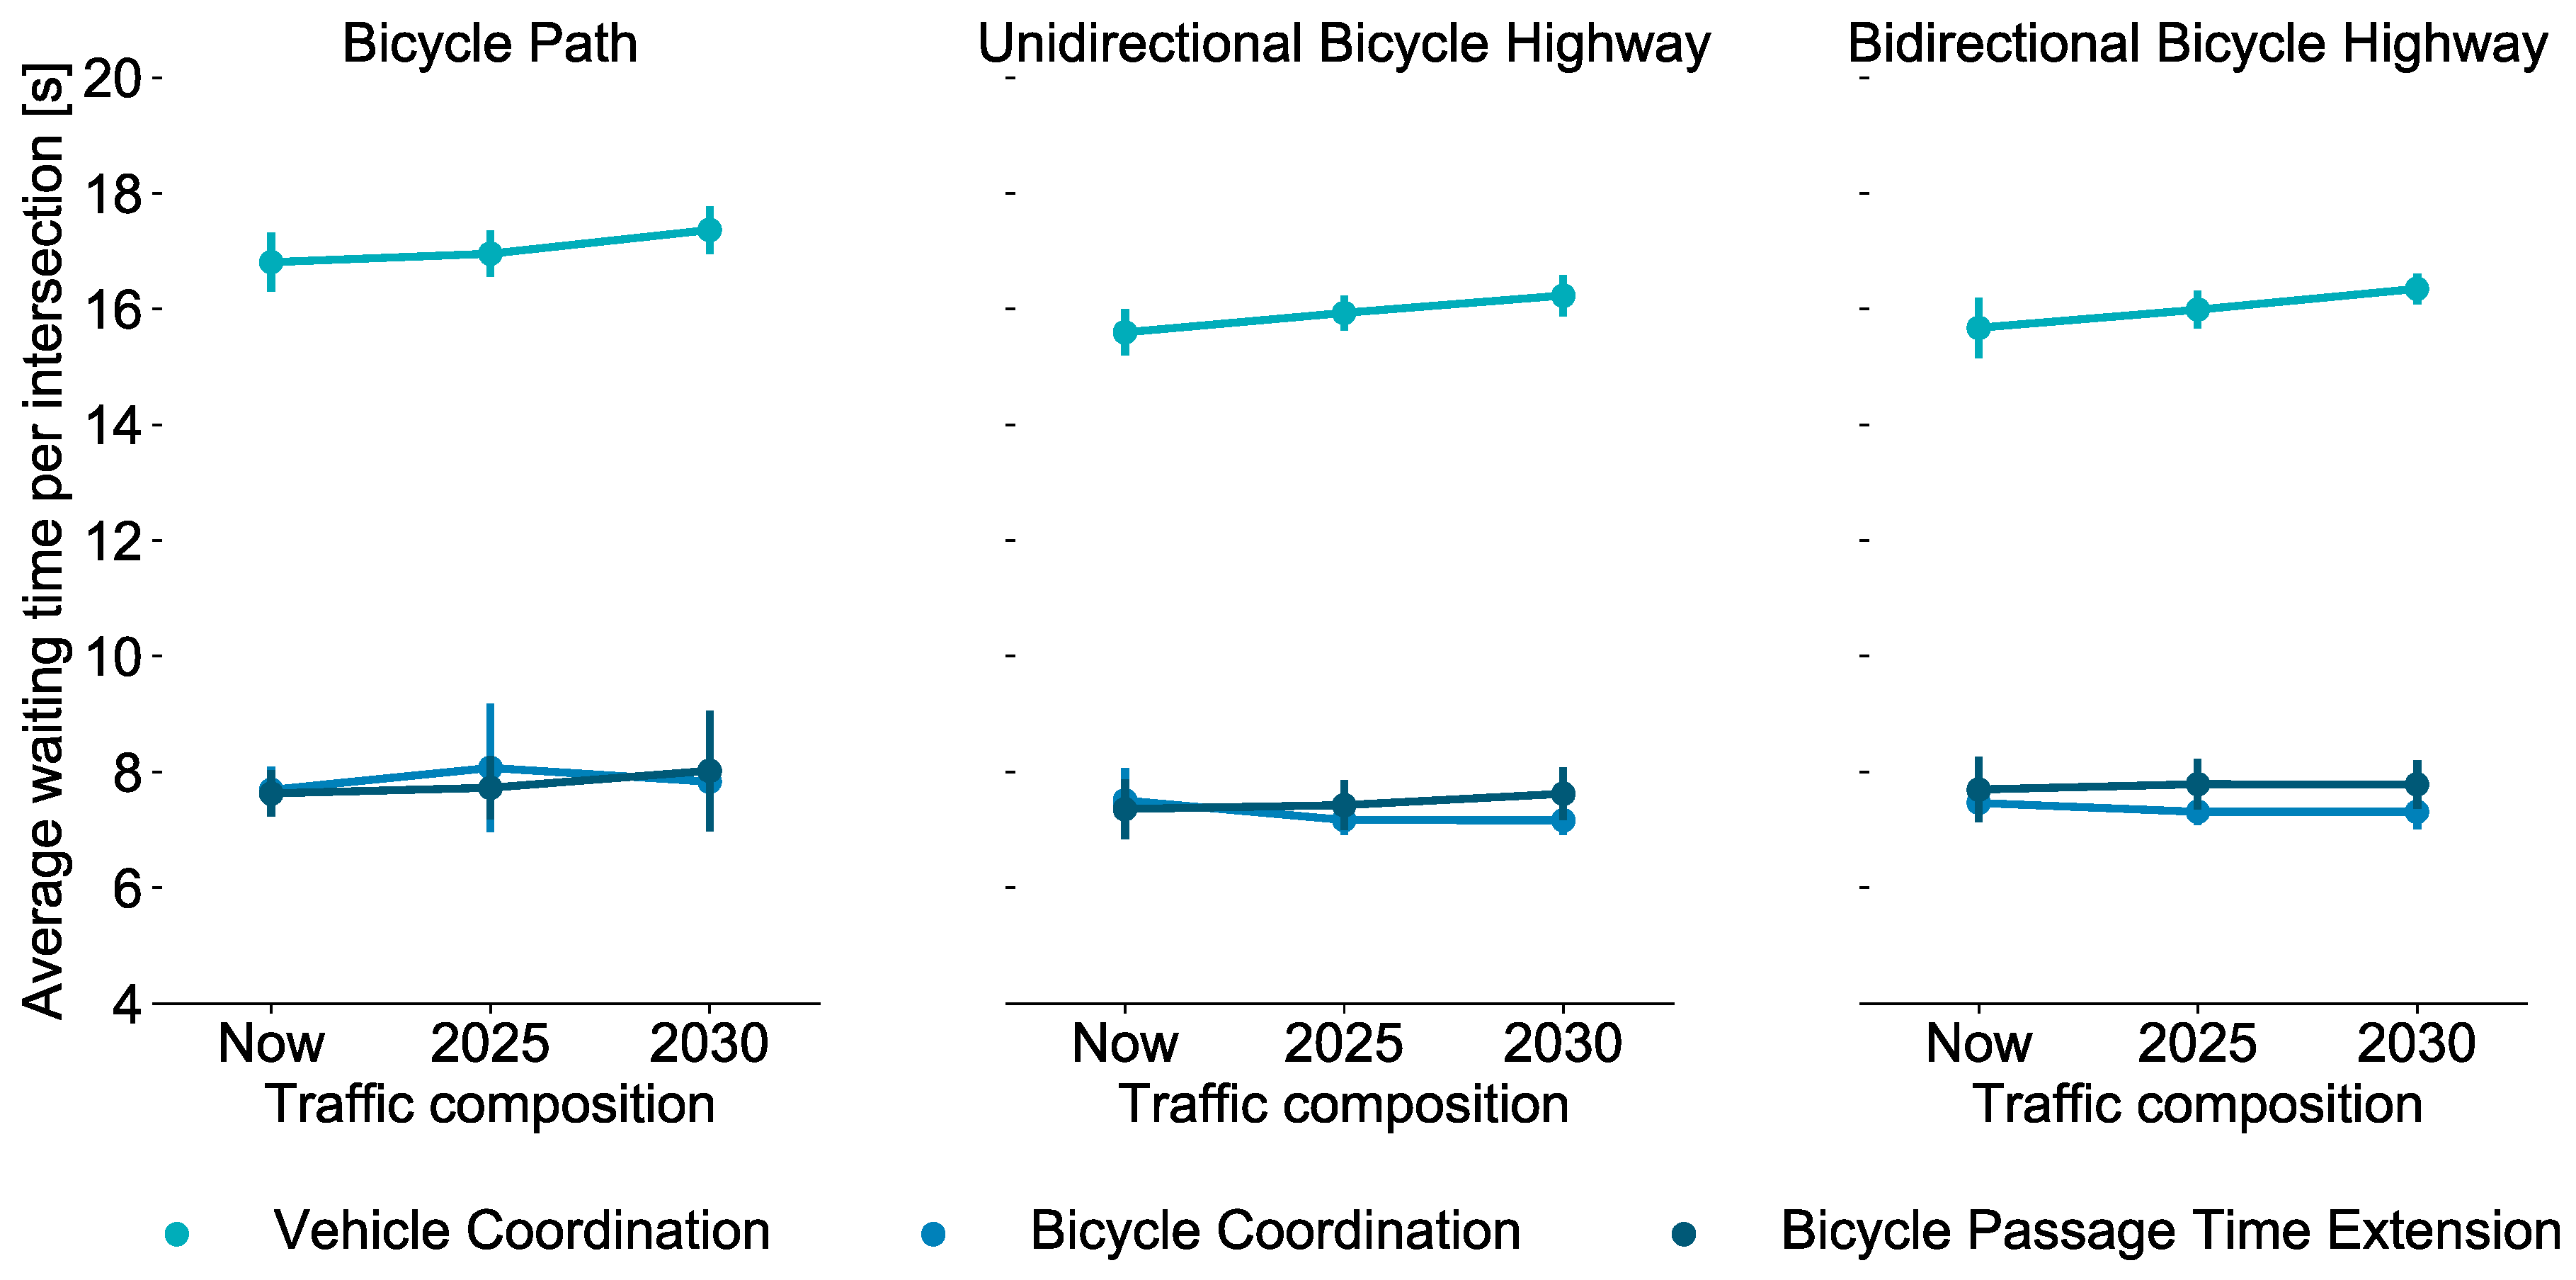
4.1.3. Waiting Time
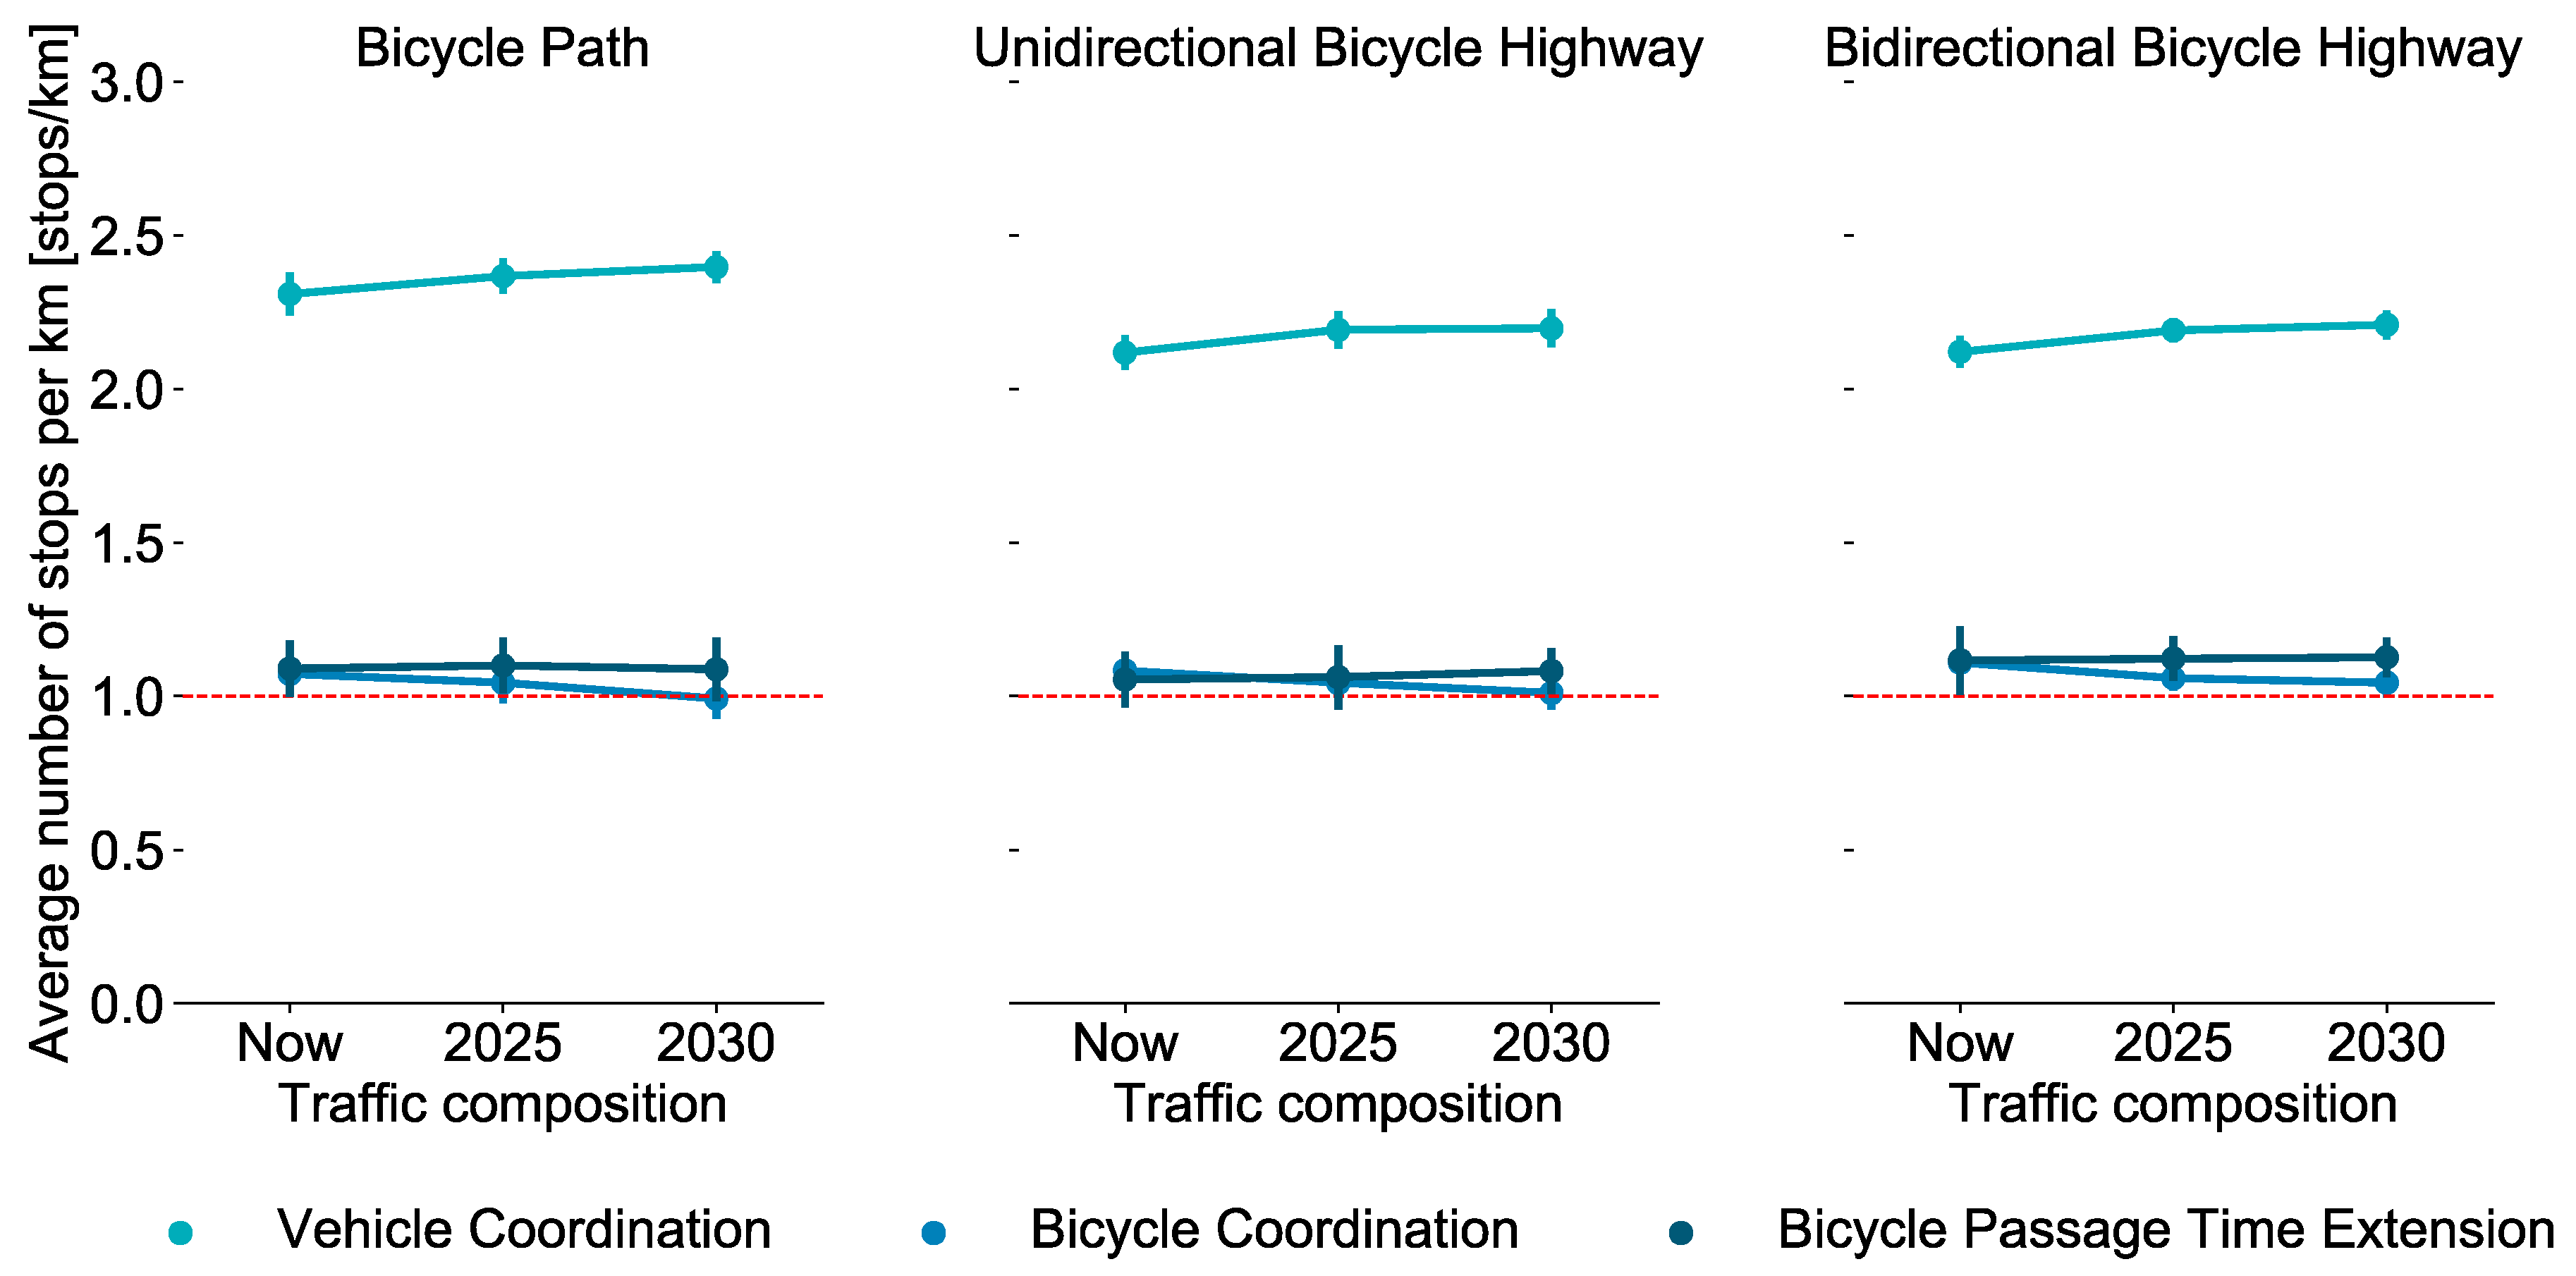
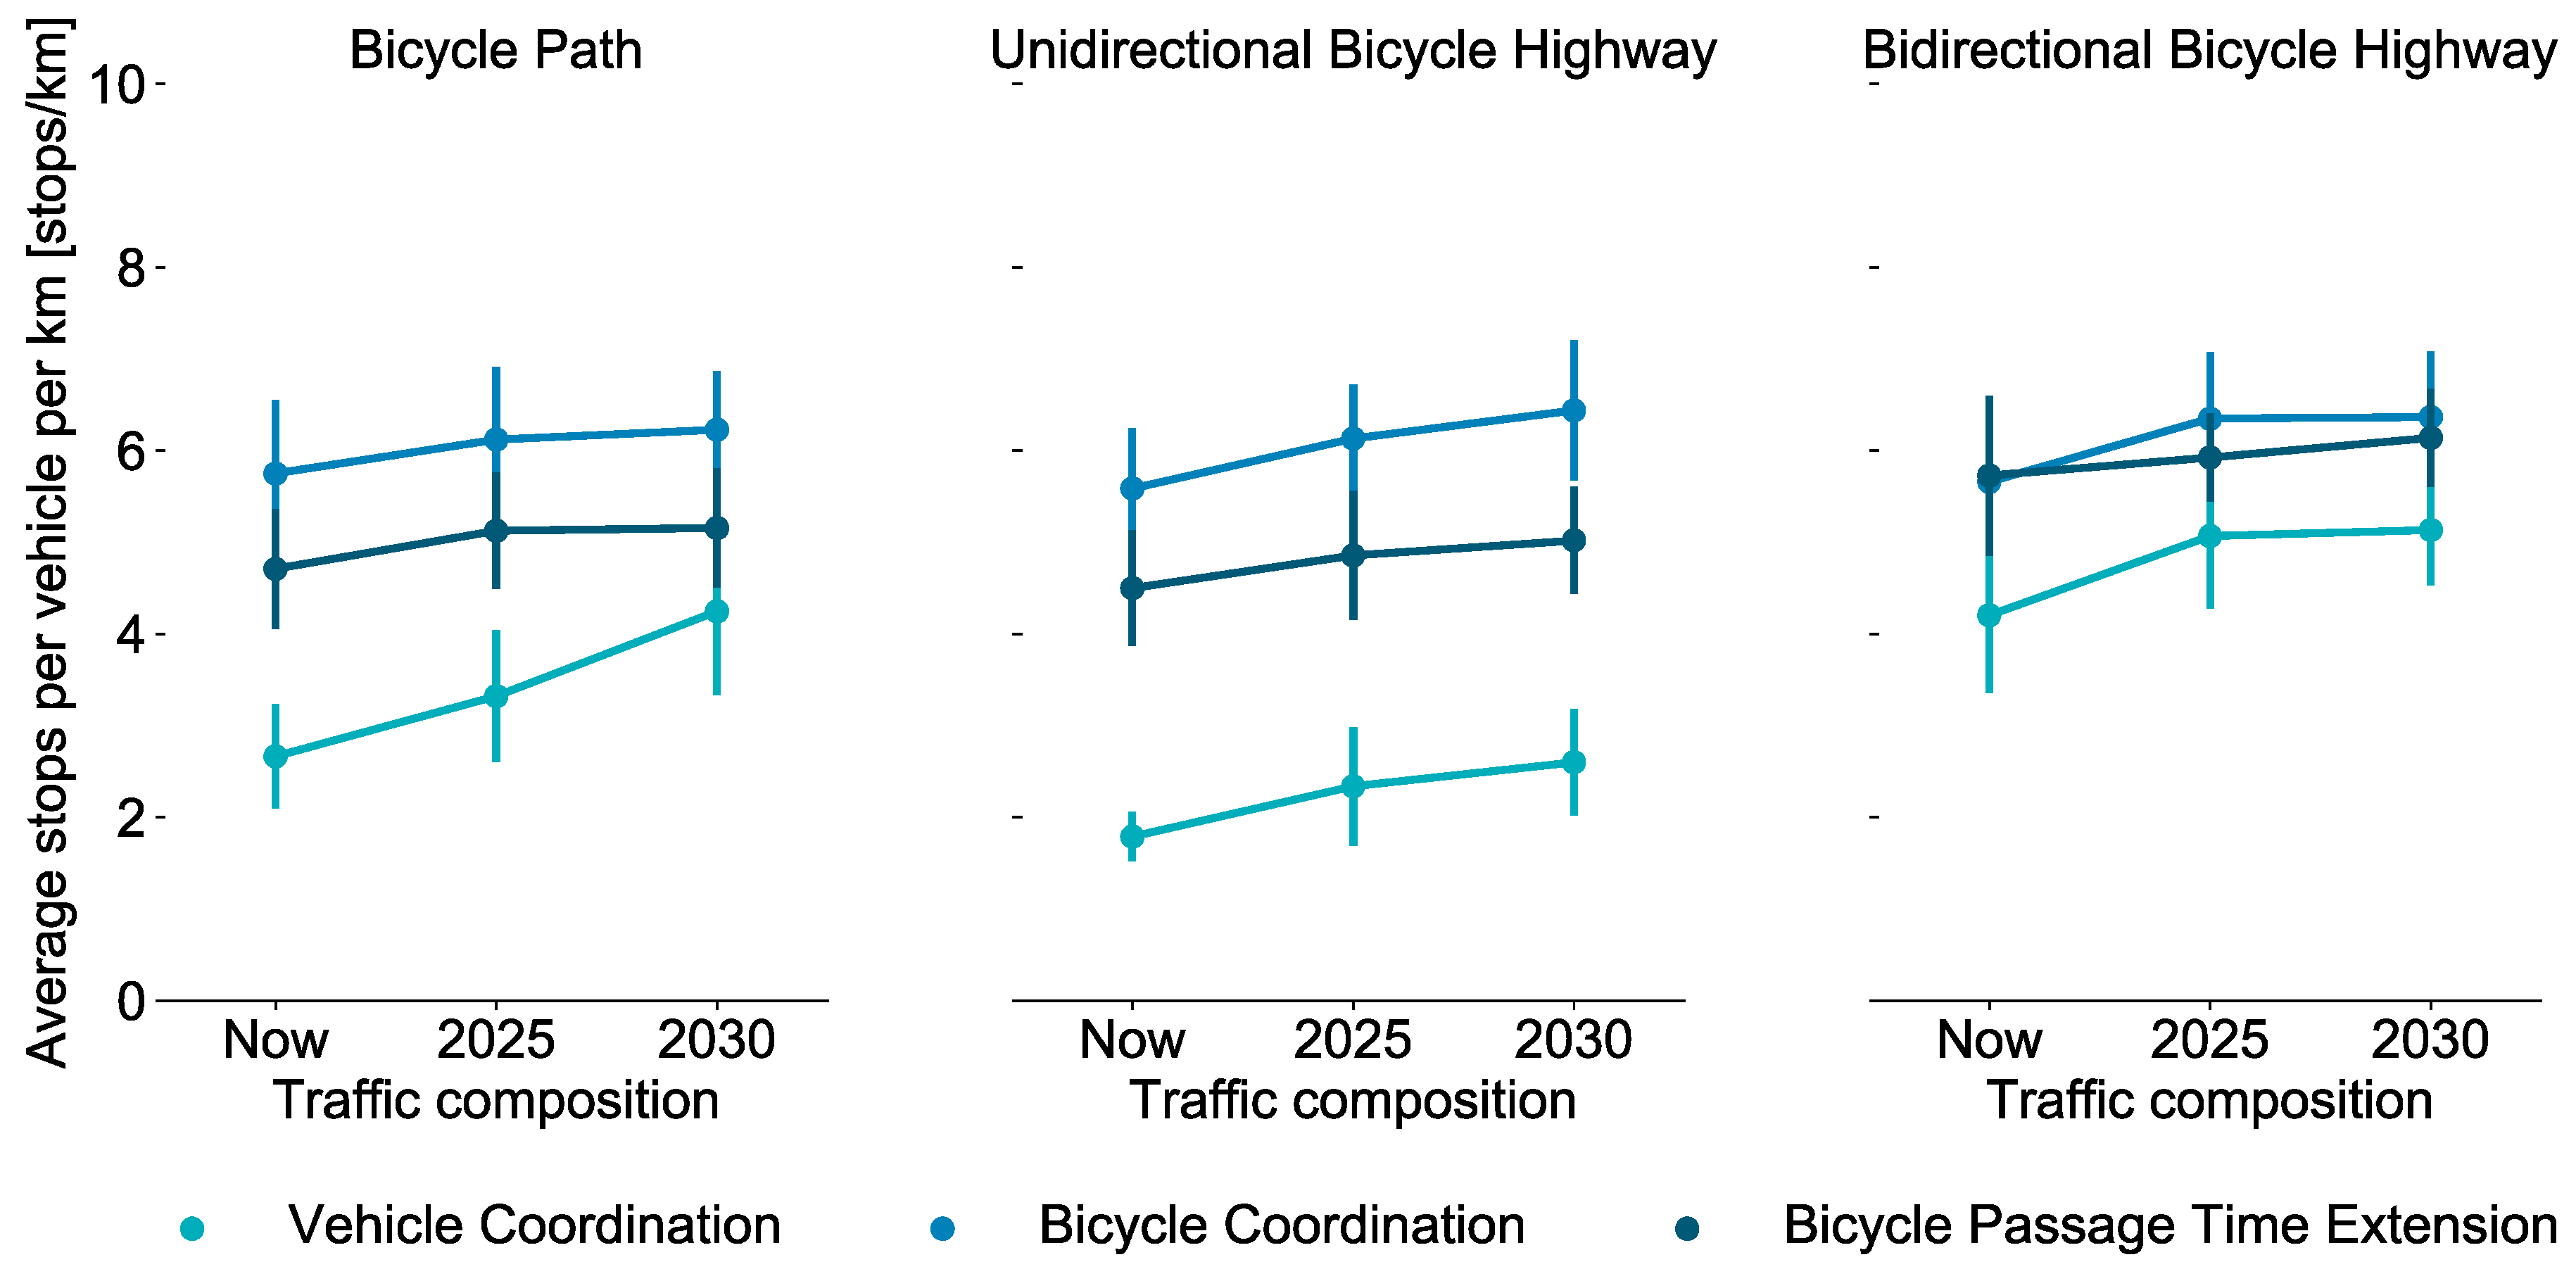
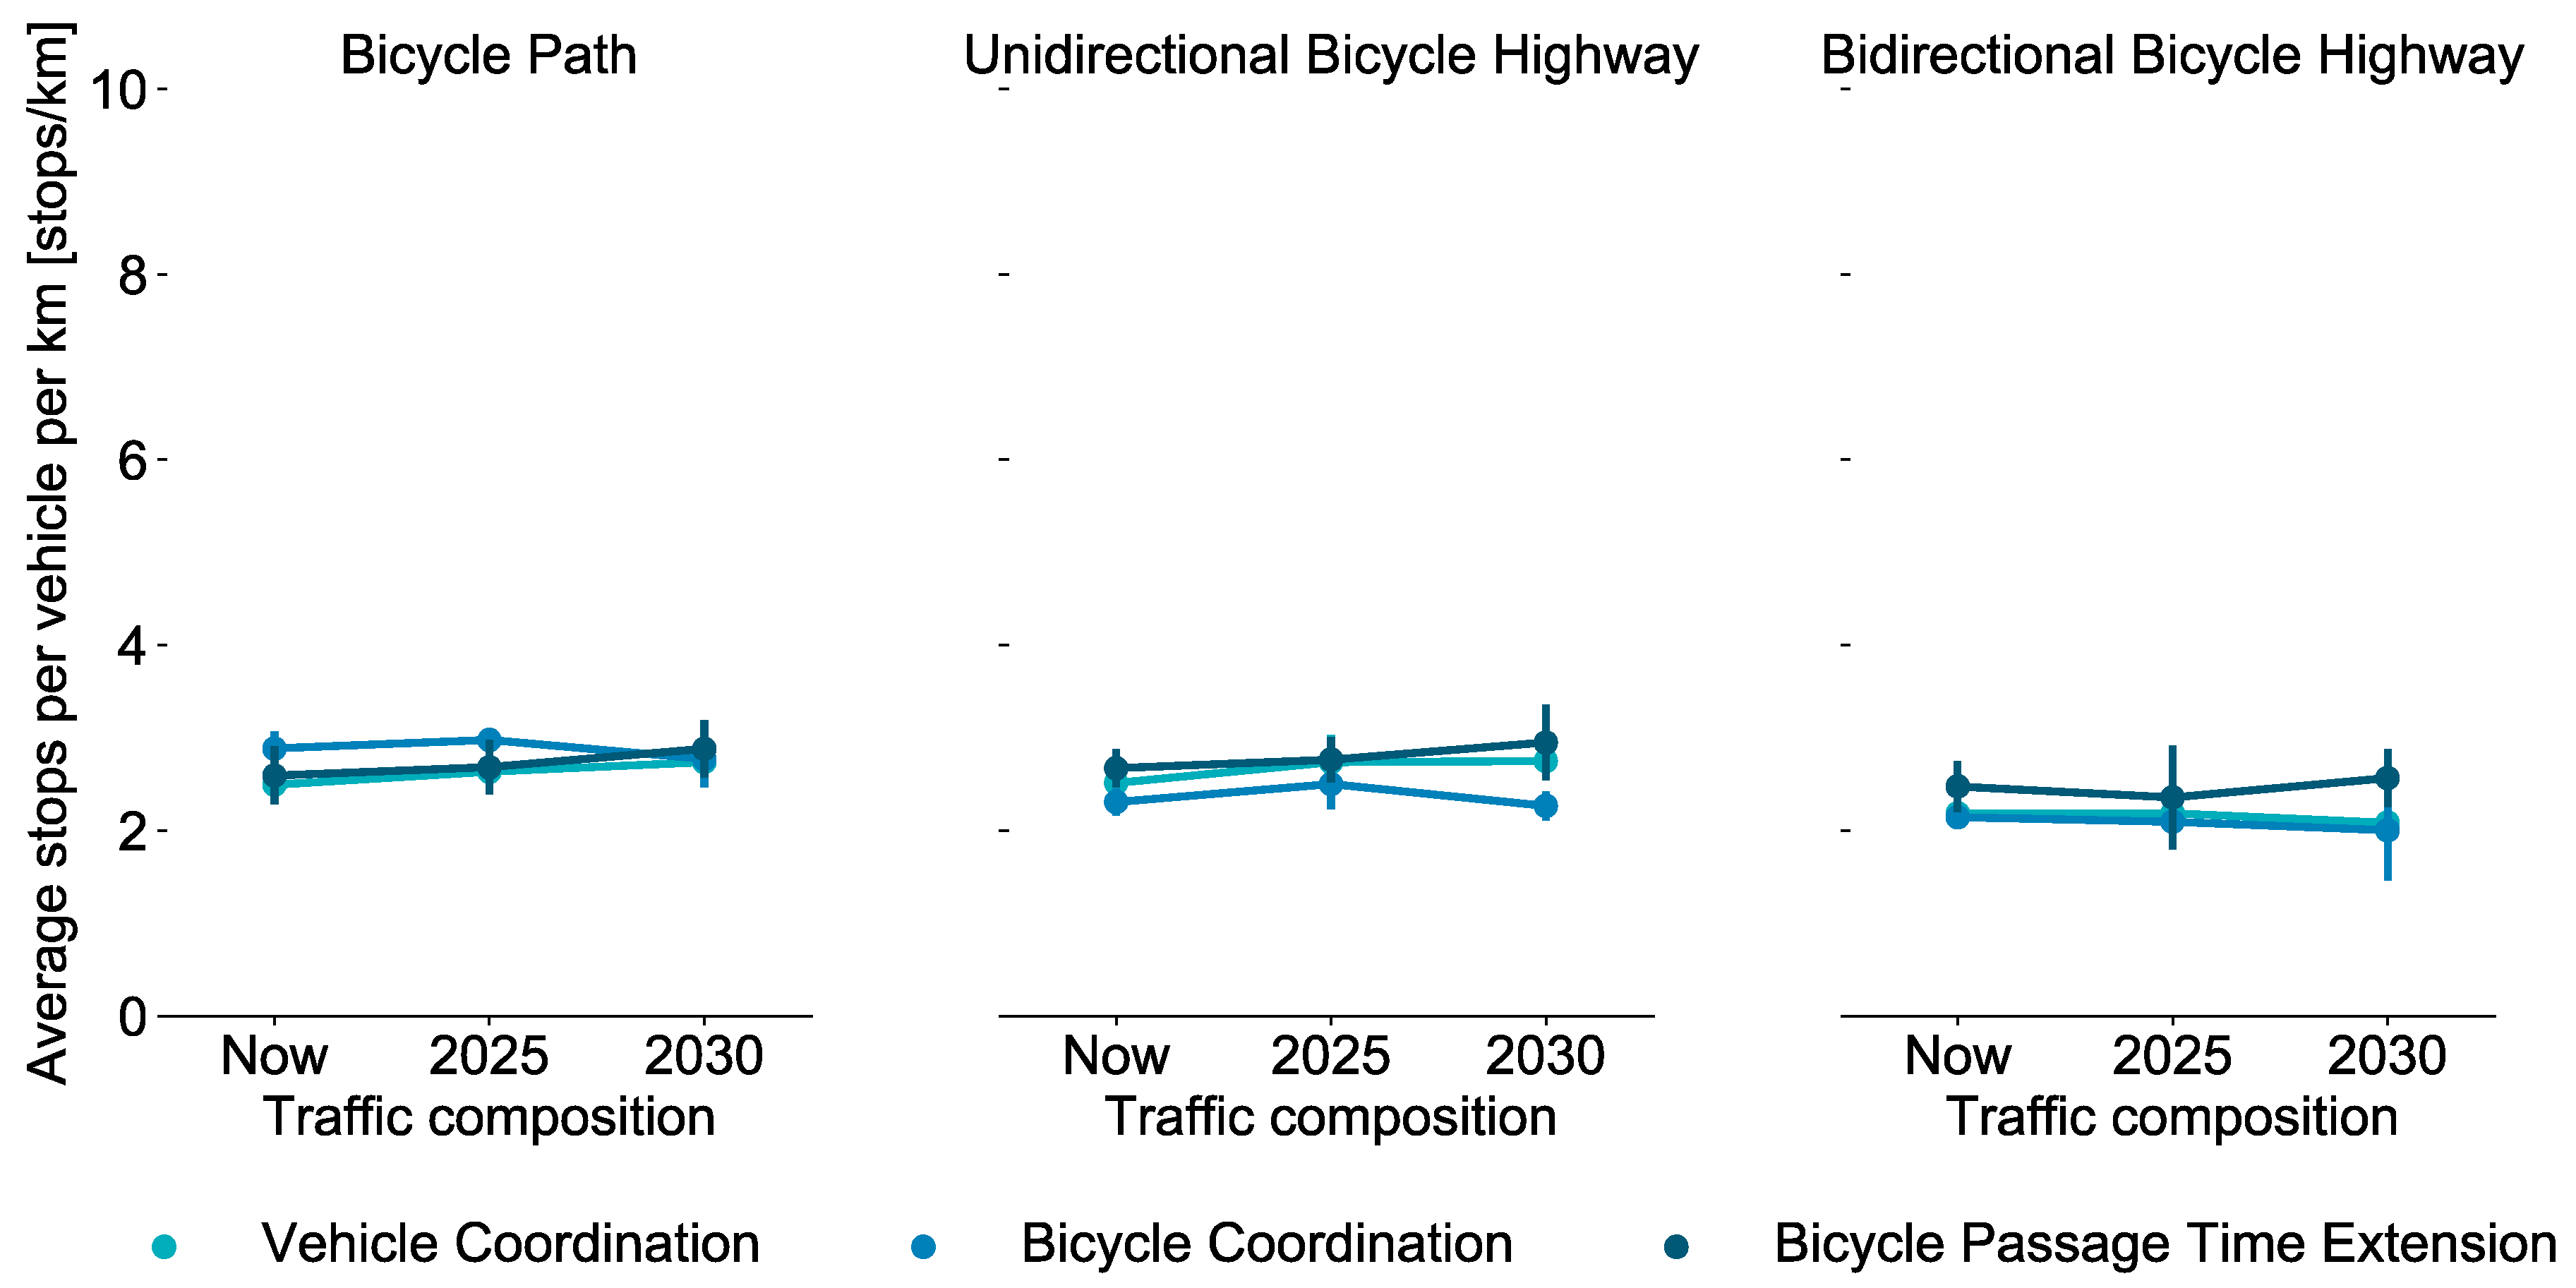
4.1.4. Number of Stops
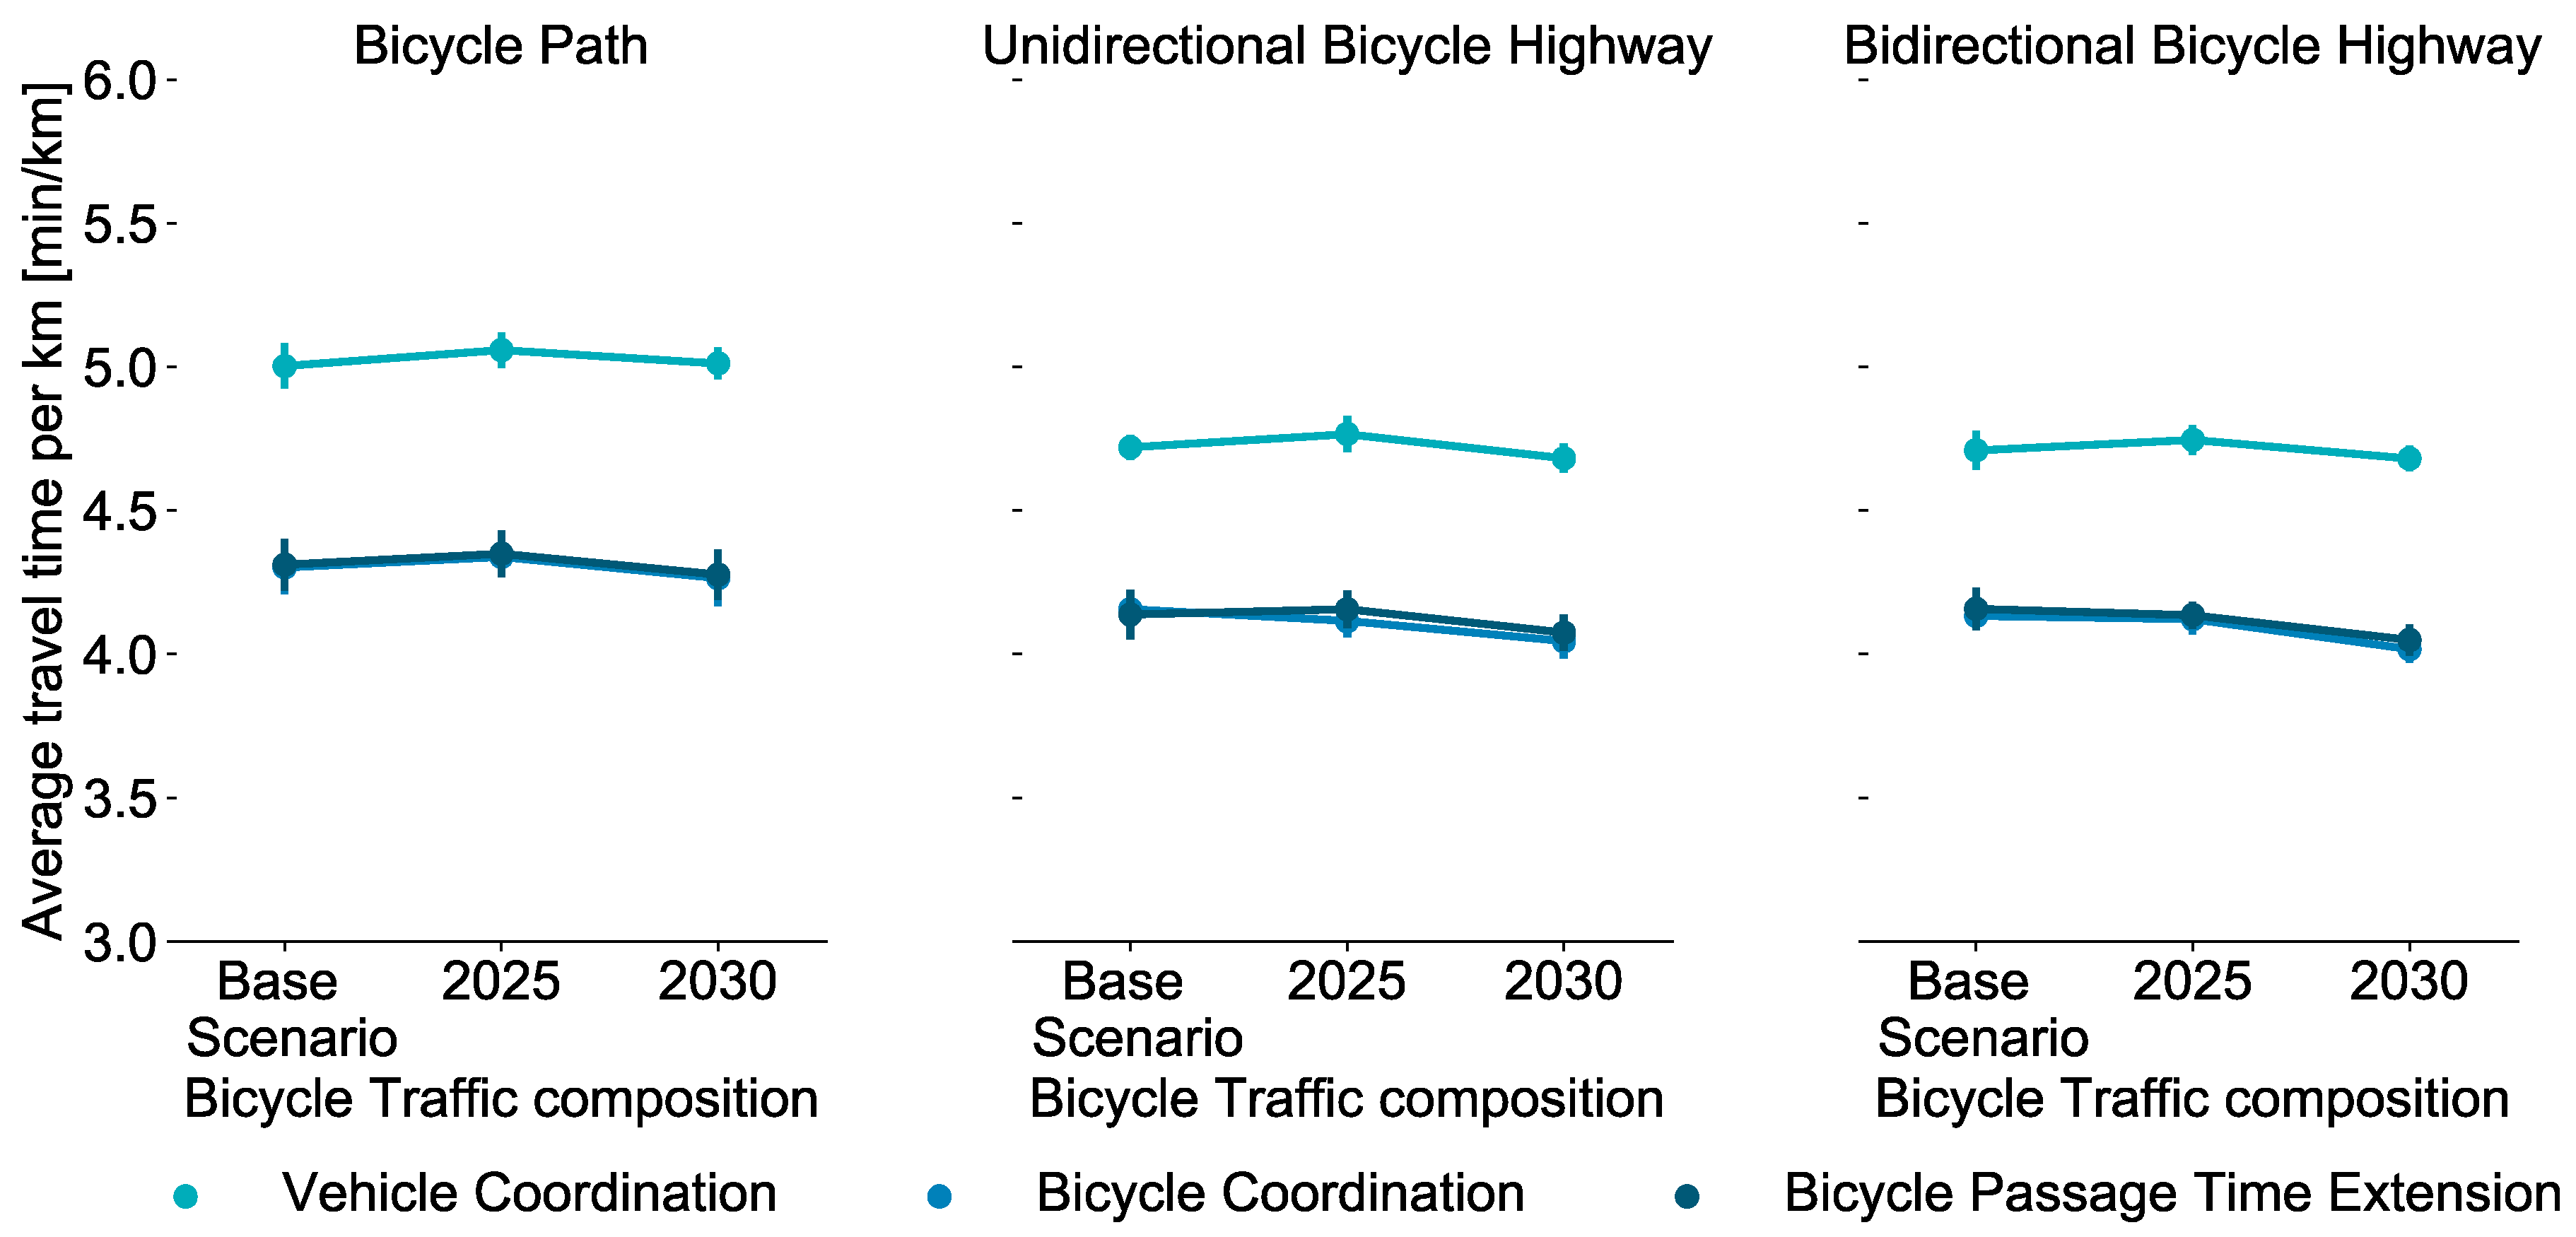
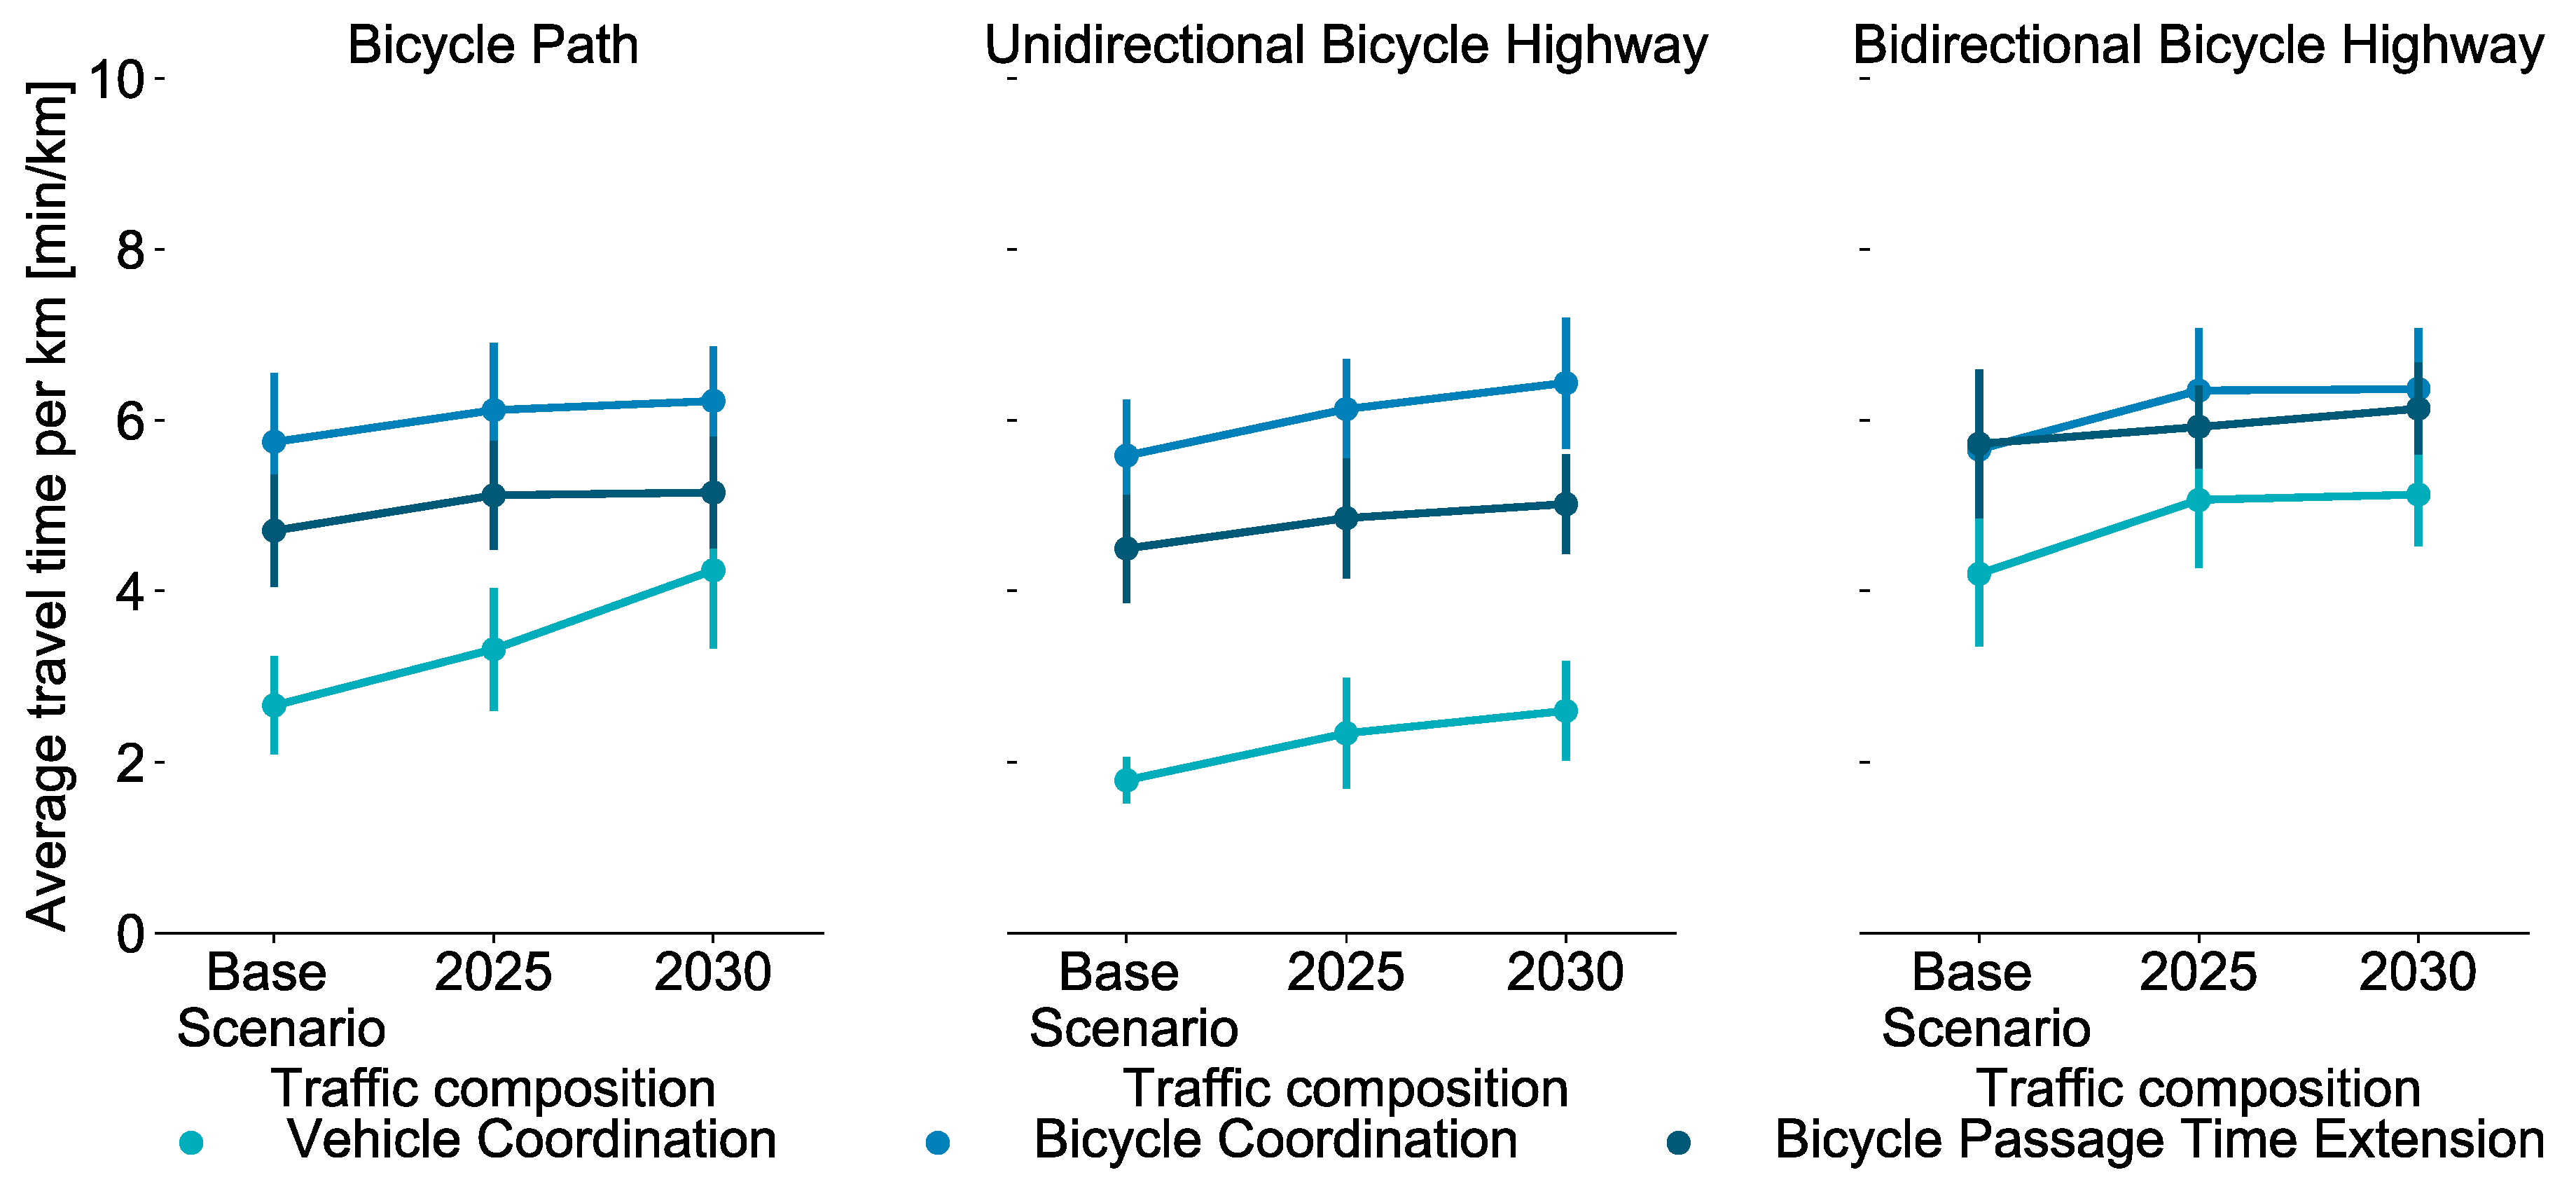
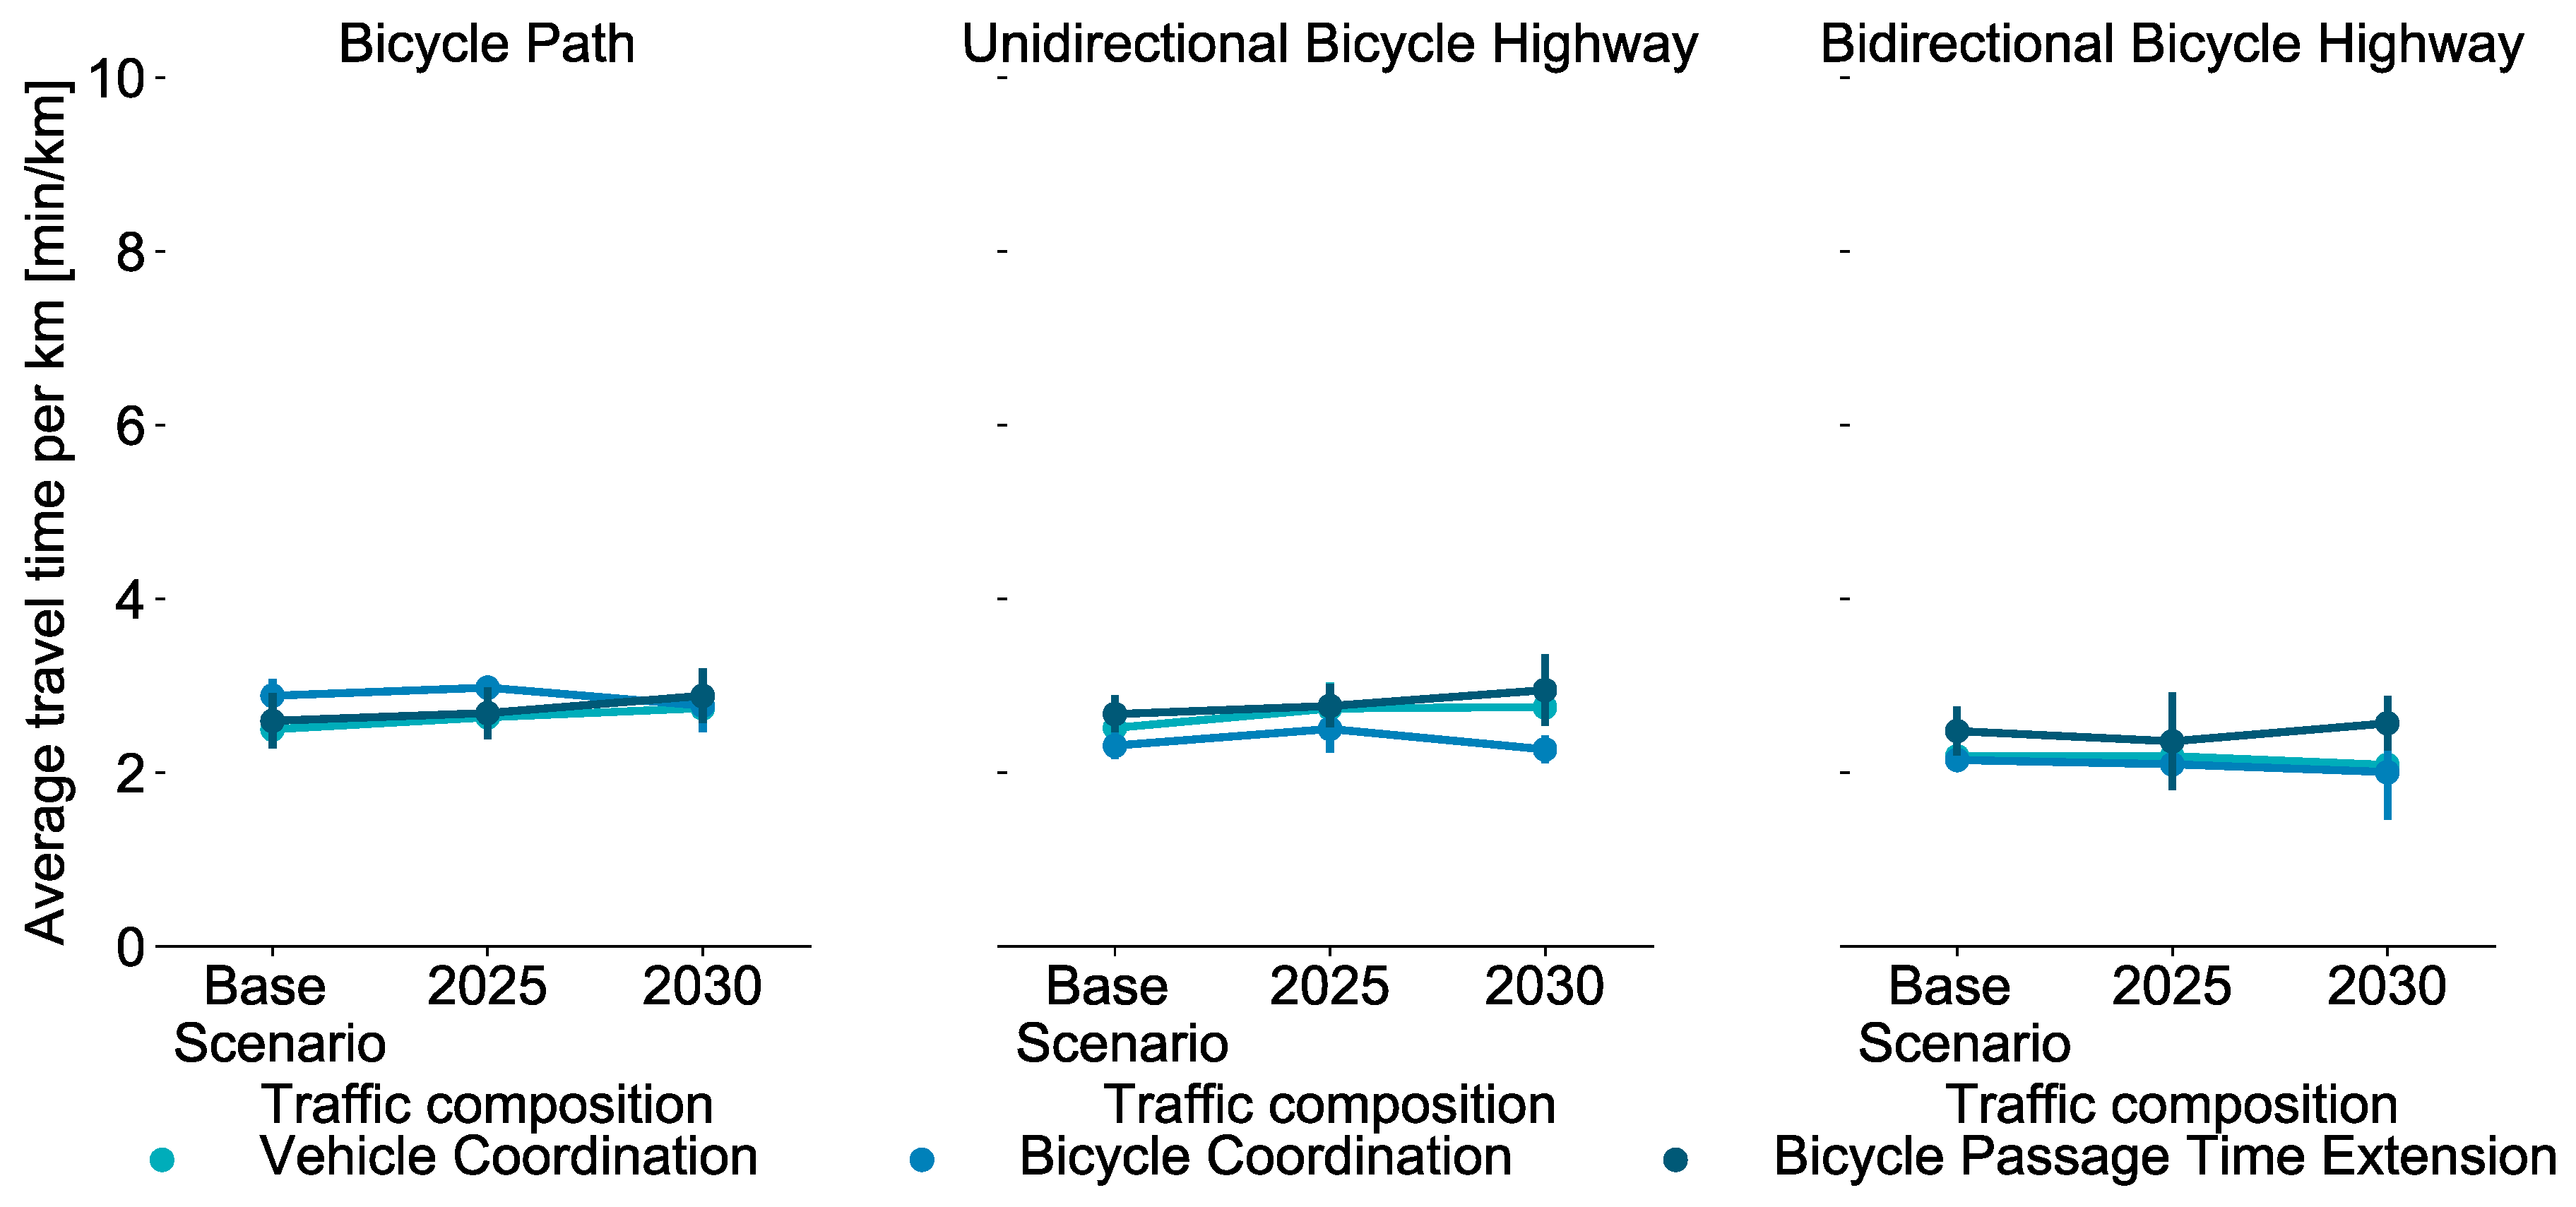
4.1.5. Travel Time
4.2. Motor Vehicles Traffic Performance
- Three intersections in study area (Theresienstraße, Schellingstraße, and Georgenstraße) are T-junctions in which motor vehicles from south to north cannot turn right. Therefore, motor vehicles do not need to stop for crossing bicyclists. This factor explains the slightly improved vehicular travel times with the bidirectional bicycle highway over the unidirectional bicycle highway.
- There are dedicated right turn traffic lanes in two intersections in the south–north travel directions (Von-der-Tann-Straße and Ungererstraße). Therefore, crossing motor vehicles are less affected by the right-turn motor vehicles.
- The traffic volume of motor vehicles from north to south is almost twice that from south to north. Since the infrastructure for both directions is similar, the traffic situation is less critical for south–north than in the north–south direction. Therefore, changing the bicycle infrastructure or their signal control strategies does not affect significantly the travel time of motor vehicles in the south–north travel direction.
5. Discussion
6. Conclusions
Author Contributions
Funding
Data Availability Statement
Conflicts of Interest
References
- National Association of City Transportation Officials. Urban Bikeway Design Guide; Island Press: Washington, DC, USA, 2014; ISBN 1610915658. [Google Scholar]
- Agarwal, A.; Ziemke, D.; Nagel, K. Bicycle superhighway: An environmentally sustainable policy for urban transport. Transp. Res. Part A Policy Pract. 2020, 137, 519–540. [Google Scholar] [CrossRef]
- Forschungsgesellschaft für Straßen-und Verkehrswesen (FGSV). Arbeitspapier: Einsatz und Gestaltung von Radschnellverbindungen; FGSV Verlag: Köln, Germay, 2014. [Google Scholar]
- Liu, G.; Te Brömmelstroet, M.; Krishnamurthy, S.; van Wesemael, P. Practitioners’ perspective on user experience and design of cycle highways. Transp. Res. Interdiscip. Perspect. 2019, 1. [Google Scholar] [CrossRef]
- Van Lierop, D.; Soemers, J.; Hoeke, L.; Liu, G.; Chen, Z.; Ettema, D.; Kruijf, J. Wayfinding for cycle highways: Assessing e-bike users’ experiences with wayfinding along a cycle highway in the Netherlands. J. Transp. Geogr. 2020, 88. [Google Scholar] [CrossRef]
- Li, H.; Graham, D.J.; Liu, P. Safety effects of the London cycle superhighways on cycle collisions. Accid. Anal. Prev. 2017, 99, 90–101. [Google Scholar] [CrossRef] [PubMed]
- Atkins. Advanced Stop Line Variations Research Study: Research Findings. 2005. Available online: http://content.tfl.gov.uk/ASL-Findings-Report-October-011106.pdf (accessed on 15 January 2021).
- Rayaprolu, H.S.; Llorca, C.; Moeckel, R. Impact of bicycle highways on commuter mode choice: A scenario analysis. Environ. Plan. B Urban Anal. City Sci. 2018, 47, 662–677. [Google Scholar] [CrossRef]
- Hans, S.; Jette, J.; Suzanne, V.; Alexander, T.; Nielsen, S.; Simon, R. Effects of upgrading to cycle highways—An analysis of demand induction, use patterns and satisfaction before and after. J. Transp. Geogr. 2017, 64, 203–210. [Google Scholar] [CrossRef]
- Bhuyan, P.; McCoy, E.J.; Li, H.; Graham, D.J. Analysing the causal effect of London cycle superhighways on traffic congestion. arXiv 2020, arXiv:2003.08993. [Google Scholar]
- Transport for London. London Cycling Design Standards. 2014. Available online: https://tfl.gov.uk/corporate/publications-and-reports/streets-toolkit (accessed on 15 January 2021).
- Dufour, D. PRESTO Cycling Policy Guide—Cycling Infrastructure. 2010, p. 45. Available online: https://ec.europa.eu/energy/intelligent/projects/sites/iee-projects/files/projects/documents/presto_policy_guide_cycling_infrastructure_en.pdf (accessed on 15 January 2021).
- COWI. Koncept 2.0 Planlægning, Udformning Og Drift. 2018. Available online: www.supercykelstier.dk (accessed on 15 January 2021).
- CROW. Design Manual for Bicycle Traffic; CROW: Ede, The Netherlands, 2016. [Google Scholar]
- Brenner BERNARD Ingenieure GmbH Planersocietät and EG Planungsbüro VIA. Qualitätsstandards für Radschnellverbindungen in Baden-Württemberg. 2018. Available online: https://www.fahrradland-bw.de/fileadmin/user_upload_fahrradlandbw/1_Radverkehr_in_BW/i_Radschnellverbindungen/Qualitaetsstandards_RSV_BW.pdf (accessed on 15 January 2021).
- Transport of London. Cycleways. 2020. Available online: https://tfl.gov.uk/modes/cycling/routes-and-maps/cycleways (accessed on 15 October 2020).
- Spape, I.; Fuchs, C.; Jürgen, G. Status quo und Erfahrungen mit der Planung und dem Betrieb von Radschnellwegen in den Niederlanden, Daenemark, Grossbritannien und Deutschland. Straßenverkehrstechnik 2015, 59, 639–652. [Google Scholar]
- Regionalverband Ruhr. Über den Radschnellweg Ruhr RS1. 2020. Available online: http://www.rs1.ruhr/radschnellweg/planung.html (accessed on 23 January 2017).
- Ingenieurbüro, H. Berg & Partner GmbH. Radschnellweg Euregio. 2016. Available online: https://bueroberg.eu/wp-content/uploads/2019/08/Ref_IB-Berg_Stra%C3%9Fe_B%C3%BCrgerbeteiligung_opt.pdf (accessed on 15 January 2021).
- PGV-Alrutz GbR; PGV Dargel-Hildebrandt GbR. Radschnellweg OWL: Überprüfung der Machbarkeit für den Radschnellweg Ostwestfalen-Lippe. Hannover, Germany. 2016. Available online: https://opus.ostfalia.de/frontdoor/deliver/index/docId/642/file/Groeger_2016_Knotenpunkttypologien_Radschnellverbindungen.pdf (accessed on 14 January 2021).
- AFGS Radschnellwege in NRW. 2017. Available online: https://www.radschnellwege.nrw/fileadmin/user_upload/downloads/RSW_Planungshilfe_RZ_web.pdf. (accessed on 15 January 2021).
- Li, H.; Ding, H.; Ren, G.; Xu, C. Effects of the London Cycle Superhighways on the usage of the London Cycle Hire. Transp. Res. Part A Policy Pract. 2018, 111, 304–315. [Google Scholar] [CrossRef]
- Van Goeverden, K.; Godefrooij, T. The Dutch Reference Study: Cases of Interventions in Bicycle Infrastructure Reviewed in the Framework of Bikeability; Delft University of Technology: Delft, The Netherlands, 2011; ISBN 9789078271079. [Google Scholar]
- Transport for London Barclays Cycle Superhighways Evaluation of Pilot Routes 3 and 7. 2011, pp. 1–61. Available online: https://www.whatdotheyknow.com/request/162841/response/402026/attach/3/BCSpilotevaluationreport.pdf (accessed on 15 January 2021).
- National Research Council. Highway Capacity Manual; Transportation Research Board: Washington, DC, USA, 2016. [Google Scholar]
- Forschungsgesellschaft für Straßen-und Verkehrswesen (FGSV). Handbuch für die Bemessung von Straßenverkehrsanlagen (HBS); Forschungsgesellschaft für Straßen-und Verkehrswesen e. V., FGSV Verlag: Köln, Germany, 2015. [Google Scholar]
- Baumann, F. Berner Ampeln Stehen auf Grün. Velojournal. 2016. Available online: http://www.velojournal.ch/vj-online/nachrichten/2016/berner-ampeln-stehen-auf-grün.html (accessed on 4 April 2017).
- Hoegh, N. Green waves for cyclists in Copenhagen Denmark—Copenhagen. In Workshop at Velo-City “From Vision to Reality”; European Cyclists’ Federation: Munich, Germany, 2007. [Google Scholar]
- Mensik, K.; Beyer, F. Koordinierung von Lichtsignalanlagen fuer den Radverkehr/Coordinating of traffic lights for bicycle traffic. Straßenverkehrstechnik 2013, 57, 621–627. [Google Scholar]
- Grigoropoulos, G.; Twaddle, H.; Spangler, M.; Hagenbring, M.; Düsterwald, M. Evaluierung der dynamischen Grünen Welle für Radfahrer-Sitraffic SiBike-in Marburg; Kirschbaum Verlag GmbH: Bonn, Germany, 2018; pp. 268–274. [Google Scholar]
- Koonce, P. Bicycle Countdown Signal—Time to Green. Available online: http://koonceportland.blogspot.de/2011/07/bicycle-countdown-signal-time-to-green.html (accessed on 27 November 2015).
- Kaths, H.; Grigoropoulos, G.; Krämer, K. Green signal countdown timers for bicycle traffic—Results from a field study. In Cycling Research Board 2019; Delft University of Technology: Delft, The Netherlands, 2019. [Google Scholar]
- Preethi, P.; Varghese, A.; Ashalatha, R. Modelling Delay at Signalized Intersections under Heterogeneous Traffic Conditions. Transp. Res. Procedia 2016, 17, 529–538. [Google Scholar] [CrossRef]
- Grigoropoulos, G.; Kazakovtsev, S.M.M.; Kaths, H.; Krämer, K. Evaluation of a Traffic Signal Coordination for Bicycles in a Mixed Motor Vehicle and Public Transport Urban Network. In Cycling Research Board 2019; Delft University of Technology: Delft, The Netherlands, 2019. [Google Scholar]
- Knight, P.; Bedingfeld, J.; Gould, E. Traffic Management Techniques for Cyclists: Final Report; Transport Research Laboratory (TRL): Wokingham, UK, 2011. [Google Scholar]
- Federal Highway Administration. Manual on Uniform Traffic Control. Devices for Streets and Highways. 2009. Available online: https://mutcd.fhwa.dot.gov/pdfs/2009/mutcd2009edition.pdf (accessed on 15 January 2021).
- Forschungsgesellschaft für Straßen-und Verkehrswesen (FGSV). Hinweise Zur Signalisierung Des Radverkehrs; Forschungsgesellschaft für Straßen-und Verkehrswesen e.V., FGSV Verlag: Köln, Germany, 2005. [Google Scholar]
- Richardson, D.; McLaughlin, D.; Kowpak, D.; Mang, J.; Parker, M.; Hardenbrook, D.; Vanderputten, R.; Noxon, G. Traffic Signal Guidelines for Bicycles. 2014. Available online: https://trid.trb.org/view/1343377 (accessed on 14 January 2021).
- Deutsches Institut für Urbanistik gGmbH. Amsterdam führt Grüne Welle für den Radverkehr ein. 2007. Available online: https://nationaler-radverkehrsplan.de/de/aktuell/nachrichten/amsterdam-fuehrt-gruene-welle-fuer-den-radverkehr (accessed on 4 April 2017).
- CROW Fietsberaad. Rotterdam First with Green LED Wave for Cyclists. 2010. Available online: http://www.fietsberaad.nl/index.cfm?section=repository&repository=Rotterdam+first+with+green+LED+wave+for+cyclists (accessed on 4 April 2017).
- Siemens, A.G. Weltpremiere in Marburg—Präsentation der Grüne-Welle-App für Radfahrer. 2017. Available online: www.siemens.com/presse/sibike (accessed on 4 May 2017).
- Deutsches Institut für Urbanistik (Difu) GmbH. Radschnellweg Zwischen München Und Garching Bzw. Unterschleißheim Kommt Weiter Voran. 2020. Available online: https://nationaler-radverkehrsplan.de/de/aktuell/nachrichten/radschnellweg-zwischen-muenchen-und-garching-bzw (accessed on 12 January 2021).
- Forschungsgesellschaft für Straßen-und Verkehrswesen (FGSV). Empfehlungen für Verkehrserhebungen (EVE). 2012. Available online: https://scholar.google.co.jp/scholar?hl=en&as_sdt=0%2C5&q=Empfehlungen+f%C3%BCr+Verkehrserhebungen+%28EVE%29.+2012&btnG= (accessed on 14 January 2021).
- Nobis, C.; Kuhnimhof, T. Mobilität in Deutschland—MiD Analysen zum Radverkehr und Fußverkehr; Infas Institut für angewandte Sozialwissenschaft GmbH: Berlin, Germany, 2019. [Google Scholar]
- Lopez, P.A.; Behrisch, M.; Bieker-walz, L.; Erdmann, J.; Fl, Y.; Hilbrich, R.; Leonhard, L.; Rummel, J.; Wagner, P.; Wießner, E. Microscopic Traffic Simulation Using SUMO. In Proceedings of the 21st International Conference on Intelligent Transportation Systems (ITSC), Maui, HI, USA, 4–7 November 2018; pp. 2575–2582. [Google Scholar]
- Haklay, M.; Weber, P. Openstreetmap: User-generated street maps. IEEE Pervasive Comput. 2008, 7, 12–18. [Google Scholar] [CrossRef]
- Gehlert, T.; Schleinitz, M.K.K.; Petzoldt, T.; Schwanitz, S.; Gerike, R. The German Pedelec Naturalistic Cycling Study—Study Design and First Experiences. Proc. Int. Cycl. Saf. Conf. 2012, 2012, 15. [Google Scholar]
- Astegiano, P.; Tampère, C.M.J.; Beckx, C. A preliminary analysis over the factors related with the possession of an electric bike. Transp. Res. Procedia 2015, 10, 393–402. [Google Scholar] [CrossRef]
- Schleinitz, K.; Petzoldt, T.; Franke-Bartholdt, L.; Krems, J.; Gehlert, T. The German Naturalistic Cycling Study—Comparing cycling speed of riders of different e-bikes and conventional bicycles. Saf. Sci. 2016, 92, 290–297. [Google Scholar] [CrossRef]
- Zweirad-Industrie-Verband. Zahlen—Daten—Fakten zum Deutschen Fahrrad-und E-Bike Markt 2019 Dynamischer Wachstumskurs der Fahrradindustrie Setzt Sich Ungebremst Fort. 2019. Available online: https://www.ziv-zweirad.de/fileadmin/redakteure/Downloads/PDFs/PM_2020_11.03._Fahrrad-_und_E-Bike_Markt_2019.pdf (accessed on 15 January 2021).
- Gruber, J.; Kihm, A. Reject or embrace? Messengers and electric cargo bikes. Transp. Res. Procedia 2016, 12, 900–910. [Google Scholar] [CrossRef]
- Fishman, E.; Cherry, C. E-bikes in the Mainstream: Reviewing a Decade of Research. Transp. Rev. 2016, 36, 72–91. [Google Scholar] [CrossRef]
- Assmann, T.; Müller, F.; Bobeth, S.; Baum, L. Planung von Lastenradumschlagsknoten. Ein Leitfaden für Kommunen und Wirtschaft zur Planung von Umschlagspunkten für Neue, Urbane Logistikkonzepte. 2019. Available online: https://repository.difu.de/jspui/handle/difu/576712 (accessed on 15 January 2021).
- Nürnberg, M. Analysis of using cargo bikes in urban logistics on the example of Analysis of using cargo bikes in urban logistics on the example of Stargard Green Cities 2018. Transp. Res. Procedia 2019, 39, 360–369. [Google Scholar] [CrossRef]
- COWI. Micro Simulation of Cyclists in Peak Hour Traffic; City of Copenhagen: Copenhagen, Denmark, 2012. [Google Scholar]
- Forschungsgesellschaft für Straßen-und Verkehrswesen (FGSV). Hinweise zur Mikroskopischen Verkehrsflusssimulation-Grundlagen und Anwendung; Forschungsgesellschaft für Straßen-und Verkehrswesen (Hrsg.): Köln, Germany, 2006; ISBN 3939715115. [Google Scholar]


| Type of Bicycle | Year | ||
|---|---|---|---|
| Base Scenario | 2025 | 2030 | |
| Conventional Bicycle (B) | 85 | 79 | 55 |
| Electric Bicycle (EB) | 10 1 | 14 2 | 30 3 |
| Cargo Bicycle (CB) | 2.5 | 3.5 | 7.5 |
| Electric Cargo Bicycle (ECB) | 2.5 | 3.5 | 7.5 |
| Specifications | Conventional Bicycle | Electric Bicycle | Cargo Bicycle | Electric Cargo Bicycle |
|---|---|---|---|---|
| Length (m) | 1.6 | 1.9 | 2.4 | 2.4 |
| Width (m) | 0.7 | 0.7 | 0.85 | 0.85 |
| Average speed (km/h) 1 | 15.3 | 17.4 | 13.6 | 18.97 |
| Max speed (km/h) 1 | 22 | 31 | 20.7 | 25.7 |
| Min speed (km/h) 1 | 10.1 | 12.2 | 10.7 | 11 |
| Standard deviation 1 | 2.3 | 4.4 | 2.2 | 3.1 |
| Max acceleration (m/s2) 2 | 1.8 | 1.8 | 1.8 | 1.94 |
| Max deceleration (m/s2) 2 | 4.0 | 4.0 | 4.0 | 4.25 |
| Lateral alignment 3 | Compact | Compact | Compact | Compact |
| Minimum gap [m] 4 | 0.5 | 0.5 | 0.5 | 0.5 |
| Minimum lateral gap [m] 3 | 0.5 | 0.5 | 0.5 | 0.5 |
| Parameters | Values |
|---|---|
| Simulation period | 90 min |
| Simulation resolution | 0.5 s |
| Warm-up time | 30 min |
| Evaluation horizon | 60 min |
Publisher’s Note: MDPI stays neutral with regard to jurisdictional claims in published maps and institutional affiliations. |
© 2021 by the authors. Licensee MDPI, Basel, Switzerland. This article is an open access article distributed under the terms and conditions of the Creative Commons Attribution (CC BY) license (http://creativecommons.org/licenses/by/4.0/).
Share and Cite
Grigoropoulos, G.; Hosseini, S.A.; Keler, A.; Kaths, H.; Spangler, M.; Busch, F.; Bogenberger, K. Traffic Simulation Analysis of Bicycle Highways in Urban Areas. Sustainability 2021, 13, 1016. https://doi.org/10.3390/su13031016
Grigoropoulos G, Hosseini SA, Keler A, Kaths H, Spangler M, Busch F, Bogenberger K. Traffic Simulation Analysis of Bicycle Highways in Urban Areas. Sustainability. 2021; 13(3):1016. https://doi.org/10.3390/su13031016
Chicago/Turabian StyleGrigoropoulos, Georgios, Seyed Abdollah Hosseini, Andreas Keler, Heather Kaths, Matthias Spangler, Fritz Busch, and Klaus Bogenberger. 2021. "Traffic Simulation Analysis of Bicycle Highways in Urban Areas" Sustainability 13, no. 3: 1016. https://doi.org/10.3390/su13031016
APA StyleGrigoropoulos, G., Hosseini, S. A., Keler, A., Kaths, H., Spangler, M., Busch, F., & Bogenberger, K. (2021). Traffic Simulation Analysis of Bicycle Highways in Urban Areas. Sustainability, 13(3), 1016. https://doi.org/10.3390/su13031016