Article

Characteristics and Driving Forces of Non-Grain Production of Cultivated Land from the Perspective of Food Security

1
Architecture Department, Shanghai Academy of Fine Arts, Shanghai University, Shanghai 200444, China
2
School of Architecture, Tsinghua University, Beijing 100084, China
*
Author to whom correspondence should be addressed.
Sustainability 2021, 13(24), 14047; https://doi.org/10.3390/su132414047
Submission received: 28 October 2021 / Revised: 9 December 2021 / Accepted: 16 December 2021 / Published: 20 December 2021

Abstract

:
A large proportion of the cultivated land in China has been used for non-grain production purposes. As food insecurity is worsening worldwide, this issue has attracted attention from the Chinese government. In order to curb this trend and to ensure food security, this paper explores the quantitative characteristics and spatial distribution of cultivated land used for non-grain purposes in Liyang City, Jiangsu Province, and discusses the clustering characteristics and mechanisms behind this based on spatial autocorrelation analysis and geographically weighted regression (GWR). The results show that most of the cultivated land in Liyang City has not been used for non-grain purposes, and the cultivated land reserve is abundant. Among all land types, irrigable land has the largest non-grain production rate of cultivated land. There is no significant spatial correlation of cultivated land for non-grain purposes in most towns in Liyang, among which Kunlun Street is in the High-High (HH) zone and Daibu Town in the Low-High (LH) zone. It is also found that the same factor has various impacts on the non-grain production of cultivated land in different towns, and the number of enterprises is the core factor that leads to the non-grain use of cultivated land in Liyang city. Low food prices lead some farmers to plant other crops with higher economic benefits, and also lead to the outflow of the rural labor force. This will not only accelerate the non-grain production of cultivated land, but also cause a large amount of cultivated land to be in a state of unmanned cultivation, further aggravating the proportion of non-grain production in cultivated land.

1. Introduction

The COVID-19 pandemic is exacerbating the concern for global food security. In October 2021, the United Nations World Food Program and the Food and Agriculture Organization issued a document stating that the world faces “unprecedented and catastrophic” food insecurity. In recent years, although the national treasury of global food production has increased significantly, which has a certain inhibitory effect on the rise of food prices, it is still not enough to provide absolute security. The COVID-19 pandemic indirectly triggered the problem of food security and exacerbated the hunger situation in some countries. Twenty-five countries around the world are at serious risk of hunger, and the number of people who are food insecure has increased to 270 million. Food security has always attracted a large amount of attention from the Chinese government. The No. 1 Central Documents from 2014 to 2021 have been calling on the industry to adopt the most stringent farmland protection system and to ensure stable grain output and acreage. To pursue sustainable development, it is essential not only to provide sufficient food supply, but to ensure the quality and quantity of existing cultivated land. Cultivated land is key to grain production. The sustainable development of cultivated land has a significant impact on food security [1]. Against the backdrop of rural revitalization, local governments have introduced a series of favorable policies to promote the development of agriculture, rural areas, and farmers, such as encouraging investment in rural areas, supporting large-scale agricultural operations, and relaxing the restrictions on rural land transfer [2]. While these measures have sped the development of rural areas, the area of cultivated land used for grain production has gradually been reduced [3], i.e., non-grain production of cultivated land. This means that othernon-grain crops, such as fruits and vegetables, are planted on the land that was once used for grain production. The land nature remains the same, but the planting structure has changed [4,5].
Statistics suggest that the grain acreage in China reduced by 970,000 hectares in 2019 alone, while the cultivated area of other non-grain crops increased by a large margin [6]. Some scholars highlighted that there is not much room for the increase in global grain output [7], and the supply of cultivated land will become the main factor that restricts the development of agriculture and threatens food security [8]. The protection of cultivated land has become a critical issue for both China and the whole world. It is necessary to stay vigilant regarding the issue of food security. The unconstrained development of non-grain cultivated land will threaten China’s food security and increase pressure on the global food market [9]. Cultivated land is the most important natural resource base for grain production and plays the most fundamental constraint role on the effective supply capacity of grain. The decline of cultivated land used for grain planting will lead to the decline of total grain output [10]. The direct impact of non-grain production of cultivated land is the problem of food security. To some extent, non-grain production of cultivated land can be understood as a new form of cultivated land loss. Therefore, the essence of non-grain production of cultivated land is the protection of cultivated land quality and quantity. However, the non-grain production of cultivated land will damage the production capacity of cultivated land, including the damage of soil tillage layer, greenhouse gas emission and aggravating agricultural non-point source pollution. If it is not controlled in time, it will threaten the national food security. Cultivated land resources are scarce. With the development of human society and economy, the demand for cultivated land resources of various industries and departments shows an increasing trend. The limited quantity of cultivated land resources and the growth of cultivated land demand constitute a special contradiction in the sustainable utilization of cultivated land resources [11]. The non-grain production of cultivated land mainly includes the development of the forest and fruit industry, pond digging and breeding and idle land cultivation. The development of the forest and fruit industry will occupy large-scale cultivated land. Pond digging and breeding and idle land cultivation will reduce the quality of cultivated land to a certain extent. Therefore, non-grain production will be harmful to cultivated land. However, the quantity and quality of cultivated land are the basis for ensuring the sustainable development of the grain industry [12]. Therefore, according to the nature of cultivated land, the Chinese government divides it into permanent basic farmland and general farmland to ensure the safety of cultivated land and promote the sustainable development of the grain industry. The General Office of the State Council issued a notice to ban the “non-grain production” of cultivated land in September 2020, listing six restrictions on the use of cultivated land. In November 2020, the General Office proposed suggestions to forbid “non-grain production” to stabilize grain production. These documents highlight the critical situation of the non-grain production of cultivated land.
After China launched the reform on rural land transfer in 2008, the land transfer in rural areas was accelerated. Early research on the non-grain production of cultivated land was inspired by land transfer [13,14,15], and the proportion of the cultivated land for non-grain production has further increased [16]. The proportion of non-grain cultivated land varies across regions with different economic conditions. In areas with better economic conditions, the proportion is often higher [17,18]. As the land transfer system improves, the non-grain production of cultivated land is conducted in large-scale agricultural operations: the larger the operation scale, the greater the probability of the non-grain production of cultivated land [19]. In order to curb the problem, many scholars explored the mechanisms behind it. The high cost and low return from grain growing is found to be the primary reason for the non-grain production of cultivated land [15,20]. The focus of local governments on economic development [21] also affects the non-grain production of cultivated land. Another research topic is the influence of non-grain production of cultivated land on food security [22,23] and ecological environment issues [24], in addition to corresponding countermeasures, such as offering greater agricultural subsidies [19], improving the cultivated land protection system [25], and standardizing rural land transfer procedures [2,26]. Most studies are qualitative analyses; only a small number of studies use remote sensing [27] and statistical models [28] to conduct quantitative analysis; and little research has been conducted to explore this issue based on spatial autocorrelation analysis [29], or to investigate the characteristics of the geographical difference and spatial pattern of non-grain production of cultivated land. For research on the problem of non-grain production of cultivated land, some scholars use the combination of remote sensing and GIS, and the regression discontinuity design (RDD) method to evaluate the policy [30]; other studies have used the Moran scatter plot methodology [31], logistic regression model [32] and geographically weighted regression [33] to analyze the characteristics and driving factors of the non-grain production of cultivated land. As China attaches high importance to rural revitalization, ecological civilization, and food security, food security has become closely related to the social stability and economic development of China. Studies have shown that knowledge on the temporal and spatial change patterns of cultivated land plays an important role in food security [34] and grain output [35]. This study aims to understand the non-grain production of cultivated land in China, and analyze its spatial characteristics and mechanisms. Taking Liyang City, Jiangsu Province, as an example, the specific research objectives are as follows: (1) based on the description of the overall situation of cultivated land in Liyang, we analyzed the temporal and spatial distribution characteristics of non-grain cultivated land; (2) the spatial correlation characteristics of non-grain cultivated land were explored using the Moran scatter plot methodology, and the driving factors were analyzed by GWR; (3) the mechanism of non-grain production of cultivated land was proposed, which provides a reference for agricultural sustainable development and policy-making.

2. Materials and Methods
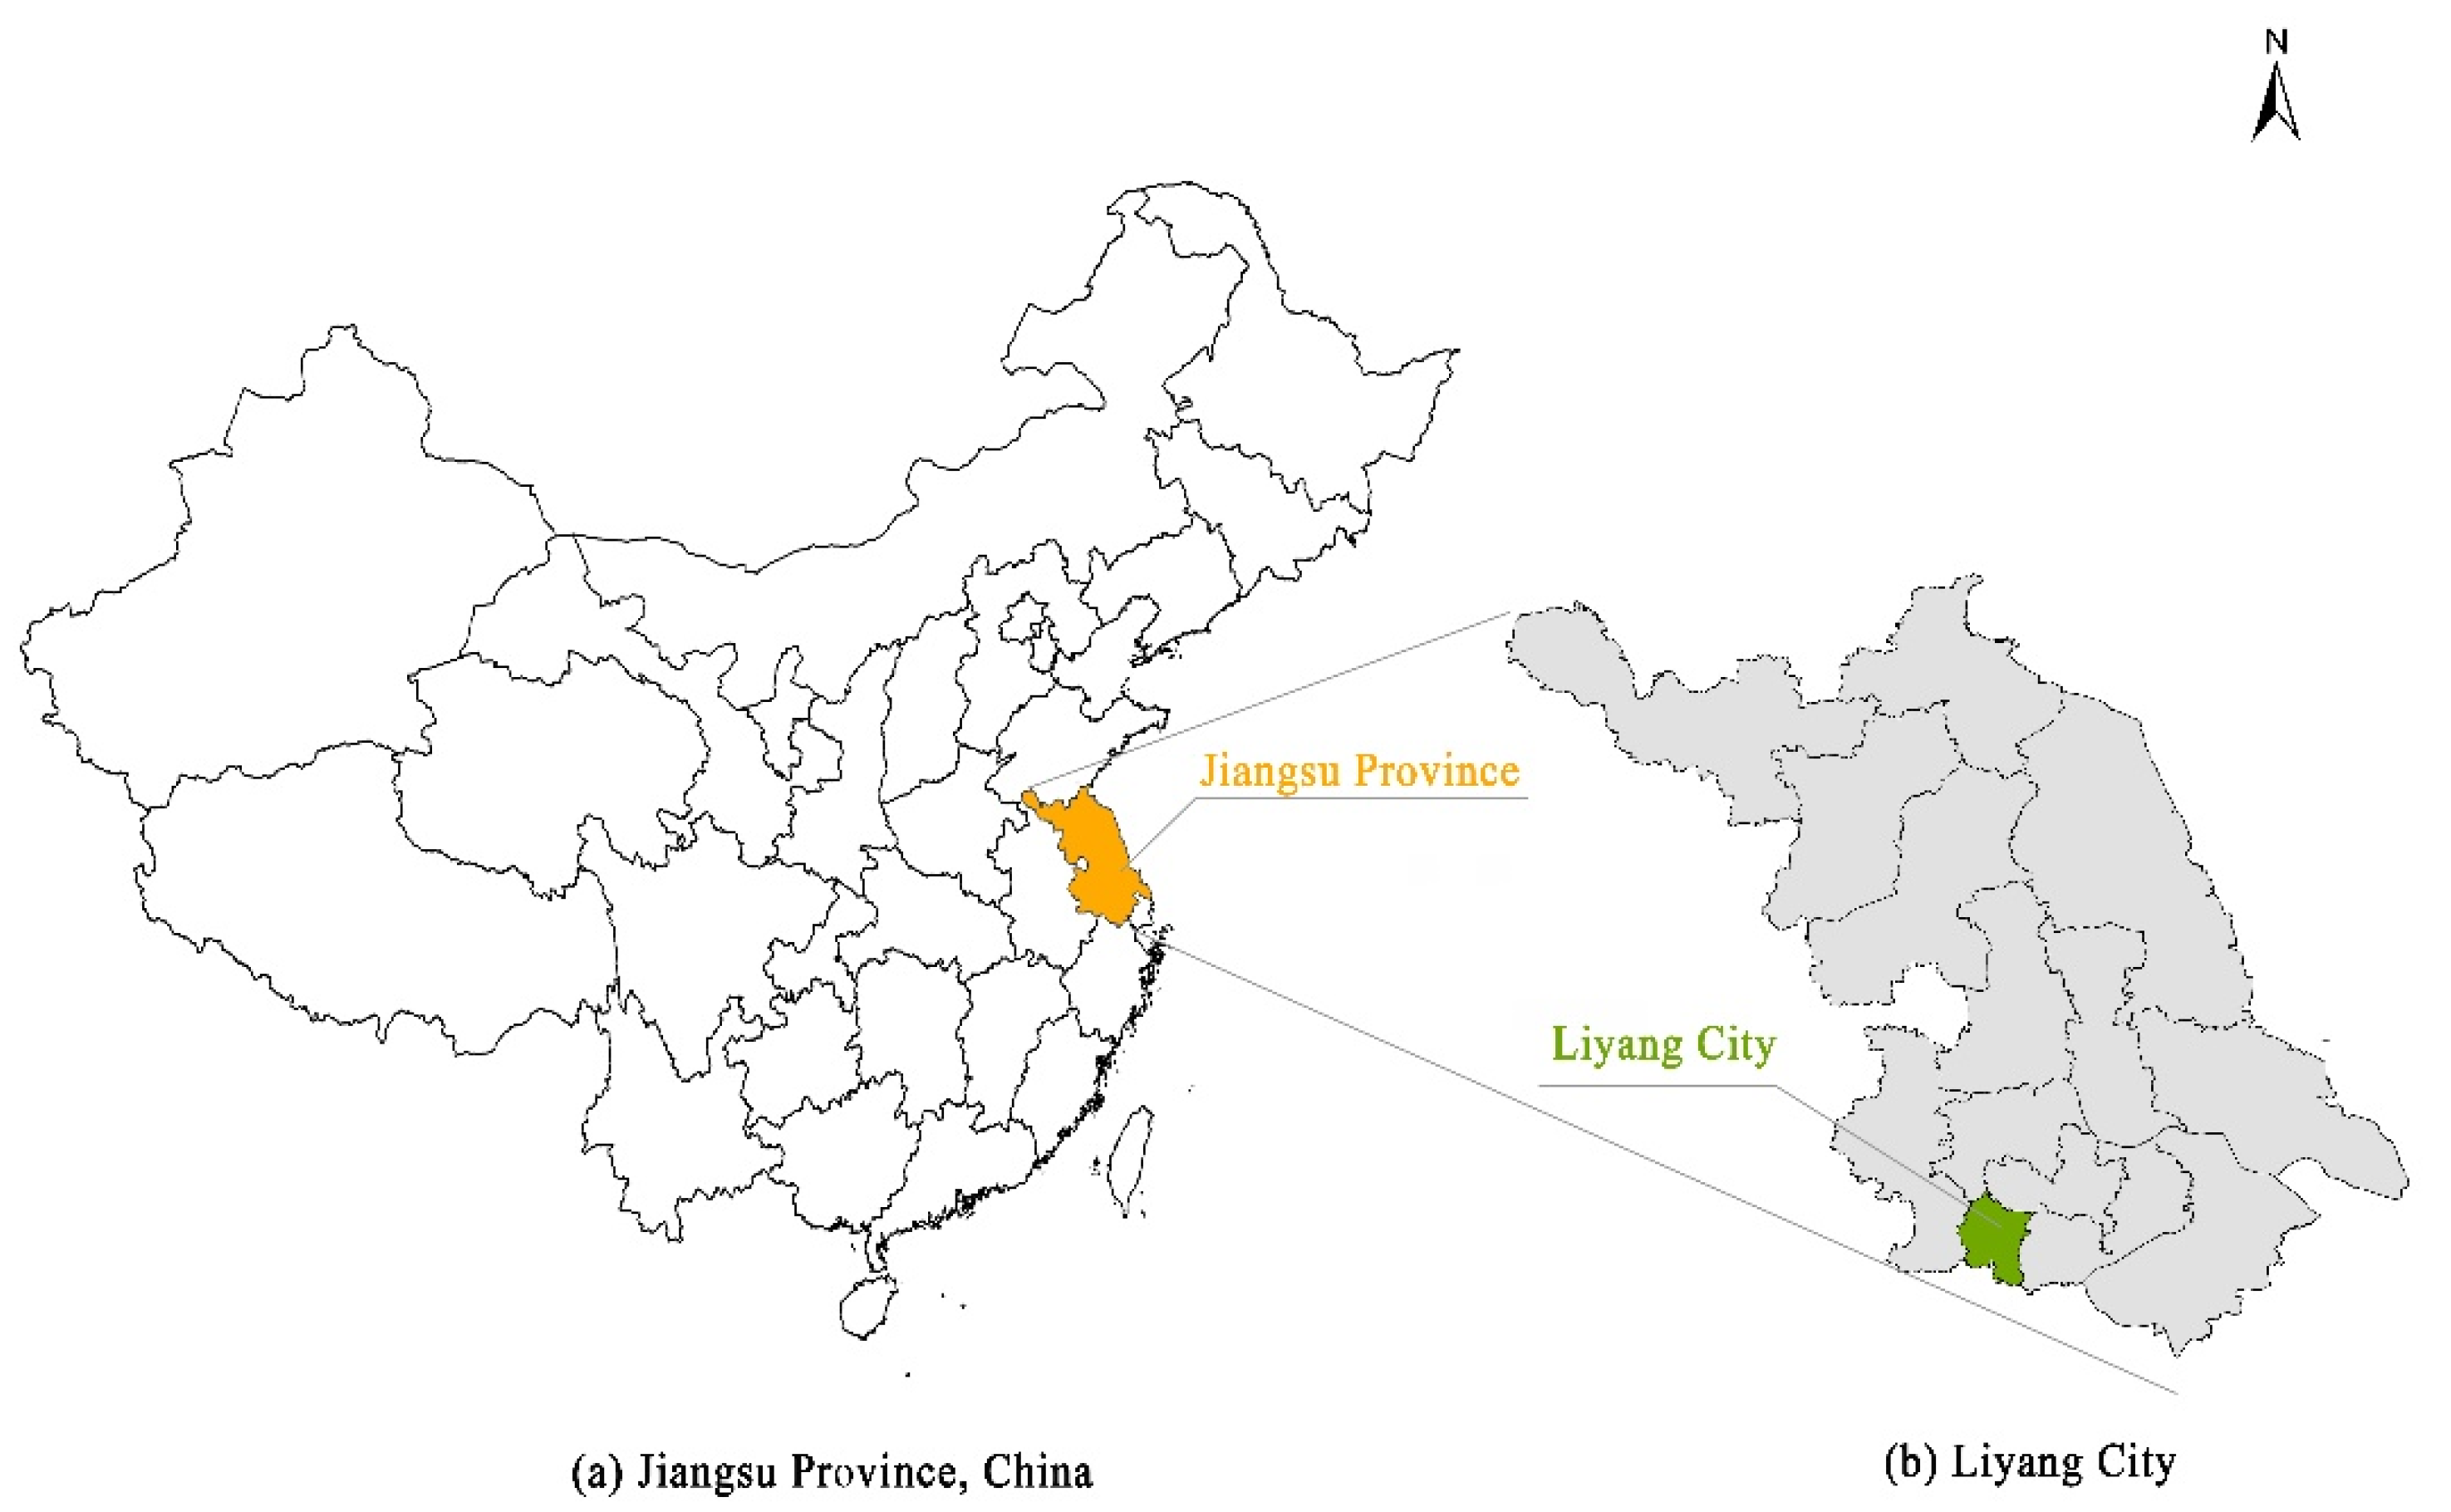
2.1. Study Area

Liyang is a county-level city in southwestern Jiangsu Province, east China. As shown in Figure 1, the city is located between 31°09′–31°41′ north latitude and 119°08′–119°36′ east longitude. It is 59.06 km long from south to north and 45.14 km wide from east to west. The total land area is 1535 square kilometers. Liyang is located on the edge of the northern subtropics, featuring an oceanic subtropical humid monsoon climate with four distinct seasons. The annual average temperature here is 17.5 °C, and precipitation 1149.7 mm. East wind prevails throughout the year.
There are various terrains in Liyang, including plains, mountains, hills, and polders. The hinterland of the city is a plain that stretches from west to east, which is surrounded by mountains and hills in the west, north, and south. There is sufficient cultivated land in Liyang. With the promotion of industrialization and urbanization, a large amount of cultivated land has been used for other purposes or simply abandoned. Some of the lands are used to grow non-grain crops. If this issue is left unattended, the city will face food security challenges.
The grain types in Liyang mainly include wheat, broad bean, rice, corn, beans, and potato. Among them, wheat and rice are the most important grain crops in Liyang, and their sowing area accounts for 92.56% of the total sowing area. As shown in Figure 2, the non-grain production type of Liyang mainly includes aquaculture and planting non-grain crop. Aquaculture is mainly used for raising shrimp and crabs. Planting non-grain crop focuses on planting species with high economic value, such as nandina, lawn and high-quality vegetables.
As the economic benefits of aquaculture and nandina are large and the industry development has developed to a certain extent, it can not only promote local economic development, but can also improve the income level of farmers. Therefore, the government not only controls its occupation of cultivated land, but also supports its further development with policies. In the context that China attaches importance to the protection of cultivated land, the local government has also taken action to order small-scale breeding ponds to be restored to cultivated land. However, due to historical reasons, only a few breeding ponds have been restored to cultivated land.

2.2. Data Source and Data Processing

The land data and administrative boundary data were sourced from the 3rd National Land Resource Survey on Liyang. This survey aims to fully investigate and verify the land resources of China and is a major tool to learn about national conditions and strengths [36]. With a minimum polygon area of cultivated land of 400 m2 (supplemented with notes of polygon map attributes) [37], the survey results are of unprecedentedly high accuracy. The socio-economic data on the city were collected from the Statistical Yearbook of Liyang City and the social and economic statistic ledgers of each town and village.
The data were processed in the following steps. According to the survey, the cultivated land in Liyang can be classified into four types: land for growing grain crops, land for non-grain crops, land for the rotation of grain and non-grain crops, and unplanted land. The polygon areas of “unplanted cultivated land” and “cultivated land for growing non-grain crops” were extracted using ArcGIS 10.6, and turned into vector data. The same operation is repeated for polygon areas of the land that “can be restored immediately” or “with engineering approaches”. The data were then classified into four types of land use (forest, garden, grassland, and water area) for further processing.

2.3. Framework and Method

2.3.1. Meteorological Datasets

The use of cultivated land reflects the human-land relationship in rural areas [38]. The non-grain production of cultivated land is a result of the changes in farmers’ livelihoods and market demand. As the return from grain growing is unsatisfactory, the grain growing area has declined. The good return from non-grain crop growing further contributes to the increasing proportion of non-grain production of cultivated land. The poor return also results in the outflow of rural labor, which will exacerbate the abandonment of cultivated land. To further pursue a higher return, the major growers continued to grow more non-grain crops. As the market demand diversifies, there are more substitutes to traditional grain crops, which indirectly leads to the reduction in the grain-growing area.
Cultivated land resources in Liyang City are composed of general cultivated land and permanent basic farmland. In principle, permanent basic farmland can only be used to grow grain crops. The current situation of planting cotton, oil, sugar, vegetables, and other non-grain crops can remain unchanged, but it is strictly prohibited to develop forest and fruit industry and aquaculture. General cultivated land is mainly used for grain, cotton, oil, sugar, vegetables, and other agricultural products and forage production; on the premise of not damaging the cultivated layer of cultivated land and not causing a change in cultivated land type, other crops can be planted appropriately. Permanent basic farmland in Liyang City accounts for 90.68% of the total cultivated land resources. Therefore, the issue of the non-grain production of cultivated land in Liyang City is, to a certain extent, the protection of permanent basic farmland.

2.3.2. Method

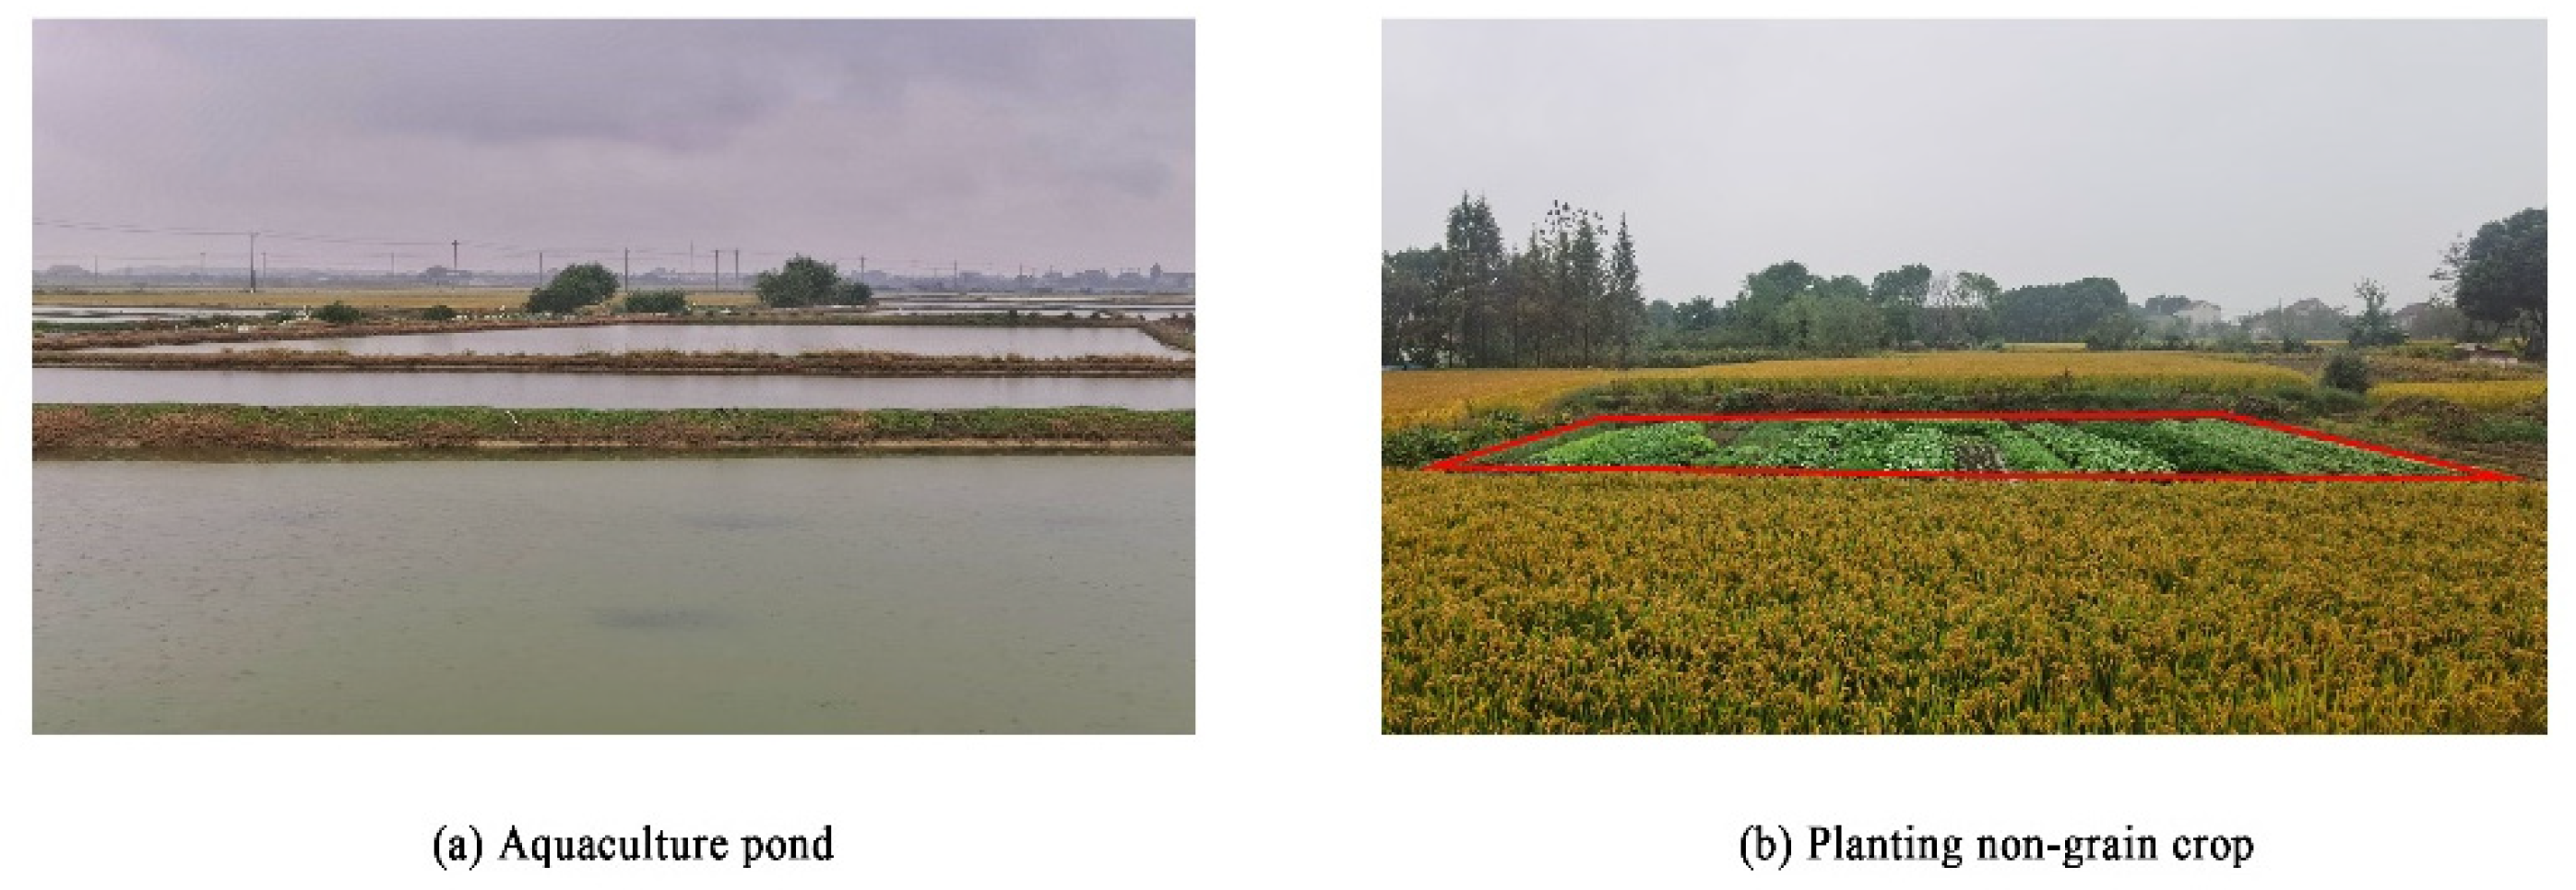
Rate of Cultivated Land for Non-Grain Production

The rate refers to the proportion of cultivated land used for non-grain purposes in the total cultivated land of a region. The higher the rate, the more cultivated land used for non-grain production. The formula of the rate is as follows:
Ng = Sng/S
where Ng represents the rate of cultivated land for non-grain production; Sng is for the area of cultivated land for non-grain production in Liyang; and S the total area of cultivated land in Liyang.

Spatial Autocorrelation Analysis

Spatial autocorrelation measures the aggregation of regional attribute values [39]. It can be used to visualize the data and reflect the similarity of the attribute values of adjacent units [40]. The Moran scatter plot and Local Indicator of Spatial Autocorrelation (LISA) aggregation distribution map are commonlyused indicators for the measurement of spatial autocorrelation. The global Moran index is calculated as below:
I = i = 1 n j = 1 n w i j ( x i x ¯ ) ( y i y ¯ ) s 2 i = 1 n j = 1 n w i j
where, I represents the Moran index; S 2 = 1 n i = 1 η ( x i x ¯ ) 2 ; wij is the spatial weight of elements i and j; xi and xj are the observed values of elements i and j; and x ¯ is the average value. The value of I is generally between −1 and 1, −1 to 0 indicates a negative correlation, 0 indicates no correlation, and 0 to 1 indicates a positive correlation.

Construction of the Spatially Weighted Regression Model and Selection of Variables

By including spatial factors, the geographically weighted regression (GWR) model not only estimates data with spatial autocorrelation but also reflects the spatial heterogeneity of parameters in different regions. The model ensures that the results better reflect reality [41,42].
Y i = β i ( u i , v i ) + j = 1 k β j ( u i , v i ) x i j + ε i
whereas, Yi is the dependent variable; (ui, vi) refers to the latitude and longitude coordinates of (n=) I sample space unit(s); βi(ui, vi) is the coordinate of the i-th sample; βj(ui, vi) is the regression parameter of the j-th independent variable; k is the number of independent variables; and xij is the j-th independent variable of the i-th sample space unit.

3. Results

3.1. Non-Grain Characteristic

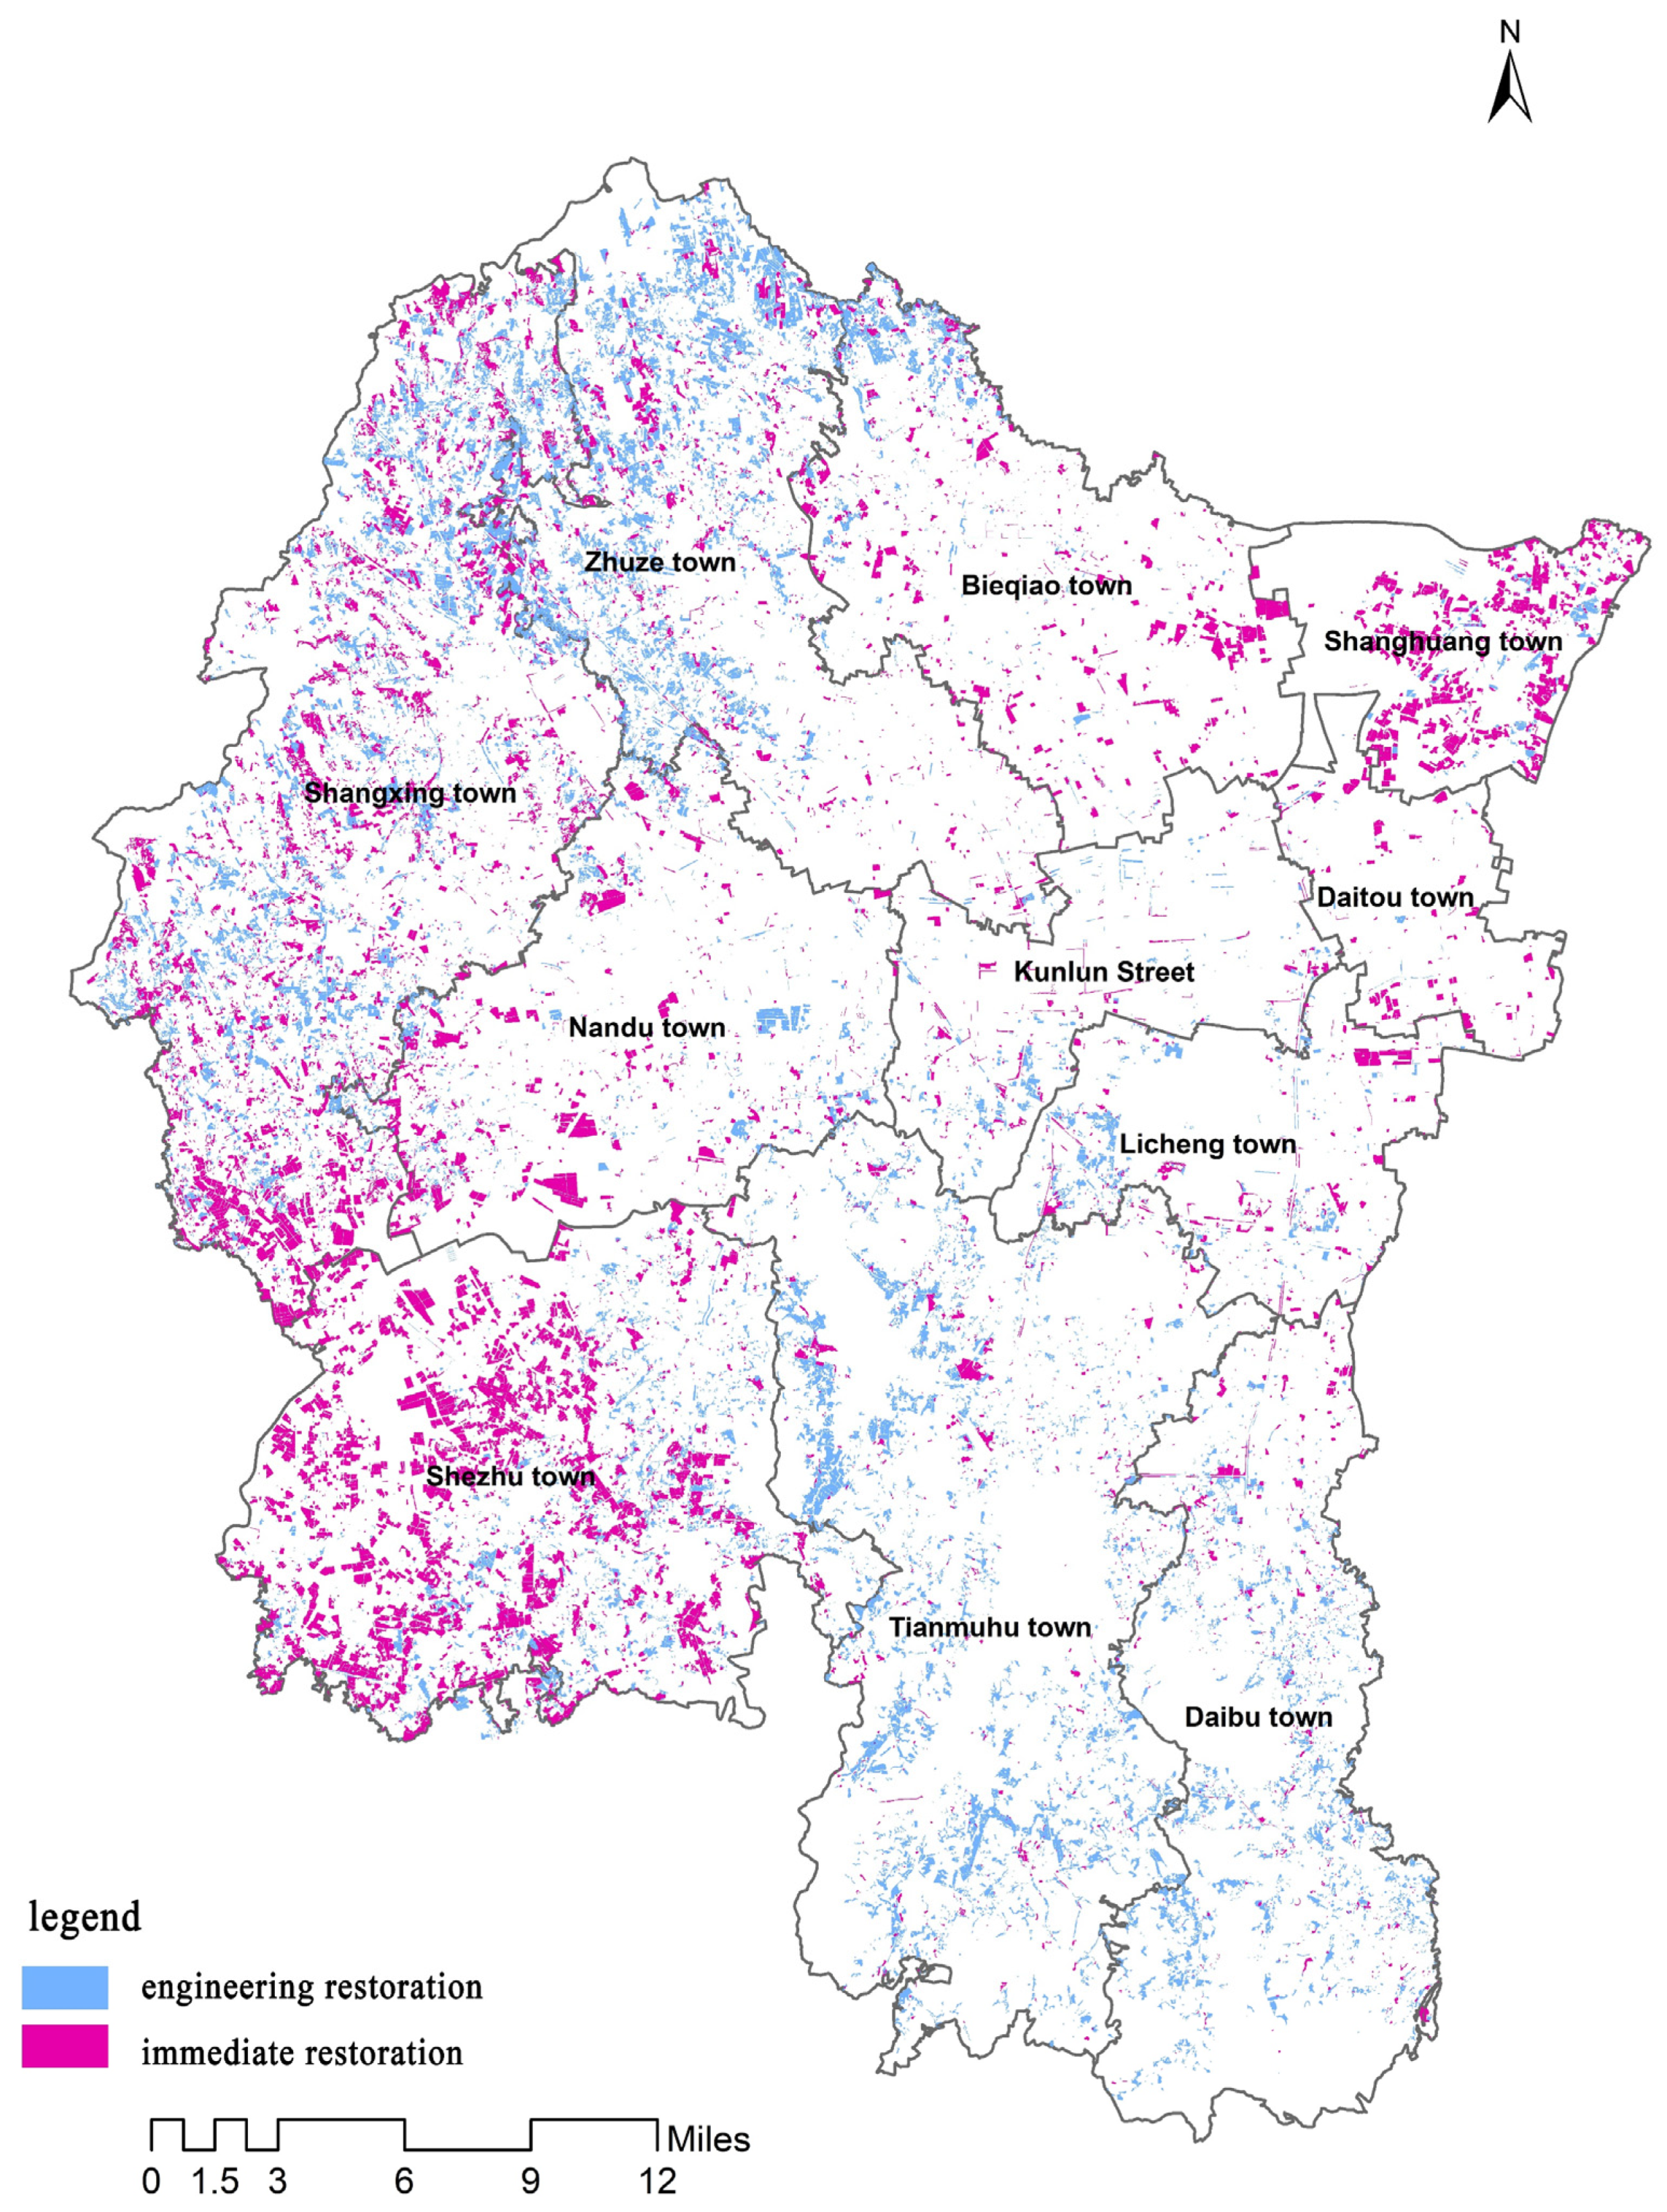
3.1.1. Characteristics of Cultivated Land for Non-Grain Production in Liyang

The cultivated land area in Liyang is 44,826.91 hectares, including 678.57 hectares of dry land, 3368.35 hectares of irrigable land, and 40,780.00 hectares of paddy field (90.97% of the cultivated land area of the city). Paddy fields occupy most of the cultivated land in Liyang.
Shangxing Town has the largest area of cultivated land—8181.36 hectares (18.25% of Liyang’s cultivated land), while Shanghuang Town has the smallest area of cultivated land—770.50 hectares (1.72% of Liyang’s cultivated land). The cultivated land area of Bieqiao Town, Zhuze Town, Nandu Town, and Shezhu Town accounts for 13.58% of the city’s total on average; and that of Kunlun Street, Licheng Town, Daitou Town, Daibu Town, and Tianmuhu Town accounts for approximately 5.14% of the total on average. (as shown in Table 1).
The cultivated land area for non-grain production in Liyang is 5818.61 hectares (12.98% of the total cultivated land area). The non-grain cultivated land can be divided into two types: that with nothing planted (994.88 hectares, 17.10% of the total), and that with non-grain crops (4823.72 hectares, 82.90% of the total).
Unplanted cultivated land is mostly found in Shangxing Town and Kunlun Street. As shown in Figure 3, for unplanted cultivated land, paddy fields and dry land cover an area of 662.12 and 322.76 hectares, accounting for 66.55% and 33.45% of the total, respectively. Cultivated land with non-grain crops is concentrated in Kunlun Street and its neighbors, Daitou Town and Licheng Town. As the land quality of paddy fields and irrigable land is superior, they can be used to grow various crops. Over 95.24% of the paddy fields and irrigable land are used to plant non-grain crops.
A total of 562.48 hectares of dry land and 2789.40 hectares of paddy fields is used for non-grain production purposes, accounting for 9.67% and 47.94% of the total in Liyang, respectively. Although the area of irrigable land only accounts for 7.51% of the total cultivated land, the area used for non-grain production in this type (2466.73 hectares) accounts for 42.39% of the total non-grain cultivated land in the city. In other words, 73.23% of the irrigable land is no longer used to grow grain crops. The problem of non-grain production is more serious in paddy fields: on one hand, the return from grain growing is low; on the other hand, irrigation facilities lead to higher costs.

3.1.2. Characteristics of Cultivated Land for Non-Grain Production in Liyang

There are two approaches to restoring cultivated land: engineering restoration and immediate restoration. Engineering restoration is introduced when the surface soil or the planting system of the cultivated land has been seriously damaged, and engineering measures should be taken to restore the land before crops are planted again. Immediate restoration is conducted when the plowing area and irrigation system of the cultivated land remain intact, and crops can be planted on the land after the surface is cleaned.
The restorable cultivated land area in Liyang is 19,450.57 hectares, 3.34 times of the cultivated land area for non-grain production. Areas in need of engineering restoration and immediate restoration are 10,098.51 (51.94%) and 9352.06 hectares (48.10%), respectively. The data suggest that, although Liyang has a sufficient cultivated land reserve, the general land quality is not satisfactory.
As shown in Figure 4, the cultivated land that can be restored with the engineering approach is concentrated in Shezhu Town and Shanghuang Town, the economy of which is underpinned by aquaculture. The villagers turn the cultivated land into ponds, the depth of which varies depending on the species farmed. If the pond is too deep, the farming layer of the cultivated land will be destroyed. Engineering restoration is required before the land is used to grow crops again. Cultivated land in need of immediate restoration is mostly found in Shangxing Town and Zhuxi Town, most of which is forest and garden land. Tree planting on this land will increase the fertility of the cultivated land and conserve water and soil, which makes restoration much easier.
The restorable cultivated land is composed of forest, garden, grassland, and water areas. The area of restorable forest land is 9889.19 hectares, accounting for 50.84% of the total recoverable cultivated land in Liyang (the highest). The proportion of restorable grassland is 0.18% (the lowest), and that of restorable water areas and gardens is 36.90% (7176.97 hectares) and 12.08% (2350.44 hectares), respectively.

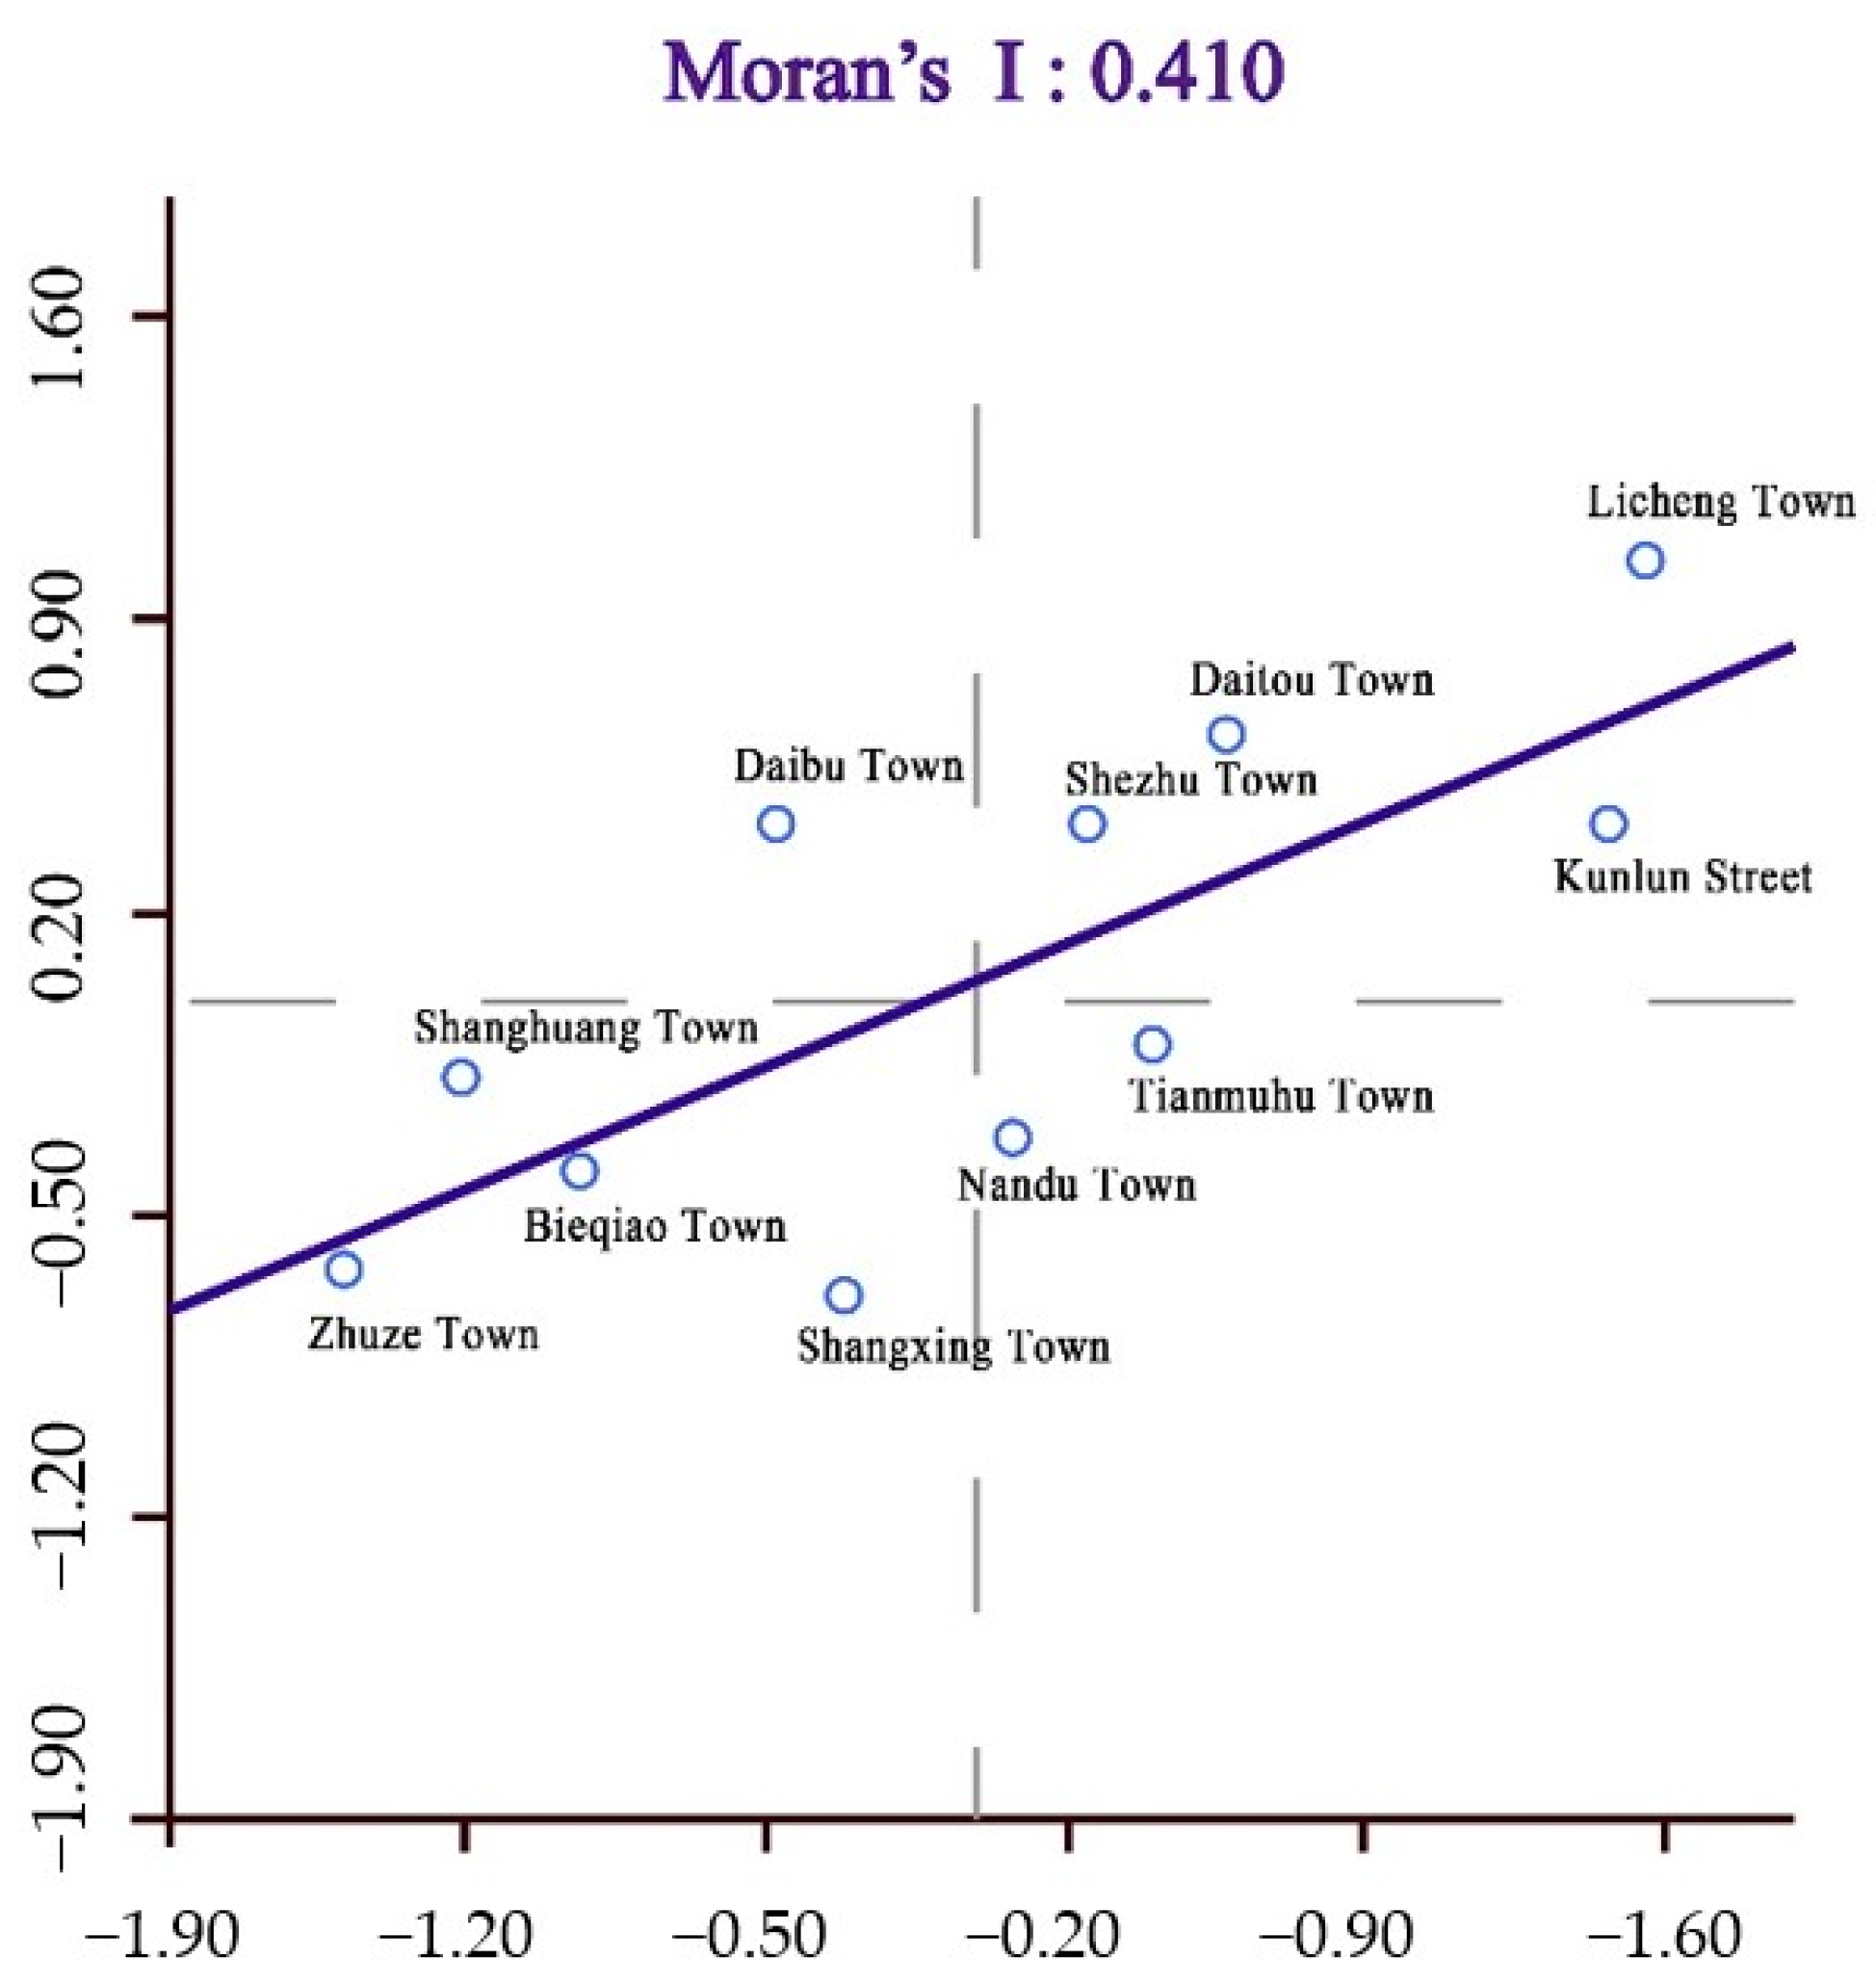
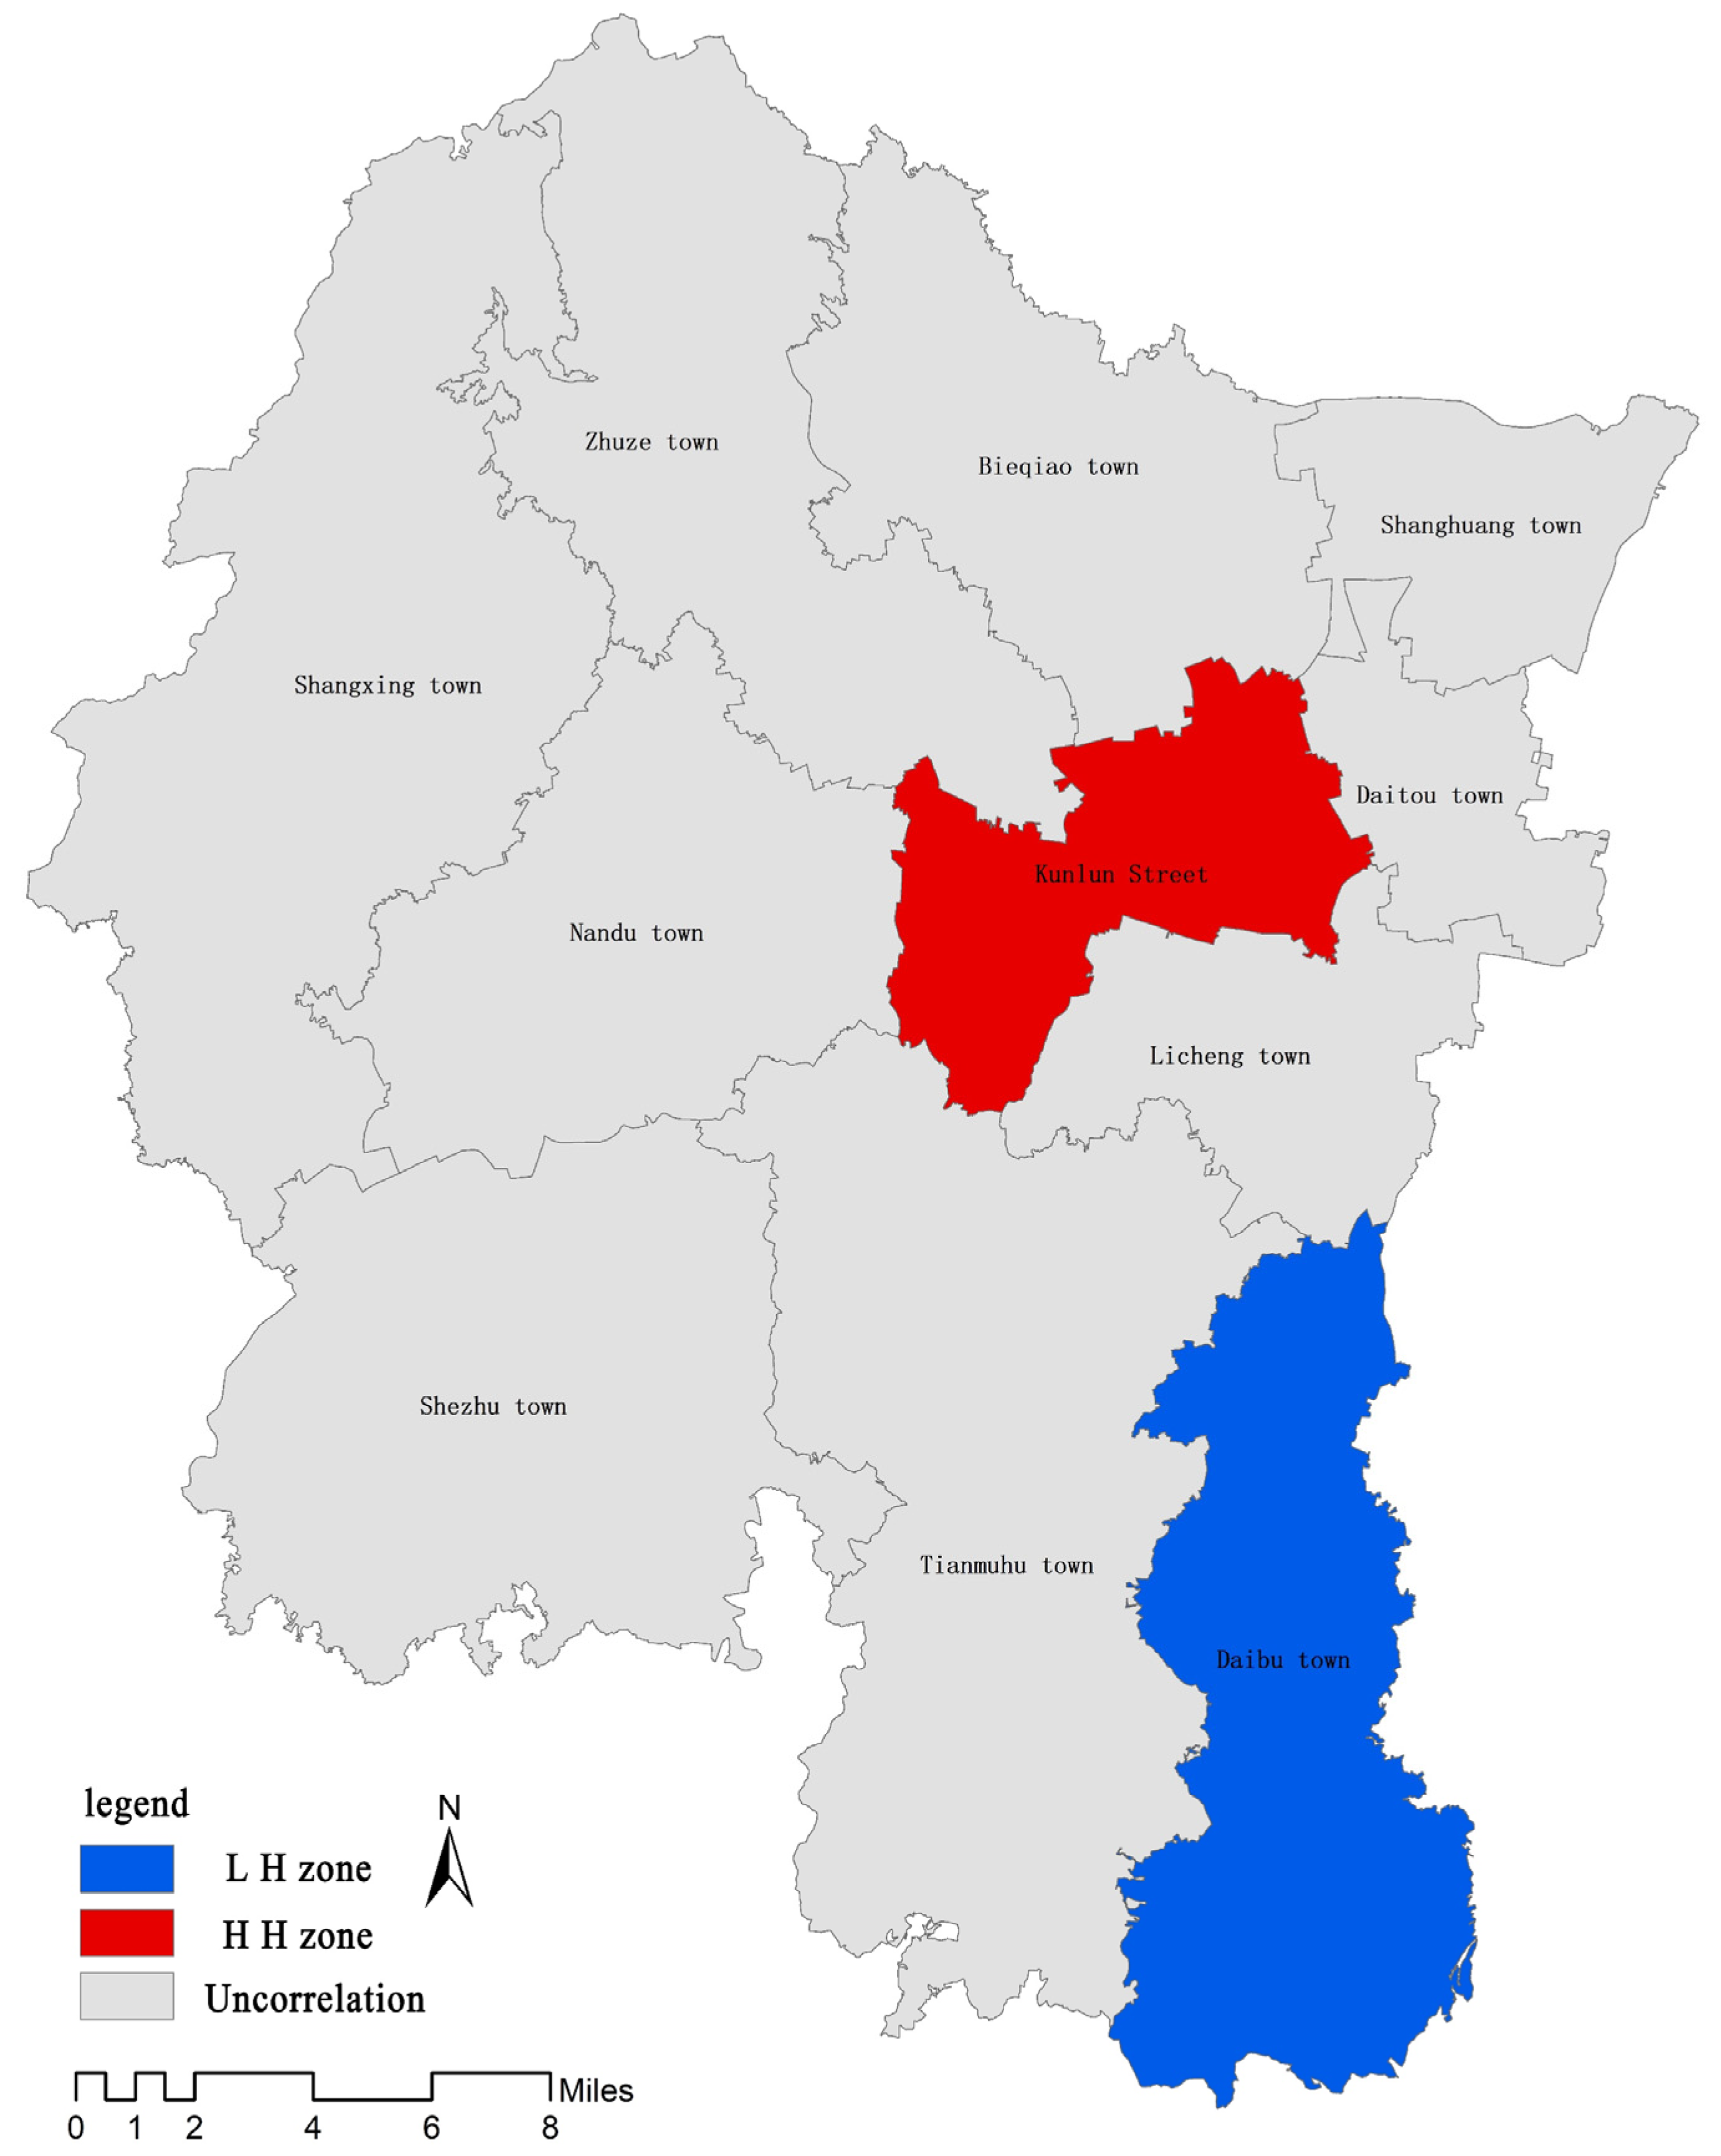
3.2. Spatial Autocorrelation

The global spatial autocorrelation presents the spatial correlation of the cultivated land for non-grain production across all towns and districts of Liyang. As shown in Figure 5, the global Moran’s I value of the non-grain cultivated land in Liyang is 0.41, calculated with GeoDa. This means that towns and districts with a higher proportion of non-grain cultivated land have a positive effect on the non-grain production of cultivated land in neighboring towns and districts. In the Moran scatter plot, the first and third quadrants demonstrate positive spatial autocorrelation, i.e., the space is homogenous; while the second and fourth quadrants show negative spatial autocorrelation, i.e., the space is heterogeneous [43].
According to the Moran scatter plot of the non-grain cultivated land in Liyang, Daitou Town, Licheng Town, Shezhu Town, and Kunlun Street fall into the first quadrant; Shangxing Town, Shanghuang Town, Bieqiao Town, and Zhuze Town belong to the third quadrant; Daibu Town falls into the second quadrant; and Tianmuhu Town and Nandu Town belong to the fourth quadrant. There are a total of 11 subdistricts and towns in the city, of which eight (72.7%) towns show a positive spatial correlation, and three (27.3%) towns demonstrates a negative spatial correlation.
Since the global Moran’s I index represents the overall autocorrelation statistics, the LISA chart was used to further examine whether there was local aggregation in the cultivated land for non-grain production in each town. According to Figure 6, most of the towns in Liyang demonstrate no significant spatial correlation. The map of the spatial patterns is classified into categories. HH indicates a positive spatial autocorrelation. LH shows a negative spatial autocorrelation. Kunlun Street falls in the HH zone, indicating that the high proportion of non-grain cultivated land in this street promotes non-grain production activities on the cultivated land in surrounding areas. Daibu Town falls into the LH zone, which represents a small proportion of cultivated land for non-grain production and is surrounded by areas with a high non-grain level of cultivated land.
The average non-grain production rate of cultivated land among all towns is 0.21, with the rate of Kunlun Street being 0.47, the highest in the city. The rates of its neighbors, Licheng Town and Tianmuhu Town, are 0.35 and 0.28, respectively, both higher than the average of the city. This means that Kunlun Street can promote non-grain production activities on the cultivated land in adjacent towns, which makes the non-grain production rates of cultivated land of Tianmuhu Town and Licheng Town higher than that of Daibu Town (0.19).

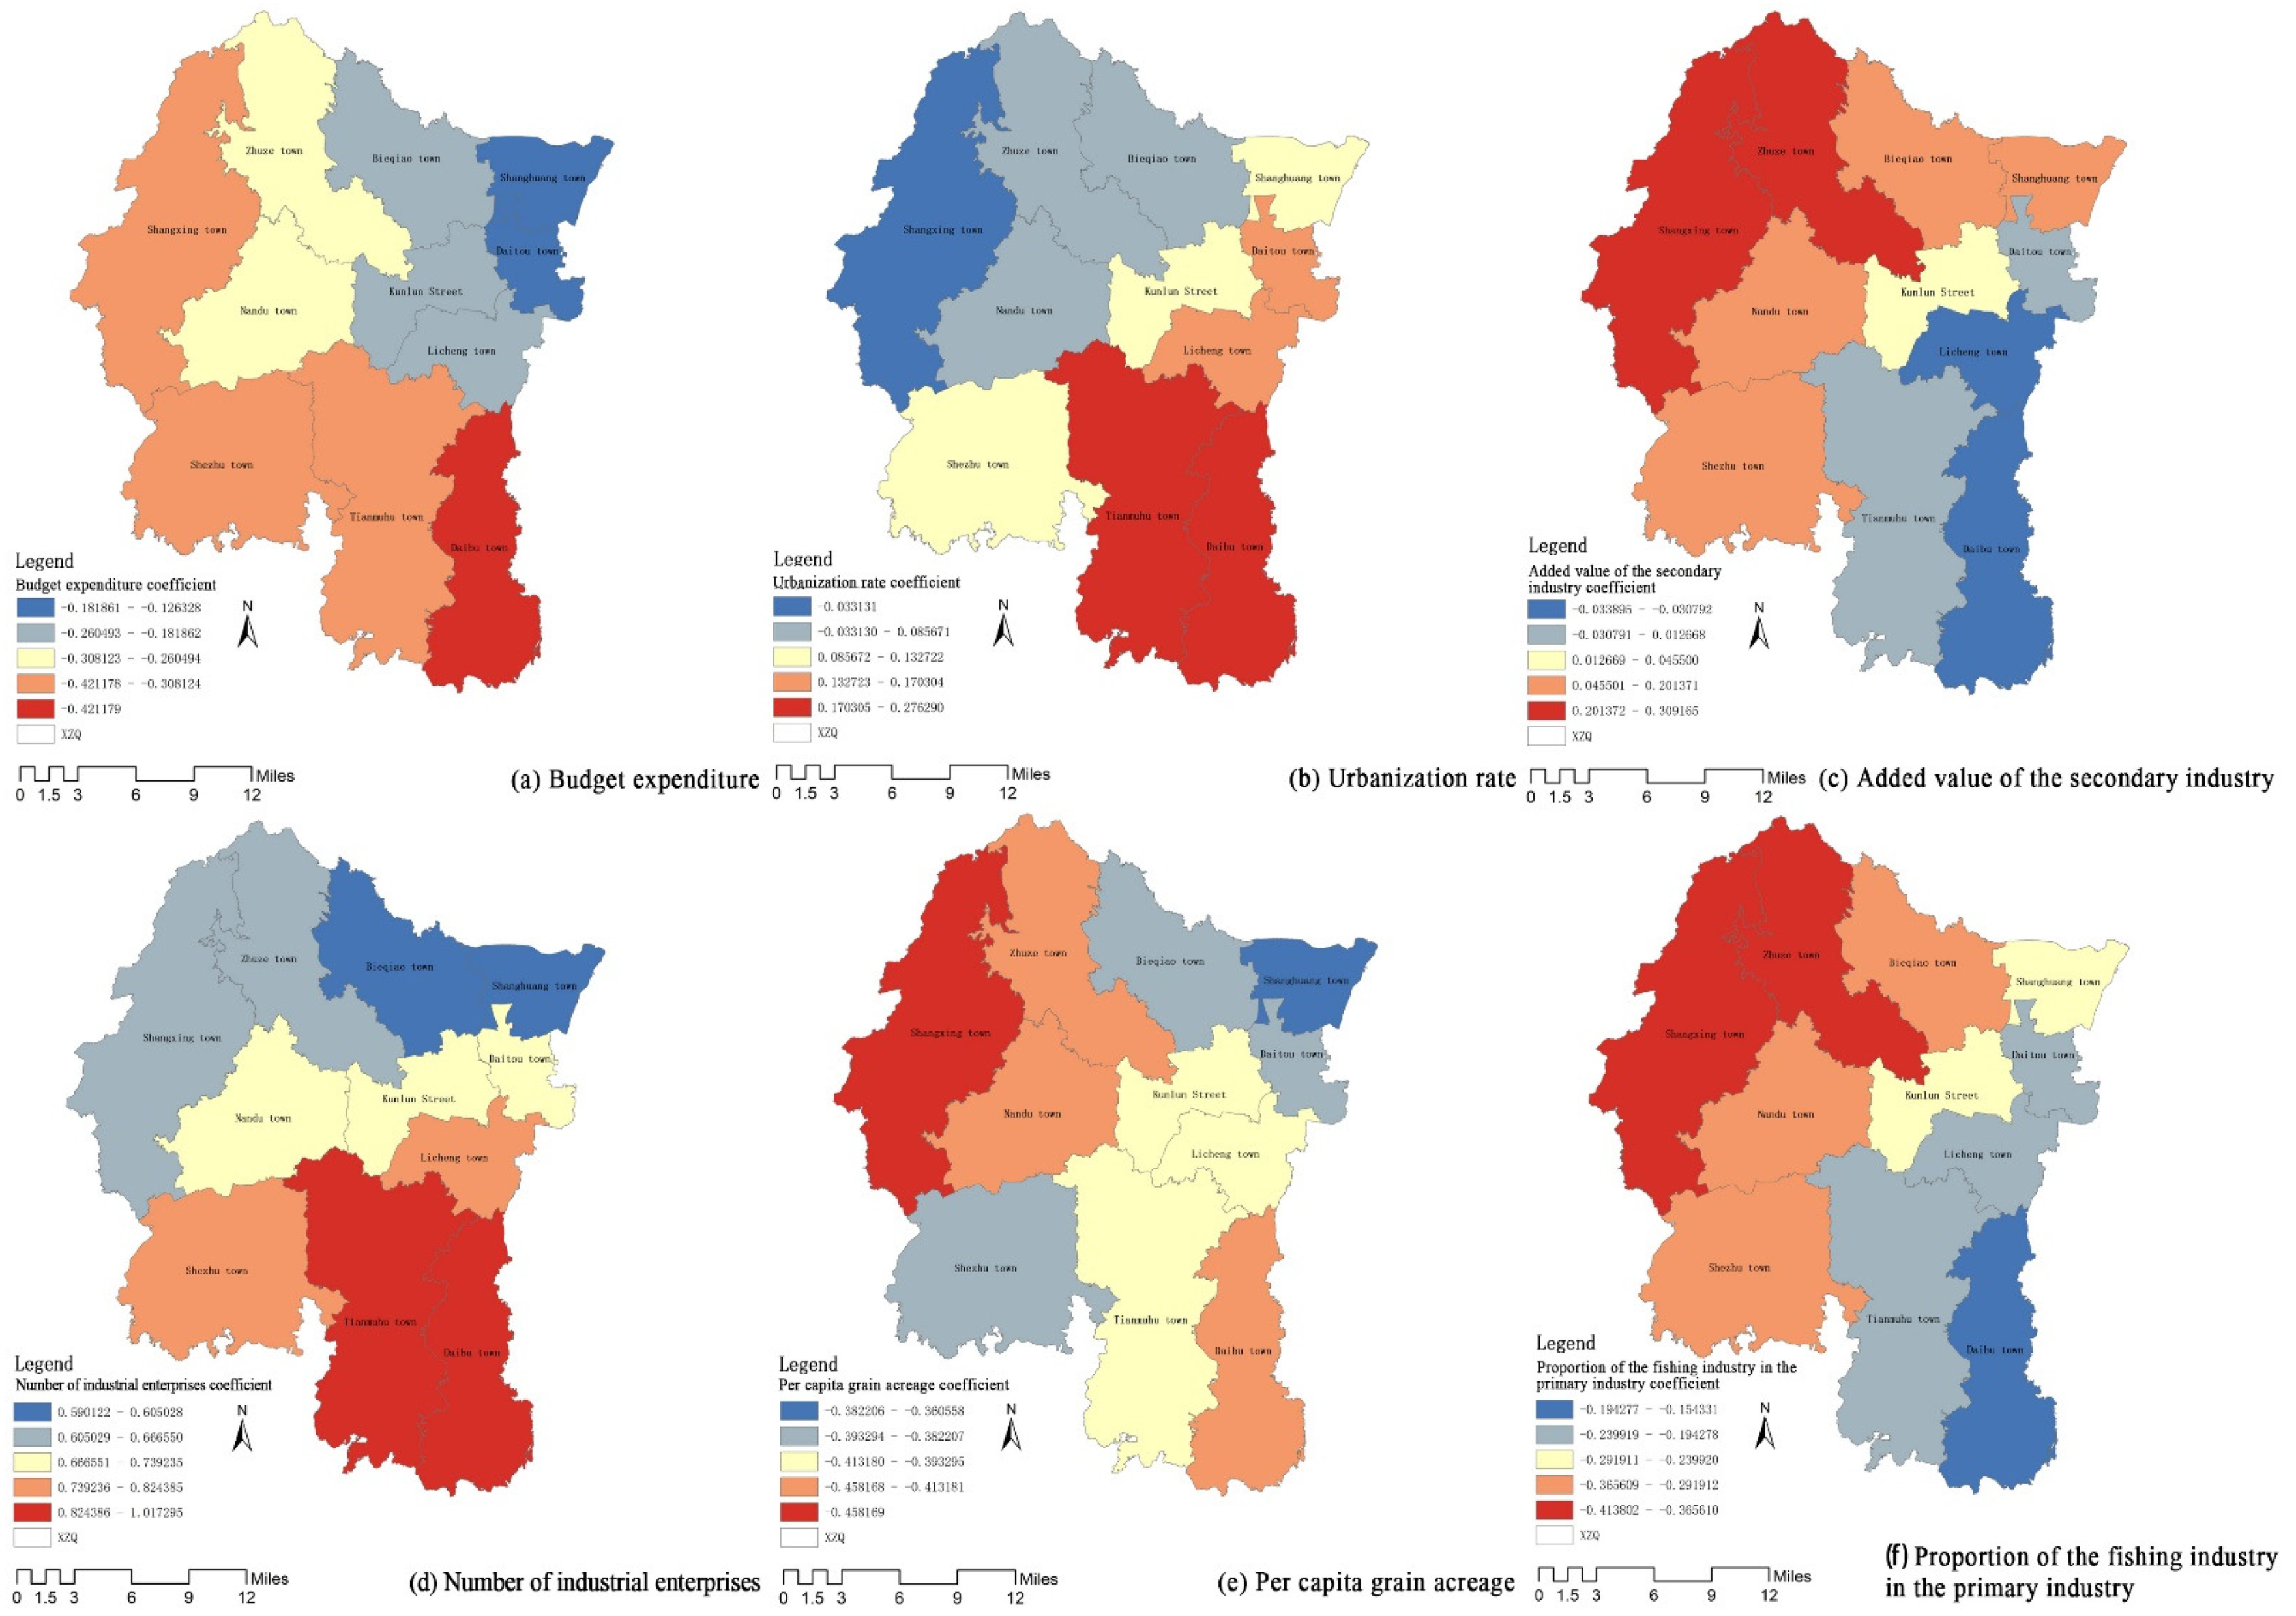
3.3. Influencing Factor

With reference to existing research results [29,44], based on the actual conditions of Liyang, as well as data availability and validity, this paper explores the mechanisms behind the non-grain production of cultivated land using 10 independent variables (as shown in Table 2), which cover sector, agricultural, industrial, and transportation factors.
The non-grain level of cultivated land of different regions depends, to a certain extent, on the local industrial structures. The industrial structure reflects the policy adjustment [45]. The budget expenditure, the added value of the primary industry, and the added value of the secondary industry were used as independent variables. The per capita grain acreage represents the conditions of grain planting. According to field investigations, most of the cultivated land in Liyang has been turned into ponds. As many rural workers have moved into secondary and tertiary industries [46], the proportion of the labor force in the primary industry reflects the conditions of the workforce engaged in agriculture [47]. China is the largest industrial country in the world. Much cultivated land in rural areas is used to support rapid industrial development [48], which encourages the non-grain production of cultivated land. The urbanization rate and the number of industrial enterprises were taken as independent variables. The density of roads determines the accessibility to an area [49]. For areas with high road density, busy economic activities are more likely to be conducted, and people are less likely to work in agriculture. Mountainous and hilly districts often lack large areas of cultivated land, which makes large-scale land transfer difficult. Therefore, we selected the average altitude to represent this situation. The average altitude here refers to the average geodetic height in the study area.
To address collinearity among indicators, the data were processed with the z-score. The collinearity of the 10 independent variables was then tested with the method of the variance inflation factor (VIF). The results show that there is no collinearity among the variables. As correlation analysis is the basis of regression analysis, all independent variables were included in the correlation analysis, and the results are shown in Table 2.
According to Table 2, the correlation between the non-grain production on cultivated land and the three variables (added value of the primary industry, the proportion of labor force of the primary industry, and the average altitude) is weak. The coefficient of the correlation between the non-grain production and road density is 0.486, but it failed the significance test. The four independent variables were, therefore, eliminated from the follow-up study. Among the six remaining independent variables, only the per capita grain acreage and the proportion of the fishing industry in the primary industry are negatively correlated with the non-grain production, with the remaining four showing a positive correlation. The correlation between the non-grain production and the budget expenditure is the greatest, with the coefficient reaching 0.891. The coefficients of the correlation between the non-grain production and the added value of the secondary industry and that between the non-grain production and the number of industrial enterprises are greater than 0.7, while the values of the per capita grain acreage, urbanization rate, and proportion of the fishing industry in the primary industry are smaller than 0.7.
To further reflect the impact of spatial autocorrelation, spatial regression interpretation must be conducted based on ordinary least squares regression (OLS) to better explain the attribution relationship [50]. According to previous studies [51,52], the smaller the correlation between the Akaike information criterion and the small sample size (AICc) value, the better the results. The OLS model was used in ArcGIS to conduct global regression analysis. The R2 of the OLS model is 0.986, the adjusted R2 is 0.953, and the AICc is 181.32; the R2 of the GWR model is 0.995, the adjusted R2 is 0.954, and the AICc is −85,554.14. Therefore, the GWR model is more suitable for this study.
Descriptive analysis was conducted for the regression coefficients of the six factors affecting the non-grain production on cultivated land based on the GWR results, as shown in Table 3. Based on the mean of the contribution of each influencing factor, the absolute values of the regression coefficient are listed in descending order: the number of industrial enterprises, the per capita grain acreage, the proportion of the fishing industry in the primary industry, the budget expenditure, the urbanization rate, and the added value of the secondary industry.
The GWR modeling tool in ArcGIS software and the adaptive bi-square function were used to determine the spatial weight. The AICc method was adopted to determine the optimal bandwidth. The regression coefficient of each influencing factor was visualized, as shown in Figure 7.
As shown in Figure 7a, budget expenditure has a negative impact on the non-grain production of cultivated land. Towns with high regression coefficients are concentrated in southern Liyang, and those with low coefficients are concentrated in the northeast. This shows that the budget expenditure for grain planting in Daibu Town accounts for a small proportion of the total budget expenditure, and the local government has little support for grain planting. In addition, combined with the statistical data, it can be found that the budget expenditure for grain planting in the whole city accounts for 9.28% of the total budget expenditure, while the proportion in Daibu Town is only 6.32%. According to Figure 7b, the urbanization rate has a positive impact on the non-grain production of cultivated land in most towns. Most of the towns with high regression coefficients are located in southeastern Liyang. As the amount of construction land in each place is relatively low compared with that of cultivated land, it is evident that the rapid development of secondary and tertiary industries occupies cultivated land resources for illegal construction, resulting in a sharp decline in the amount of cultivated land and a threat to food security. In Figure 7c, the added value of the secondary industry has a positive impact on the non-grain production of cultivated land in most towns. Towns with high regression coefficients are concentrated in northwestern Liyang, and the coefficients decrease from northwest to southeast. The added value of the secondary industry has a slightly negative impact on the non-grain production of cultivated land in only three towns of southeastern Liyang. In Figure 7d, the number of industrial enterprises has a positive impact on the non-grain production of cultivated land in all towns of the city, and this impact is the most significant, with the smallest regression coefficient being greater than the greatest coefficient of other influencing factors. Towns with high regression coefficients are mostly found in southern Liyang, indicating that the rapid development of industrial enterprises in these towns has resulted in significant labor loss in the primary industry, and the abandonment of cultivated land. As shown in Figure 7e, the per capita grain acreage has a negative impact on the non-grain production of cultivated land, and the coefficients vary little among towns. This factor has a greater impact on the northwest part of Liyang, which suggests that northwestern Liyang has richer cultivated land than other parts. In Figure 7f, the proportion of the fishing industry in the primary industry has a negative impact on the non-grain production of cultivated land. Towns with high regression coefficients are mostly concentrated in northwestern Liyang, and most of the towns with low coefficients are in the southeast.
Budget expenditure, per capita grain acreage and proportion of the fishing industry in the primary industry have negative impacts on the non-grain production of cultivated land, and the impacts are the strongest on Zhuze Town. The added value of the secondary industry has a positive impact on the non-grain production of cultivated land, and the impact is the strongest on Shangxing Town. The urbanization rate has a positive impact on the non-grain production, with the impact being the most significant on Daibu Town. The number of industrial enterprises has a positive impact on non-grain production, and the impact is the most obvious on Shezhu Town.
In sum, all influencing factors have direct or indirect impacts on the non-grain production of cultivated land, and the impacts of the same factor vary across regions. Therefore, for these towns, attention should be paid to the factors that have significant impacts on non-grain production, thereby curbing the further expansion of the non-grain production of cultivated land.

4. Discussion

By analyzing the quantitative characteristics and spatial distribution of the non-grain production of cultivated land in Liyang City, this paper adopted spatial autocorrelation analysis and GWR to explore the local correlation of the non-grain production of cultivated land and the differences in driving factors across all towns. According to the existing research, the non-grain production rate of cultivated land in economically developed areas of the Yangtze River Delta is between 0.35 and 0.45 [44], while the rate in Liyang is 0.13, which is a positive indicator. The grain output of China was 0.67 trillion kg in 2020, which was the sixth consecutive year that the grain output remained above 0.65 trillion kg. Nevertheless, it is necessary to remain vigilant and improve the supervision of the use of cultivated land. As the grain-growing cost is often higher in developed regions, local farmers are reluctant to engage in grain production [53]. Located in the Yangtze River Delta, the most developed region in China, Liyang’s grain output has been decreasing since 2010. The decline in grain output is more serious when the whole country is taken into consideration. Therefore, we must attach great importance to the non-grain production of cultivated land. Ensuring food security is crucial for China to deal with the uncertainty in the international food market [54]. The non-grain production of cultivated land in Liyang demonstrates spatial autocorrelation: towns with a higher level of non-grain production drive up the non-grain level in adjacent towns. This result is consistent with previous findings: farmers tend to grow non-grain crops with high returns [55]. The non-grain rate in Kunlun Street is high, which drives up the non-grain production in neighboring towns. Farmers’ decisions of land use are based on economic gains [56,57], and are prone to the influence of other farmers [58]. After the first non-grain operators obtain high returns, other farmers will follow suit. The GWR results show that the most critical factor that causes the non-grain production of cultivated land in Liyang is the number of industrial enterprises. The rapid development of the secondary and tertiary sectors has attracted many rural laborers, which leads to a continuous decline in the rural labor force engaged in grain growing and a change in the agricultural structure [59]. As a result, a large amount of cultivated land is abandoned or used by the secondary and tertiary sectors [29]. The outflow of the labor force is mainly young labor force, which leads to the serious aging of the agricultural production workers. Therefore, it is difficult to popularize advanced agricultural technology and new agricultural equipment, reducing the weight of science and technology in agricultural development. As grain farmers are older, their concepts are more traditional, and most of the management methods are still extensive, that is, the application of more chemical fertilizers and pesticides to improve the yield, which will have a high impact on the quality of cultivated land. Under the background of sustainable development, it is urgent to change this situation through scientific and technological innovation [60]. For agricultural scale operator, the outflow of the labor force will force them to improve their production efficiency and mechanization level to ensure the stable output of grain. Cultivated land plays an important role in the process of industrialization, a large proportion of which is used for industrial construction. This has led to the loss of a large amount of high-quality cultivated land. China’s grain output has not decreased but has a fluctuating upward trend. On the one hand, this is due to the progress of agricultural technology, on the other hand, it is due to the extensive use of chemical fertilizer [61]. The rapid increase in fertilizer consumption will not only lead to the decline in cultivated land quality but will also significantly damage to the ecological environment [62]. In the long term, it is very unfavorable to the sustainable development of the region. We should unify the objectives of food security and resource and environmental protection, reduce the occupation of cultivated land resources in future development, and actively protect the quality of cultivated land, so as to provide a strong guarantee for sustainable economic development and food security.
The low income from grain planting is the key reason for the non-grain production of cultivated land. As the income of other non-grain crops is much higher than that of grain, some farmers will take the lead in giving up grain planting and turning to non-grain crops. At the same time, farmers’ behavior is vulnerable to the influence of surrounding farmers [58], resulting in more farmers giving up grain planting. Considering the livelihood of farmers, some rural labor forces chose to seek jobs in cities with high economic returns. The large amount of labor force outflow led to a decline in the number of grain farmers, resulting in the phenomenon of a lack of cultivation on cultivated land, which further increased the proportion of non-grain production of cultivated land. With the increasing variety of alternative food products, the choice of food has been further expanded, which will indirectly affect farmers’ enthusiasm for growing grain and increase the proportion non-grain production of cultivated land. The government has long been aware of the harm of the non-grain production of cultivated land, and actively implemented prevention and control measures, such as increasing the scope of grain subsidies and subsidy funds to increase farmers’ enthusiasm for growing grain, delimiting the scope of high-quality farmland and formulating cultivated land protection measures to ensure the use of cultivated land. To a certain extent, these policies have indeed increased farmers’ enthusiasm for growing grain [63] and have also had a certain inhibitory effect on the non-grain production of cultivated land. However, the effect of these policies is limited.
Although the amount of cultivated land used for grain production is decreasing, the grain output shows an upward trend year after year, which is due to the progress of agricultural science and technology and the increase of grain per unit area yield, which covers up the severe fact that the quality of cultivated land decreases due to non-grain production of cultivated land [64]. In the face of increasingly serious resource and environmental problems, if we neglect the control of cultivated land use, it will lead to food security problems, and then affect the social and economic development. The future development of agriculture should take the sustainable utilization of cultivated land resources and the improvement of ecological environment as the premise [65], strictly control the use of cultivated land on the basis of ensuring food security, and make every effort to build a new pattern of sustainable development of cultivated land.
Unlike previous studies, this paper used global Moran’s I and local Moran’s I statistics to study the spatial aggregation of the non-grain production of cultivated land. The GWR model was introduced to explore the spatial correlation between the non-grain production of cultivated land and the influencing factors. By enriching the contents and methods of the research on the non-grain production of cultivated land, this paper aimed to help governments understand the temporal and spatial characteristics and the evolution pattern of the non-grain production of cultivated land. The findings shed light on the formulation of customized policies for different regions to curb the non-grain production of cultivated land, which is valuable for the promotion of the sustainable development of agriculture and to ensure food security.
Although spatial autocorrelation and heterogeneity were included in this study, non-grain production was only explored at the city level due to limited data availability. More research must be conducted across provinces, economic zones, and city clusters. In addition, only cross-sectional data were used in this study, and panel data were not applied to analyze the temporal and spatial characteristics of the non-grain production of cultivated land. Furthermore, the non-grain production of cultivated land greatly depends on the characteristics of farming households, but this factor was not considered in this paper. More in-depth research must be conducted on the mechanisms that drive the non-grain production of cultivated land based on questionnaire surveys and field investigations.

5. Conclusions

The overall level of non-grain production of cultivated land in Liyang is low, and the cultivated land reserve is sufficient. The issue of cultivated land security and food security is not severe. The area of non-grain cultivated land accounts for 12.98% of the total cultivated land area in the city, and the area of restorable cultivated land is 3.34 times that of the cultivated land for non-grain production. The proportion of irrigable land for non-grain production is the highest, and approximately 73.23% of the irrigable land is no longer used to grow grains. The area of the forest that can be restored to cultivated land accounts for 50.84% of the total. Non-grain cultivated land is mostly concentrated in the eastern part of Liyang and stretches from south to north with Daibu Town at the center. Restorable cultivated land is mostly found in western Liyang, particularly in Shangxing Town and Shezhu Town.
In terms of spatial correlation, the local correlation among the towns in Liyang is not significant. Kunlun Street falls in the HH zone and Daibu Town in the LH zone. Kunlun Street can promote the non-grain production rate of cultivated land in surrounding towns, while Daibu Town is surrounded by towns with high non-grain production rate of cultivated land.
According to the GWR results, the absolute values of the regression coefficient are listed in descending order as follows: the number of industrial enterprises, the per capita grain acreage, the urbanization rate, the proportion of the fishing industry in the primary industry, the budget expenditure, and the added value of the secondary industry. However, the impacts of these factors vary across towns. The budget expenditure has the strongest negative impact on the non-grain production of cultivated land in Tianmuhu Town. The added value of the secondary industry has the strongest negative effect on the non-grain production of cultivated land in Licheng Town. The per capita grain acreage has the greatest negative impact on Kunlun Street. The proportion of the fishing industry has the greatest negative impact on Tianmuhu Town. The urbanization rate has the greatest positive impact on Daibu Town. The number of industrial enterprises has the greatest positive effect on Licheng Town.

Author Contributions

Conceptualization, Y.L. and B.Z.; methodology, A.H. and Y.L.; software, B.Z.; validation, B.Z., Y.L. and B.X.; formal analysis, B.Z.; investigation, B.Z. and A.H.; resources, Y.L.; data curation, B.Z.; writing—original draft preparation, Y.L. and B.Z.; writing—review and editing, Y.L.; visualization, C.S.; supervision, Y.L.; project administration, Y.L. and B.Z.; funding acquisition, Y.L. All authors have read and agreed to the published version of the manuscript.

Funding

This work was supported by the National Key Research and Development Project (2018YFD1100105) and MOE (the Ministry of Education in China) Project of Humanities and Social Sciences (Project No. 16YJA840007).

Conflicts of Interest

The authors declare no conflict of interest.

References

  1. Xue, X.D.; Gao, J.L. Analysis of Spatial Correlation Between Ecological Footprint and Food Security of Cultivated Land in Main Grain Production Areas. J. Ecol. Econ. 2021, 37, 93–99. [Google Scholar]
  2. Wu, S.C.; Yu, H.L.; Chu, Y.F. Limitations and Breakthroughs in Research on “Non-grain Production” of Cultivated Land under Scale Management of Agriculture. J. N. W. Ag. For. Univ. 2019, 19, 142–151. [Google Scholar]
  3. Zang, Y.; Liu, Y.; Yang, Y.; Woods, M.; Fois, F. Rural Decline or Restructuring? Implications for sustainability transitions in rural China. J. Land Use Pol. 2020, 94, 104531. [Google Scholar] [CrossRef]
  4. Su, Y.; Qian, K.; Lin, L.; Wang, K.; Guan, T.; Gan, M. Identifying the Driving Forces of Non-grain Production Expansion in Rural China and Its Implications for Policies on Cultivated Land Protection. Land Use Policy 2020, 92, 104435. [Google Scholar] [CrossRef]
  5. Kuang, Y.P.; Liu, Y. Comparison between Non-Agriculturization and Non-grain Production in Agricultural Land Transfer. J. Rur. Econ. 2018, 426, 1–6. [Google Scholar]
  6. Gao, X.Y.; Zhu, K.Y. The Potential Impact and Governance of Non-agriculturalization and Non-grain Production. J. Devel. Res. 2020, 210, 141–147. [Google Scholar]
  7. Grassini, P.; Eskridge, K.M.; Cassman, K.G. Distinguishing between Yield Advances and Yield Plateaus in Historical Crop Production Trends. J. Nat. Commun. 2013, 4, 2918. [Google Scholar] [CrossRef]
  8. Zhang, J.; He, C.; Chen, L.; Cao, S. Improving Food Security in China by Taking Advantage of Marginal and Degraded Lands. J. Clean. Prod. 2018, 171, 1020–1030. [Google Scholar] [CrossRef]
  9. Prishchepov, A.V.; Muller, D.; Dubinin, M.; Baumann, M.; Radeloff, V.C. Determinants of Agricultural Land Abandonment in Post-Soviet European Russia. Land Use Policy 2013, 30, 873–884. [Google Scholar] [CrossRef] [Green Version]
  10. Liu, Y.; Wu, C. Situation of land-water resources and analysis of sustainable food security in China. J. Nat. Resour. 2002, 17, 270–275. [Google Scholar]
  11. Li, W.; Feng, T.; Hao, J. The evolving concepts of land administration in China: Cultivated land protection perspective. Land Use Policy 2009, 26, 262–272. [Google Scholar] [CrossRef]
  12. Wang, D.; Jiang, H. Some thoughts on China’s food security based on the supply-side structural reform of agriculture. Economist 2017, 222, 78–87. [Google Scholar]
  13. Yi, X.Y.; Chen, Y.J. The Transfer of Cultivated Land and “Non-grain” Production: Based on the Survey Data among Farmers in Zhejiang and Hebei. J. China Rur. Surv. 2010, 96, 2–10, 21. [Google Scholar]
  14. Wang, H.; Qiu, F.; Ruan, X. Loss or Gain: A Spatial Regression Analysis of Switching Land Conversions between Agriculture and Natural Land. J. Agric. Ecosyst. Environ. 2016, 221, 222–234. [Google Scholar] [CrossRef]
  15. Su, B.; Li, Y.; Li, L.; Wang, Y. How Does Nonfarm Employment Stability Influence Farmers’ Farmland Transfer Decisions? Implications for China’s Land Use Policy. Land Use Policy 2018, 74, 66–72. [Google Scholar] [CrossRef]
  16. Wang, Y.; Chen, Y.J.; Yi, X.Y.; Xiao, B.L. Problems and Countermeasures Related to “Non-Grain” Production in the Transfer of Cultivated Land. J. China Agric. Resour. Reg. Plan. 2011, 32, 13–16. [Google Scholar]
  17. Liao, F.Z.; Liao, J.Y.; Yang, C. Problems and Countermeasures Related to Non-Grain Production in the Transfer of Cultivated Land. J. Tribune. Stud. 2015, 31, 37–40. [Google Scholar]
  18. Li, X.L. Preventing the “Non-Grain” Production in the Transfer of Cultivated Land. J. Grain Issues Res. 2012, 184, 41–43. [Google Scholar]
  19. Zhang, Z.Y.; Du, Z.X. Will Land Transfer Lead to “Non-Grain” Production? An Empirical Analysis Based on the Monitoring Data of 1740 Family Farms across China. J. Econ. Perspect. 2015, 9, 63–69. [Google Scholar]
  20. Cai, R.L.; Chen, W.M.; Zhu, X.C. Internal Causes of the Non-Grain Production in Cultivated Land Transfer and Countermeasures. J. Rur. Econ. 2015, 393, 44–49. [Google Scholar]
  21. Kong, X.B. Causes and Countermeasures to Non-Grain Production of Cultivated Land. J. China Land. 2020, 418, 17–19. [Google Scholar]
  22. Liu, C.Y.; Xiong, H.J. Research on Investment in Rural Areas in China: Literature Review and Discussion. J. West Forum. 2015, 25, 1–9. [Google Scholar]
  23. He, P.M.; Quan, L. Analysis of “Non-Grain” Production of Cultivated Land: From the Perspective of Food Security. J. Yangtze Univ. (Nat. Sci. Ed.) 2014, 11, 73–75. [Google Scholar]
  24. Hu, H.Z.; Wang, J.L.; Wang, Y.; Long, X.Y. Analysis of the Evolution and Influencing Factors of the Temporal and Spatial Patterns of Grain Production and Food Security in the Counties along the Yangtze River from 1990 to 2015. J. Resour. Environ. Yangtze Basin. 2019, 28, 359–367. [Google Scholar]
  25. Fu, Y.; Hou, K.C.; Dong, W.H.; Li, Y.Q. Discussion on “Non-Agriculturization” and “Non-Grain” Production Supervision of China’s Cultivated Land: Based on the Investigation of Ningxia Hui Autonomous Region. J. Nat. Resour. Econ. China 2021, 1–11. [Google Scholar] [CrossRef]
  26. Song, W.Q.; Yue, J.W. Influencing Factors and Countermeasures of “Non-Grain” Production of Cultivated Land: Take Yanggu County, Shandong Province as an Example. J. Ningxia Agric. For. Sci. Technol. 2020, 61, 17, 26–29. [Google Scholar]
  27. Chang, Y.Y.; Liu, J.N.; Zhang, Q.; Yu, H.C.; Bian, Z.F.; Chen, F. Differentiated Spatial Patterns of Non-Grain Production of Cultivated Land in Main Grain Production Areas and the Causes. J. Agric. Resour. Environ. 2021, 1–11. [Google Scholar] [CrossRef]
  28. Li, Y.Y.; Zhao, X.F. A PVAR-based Empirical Study on the Impact of Farmers’ Income Structure on the Non-Grain Production of Cultivated Land. J. Hubei Agric. Sci. 2020, 59, 210–214. [Google Scholar]
  29. Yang, Q.; Zhang, D. The influence of agricultural industrial policy on non-grain production of cultivated land: A case study of the “one village, one product” strategy implemented in Guanzhong Plain of China. Land Use Policy 2021, 108, 105579. [Google Scholar] [CrossRef]
  30. Su, Y.; Li, C.; Wang, K.E.L. Quantifying the spatiotemporal dynamics and multi-aspect performance of non-grain production during 2000–2015 at a fine scale. Ecol. Indic. 2019, 101, 410–419. [Google Scholar] [CrossRef]
  31. Chen, S.; Zeng, F.; Liu, H.E.L. Factors affecting farmers’ willingness to grow grain in key grain-producing areas: Based on the investigation of 475 rural households of Hunan Province. J. Hunan Agric. Univ. (Soc. Sci.) 2012, 85–88. [Google Scholar]
  32. Sun, Y.; Chang, Y.; Liu, J.E.L. Spatial Differentiation of Non-Grain Production on Cultivated Land and Its Driving Factors in Coastal China. Sustainability 2021, 13, 13064. [Google Scholar] [CrossRef]
  33. Zhao, X.; Zheng, Y.; Huang, X.; Kwan, M.P.; Zhao, Y. The Effect of Urbanization and Farmland Transfer on the Spatial Patterns of Non-grain Farmland in China. J. Sustain. 2017, 9, 1438. [Google Scholar] [CrossRef] [Green Version]
  34. Xu, Y.; Yu, L.; Zhao, F.R.; Cai, X.; Zhao, J.; Lu, H.; Gong, P. Tracking Annual Cropland Changes from 1984 to 2016 Using Time-Series Landsat Images with a Change-Detection and Post-Classification Approach: Experiments from Three Sites in Africa. J. Remote Sens. Environ. 2018, 218, 13–31. [Google Scholar] [CrossRef]
  35. Leroux, L.; Castets, M.; Baron, C.; Escorihuela, M.J.; Bégué, A.; Seen, D.L. Maize Yield Estimation in West Africa from Crop Process-Induced Combinations of Multi-Domain Remote Sensing Indices. J. Eur. J. Agron. 2019, 108, 11–26. [Google Scholar] [CrossRef]
  36. Liu, C.S.; He, H.G.; Zhang, S.S.; Zhou, L.Z. Discussion on the 3rd National Land Resource Survey of Guangzhou. J. Urban Geotech. Investig. Surv. 2020, 4, 135–138. [Google Scholar]
  37. Sui, Y.T.; Xu, L. On Policies of Land and Space Governance Based on Changes in the Techniques Used in the 3rd National Land Resource Survey. J. China Land. 2019, 12, 24–27. [Google Scholar]
  38. Guan, X.K.; Wang, X.L.; Zhao, Y.L. Research on Morphological Characteristics Recognition and Optimization of “Non-Grain” Production of Cultivated Land along the Yellow River. J. Trans. Chin. Soc. Agric. Mach. 2019, 52, 233–242. [Google Scholar]
  39. Anselin, L. Local Indicators of Spatial Association—LISA. J. Geogr. Anal. 1995, 27, 93–115. [Google Scholar] [CrossRef]
  40. Xu, J.H. Geographical Modeling Method; Science Press: Beijing, China, 2010. [Google Scholar]
  41. Fotheringham, A.S.; Brunsdon, C.; Charlton, M. Geographically Weighted Regression: The Analysis of Spatially Varying Relationships; John Wiley & Sons: Hoboken, NJ, USA, 2003. [Google Scholar]
  42. Han, J.; Rui, Y.; Yang, K.; Liu, W.; Ma, T. Quantitative Attribution of the Distribution of Key Towns in China Based on Geodetector and GWR. J. Prog. Geogr. 2020, 39, 1687–1697. [Google Scholar] [CrossRef]
  43. Wang, J.F.; Liao, Y.L.; Liu, X. A Tutorial on Spatial Data Analysis; Science Press: Beijing, China, 2010; p. 101. [Google Scholar]
  44. Su, Y. Research on the Spatiotemporal Evolution and Control of Non-Grain Production of Cultivated Land. Ph.D. Thesis, Zhejiang University, Hangzhou, China, 2020. [Google Scholar]
  45. Gatto, M.; Wollni, M.; Qaim, M. Oil Palm Boom and Land-Use Dynamics in Indonesia: The Role of Policies and Socioeconomic Factors. Land Use Policy 2015, 46, 292–303. [Google Scholar] [CrossRef] [Green Version]
  46. Feng, S.; Heerink, N.; Ruerd, R.; Qu, F. Land Rental Market, Off-Farm Employment and Agricultural Production in Southeast China: A plot-level case study. Chin. Econ. Rev. 2010, 21, 598–606. [Google Scholar] [CrossRef]
  47. Su, S.; Zhou, X.; Wan, C.; Li, Y.; Kong, W. Land Use Changes to Cash Crop Plantations: Crop Types, Multilevel Determinants and Policy Implications. Land Use Policy 2016, 50, 379–389. [Google Scholar] [CrossRef]
  48. Tematio, P.; Olson, K.R. Impacts of industrialized agriculture on land in Bafou, Cameroon. J. Soil. W. Conser. 1997, 52, 404–405. [Google Scholar]
  49. Su, S.; Xiao, R.; Li, D. Impacts of Transportation Routes on Landscape Diversity: A Comparison of Different Route Types and Their Combined Effects. Environ. Manag. 2014, 53, 636–647. [Google Scholar] [CrossRef]
  50. Ding, Z.W.; Liu, Y.Y.; Wu, X.N.; Wei, Y.X.; Qiao, X.F.; Zhang, H.P.; Zhang, G.S. Differentiated Spatial Pattern and Influence of China’s Township Economy: Based on the Per Capita Net Income of Farmers in 755 Towns. J. Econ. Geogr. 2020, 40, 18–28, 38. [Google Scholar]
  51. Liu, Z.W. Akaike Information Criterion and Its Significance. J. Math. Pract. Theory. 1980, 3, 64–72. [Google Scholar]
  52. Fortheringham, S.; Brunsdon, C.H.; Charlton, M. Quantitative Geography; SAGE Publications: London, UK, 2000. [Google Scholar]
  53. Zhu, D.L.; Gao, Y. Analysis of the Farmers’ Reluctance to Grow Grain and the Degradation of Grain Growing Industry: Based on the Survey of 486 Households in 32 Villages in Fujian, Jiangxi, Ezhe and Zhejiang. J. Jimei Univ. (Philos. Soc. Sci. Ed.) 2013, 16, 41–48. [Google Scholar]
  54. Simelton, E. Food Self-Sufficiency and Natural Hazards in China. Food Secur. 2011, 3, 35–52. [Google Scholar] [CrossRef]
  55. Zhang, L.; Song, B.; Chen, B. Emergy-Based Analysis of Four Farming Systems: Insight into Agricultural Diversification in Rural China. J. Clean. Prod. 2012, 28, 33–44. [Google Scholar] [CrossRef]
  56. Gellrich, M.; Baur, P.; Koch, B.; Zimmermann, N.E. Agricultural Land Abandonment and Natural Forest Re-Growth in the Swiss Mountains: A Spatially Explicit Economic Analysis. Agric. Ecosyst. Environ. 2007, 118, 93–108. [Google Scholar] [CrossRef]
  57. Anselin, L. Under The Hood: Issues in the Specification and Interpretation of Spatial Regression Models. Agric. Econ. 2002, 27, 247–267. [Google Scholar] [CrossRef]
  58. Guo, Z. The Performance, Driving Mechanism and Governance of Functional Loss of Cultivated Land. J. Jishou Univ. (Soc. Sci. Ed.) 2020, 41, 56–63. [Google Scholar]
  59. Yang, J.; Wang, H.; Jin, S.; Chen, K.; Riedinger, J.; Peng, C. Migration, Local Off-Farm Employment, and Agricultural Production Efficiency: Evidence from China. J. Prod. Anal. 2016, 45, 247–259. [Google Scholar] [CrossRef] [Green Version]
  60. Dong, Z.; Wang, D. Technological Innovation, Production Mode Reform and Agricultural Modernization. Expand. Horiz. 2019, 216, 34–40. [Google Scholar]
  61. Wang, H.; Lu, J. Food Security and Sustainable Economic Development under Environmental Constraints. Resour. Sci. 2014, 36, 2149–2156. [Google Scholar]
  62. Fare, R.; Grosskopf, S.; Pasurka, C. Environmental productionfunctions and environmental directional distance functions. Energy 2007, 32, 1055–1066. [Google Scholar] [CrossRef]
  63. Huang, J.; Wang, X.; Rozelle, S. The subsidization of farming households in China’s agriculture. Food Policy 2013, 41, 124–132. [Google Scholar] [CrossRef]
  64. Jiang, P. Constructing Food Security Pattern in the New Era from the Perspective of Integrated Development of Urban and Rural Areas--Also on the Three Constraints and Challenges of China’s Food Production. Beijing Plan. Rev. 2021, 1, 164–169. [Google Scholar]
  65. Hansen, M.; Li, H.; Svarverud, R. Ecological civilization: Interpreting the Chinese past, projecting the global future. Glob. Environ. Chang. 2018, 53, 195–203. [Google Scholar] [CrossRef]
Figure 1. Location of Liyang: (a) Jiangsu Province, China; (b) Liyang City.
Sustainability 13 14047 g001
Figure 2. Non-grain production types: (a) aquaculture pond; (b) nursery plantation.
Sustainability 13 14047 g002
Figure 3. Spatial distribution of cultivated land for non-grain production in Liyang.
Sustainability 13 14047 g003
Figure 4. Spatial distribution of restorable cultivated land in Liyang.
Sustainability 13 14047 g004
Figure 5. Moran scatter plot of the cultivated land for non–grain production in Liyang.
Sustainability 13 14047 g005
Figure 6. LISA chart of local spaces in Liyang.
Sustainability 13 14047 g006
Figure 7. Spatial distribution of GWR regression coefficient: (a) budget expenditure; (b) urbanization rate; (c) added value of the secondary industry; (d) number of industrial enterprises; (e) per capita grain acreage; and (f) proportion of the fishing industry in the primary industry.
Sustainability 13 14047 g007
Table 1. Cultivated land area of Liyang City in 2019.
TownCultivated Land Area/Hectare in 2019Proportion in the City’s Total/%
Kunlun Street2191.804.89
Licheng Town1822.624.07
Daitou Town1800.524.02
Shanghuang Town770.501.72
Daibu Town2633.015.87
Tianmuhu Town3083.746.88
Bieqiao Town5838.1013.02
Shangxing Town8181.3618.25
Zhuze Town5560.2412.40
Nandu Town6836.8415.25
Shezhu Town6108.1713.63
Total44,826.91100
Table 2. Correlation result.
CriterionIndependent VariableCorrelation Coefficientp Value
Sector factorsBudget expenditure0.891 **0.000
Added value of the primary industry−0.1980.28
Added value of the secondary industry0.756 **0.004
Agricultural factorsPer capita grain acreage−0.585 *0.029
Proportion of the fishing industry in the primary industry−0.523 *0.05
Proportion of labor force in the primary industry0.1910.286
Industrial factorsUrbanization rate0.623 *0.02
Number of industrial enterprises0.886 **0.000
Geographic factorsRoad density0.4860.065
Average altitude0.2270.503
Note: * represents significant correlation at the level of 0.05 (one-sided); ** represents significant correlation at the level of 0.01 (one-sided).
Table 3. GWR calculation result.
Independent
Variable
Upper QuartileMedianLower
Quartile
MaximumMinimumMeanSD
Budget expenditure−0.3167−0.2605−0.1831−0.1263−0.4212−0.24870.0876
Added value of the secondary industry0.00160.12130.18240.3092−0.03390.10510.1116
Per capita grain
acreage
−0.4154−0.3949−0.3876−0.3606−0.4582−0.40140.0246
Proportion of the fishing industry in the primary industry−0.3171−0.2486−0.2004−0.1543−0.4138−0.26760.0768
Urbanization rate0.07360.13020.16370.2763−0.03310.12410.0815
Number of industrial enterprises0.65060.73150.81751.01730.59010.75110.1280
Publisher’s Note: MDPI stays neutral with regard to jurisdictional claims in published maps and institutional affiliations.

