Article

Hybrid Approach to Corporate Sustainability Performance in Indonesia’s Cement Industry

1
Department of Leisure Industry Management, National Chin-Yi University of Technology, Taichung 411030, Taiwan
2
Institute of Innovation and Circular Economy, Asia University, Taichung 41345, Taiwan
3
Department of Business Administration, Asia University, Taichung 41345, Taiwan
4
Department of Management, Universitas Airlangga, Surabaya 60115, Jawa Timur, Indonesia
5
Department of Medical Research, China Medical University Hospital, China Medical University, Taichung 404333, Taiwan
*
Authors to whom correspondence should be addressed.
Sustainability 2021, 13(24), 14039; https://doi.org/10.3390/su132414039
Submission received: 20 October 2021 / Revised: 5 December 2021 / Accepted: 12 December 2021 / Published: 20 December 2021

Abstract

:
This study aimed to create a solid framework for decision-making in Indonesia’s cement industry, emphasizing those factors which bring about the most impactful results. The framework was developed using the fuzzy Delphi method, the fuzzy decision-making trial and evaluation laboratory, and a fuzzy Kano model. This study builds a hierarchical structure to approach the impact of corporate sustainability performance. We classify important factors into causes or effects and further identify those factors which are critical to improving the performance of Indonesia’s cement industry. Although corporate sustainability performance is a crucial topic in today’s business environment, sustainability strategies remain underrated in Indonesia. We confirm the validity of 19 factors within the following dimensions: environmental impact, social sustainability, economic gain, technological feasibility, and institutional compliance. The sub-dimensions of community interest, risk-taking ability, and regulatory compliance were identified as causes of perceived risks and benefits. In contrast, the following factors were identified as critical to improving corporate sustainability performance: renewable energy resources, contributions to charity, the perception of management regarding technology as a differentiator, and firm readiness to collaborate with high-tech companies.

1. Introduction

Since 2019, the Indonesian cement industry’s capacity has reached 114 million tons, of which 70 million tons were destined for domestic consumption [1]. The cement industry involves air pollution, energy consumption, and CO2 emissions worldwide, including sulfur dioxide (SO2), nitrogen oxides (NOx), and particulate matter (PM). The cement-producing province of North Sulawesi on Celebes exported 63,000 tons of cement in May 2021. Over the same period, the associated air pollution, energy consumption, and CO2 emissions increased due to various sustainable development measures being essential to the industry. Those firms in the industry need to build performance measures toward sustainability. Hence, corporate sustainability performance (CSP) is important to transform how businesses operate in order to create value for multiple stakeholders [2,3,4]. However, the industry is facing increasing competition and pressures from economic, environmental, and social aspects [5,6,7]. A decision-making CSP framework needs to highlight the attributes to guide industry leaders and policy-makers for sustainable development.
Tseng et al. [8] claimed that the CSP functions measure a firm’s effectiveness. Xia et al. [9] argued that CSP can assist industry in reaching business goals while protecting the sustainable development of society and the natural environment. However, strategies of sustainability remain underrated in many sectors and national economies [4]. One of these is the cement industry in Indonesia, which serves as the backbone of infrastructural development in the country. Indonesia is one of the top-five global producers of cement [10]. High-level CSP mandates balance among social, economic, and environmental requirements. It has been called the ‘triple bottom line’ (TBL) [3,8,11]. The concept of the TBL has been widely applied to assessments of CSP; however, this approach may be missing crucial aspects [9,12,13]. Aras et al. [12] argued that the concept of sustainability is vast and pervasive, which means it is unlikely to be limited to only three components. Fu et al. [14] suggested that technology plays a role in attaining high-quality CSP. Diaz-Chao et al. [15] emphasized that technology can be used to enhance efficiency in order to increase firm performance. In addition, Chatzitheodorou et al. [16] argued that firms face institutional pressure to meet the needs of their stakeholders. It includes regulations set by governments and industry associations. Baah et al. [17] claimed that regulatory compliance can serve to gain the support of regulatory institutions, which results in improved corporate performance. Hence, in this paper, we add technological feasibility and institutional pressure to the TBL definition of CSP.
Many studies have pointed out the complexity of CSP and the uncertainty associated with relevant qualitative and quantitative data. We therefore employed the fuzzy Delphi method (FDM) and the fuzzy decision-making trial and evaluation laboratory (DEMATEL) to approach measurements of CSP. First, we applied fuzzy Delphi to confirm the validity of CSP factors extracted from the literature. Second, we used DEMATEL to determine the relationships among these factors, including cause and effect relationships [18]. Third, we sought to determine the effect exerted by the different attributes. That is, sustainability factors are critical to improving CSP [19]. To answer this question, we applied the fuzzy Kano technique, which categorizes factors into distinct clusters. Ilbahar and Cebi [20] proposed the fuzzy Kano model to assist decision-makers in determining the importance and relevance of selected factors. Shokouhyar et al. [21] applied it to determine the significance of individual factors in the face of limited corporate resources. The objectives of this study were therefore as follows:
  • To develop a valid hierarchical structure for CSP;
  • To determine the causal relationships among CSP factors;
  • To identify factors critical to the improvement of CSP in Indonesia’s cement industry.
The remainder of this study is structured as follows: Section 2 presents a review of relevant literature on CSP, including theoretical background, our methodology, and the factors selected for analysis. Section 3 provides a detailed overview of the methodologies employed in this study. Section 4 contains our findings and discussion. Section 5 discusses the practical and theoretical implications. Lastly, Section 6 summarizes our findings, discusses limitations, and makes recommendations for future studies.

2. Literature Review

Our discussion of relevant literature is divided into four sections. We first present a nuanced definition of CSP. We then focus on technological feasibility and institutional compliance. Finally, we outline the proposed methodology and the factors selected for the original framework.

2.1. Corporate Sustainability Performance

CSP is defined as the activities a firm engages in in quest of sustainability at the economic, social, and environmental levels. The definition includes the firm’s relationships with relevant stakeholders and operating strategies [22]. The business sector has profoundly engaged with the concept of CSP as an incentive rather than a requirement. This has resulted in a paradigm shift in how companies conceptualize and generate value [23,24]. Indeed, CSP is considered as the process of meeting and managing stakeholders’ demands and preferences on behalf of the organization, while maintaining profitability and preserving human capital and environmental resources for the near and distant future [25,26]. It means it is closely linked with the concept of the TBL [4,9]
Elkington [27] presented the idea of the “triple bottom line” (TBL), which refers to the notion of sustainable performance as represented by a triple line with varying interfaces between social, economic, and environmental dimensions. Since then, the TBL approach has been adopted by many studies to measure corporate sustainability performance [28,29]. The TBL evaluates performance in three ways: traditional profit or economic measures, an assessment of its environmental responsibilities, and people’s concerns about a firm’s social responsibility as evidenced by its operations [30]. The TBL comprises fundamental pillars for determining a firm’s sustainability [30,31]. Sustainability is the capacity to preserve long-term welfare that enables enterprises to meet current requirements without jeopardizing future generations’ ability to meet their own.
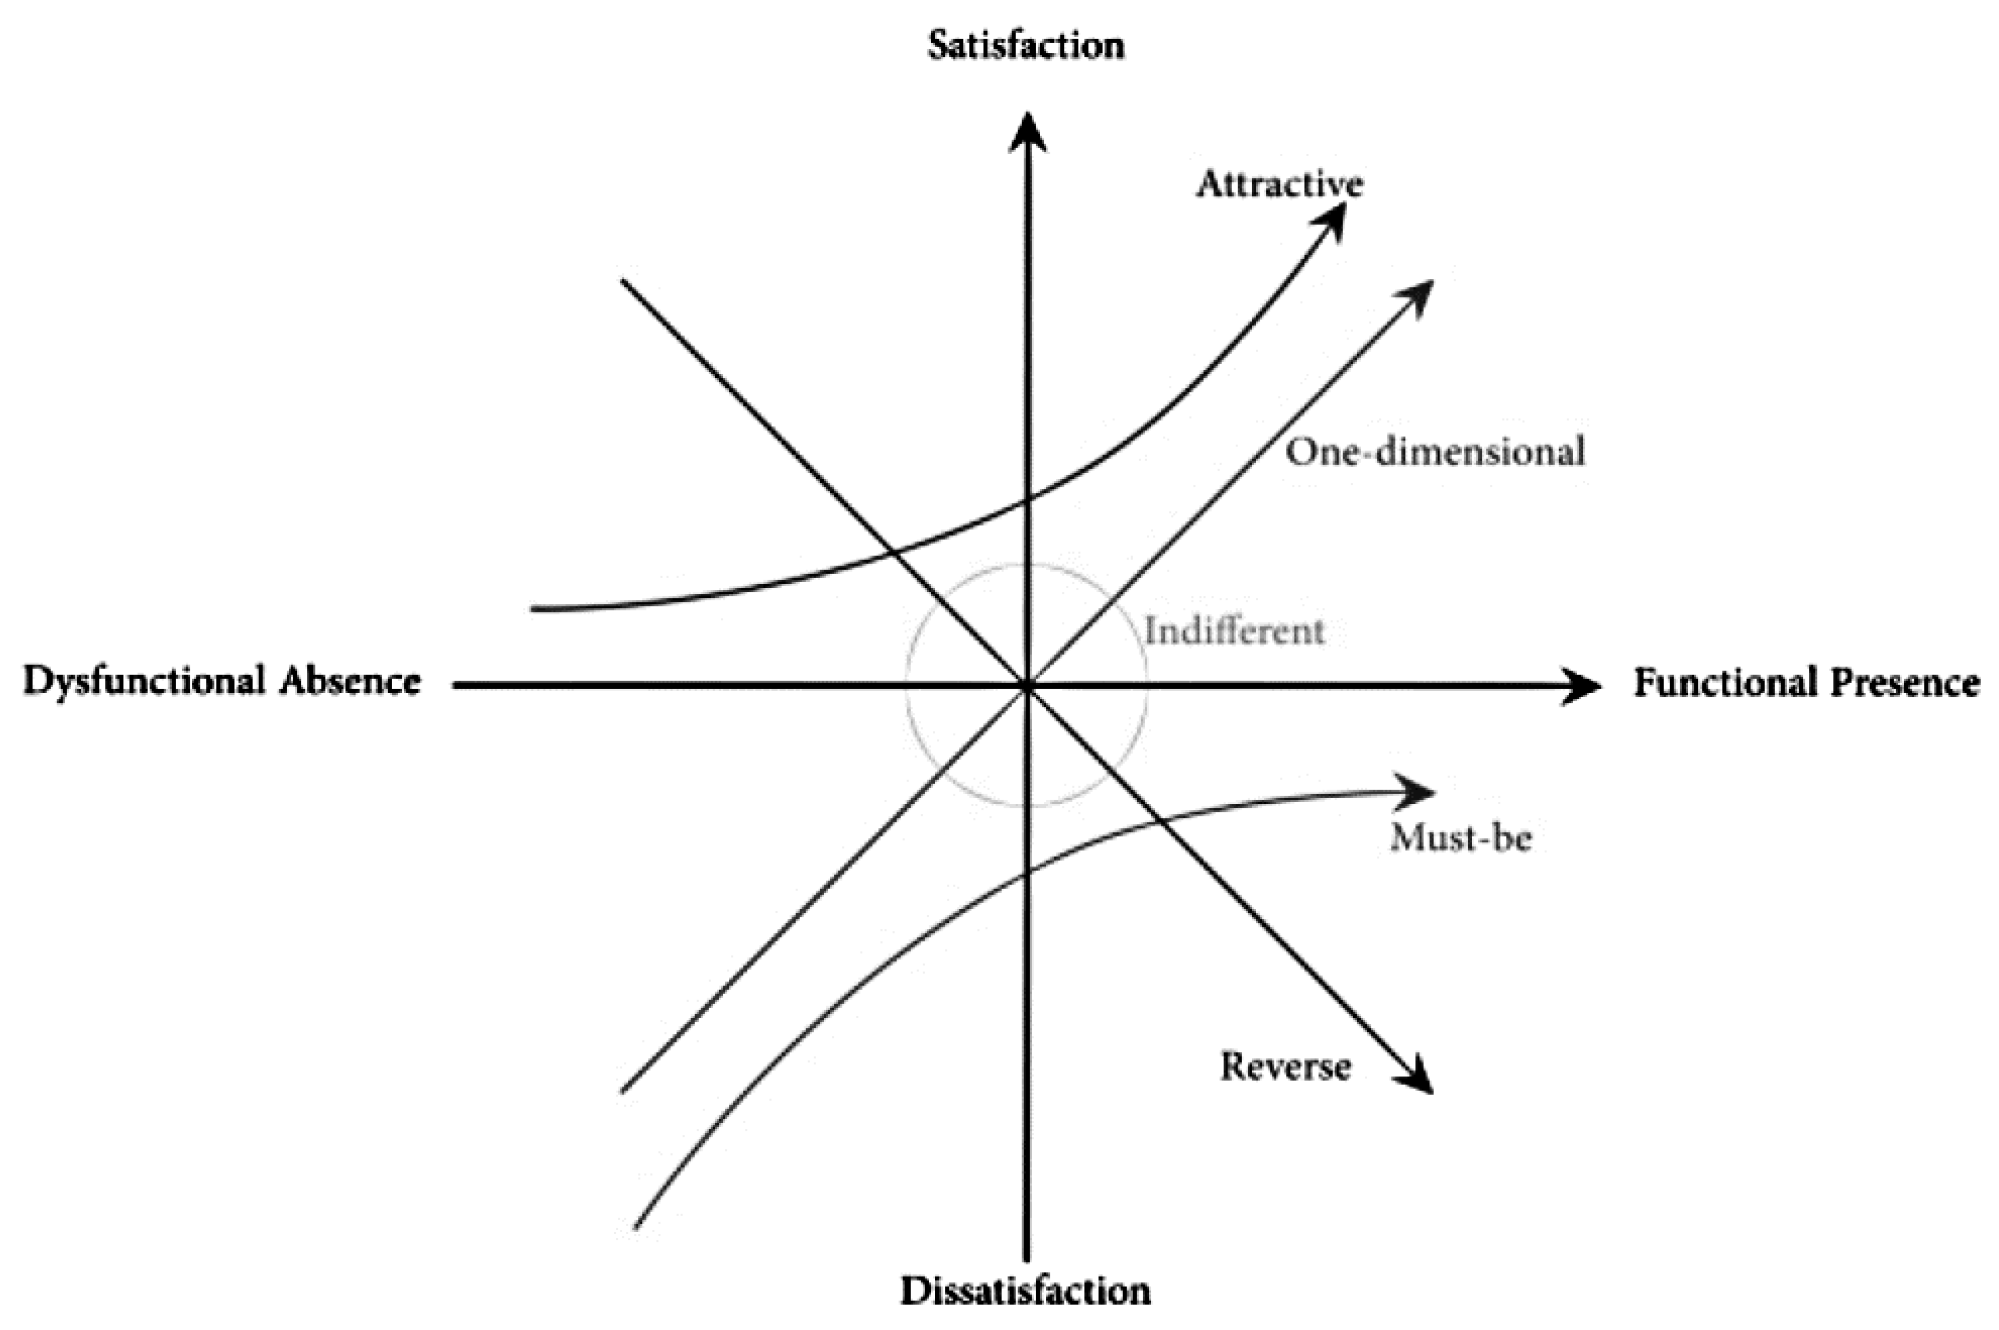
Although CSP is often considered synonymous with the TBL concept, several researchers have claimed that assessments of CSP based on only three criteria may be insufficient [9,12,13]. For example, Bhupendra and Sangle [13] pointed out the importance of adopting advanced technology to eliminate the waste and emissions generated by production processes. Furthermore, Annunziata et al. (2018) argued that the adoption of advanced technology in the manufacturing process was associated with higher sustainability performance. It seems that technological incorporation could assist in improving the efficiency of CSP. Additionally, Xia et al. [9] noted the influence of pressure from governments and industry associations exerted to meet regulations. We therefore aimed to expand the notion of CSP by incorporating these two factors.

2.2. Technological Feasibility

Innovative sustainable technology is a novel avenue for alleviating environmental pressures and promoting sustainable capabilities [13]. To achieve unparalleled productivity levels, product breakthroughs and process innovations are required to reduce waste and emissions both within and outside of organizational boundaries [13,15]. This mandates a fundamental shift away from existing systems, technologies, and products [32]. Severo et al. [33] argued that incorporating emerging technologies into manufacturing processes offers a significant advantage. Ozusaglam et al. [34] and Diaz-Chao et al. [15] specified that technology can help firms to boost their efficiency with renewable, less energy-intensive, and safer manufacturing processes. Therefore, there is a broad consensus that technical advancements can make a major difference to CSP, particularly in mitigating adverse environmental effects [13,14,35]. Severo et al. [33] suggested that by incorporating new technologies, such as cleaner production, into manufacturing processes, the consumption of raw materials is also likely to decrease. Maisiri et al. [36] pointed out that adopting this kind of new technology will enhance economic and environmental sustainability and is expected to positively impact social acceptance. These benefits are already being enjoyed by pioneering cement industries in countries around the world [33].

2.3. Institutional Compliance

The practices of firms are affected by the expectations of external parties such as institutions and stakeholders [37]. These external parties can have a substantial impact on the decision processes and behaviors of firms. Stakeholders have particular demands that must be met by the company, and the pressure generated by these demands can serve as an incentive for firms to adopt environmentally-friendly business practices. Prior studies have categorized stakeholders as either primary or secondary ones [17,38]. Primary stakeholders are entities capable of influencing important aspects of the company, while secondary stakeholders have less influence on company survival. Government and industry or trade associations are considered primary stakeholders because these bodies have the power to establish regulations and standards.
As a primary stakeholder, the government has power over corporate management through regulations and legal requirements of compliance [16,39,40]. Acquah et al. [41] argued that changes in prevailing laws and requirements for legal compliance at both regional and national levels have a substantial influence on firms’ operations. Qi et al. [37] specified that technical requirements, environmental taxes, and emission license procedures obligate businesses to devote resources to pollution mitigation. Promoting socially-responsible behavior is the most apparent motivation driving institutional stakeholders; disciplinary procedures and fines are the most common consequence of non-compliance. These elements affect a firm’s operating costs, thereby aiding in the advancement of its manufacturing processes.
An important secondary stakeholder is industry associations, who also gauge the environmental performance of their members [17,38]. Shubam et al. [40] argued that industry associations enforce industry standards and smear nonconforming organizations for high-pollution industries. Baah et al. [17] affirmed that a firm’s inability to comply with industry-association demands or standards will significantly deteriorate the firm’s reputation and legitimacy. This strengthens firm performance in environmental and social aspects, leading to stronger relationships among stakeholders, organizational credibility, healthy company image, satisfaction of stakeholders, and commitment to meeting stakeholder needs.

2.4. Proposed Methodology

This study employs multiple methods. Initially, FDM is used to filter the collection of factors gleaned from previous studies. Tseng et al. [18] suggested that the subjective perception of humans is replete with ambiguities. Therefore, they applied fuzzy set theory to the traditional Delphi method. Bui et al. [42] asserted that the benefit of the FDM approach is that it can reduce the time required to make a decision based on expert opinion. The large body of research on CSP has resulted in a wide range of factors purported to be relevant to the concept. FDM was used to ensure that we only considered valid factors relevant to the aims of the current study. We then applied FDEMATEL to determine the relationships among the factors with a specific focus on causes and effects [5,18]. This method aids decision-makers in visualizing the relationships among various relevant factors of complex topics. This greatly assists in the decision-making process.
Once relevant factors have been selected, and the relationships among them identified, it is necessary to determine their level of impact on the topic at hand [19]. This study employs a fuzzy Kano model to categorize the selected factors into distinct performance clusters. Shokouhyar et al. [21] used the Kano model to determine the functional and dysfunctional aspects of attributes. Jain and Singh [19] applied the Kano model to CSP, confirming its capacity to identify areas for development to foster an organization’s overall sustainability. We classify the factors selected in this study into the following groups: required, one-dimensional, desirable, indifferent, and reversed effect.

2.5. Proposed Factors for Original Framework

Based on a review of relevant literature, we considered the following five dimensions of CSP: environmental impact, social sustainability, economic gain, technological feasibility, and institutional compliance. Each of these were divided into two sub-dimensions. Environmental impact comprises resource usage (A1) and environmental pollution (A2). Social sustainability is achieved through human resources development (A3) and community interest (A4). Economic gain can be measured by either financial performance (A5) or market performance (A6). Technological feasibility is determined by the adoption of technology (A7) and the ability to take risks (A8). Institutional compliance can be divided into regulatory compliance (A9), that is, compliance with government regulations, and compliance with industry associations (A10). Within these ten sub-dimensions, we found 44 factors of CSP. These are specified in Table 1. We introduce each in the following.
The optimization of resource usage (A1) is considered critical to CSP. A Firm’s efforts to limit hazardous chemicals and components (C1) can mitigate negative environmental impacts [43]. Using waste as inputs (C2) also offers advantages [43]. Renewable energy resources (C3) are a promising avenue towards greater sustainable environmental [23,44]. Increasing the efficiency of the consumption of raw material (C4) helps firms build superior corporate resources and capabilities [23].
Environmental pollution (A2) includes waste (C5) and greenhouse gas emissions (C6) [11]. Reducing emissions and streamlining the disposal of waste are important aspects of controlling environmental pollution [23,45]. Other environmental impacts include noise pollution from manufacturing processes (C7), the mining of limestone (C8), and negative effects of company operations which lead to complaints from residents (C9) [46].
Human resources development (A3) emphasizes the critical nature of social resource management, which is at the heart of CSP [3]. Human resources development is focused on talent attraction and retention (C12), which is relevant to sustainability because talented employees contribute to innovative development [3,18]. Training develops dedicated staff, while reward systems positively affect behavior and increase commitment [3]. Managing employees’ satisfaction (C10) regarding their jobs and the organization they work for as well as offering employees long-term benefits (C14) also help firms to retain the best talent [23]. Employing a skill-building orientation (C13) [22] and increasing gender diversity in the workplace (C11) [11] also lead to higher social sustainability performance.
Community interest (A4) can be generated by developing mission statements, establishing social networks, and committing to the protection of community rights [3]. A firm’s mission determines its strategic priorities and differentiates it from competitors. A clear socio-oriented mission statement (C16) reflects the firm’s concern for society [3]. However, a mission statement alone is not adequate to attain CSP; a firm’s commitment to protect the rights of the local community (C20) and their contributions to charity (C17) reflect that the firm is recognizing and acting on the needs of the local community [43]. In order to attain social sustainability, firms should develop economic activity in their neighborhoods and create additional job possibilities (C18) [47]. This aids in fostering a mutually beneficial relationship (C19) with society.
Financial performance (A5) refers to the financial aspects of a firm which enhance its position compared to its competitors [48]. It encompasses profit growth (C23) [49,50] and return on assets (C26) [49]. Profitability can also be measured by the return on equity (C21) provided by shareholders [23,51]. Artiach et al. [25] argued that only firms that offer a large profit margin to shareholders have a high CSP. Return on investment (C22) reflects the efficiency of investment; this is therefore an indicator of superior financial performance [51]. When industry becomes saturated in one country, a company may consider exporting its products (C24) [46]. The ratio between debts and assets (C25) represents the proportion of financed assets where a larger ratio implies a higher level of leverage and financial risks [8]. While acceptable financial leverage can help companies remain viable, excessive financial leverage increases their financial vulnerability.
While financial performance demonstrates an organization’s capacity to manage its financial activities, market performance (A6) demonstrates a corporation’s capability to escalate its sales volume as well as its share of market [52]. The firm’s market share (C27) reflects its competitiveness [49,52]: the higher the share of market, the higher the firm’s economic gain. Sales growth (C28) indicates the performance of current sales compared to a previous period [23,52].
Technological adoption (A7) reflects a firm’s intention to incorporate advanced technology to its production processes [13]. Businesses that adopt innovative technology can simultaneously reduce their dependence on conventional energy sources and improve their sustainability performance. Sustainability requires revolutionary, cleaner technologies capable of displacing traditional products and services [53]. Fu et al. [14] argued that firm readiness to adopt clean production processes (C31) may significantly decrease waste as well as carbon emissions. Recycling technology (C30) enables the recycling of industrial waste to serve as inputs [13]. Technology adoption is only possible with adequate training (C33), which further serves to secure employee readiness to innovate (C32) [54].
Risk-taking ability (A8) determines a firm’s performance in volatile future markets [13]. The development of long-term solutions is not merely about dramatic improvements to goods, operations, and services; it involves preparation for future transformation, which is eased by the proactiveness of top management [22]. A shift to sustainability begins with a succinct conceptualization and the formulation of an appropriate organizational strategy [24]. Hence, firms must have a clear view of what technologies will be beneficial (C35) in order to secure the resources necessary to execute future technologies. Firms are more likely to pursue technology if they believe it will improve their competitive edge [13]. Thus, if technology has the potential to differentiate the firm from competitors (C36), management will be encouraged to take greater risks. Top management risk-taking ability (C34) leads the opinions and perceptions of employees downstream [13]. Managers must make additional efforts to lessen their reliance on dwindling natural resources [55]. Therefore, in order to protect investment and share the risk associated with the adoption of sophisticated sustainable technologies, firms can explore partnerships with high-tech corporations (C37) [36].
Firms are embedded in complex relationships with internal and external stakeholders. These stakeholders are crucial to the firm’s performance because they have the ability to influence the firm’s long-term strategic goals; hence, incorporating stakeholder demands directly and clearly is vital [56]. One of the most influential stakeholders is government, which demands regulatory compliance (A9). Many firms have adopted an informed and strategic stance to regulations to ensure that environmental measures are likely to result in competitive advantages [57]. Moreover, Danso et al. [57] claimed that benefits may accrue as a result of reactive actions such as regulatory government policies or as a result of high proactive efforts. Chatzitheodorou et al. [16] and Zhao et al. [58] argued that government exerts significant influence on firms regarding sustainability issues. Government formulates both legislative (C38) and national (C39) standards [59]. Wagner [52] argued that strict environmental legislation will cause extra expense for firms that do not comply. Indeed, national and regional legislation have increased their authority and ability to interrupt firm operation through sanctions and penalties if firms do not comply with the legislation. Under the close control of the government (C41), implementing company sustainability practices should be regarded as a collaborative initiative to lessen regulatory pressure [59].
Secondary stakeholders such as industry associations (A10) can push firms to comply with industry standards. Shubham et al. [40] pointed out that industry associations in high-pollution industries pressure their members by self-regulating the industry and denigrating noncomplying groups (C44). Industry associations establish their own environmental standard so as to preserve their mutual legitimacy [40,60,61,62,63,64]. To retain memberships, firms must meet association requirements (C42) for social and environmental responsibility. With targeted environmental and social responsibility initiatives, the industry association also encourages (C43) organizations within its sector to adopt more sustainable practices. By the existence of industry associations, all firms within the industry are urged to become more ecologically and socially responsible.

3. Method

3.1. Industry Background

The cement sector in Indonesia is facing increasing competition as well as pressures from stakeholders related to emissions, waste, health, safety, and the needs of the local community. In Indonesia, supply exceeds demand; in 2019, sales volumes fell by 2.05% [1]. This problem of overcapacity can be attributed to government policy that opened the nation to direct foreign investment. This has led to many foreign cement firms basing their production in Indonesia. Such circumstances significantly limit potential sales growth, especially in the domestic market. Therefore, cement firms in Indonesia have come under economic pressure. In addition, government regulations have mandated reductions in greenhouse gas emissions, creating institutional pressure. Dramatic cuts in emissions are only possible with new production technologies, but developing new production technology requires significant financial investment. Firms also rely on stakeholders such as industry associations to gain competitive advantage and ensure their survival. To gain their support, firms must pursue the interests of the community [62]. Faced with multiple interlinked pressures, decision-makers in the cement industry must determine which areas are most urgently in need of improvement and identify means of increasing benefits, reducing risk, complying with regulations, identifying new opportunities, reducing costs, increasing efficiency, and strengthening the company’s competitive advantage.
This study is conducted in order to assist the cement industry in Indonesia by providing a better knowledge and understanding of the interrelationship among the factors promoting CSP. Furthermore, this study also addresses the importance and relevance of the factors that help the decision-makers in making an optimal decision. Therefore, we combined several methods in order to fulfill these objectives.

3.2. Data Collection

We invited a panel of 40 specialists with experience working and studying in the cement industry in Indonesia, including 37 currently working in the industry and three experts from academic institutions. The average experience of the experts was 19.85 years (Table A1 in Appendix A).

3.3. Fuzzy Delphi Method

FDM was originally developed as a synthesis of fuzzy set theory and the Delphi method to address the limits of expert opinions and increase the reliability of questionnaires [63]. It effectively translates linguistic assessments into quantitative data from small sample sizes while reducing both time and financial costs [42].
In a committee of n experts, expert x is asked to determine the importance of a selected factor y as follows: p = ( h a b ; i a b ; j a b ) , a = 1 ,   2 ,   3 , , t ; b = 1 ,   2 ,   3 , , u , where p b is the weight of y represented as p b = ( h b ; i b ; j b ) with h b = m i n ( h a b ) , i b = ( 1 n i a b ) 1 / n , and i b = m a x ( c a b ) . Triangular fuzzy numbers (TFNs) are then used to translate linguistic evaluations into fuzzy numbers using the key presented in Table 2.
Values of the convex fusion are applied as follows:
u b = h b ε ( j b i b ) , p b = x b ε ( b b ε h b ) , i = 1 , 2 , 3 , , m ,
where ε = [ 0 , 1 ] represents whether expert judgments are positive or negative. Fuzzy evaluation converts fuzzy data to quantified data F b :
F b = ( u b , p b ) = σ [ u b + ( 1 σ ) p b ]
where σ represents the expert’s optimistic assessment of the state of equilibrium.
Following that, the threshold is determined as R = ( b = 1 m F b ) / m for the factors in the initial list. If F b R , factor b is valid. Otherwise, it is eliminated.

3.4. Fuzzy DEMATEL

Defuzzification is used in fuzzy DEMATEL to convert qualitative data to fuzzy linguistic information. A defuzzification method in which the fuzzy output is converted to a single crisp value using the degree of membership values, similar to the fuzzification process [65]. In comparison to fuzzification, defuzzification is an inverse transformation, whereby the fuzzy output is turned into crisp values that can be applied to the system [66,67]. Fuzzy membership functions e ˜ x y n = ( e ˜ 1 x y n , e ˜ 2 x y n , e ˜ 3 x y n ) are employed to generate the sum of weighting factors. The right and left values, in particular, are derived by calculating the lowest and highest fuzzy values. Afterwards, the crisp values are settled in a matrix of complete direct relationships for the purpose of simplifying the analytical results by mapping them to a graphic representation. Finally, the cause-and-effect groupings assign specific factors to represent the structural relationships among them.
Set of factors Q = { q 1 , q 2 , q 3 , , q z } is provided, and mathematical associations are generated through the use of pairwise comparisons. Utilizing linguistic parameters ranging from ‘very little influence’ (VLI) to ‘very high influence’ (VHI), crisp values were determined using the information presented in Table 3. Assuming there are n experts participating in the assessment process, e ˜ i j n reflects the fuzzy weight of the i t h factor’s effect on the j t h factor as determined by expert n t h .
Fuzzy numbers are simplified as follows:
Q = ( q e ˜ 1 x y n ,   q e ˜ 2 xy n ,   q e ˜ 3 x y n ) = [ ( e 1 x y n m i n   e 1 x y n ) Δ ,   ( e 2 x y n m i n   e 2 x y n ) Δ ,   ( e 3 x y n m i n   e 3 x y n ) Δ ]
where Δ = m a x   e 3 x y n m i n   e . Normalized values for the left ( l ) and right ( r ) sides are computed using
( l x y z ,   r x y z ) = [ q e 2 x y n ( 1 + q e 2 x y n q e 1 x y n ) , q e 3 x y n ( 1 + q e 3 x y n q e 2 x y n ) ] .
Normalized crisp values ( c v ) are calculated using
c v x y n = [ l x y n ( 1 l x y n ) + ( r x y n ) 2 ] ( 1 l x y n + r x y n ) .
The individual perceptiveness of the n respondents is used to calculate the synthetic crisp values, which are then accumulated as follows:
e ˜ x y n = ( c v x y 1 + c v x y 2 + c v x y 3 + + c v x y 3 ) n .
The s × s original matrix of direct relationships ( I M ) is obtained in a configuration of reciprocal comparatives, where e ˜ x y n denotes the degree of effect of factor i on factor j as I M = [ e ˜ x y n ] s × s .
The following procedure is used to construct the normalized direct relation matrix (U):
U = τ I M τ = 1 x = 1 n 1 i n m a x e ˜ x y n .
The interrelationship matrix ( W ) is then acquired as follows:
W = U ( I U ) 1 ,
where W is [ w x y ] s × s   i , j = 1 , 2 , z . The values of driving power ( α ) and dependence power ( β ) are calculated using the row and column totals of the interrelationship matrix:
α = [ x 1 s w x y ] s × s = [ w x ] s × 1
β = [ y 1 s w x y ] s × s = [ w y ] 1 × s .
The output of the process is a cause-and-effect diagram in which factors are assigned positions via the derivation of [ ( α + β ) ,   ( α β ) ] , which yields the horizontal and vertical axes. The x-coordinate ( α + β ) indicates the importance of the factors. In contrast, factors are separated into cause and effect clusters on the basis of their y-coordinates, which can be greater or less than zero. If the ( α β ) value is greater than zero, the factor is considered a cause and if it is less than zero, it is considered an effect.

3.5. Fuzzy Kano Model

The primary purpose of the Kano model is to uncover, organize, and create a matrix based on the following five levels:
(a)
Must-be (M): These are critical factors. Failure to work on these areas dramatically increases poor performance.
(b)
One-dimensional (O): When these factors are present, the firm’s performance is enhanced; if these factors are ignored, performance deteriorates.
(c)
Attractive (A): These factors promise good performance once fully accomplished, but do not cause poor performance when not achieved. They are unpredictable and often undeclared.
(d)
Indifferent (I): These factors have no bearing on performance.
(e)
Reversed effect (R): These criteria refer to a high level of performance that later results in poor performance and that not all decision makers are similar.
The model poses two types of questions for each factor: functional and dysfunctional. Functional questions focus on adequate performance of the factor, while dysfunctional questions identify inadequate performance. The structure of the model is shown in Figure 1.
Matrices F and D respectively record answers to the functional ( F ) and dysfunctional ( D ) inquiries. Matrix S is obtained by multiplying the transpose of matrix F by matrix D . Matrix S is [ 5 × 5 ] , corresponding to the Kano evaluation table shown in Table 4.
Fuzzy evaluations reduce imprecision and uncertainty. If respondents are asked to choose multiple answers on a fuzzy basis, the evaluation data will be a better representation of their original judgments. Hence, the method provides high flexibility in terms of revealing their authentic perceptions. Response options can include like, expected, neutral, acceptable, and dislike. Respondents can also mark multiple responses with quantitative values within the interval of 0 to 100%. That is, if they do not specify their judgment with one choice, they can indicate shared percentages as follows: like −25% and expected −75%. Then, S [ 5 × 5 ] is calculated by combining F [ 5 × 1 ] and D [ 1 × 5 ] . For example,
F = [ 0.25 0.75 0 0 0 ] , D = [ 0 ,   0 ,   0 ,   0 ,   1 ]
Then the fuzzy Kano Model is calculated as follows:
S 5 × 5 = F 5 × 1 × D 1 × 5 = [ x 11 x 12 x 13 x 14 x 15 x 21 x 22 x 23 x 24 x 25 x 31 x 32 x 33 x 34 x 35 x 41 x 42 x 43 x 44 x 45 x 51 x 52 x 53 x 54 x 55 ]
For example,
0 0 0 0 1 S 5 × 5 = 0.25 0.75 0 0 0 [ 0 0 0 0 0.25 0 0 0 0 0.75 0 0 0 0 0 0 0 0 0 0 0 0 0 0 0 ]    
Thereafter, the membership values can be calculated as follows:
( M ) = x 25 + x 35 + x 45 , ( O ) = x 15 , ( A ) = x 12 + x 13 + x 14 , ( I ) = x 22 + x 23 + x 24 + x 32 + x 34 + x 42 + x 43 + x 44 , ( R ) = x 21 + x 31 + x 41 + x 51 + x 52 + x 54 .
This gives us fuzzy set T:
T = [ 0 0.25 0.75 0 0 A O M I R 0 0 1 0 0 ]

4. Results

4.1. Fuzzy Delphi Method

Application of FDM reduced the number of factors relevant to CSP from 44 to 19 with threshold R = 0.289 . The results of this process are shown in Table A2. In addition, the remaining valid factors are shown in Table 5.

4.2. Fuzzy DEMATEL

Table 3 was used to translate linguistic parameters into TFNs. The average of all the respondents’ crisp values was calculated and integrated into the origin direction matrix shown in Table 6. The matrix of total interrelationships was then produced; this matrix depicts the causal relationships among components (shown in Table 7). The causal-effect diagram is mapped in Figure 2.
Figure 2 shows that the following sub-dimensions are causes of perceived benefits and risks: community interest (A4), risk-taking ability (A8), and regulatory compliance (A9). Effects include resource usage (A1), environmental pollution (A2), and financial performance (A5). Furthermore, A4 has weak effects on A1 and A5, as does A8 and A9 on A5. On the other hand, A8 and A9 have a strong effect on A2, implying that A8 and A9 are important aspects to focus on.

4.3. Fuzzy Kano

From the Fuzzy Kano analysis, the criteria are sorted in 3 above 5 levels including must-be, one-dimensional, and attractive. There are no criteria fall into Indifferent and Reversed effect level. These are shown in Table 8.

5. Implications

5.1. Theoretical Implications

This study analyzes the body of knowledge on CSP. We found that social performance, technological feasibility, and institutional compliance play essential roles in improving sustainability performance. Specifically, community interest (A4), risk-taking ability (A8), and regulatory compliance (A9) are causal aspects of the CSP framework.
Community interest (A4) should be a priority of firms, based on their relationships with financial performance and resource usage. This finding demonstrates that the firms must prioritize the interests of the community in order to attain CSP. Prior studies have addressed the significance of community interest to CSP [3]. It reflects the firm’s responsibilities to society, which can increase competitiveness based on resources obtained. Shifting from regarding community interest as harm mitigation to creating significant benefits for both society and business can help the firm to achieve sustainable performance.
Moreover, risk-taking ability (A8) affects financial performance, resource usage, and environmental pollution. It is critical in pursuing the development and application of environmentally-friendly technology, operations, and goods, involving not only taking calculated risks, but also anticipating risk and effectively controlling and utilizing errors [15]. Risk-taking enables a firm to cultivate an environment of tolerance and risk, also serving as a catalyst for experimentation to accelerate the acquisition, learning, and absorption of new external technology. Adopting new technology in the production process requires significant investment and offers highly-unpredictable returns. Thus, selecting technology that is compatible with the needs of the firm while controlling for risk is an important skill set for today’s firms.
Regulatory compliance (A9) can also assist firms in achieving CSP. It affects financial performance, resource usage, and environmental pollution. It further reflects firm requirements to comply with regulations related to sustainability practices. Regulation from government and local legislation exerts pressure on firms to employ eco—friendly manufacturing techniques and energy and raw materials efficiency. Such actions have a long-term effect on promoting environmental safety [41,63]. Consistent with prior studies, our results indicate that meeting government regulations relating to environmental obligations depletes a firm’s financial resources, but violating those regulations will be more harmful for the firms [17]. When a firm fails to fulfill government regulations, it can lead to lawsuits, which harm the firm’s image and its future sustainability performance. In other words, regulatory compliance is considered a prerequisite for sustainability initiatives. Compliance builds a positive image, gains support from the government, and achieves higher sustainability performance.

5.2. Practical Implications

According to the outcomes of this study, energy sources are critical factors for CSP in the cement industry. Desirable factors include renewable energy sources, contributions to charity, management perceptions of technology, and firm readiness to collaborate with high-tech firms. These factors can bring unexpected benefits without harmful consequences.
Currently, the cement industry in Indonesia is heavily dependent on fossil-based energy sources. While the industry does strive to achieve energy efficiency to reduce its impact on the environment, further measures are required. For instance, the industry should implement energy management to save on energy usage and secure energy supply. The implementation of energy management should encourage the industry to seek out renewable sources of energy. Several alternative sources can be considered for cement production. For example, biomass energy utilizes environmentally-friendly materials such as rice husk, coco peat, and tobacco waste.
CSP also relies on the social sub-dimension of contributions to charity. The cement firms should strive to achieve synergy between its operating activities with the interests of the local community. Although commitment to the local community is regulated by law, its implementation is often perfunctory. Contributions to charity must be well coordinated, requiring a dedicated department. In Indonesia, social activities are embedded in the roles of corporate secretaries or human resource managers, implying a lack of strategic focus on the potential benefits of this sub-dimension. Monitoring and evaluation of this activity will ensure more effective targeting.
To achieve sustainability, the adoption of new technology is essential. It will serve to differentiate the firm in the market. Cement products are considered commodities and many consumers cannot tell the difference between one cement and another. Firms could build a distinctive advantage by taking advantage of technology. Reducing production waste or pollution, for example, can be achieved through the adoption of novel technology. A firm’s perception of technology depends on its experiences. Firms that have been operating for a long time tend to have a better understanding of how companies can leverage technology to create a competitive advantage.
In order to boost CSP, a firm’s willingness to cooperate with high-tech companies is also important. The deployment of technology in the cement industry is not limited to manufacturing; all operations along the company’s value chain can be optimized. The application of technology entails investment and significant risk. The readiness of the firm to cooperate with high-tech companies can help cement firms reduce the likelihood of implementation failure as well as investment failure. Collaboration should take place with well-known companies and may take on a variety of forms. Involvement at a low level is analogous to engaging tech businesses as consultants. High engagement solicits the assistance of other companies in developing new technology adapted to the company’s demands.

6. Conclusions

This study expands the concept of CSP to include not only the TBL but also technological feasibility and institutional compliance. Using this expanded definition, we sought to determine the most important factors of CSP based on expert experience. We began the analysis by drawing 44 factors from the literature classified into the following 10 aspects: resource usage, environmental pollution, human resources development, community interest, financial performance, market performance, technology adoption, risk-taking ability, regulatory compliance, and association compliance. These were examined using FDM, DEMATEL, and fuzzy Kano. FDM first filtered the list of factors and DEMATEL then assessed the relationships among them. Fuzzy Kano then clustered the remaining factors into categories. Our findings offer both practical and theoretical contributions, especially within the context of the cement industry in Indonesia.
FDM confirmed 19 significant factors within the categories of environmental impact, social sustainability, economic gain, technological feasibility, and institutional compliance. DEMATEL identified community interest, risk-taking ability, and regulatory compliance as causes of perceived risks and benefits. Fuzzy Kano classified the following factors as critical: renewable energy resources, contributions to charity, the perception of management regarding technology as differentiator, and firm readiness to collaborate with high-tech companies. Awareness of these areas could help firms in the cement industry move closer to achieving high levels of CSP. With energy management as a strategic objective, firms can explore alternative energy sources that are renewable to reduce energy use and ensure ongoing supply. Well-coordinated contributions to charity are also a major factor in achieving CSP. Technology plays a significant role in differentiating firms. This criterion is linked to company willingness to cooperate with high-tech companies, enabling them to incorporate novel technology into their manufacturing processes. This willingness can assist cement manufacturers in minimizing the likelihood of investment failure. Therefore, partnerships with successful technology companies offer the cement industry an opportunity to move forward as pioneers in the field.
Our theoretical contributions include an extensive assessment of CSP encompassing environmental, economic, social, technological, and institutional aspects. Our expansion of the concept has particular relevance for the cement industry in Indonesia. We also combined three analysis methods to confirm the validity of the proposed framework, identifying interdependence among factors and highlighting those factors which can be considered critical to performance. This lays the foundation for future decision-making frameworks modeled on complex systems with imprecise and uncertain data. Our findings offer practical guidance for the cement industry in Indonesia as it works towards a sustainable future, both for itself and the wider society.
Although this paper offers several valuable contributions, it is subject to certain limitations worth noting. First, the factors in this study were derived from a single previous study. This may have hindered the holistic nature of our analysis. Subsequent research may include a meta-analysis of studies on the topic to offer a more comprehensive starting point. Second, this study is limited by the context of the Indonesian cement industry. To enhance generalizability, future studies may consider different countries and industries. Third, as we combined several methods to examine important factors and the relationships among them, it would be worth applying this approach to other contexts to compare the results and confirm the validity of the methodology.

Author Contributions

C.-H.W.—Original writing, editing and final version; Y.-C.C.—Editing and final version; J.S.—Original writing, editing and final version; T.-D.B.—Original writing, editing and final version, M.-L.T.—Original writing, editing and final version. All authors have read and agreed to the published version of the manuscript.

Funding

Ministry of Science and Technology, Taiwan MOST 109-2622-E-468-002.

Institutional Review Board Statement

Not applicable.

Informed Consent Statement

Not applicable.

Data Availability Statement

Upon Request.

Conflicts of Interest

The authors declare no conflict of interest.

Appendix A

Table A1. Respondents’ Characteristics.
OccupationLevel of EducationYears of ExpertiseOrganization Type (Academia/Practice)
1General Manager of Project Management Technology ExpertiseMaster26 yearsState-owned company/Practices
2Senior Manager of Strategic PlanningBachelor25 yearsState-owned company/Practices
3Senior Manager of Business DevelopmentMaster12 yearsState-owned company/Practices
4Senior Manager of Land Transportation PlanningBachelor24 yearsState-owned company/Practices
5Senior Manager of Process Technical ExpertiseMaster12 yearsState-owned company/Practices
6General Manager of Relationship MarketingBachelor11 yearsState-owned company/Practices
7Manager of SCM infrastructureBachelor30 yearsPrivate-owned company/practices
8Manager of CSRBachelor27 yearsPrivate-owned company/practices
9Manager of Safety monitoringBachelor27 yearsPrivate-owned company/practices
10Manager of IT StrategyBachelor25 yearsState-owned company/Practices
11Manager of area salesBachelor27 yearsState-owned company/Practices
12Manager of cash managementBachelor27 yearsState-owned company/Practices
13Senior manager of Transformation ManagementMaster12 yearsState-owned company/Practices
14Manager of Project Management Tech ExpertiseMaster12 yearsPrivate-owned company/practices
15Manager of Electrical Technical ExpertiseBachelor29 yearsState-owned company/Practices
16Manager of WelfareBachelor28 yearsPrivate-owned company/practices
17Manager of ProcurementBachelor25 yearsPrivate-owned company/practices
18Manager of Portfolio ManagementMaster26 yearsPrivate-owned company/practices
19Manager of Asset ManagementBachelor26 yearsPrivate-owned company/practices
20Manager of Waste Management Bachelor12 yearsPrivate-owned company/practices
21Manager of Services ProcurementBachelor23 yearsPrivate-owned company/practices
22Manager of Group RestructuringBachelor25 yearsPrivate-owned company/practices
23Manager of Account Receivable Bachelor24 yearsPrivate-owned company/practices
24Senior Manager of Technical SalesMaster12 yearsPrivate-owned company/practices
25Senior Manager of Internal CommunicationMaster12 yearsPrivate-owned company/practices
26Supervisor of Production Planning and ManagementMaster9 yearsPrivate-owned company/practices
27Supervisor of Distribution System DevelopmentBachelor6 yearsState-owned company/Practices
28Supervisor of Supporting MaintenanceBachelor9 yearsState-owned company/Practices
29General Manager of Production Planning and ControlMaster26 yearsState-owned company/Practices
30General Manager of Mining and Raw Material ManagementMaster26 yearsState-owned company/Practices
31Operational and Production DirectorMaster26 yearsState-owned company/Practices
32Human Capital and Finance DirectorMaster26 yearsState-owned company/Practices
33Supervisor of Inventory ManagementBachelor9 yearsState-owned company/Practices
34Manager of IT DevelopmentBachelor12 yearsState-owned company/Practices
35Supervisor of Distribution Plan & Control Bachelor9 yearsState-owned company/Practices
36Supervisor of General FacilitiesBachelor19 yearsState-owned company/Practices
37Supervisor of General AffairsBachelor11 yearsState-owned company/Practices
38Associate ProfessorDoctoral22 yearsAcademia
39Associate ProfessorDoctoral15 yearsAcademia
40ProfessorDoctoral27 yearsAcademia
Table A2. FDM results for criteria.
ubpbFbDecision
C1(0.283)0.7830.321Accepted
C20.0000.5000.250Unaccepted
C3(0.381)0.8810.345Accepted
C4(0.373)0.8730.343Accepted
C5(0.366)0.8660.342Accepted
C6(0.352)0.8520.338Accepted
C70.0000.5000.250Unaccepted
C8(0.378)0.8780.345Accepted
C9(0.336)0.8360.334Accepted
C100.0000.5000.250Unaccepted
C110.0000.5000.250Unaccepted
C120.0000.5000.250Unaccepted
C130.0000.5000.250Unaccepted
C140.0000.5000.250Unaccepted
C150.0000.5000.250Unaccepted
C16(0.387)0.8870.347Accepted
C17(0.400)0.9000.350Accepted
C180.0000.5000.250Unaccepted
C19(0.008)0.8830.440Accepted
C20(0.334)0.8340.333Accepted
C21(0.342)0.8420.335Accepted
C220.0000.5000.250Unaccepted
C23(0.311)0.8110.328Accepted
C240.0000.5000.250Unaccepted
C250.0000.5000.250Unaccepted
C260.0000.5000.250Unaccepted
C270.0000.5000.250Unaccepted
C280.0000.5000.250Unaccepted
C290.0000.5000.250Unaccepted
C300.0000.5000.250Unaccepted
C310.0000.5000.250Unaccepted
C320.0000.5000.250Unaccepted
C330.0000.5000.250Unaccepted
C340.0000.5000.250Unaccepted
C35(0.169)0.6690.292Accepted
C36(0.378)0.8780.344Accepted
C37(0.356)0.8560.339Accepted
C38(0.350)0.8500.337Accepted
C39(0.169)0.6690.292Accepted
C40(0.375)0.8750.344Accepted
C410.0000.5000.250Unaccepted
C420.0000.5000.250Unaccepted
C430.0000.5000.250Unaccepted
C440.0000.5000.250Unaccepted
Threshold R0.289

References

  1. ICA. Indonesian Cement Sales. 2019. Available online: https://www.globalcement.com/news/itemlist/tag/Indonesian%20Cement%20Association (accessed on 24 May 2021).
  2. Antolín-López, R.; Delgado-Ceballos, J.; Montiel, I. Deconstructing corporate sustainability: A comparison of different stakeholder metrics. J. Clean. Prod. 2016, 136, 5–17. [Google Scholar] [CrossRef]
  3. Islam, M.S.; Tseng, M.-L.; Karia, N. Assessment of corporate culture in sustainability performance using a hierarchical framework and interdependence relations. J. Clean. Prod. 2019, 217, 676–690. [Google Scholar] [CrossRef]
  4. Pislaru, M.; Herghiligiu, I.V.; Robu, I.-B. Corporate sustainable performance assessment based on fuzzy logic. J. Clean. Prod. 2019, 223, 998–1013. [Google Scholar] [CrossRef]
  5. Tseng, M.-L.; Bui, T.-D.; Lan, S.; Lim, M.K.; Mashud, A.H.M. Smart product service system hierarchical model in banking industry under uncertainties. Int. J. Prod. Econ. 2021, 240, 108244. [Google Scholar] [CrossRef]
  6. Tseng, M.-L.; Tran, T.P.T.; Ha, H.M.; Bui, T.-D.; Lim, M.K. Sustainable industrial and operation engineering trends and challenges Toward Industry 4.0: A data driven analysis. J. Ind. Prod. Eng. 2021, 38, 676–690. [Google Scholar] [CrossRef]
  7. von Buchwaldt, A. Four Challenges to Achieving Sustainability Industry in the Cement Industry. Available online: https://www.ey.com/en_ca/strategy/strategic-leaps-in-cement-production (accessed on 20 May 2021).
  8. Tseng, M.-L.; Wu, K.-J.; Ma, L.; Kuo, T.C.; Sai, F. A hierarchical framework for assessing corporate sustainability performance using a hybrid fuzzy synthetic method-DEMATEL. Technol. Forecast. Soc. Chang. 2019, 144, 524–533. [Google Scholar] [CrossRef]
  9. Xia, L.; Wei, J.; Gao, S.; Ma, B. Promoting corporate sustainability through sustainable resource management: A hybrid decision-making approach incorporating social media data. Environ. Impact Assess. Rev. 2020, 85, 106459. [Google Scholar] [CrossRef]
  10. IISD. Cement Industry Initiative Releases Technology Roadmap. Available online: https://sdg.iisd.org/news/cement-industry-initiative-releases-technology-roadmap-to-cut-co2-emissions-24-by-2050/ (accessed on 24 May 2021).
  11. Jiang, Y.; Xue, X.; Xue, W. Proactive corporate environmental responsibility and financial performance: Evidence from Chinese energy enterprises. Sustainability 2018, 10, 964. [Google Scholar] [CrossRef] [Green Version]
  12. Aras, G.; Tezcan, N.; Furtuna, O.K. Multidimensional comprehensive corporate sustainability performance evaluation model: Evidence from an emerging market banking sector. J. Clean. Prod. 2018, 185, 600–609. [Google Scholar] [CrossRef]
  13. Bhupendra, V.K.; Sangle, S. Strategy to derive benefits of radical cleaner production, products and technologies: A study of Indian firms. J. Clean. Prod. 2016, 126, 236–247. [Google Scholar] [CrossRef]
  14. Fu, Y.; Kok, R.A.W.; Dankbaar, B.; Ligthart, P.E.M.; van Riel, A.C.R. Factors affecting sustainable process technology adoption: A systematic literature review. J. Clean. Prod. 2018, 205, 226–251. [Google Scholar] [CrossRef]
  15. Díaz-Chao, Á.; Ficapal-Cusí, P.; Torrent-Sellens, J. Environmental assets, industry 4.0 technologies and firm performance in Spain: A dynamic capabilities path to reward sustainability. J. Clean. Prod. 2021, 281, 125264. [Google Scholar] [CrossRef]
  16. Chatzitheodorou, K.; Tsalis, T.A.; Tsagarakis, K.P.; Evangelos, G.; Ioannis, N. A new practical methodology for the banking sector to assess corporate sustainability risks with an application in the energy sector. Sustain. Prod. Consum. 2021, 27, 1473–1487. [Google Scholar] [CrossRef]
  17. Baah, C.; Agyabeng-Mensah, Y.; Afum, E.; Mncwango, M.S. Do green legitimacy and regulatory stakeholder demands stimulate corporate social and environmental responsibilities, environmental and financial performance? Evidence from an emerging economy. Manag. Environ. Qual. Int. J. 2021, 32, 787–803. [Google Scholar] [CrossRef]
  18. Tseng, M.-L.; Wu, K.-J.; Chiu, A.S.F.; Lim, M.K.; Tan, K. Service innovation in sustainable product service systems: Improving performance under linguistic preferences. Int. J. Prod. Econ. 2018, 203, 414–425. [Google Scholar] [CrossRef]
  19. Jain, N.; Singh, A.R. Sustainable supplier selection under must-be criteria through Fuzzy inference system. J. Clean. Prod. 2020, 248, 119275. [Google Scholar] [CrossRef]
  20. Ilbahar, E.; Cebi, S. Classification of design parameters for E-commerce websites: A novel fuzzy Kano approach. Telemat. Inform. 2017, 34, 1814–1825. [Google Scholar] [CrossRef]
  21. Shokouhyar, S.; Shokoohyar, S.; Safari, S. Research on the influence of after-sales service quality factors on customer satisfaction. J. Retail. Consum. Serv. 2020, 56, 102139. [Google Scholar] [CrossRef]
  22. Lozano, R.; Huisingh, D. Inter-linking issues and dimensions in sustainability reporting. J. Clean. Prod. 2011, 19, 99–107. [Google Scholar] [CrossRef]
  23. Maletic, M.; Maletic, D.; Dahlgaard, J.; Dahlgaard-Park, S.M.; Gomišcek, B. Do corporate sustainability practices enhance organizational economic performance? Int. J. Qual. Serv. Sci. 2015, 7, 184–200. [Google Scholar]
  24. Rauter, R.; Jonker, J.; Baumgartner, R.J. Going one’s own way: Drivers in developing business models for sustainability. J. Clean. Prod. 2017, 140, 144–154. [Google Scholar] [CrossRef]
  25. Artiach, T.; Lee, D.; Nelson, D.; Walker, J. The determinants of corporate sustainability performance. Account. Financ. 2010, 50, 31–51. [Google Scholar] [CrossRef]
  26. Gianni, M.; Gotzamani, K.; Tsiotras, G. Multiple perspectives on integrated management systems and corporate sustainability performance. J. Clean. Prod. 2017, 168, 1297–1311. [Google Scholar] [CrossRef]
  27. Elkington, J. Partnerships from cannibals with forks: The triple bottom line of 21st-century business. Environ. Qual. Manag. 1998, 8, 37–51. [Google Scholar] [CrossRef]
  28. Vildåsen, S.S.; Keitsch, M.; Fet, A.M. Clarifying the Epistemology of Corporate Sustainability. Ecol. Econ. 2017, 138, 40–46. [Google Scholar] [CrossRef]
  29. Wu, K.-J.; Zhu, Y.; Chen, Q.; Tseng, M.-L. Building sustainable tourism hierarchical framework: Coordinated triple bottom line approach in linguistic preferences. J. Clean. Prod. 2019, 229, 157–168. [Google Scholar] [CrossRef]
  30. Wu, K.-J.; Zhu, Y.; Tseng, M.-L.; Lim, M.K.; Xue, B. Developing a hierarchical structure of the co-benefits of the triple bottom line under uncertainty. J. Clean. Prod. 2018, 195, 908–918. [Google Scholar] [CrossRef]
  31. Wise, N. Outlining triple bottom line contexts in urban tourism regeneration. Cities 2016, 53, 30–34. [Google Scholar] [CrossRef]
  32. Bolis, I.; Morioka, S.N.; Sznelwar, L.I. When sustainable development risks losing its meaning. Delimiting the concept with a comprehensive literature review and a conceptual model. J. Clean. Prod. 2014, 83, 7–20. [Google Scholar] [CrossRef]
  33. Severo, E.A.; de Guimarães, J.C.F.; Dorion, E.C.H. Cleaner production and environmental management as sustainable product innovation antecedents: A survey in Brazilian industries. J. Clean. Prod. 2017, 142, 87–97. [Google Scholar] [CrossRef]
  34. Ozusaglam, S.; Kesidou, E.; Wong, C.Y. Performance effects of complementarity between environmental management systems and environmental technologies. Int. J. Prod. Econ. 2018, 197, 112–122. [Google Scholar] [CrossRef]
  35. Babl, C.; Schiereck, D.; von Flotow, P. Clean technologies in German economic literature: A bibliometric analysis. Rev. Manag. Sci. 2014, 8, 63–88. [Google Scholar] [CrossRef]
  36. Maisiri, W.; van Dyk, L.; Coeztee, R. Factors that Inhibit Sustainable Adoption of Industry 4.0 in the South African Manufacturing Industry. Sustainability 2021, 13, 1013. [Google Scholar] [CrossRef]
  37. Qi, G.; Jia, Y.; Zou, H. Is institutional pressure the mother of green innovation? Examining the moderating effect of absorptive capacity. J. Clean. Prod. 2021, 278, 123957. [Google Scholar] [CrossRef]
  38. Baah, C.; Jin, Z.; Tang, L. Organizational and regulatory stakeholder pressures friends or foes to green logistics practices and financial performance: Investigating corporate reputation as a missing link. J. Clean. Prod. 2020, 247, 119125. [Google Scholar] [CrossRef]
  39. Huang, Y.-C.; Ding, H.-B.; Kao, M.-R. Salient stakeholder voices: Family business and green innovation adoption. J. Manag. Organ. 2009, 15, 309–326. [Google Scholar] [CrossRef]
  40. Shubham, P.C.; Murty, L.S. Organizational adoption of sustainable manufacturing practices in India: Integrating institutional theory and corporate environmental responsibility. Int. J. Sustain. Dev. World Ecol. 2018, 25, 23–34. [Google Scholar] [CrossRef]
  41. Acquah, I.S.K.; Essel, D.; Baah, C.; Agyabeng-Mensah, Y.; Afum, E. Investigating the efficacy of isomorphic pressures on the adoption of green manufacturing practices and its influence on organizational legitimacy and financial performance. J. Manuf. Technol. Manag. 2021, 32, 1399–1420. [Google Scholar] [CrossRef]
  42. Bui, T.-D.; Tsai, F.M.; Tseng, M.-L.; Wu, K.-J.; Chiu, A.S.F. Effective municipal solid waste management capability under uncertainty in Vietnam: Utilizing economic efficiency and technology to foster social mobilization and environmental integrity. J. Clean. Prod. 2020, 259, 120981. [Google Scholar] [CrossRef]
  43. Wijethilake, C. Proactive sustainability strategy and corporate sustainability performance: The mediating effect of sustainability control systems. J. Environ. Manag. 2017, 196, 569–582. [Google Scholar] [CrossRef]
  44. Baumgartner, R.J.; Ebner, D. Corporate sustainability strategies: Sustainability profiles and maturity levels. Sustain. Dev. 2010, 18, 76–89. [Google Scholar] [CrossRef]
  45. Kim, Y.J.; Kim, W.G.; Choi, H.-M.; Phetvaroon, K. The effect of green human resource management on hotel employees’ eco-friendly behavior and environmental performance. Int. J. Hosp. Manag. 2019, 76, 83–93. [Google Scholar] [CrossRef]
  46. Bui, N.T.; Kawamura, A.; Kim, K.W.; Prathumratana, L.; Kim, T.-H.; Yoon, S.-H.; Jang, M.; Amaguchi, H.; Du Bui, D.; Truong, N.T. Proposal of an indicator-based sustainability assessment framework for the mining sector of APEC economies. Resour. Policy 2017, 52, 405–417. [Google Scholar] [CrossRef]
  47. Zaid, A.A.; Jaaron, A.A.M.; Talib Bon, A. The impact of green human resource management and green supply chain management practices on sustainable performance: An empirical study. J. Clean. Prod. 2018, 204, 965–979. [Google Scholar] [CrossRef]
  48. Zhu, Q.; Geng, Y.; Lai, K.-h. Circular economy practices among Chinese manufacturers varying in environmental-oriented supply chain cooperation and the performance implications. J. Environ. Manag. 2010, 91, 1324–1331. [Google Scholar] [CrossRef]
  49. Alsawafi, A.; Lemke, F.; Yang, Y. The impacts of internal quality management relations on the triple bottom line: A dynamic capability perspective. Int. J. Prod. Econ. 2021, 232, 107927. [Google Scholar] [CrossRef]
  50. Longoni, A.; Cagliano, R. Sustainable Innovativeness and the Triple Bottom Line: The Role of Organizational Time Perspective. J. Bus. Ethics 2018, 151, 1097–1120. [Google Scholar] [CrossRef] [Green Version]
  51. Khan, E.A.; Quaddus, M. Examining the influence of business environment on socio-economic performance of informal microenterprises. Int. J. Sociol. Soc. Policy 2015, 35, 273–288. [Google Scholar] [CrossRef]
  52. Wagner, M. The link of environmental and economic performance: Drivers and limitations of sustainability integration. J. Bus. Res. 2015, 68, 1306–1317. [Google Scholar] [CrossRef]
  53. Pujari, D. Eco-innovation and new product development: Understanding the influences on market performance. Technovation 2006, 26, 76–85. [Google Scholar] [CrossRef]
  54. Montalvo, C. General wisdom concerning the factors affecting the adoption of cleaner technologies: A survey 1990–2007. J. Clean. Prod. 2008, 16, S7–S13. [Google Scholar] [CrossRef]
  55. Hart, S.L.; Milstein, M.B. Creating sustainable value. Acad. Manag. Perspect. 2003, 17, 56–67. [Google Scholar] [CrossRef]
  56. Chen, X.; Yi, N.; Zhang, L.; Li, D. Does institutional pressure foster corporate green innovation? Evidence from China’s top 100 companies. J. Clean. Prod. 2018, 188, 304–311. [Google Scholar] [CrossRef]
  57. Danso, A.; Adomako, S.; Lartey, T.; Amankwah-Amoah, J.; Owusu-Yirenkyi, D. Stakeholder integration, environmental sustainability orientation and financial performance. J. Bus. Res. 2020, 119, 652–662. [Google Scholar] [CrossRef]
  58. Zhao, X.; Zhao, Y.; Zeng, S.; Zhang, S. Corporate behavior and competitiveness: Impact of environmental regulation on Chinese firms. J. Clean. Prod. 2015, 86, 311–322. [Google Scholar] [CrossRef]
  59. Huang, X.-x.; Hu, Z.-p.; Liu, C.-s.; Yu, D.-j.; Yu, L.-f. The relationships between regulatory and customer pressure, green organizational responses, and green innovation performance. J. Clean. Prod. 2016, 112, 3423–3433. [Google Scholar] [CrossRef]
  60. Tate, W.L.; Dooley, K.J.; Ellram, L.M. Transaction cost and institutional drivers of supplier adoption of environmental practices. J. Bus. Logist. 2011, 32, 6–16. [Google Scholar] [CrossRef]
  61. Colwell, S.R.; Joshi, A.W. Corporate ecological responsiveness: Antecedent effects of institutional pressure and top manage-ment commitment and their impact on organizational performance. Bus. Strategy Environ. 2013, 22, 73–91. [Google Scholar] [CrossRef]
  62. Gardas, B.B.; Raut, R.D.; Narkhede, B. Modelling the challenges to sustainability in the textile and apparel (T&A) sector: A Delphi-DEMATEL approach. Sustain. Prod. Consum. 2018, 15, 96–108. [Google Scholar]
  63. Ishikawa, A.; Amagasa, M.; Shiga, T.; Tomizawa, G.; Tatsuta, R.; Mieno, H. The max-min Delphi method and fuzzy Delphi method via fuzzy integration. Fuzzy Sets Syst. 1993, 55, 241–253. [Google Scholar] [CrossRef]
  64. Mondal, C.; Giri, B.C. Investigating strategies of a green closed-loop supply chain for substitutable products under govern-ment subsidy. J. Ind. Prod. Eng. 2021. [Google Scholar] [CrossRef]
  65. Wang, C.-H. An intuitionistic fuzzy set-based hybrid approach to the innovative design evaluation mode for green products. Adv. Mech. Eng. 2016, 8, 1687814016642715. [Google Scholar] [CrossRef] [Green Version]
  66. Lin, K.-P.; Chang, H.-F.; Chen, T.-L.; Lu, Y.-M.; Wang, C.-H. Intuitionistic fuzzy C-regression by using least squares support vector regression. Expert Syst. Appl. 2016, 64, 296–304. [Google Scholar] [CrossRef]
  67. Wang, C.-H. Integrating a novel intuitive fuzzy method with quality function deployment for product design: Case study on touch panels. J. Intell. Fuzzy Syst. 2019, 37, 2819–2833. [Google Scholar] [CrossRef]
Figure 1. Kano Model.
Sustainability 13 14039 g001
Figure 2. Causal-and-effect diagram for aspects.
Sustainability 13 14039 g002
Table 1. Proposed Attributes.
PerspectivesAspectCriteriaReferences
Environmental impactResource Usage (A1)C1Decrease harmful material[23,43,44]
C2Waste as inputs
C3Renewable energy resources
C4Efficiency of raw material
Environmental pollution (A2)C5Total waste disposal[40,41,45]
C6Greenhouse gas emission
C7Noise pollution
C8Total closed/rehabilitated mining sites
C9Complaints
Social sustainabilityHuman resources development (A3)C10Employees’ satisfaction[3,21,22,23,39]
C11Gender diversity in workplace
C12Talent attraction and retention
C13Skill building orientation
C14Long-term employee benefits
C15Commitment to ethics
Community interest (A4)C16Socio-oriented mission statement[3,38,42]
C17Charity contribution
C18Employment opportunities
C19Beneficial relationships with the communities
C20Protected rights of local community
Economic GainFinancial performance (A5)C21Return on equity [8,23,41,44,46]
C22Return on investment
C23Profit growth
C24Total export earnings
C25Debt to asset ratio
C26Return on assets
Market performance (A6)C27Market share[23,44,47]
C28Sales growth
C29New market opportunities
Technical feasibilityTechnology adoption (A7)C30Recycling technology[13,14,54]
C31Firm’s readiness to adopt clean production process
C32Employee’s readiness to innovate
C33Training for future technology
Risk taking ability (A8)C34Top management risk taking ability[13,24,31,39]
C35Management perception about technology as differentiator in near future
C36Top management vision of future technology
C37Firm’s readiness to collaborate with high tech firms
Institutional ComplianceRegulatory Compliance (A9)C38Comply with legislation standard[34,54,61]
C39Obligation to comply with national regulation
C40Total number of penalties for non-compliance with laws/regulation
C41Government supervision
Association compliance (A10)C42Meet the industry association requirement[35,55]
C43Industry association encouragement
C44Industry association expectation
Table 2. Conversions table of linguistic phrases for FDM.
Phrases Used in Linguistics (Performance/Importance)Corresponding Triangular Fuzzy Numbers (TFNs)
Extreme(0.75, 1.0, 1.0)
Demonstrated(0.5, 0.75, 1.0)
Strong(0.25, 0.5, 0.75)
Medium(0, 0.25, 0.5)
Fair(0, 0, 0.25)
Table 3. TFNs linguistic parameter.
ParameterLinguistic VariableCorresponding Triangular Fuzzy Number (TFNs)
VLIVery low influence(0.0, 0.1, 0.3)
LLow influence(0.1, 0.3, 0.5)
MModerate influence(0.3, 0.5, 0.7)
HHigh influence(0.5, 0.7, 0.9)
VHIVery high influence(0.7, 0.9, 1.0)
Table 4. Kano model evaluation table.
Criteria iDysfunctional
LikeExpectNeutralAcceptDislike
FunctionalLike AAAO
ExpectRIIIM
NeutralRIIIM
AcceptRIIIM
DislikeRRRR
Table 5. Valid attribute set.
PerspectiveAspects Criteria
Environmental impactA1Resource UsageC1Decrease harmful material
C2Renewable energy resources
C4Efficiency of raw material
A2Environmental PollutionC5Total waste disposal
C6Greenhouse gas emission
C8Total closed/rehabilitated mining sites
C9Complaints
Social sustainabilityA4Community interestC16Socio-oriented mission statement
C17Charity contribution
C19Beneficial relationships with the comminates
C20Protected rights of local community
Economic gainA5Financial performanceC21Return on equity
C23Profit growth
Technical feasibilityA8Risk taking abilityC35Management perception about technology as differentiator in near future
C36Top management vision of future technology
C37Firm’s readiness to collaborate with high tech firms
Institutional complianceA9Regulatory complianceC38Comply with legislation standard
C39Obligation to comply with national regulation
C40Total number of penalties for non-compliance with laws/regulation
Table 6. Original direction matrix for aspects.
A1A2A4A5A8A9
A10.8400.6920.4330.6760.6510.599
A20.6220.9560.6080.5910.6930.625
A40.6950.6970.7010.6850.5170.665
A50.6290.7020.4440.8060.3850.490
A80.7900.7020.6070.6720.7350.618
A90.6860.7020.6300.6710.5930.723
Table 7. Total interrelationship matrix and cause-and-effect interrelationship among aspects.
A1A2A4A5A8A9αβ(α + β)(αβ)
A13.4343.5742.6733.2722.8782.95318.78320.56439.347(1.780)
A23.5723.8462.8743.4363.0523.13019.91021.69241.602(1.782)
A43.4523.6342.7853.3282.8893.01919.10816.37835.4862.729
A52.9933.1712.3682.9332.4832.58916.53719.79836.335(3.261)
A83.6223.7882.8773.4643.0673.13319.95017.31337.2632.637
A93.4923.6802.8023.3652.9443.07019.35217.89437.2461.457
Table 8. The fuzzy Kano model result.
CriteriaAOMIRAttributes
C1Decrease harmful material023410Must-be
C3Renewable energy resources1971410Attractive
C4Efficiency of raw material133400Must-be
C5Total waste disposal0102700Must-be
C6Greenhouse gas emission013700Must-be
C8Total closed/rehabilitated mining sites003720Must-be
C9Complaints133310Must-be
C16Socio-oriented mission statement6141840Must-be
C17Charity contribution2021510Attractive
C19Beneficial relationships with the communities1201510One-dimensional
C20Protected rights of local community3161350One-dimensional
C21Return on Equity0028100Must-be
C23Profit growth0113000Must-be
C35Management perception about technology as differentiator in near future20316100Attractive
C36Top management vision of future technology130600One-dimensional
C37Firm’s readiness to collaborate with high tech firms2031140Attractive
C38Comply with legislation standard8191730One-dimensional
C39Obligation to comply with national regulation3201830One-dimensional
C40Total number of penalties for non-compliance with laws/regulation0201700One-dimensional
Publisher’s Note: MDPI stays neutral with regard to jurisdictional claims in published maps and institutional affiliations.

