Article

The Third Sector: The “Other” Actors of Rural Development, Andalusia 2000–2015

by
Eugenio Cejudo-García
*,
Francisco Navarro-Valverde
,
José Antonio Cañete-Pérez
and
Noelia Ruiz-Moya
Departamento de Geografía Humana, Universidad de Granada, 18071 Granada, Spain
*
Author to whom correspondence should be addressed.
Sustainability 2021, 13(24), 13976; https://doi.org/10.3390/su132413976
Submission received: 6 November 2021 / Revised: 4 December 2021 / Accepted: 13 December 2021 / Published: 17 December 2021
(This article belongs to the Special Issue Sustainable Rural Development and Land Use Planning)

Abstract

:
Civil society plays an essential role in the development of our rural areas. In spite of this, little research has been conducted on the role of non-profit organizations, often referred to in general terms as the third sector, within the framework of the LEADER program for rural development, especially in such a large geographical area as Andalusia, the study area of this research. The diversity of the groups that make up the “Others” group of rural development stakeholders is one of its most important characteristics. Over the course of the study period (2000–2015), these organizations have played a very significant role in Andalusia in both quantitative and qualitative terms. In order to find out more about the diversity of third sector organizations and to quantify and evaluate their importance, we carried out a detailed analysis of all the LEADER projects commenced in Andalusia between 2000 and 2015. The quantitative and quantitative results obtained highlight the diversity of these projects and how widely their presence varied from one type of rural area to the next. Our research reopens the debate about the growing role played by non-profit organizations in developed societies at a global level and within LEADER in particular.

1. Introduction

The third sector is made up of a huge variety of private organizations ranging from civil society to the business sector, including associations, voluntary organizations, foundations, cooperatives, mutual organizations, social enterprises, etc. [1].
The third sector provides goods and services with a high degree of social content and its objectives include scientific research, education, care, and the protection of the dignity of vulnerable groups in society. It also makes a substantial contribution to the general economic system in a large number of capitalist countries [2].
According to Rose-Ackerman [3] (p. 701), a very large grey area is emerging in the organizational structures of contemporary capitalism, such that “analytic efforts that preserve sharp distinctions between the for-profit, non-profit, and public sectors look increasingly problematic”. Non-profit organizations have developed a network of interorganizational relations that, together, form an innovative sector of the economy with a high degree of social activism. According to Lam [4] (p. 179), the non-profit sector coexists alongside the public and private sectors, and often fills the gaps left by both government and market failures.
The third sector is playing a key role in the development of rural areas due to a range of factors, such as the need to provide non-profit or indirect profit services; the reduction and control of public goods due to neoliberal tendencies [5]; the limited reach of the welfare state in marginal rural areas; and the need to enhance the integration, participation, and governance of certain collectives. Third sector providers can help address these issues by offering stable, enduring social and public services [6].
Above all, the third sector is a very heterogeneous group that carries out actions and functions that are not covered by either the public or the private sector. In this research, we analyze the role played by the third sector in LEADER projects, in which associations, cooperatives, foundations, etc., are normally grouped together in a category known simply as “Others”. Our contribution is new to the extent that it identifies, quantifies, and locates these actors on the basis of the number of projects and the investment they make. In addition, it does so for a large region with a large population, Andalusia, and for the last two programing periods for which information is available. This quantitative vision is complemented by other qualitative information in relation to the varied types of projects they carry out.
Our initial hypothesis is that the “Others”, a little-known or acknowledged group of actors in rural development, play a vital role thanks to the heterogenous nature of this group and of their projects in such vast rural areas as those in the Andalusia region. We intend to answer three key questions: (i) How important is this group in terms of the number of projects and the amounts invested? (ii) What kinds of project does each type of association carry out? (iii) How is investment distributed geographically across the different types of rural areas?
This work begins with a section stating its objectives, followed by the state of art on the topic in question, and the relevance of the third sector in rural development, which has been previously studied. After this, we describe the sources, methodology, and study area, in which the object of study, the sources used, and the different types of established rural areas are specified and defined. Subsequently, the results are offered regarding the relevance of the associations in the number of projects finally implemented and those that were not formalized (failed). The projects are also characterized by types of association and activity carried out. The spatial distribution of these projects and the investment made are also addressed in another section. Finally, the work closes with a discussion and conclusions, in which questions regarding the work of these associations are raised based on the actions they carry out, their importance for rural development, the strengthening of social capital, as well as their different presence in the function of the greater or lesser rurality of the territories.
Theoretical frameworks, neo-endogenous development theories, approaches, policies, and practices emphasize a more holistic, systemic, and place-based “vitality policy”, which includes softer development values relating to attractive living environments, communality, and the well-being of residents. These involve several policy sectors and a network (system) of organizations from the public, private, and third sectors [7] (p. 706). In this way, third sector organizations, and their activists, play an important role in helping to boost the participation of local people in rural development processes [8,9]. For Shucksmith [10] and Ray [11], the third sector can mobilize the use of endogenous knowledge and resources, while Steiner and Teasdale [12] argue that the challenges that rural society faces can be transformed into opportunities for social enterprise and community development.
The LEADER Initiative (Liaisons entre Actions de Développement de L’Economie Rural) was launched in 1991 as part of the EU’s rural development policy and it is an area-based, integrated, bottom-up approach for delivering rural development [13]. To receive LEADER funds, local authorities must form public–private partnerships (Local Action Groups, LAGs) with private companies and third sector organizations. In this way, the LEADER program has helped to mobilize the third sector and to involve it in decision-making [14] and project implementation. By involving social organizations in the LEADER Local Action Groups and projects, fairer spatial distribution can also be obtained [15].
The role played by the amalgam of actors that make up social organizations as creators of networks, innovation, and social capital is demonstrated in detailed studies with a qualitative approach. These studies also highlight how the third sector meets a series of social and cultural needs for rural communities. Some authors, such as Steiner at al. [16], stress that the flexibility and lack of hierarchy in many third sector organizations facilitates the creation of social innovations. In research conducted in Ireland, Olmedo et al. [17] emphasize the importance of these organizations as “social enterprises” that link social innovation with neo-endogenous rural development and enhance the value of the identity aspects of rural areas. In a study conducted in Austria, Richter [18] found that “social enterprises mobilize ideas, resources and support from external sources not primarily for their own benefit but for that of their rural region”. Finally, Vercher et al. [19] (p. 181) argued, regarding work on Spain and Scotland, that “academia, third sector organizations (…) can play a role in this vacuum by identifying and providing concepts and ideas absent in the narratives of social innovation”.
In research conducted in Polish rural areas, Furmankiewicz et al. [14] noted that, although the involvement of third sector organizations in LAGs had a positive impact on the extent of civil engagement in local development strategy building, it was necessary to increase the presence and support for the third sector in specific rural development projects. Growing awareness of bureaucratic procedures coupled with limited access to funding resulted in disillusionment [14] (p. 233). This author also cites other discouraging factors, such as a lack of time, experience, and resources to engage in time-consuming partnership activities, the apathy of their leaders, and weak legitimacy [20]. Another essential aspect, looking beyond a purely economic dimension, is to assess the contribution made by the third sector to local communities and how this is related to territorial governance. Two fundamental questions must be addressed. Firstly, self-government is a formula for internal management and the participation of civil society in these projects either through volunteering or through financial support. Although it would seem to be growing, the participation of local citizens in collective projects is all too often more formal than real, and certain social groups, such as women, youths, immigrants, or farmers, are marginalized, while economic and political elites continue to occupy positions of power and control [20,21]. The second question is related to the governance of common goods, which, as Ostrom [22,23] demonstrated in the case of environmental goods, can be managed efficiently through the user community. Community self-management has successfully offset the prevailing neoliberal logic in crisis situations and rural environments [24], with the support of collective agreements that enable the local community to participate in and control the processes that give rise to social innovation, which can turn the enormous diversity of rural areas into strengths [25]. The implementation of swift, effective, and accessible procedures for the resolution of the conflicts that may arise within local groups is another important issue. From this point of view, new approaches to development necessarily require a thorough theoretical review based on the identification and value of concrete practical experiences that can serve as a reference [26]. The contributions of our research in the international scientific context are related, firstly, with a few studies that analyze the role played by the third sector in the LEADER approach, especially at the local scale. The Andalusian region is a vast region that is bigger in terms of area and population than other European countries and, working at municipality scale, we obtained a more detailed level inside the administrative project. Secondly, as geographers, we explore the territorial dimension of LEADER action and the role played by the third sector in the different types of rural areas. It supposes a relevant methodological contribution in this type of analysis. The results and conclusions obtained are relevant in this regard and support the methodological proposal. Thirdly, our comparative analysis of two successive, but quite distinct (boom and crisis) programing periods aims to show whether the other actors, the third sector, in rural development acted differently according to the particular economic context in terms of where and in what they invested. Fourthly, we analyzed the projects that were ultimately not implemented, a question which, at least to our knowledge, had never been studied within research on LEADER.

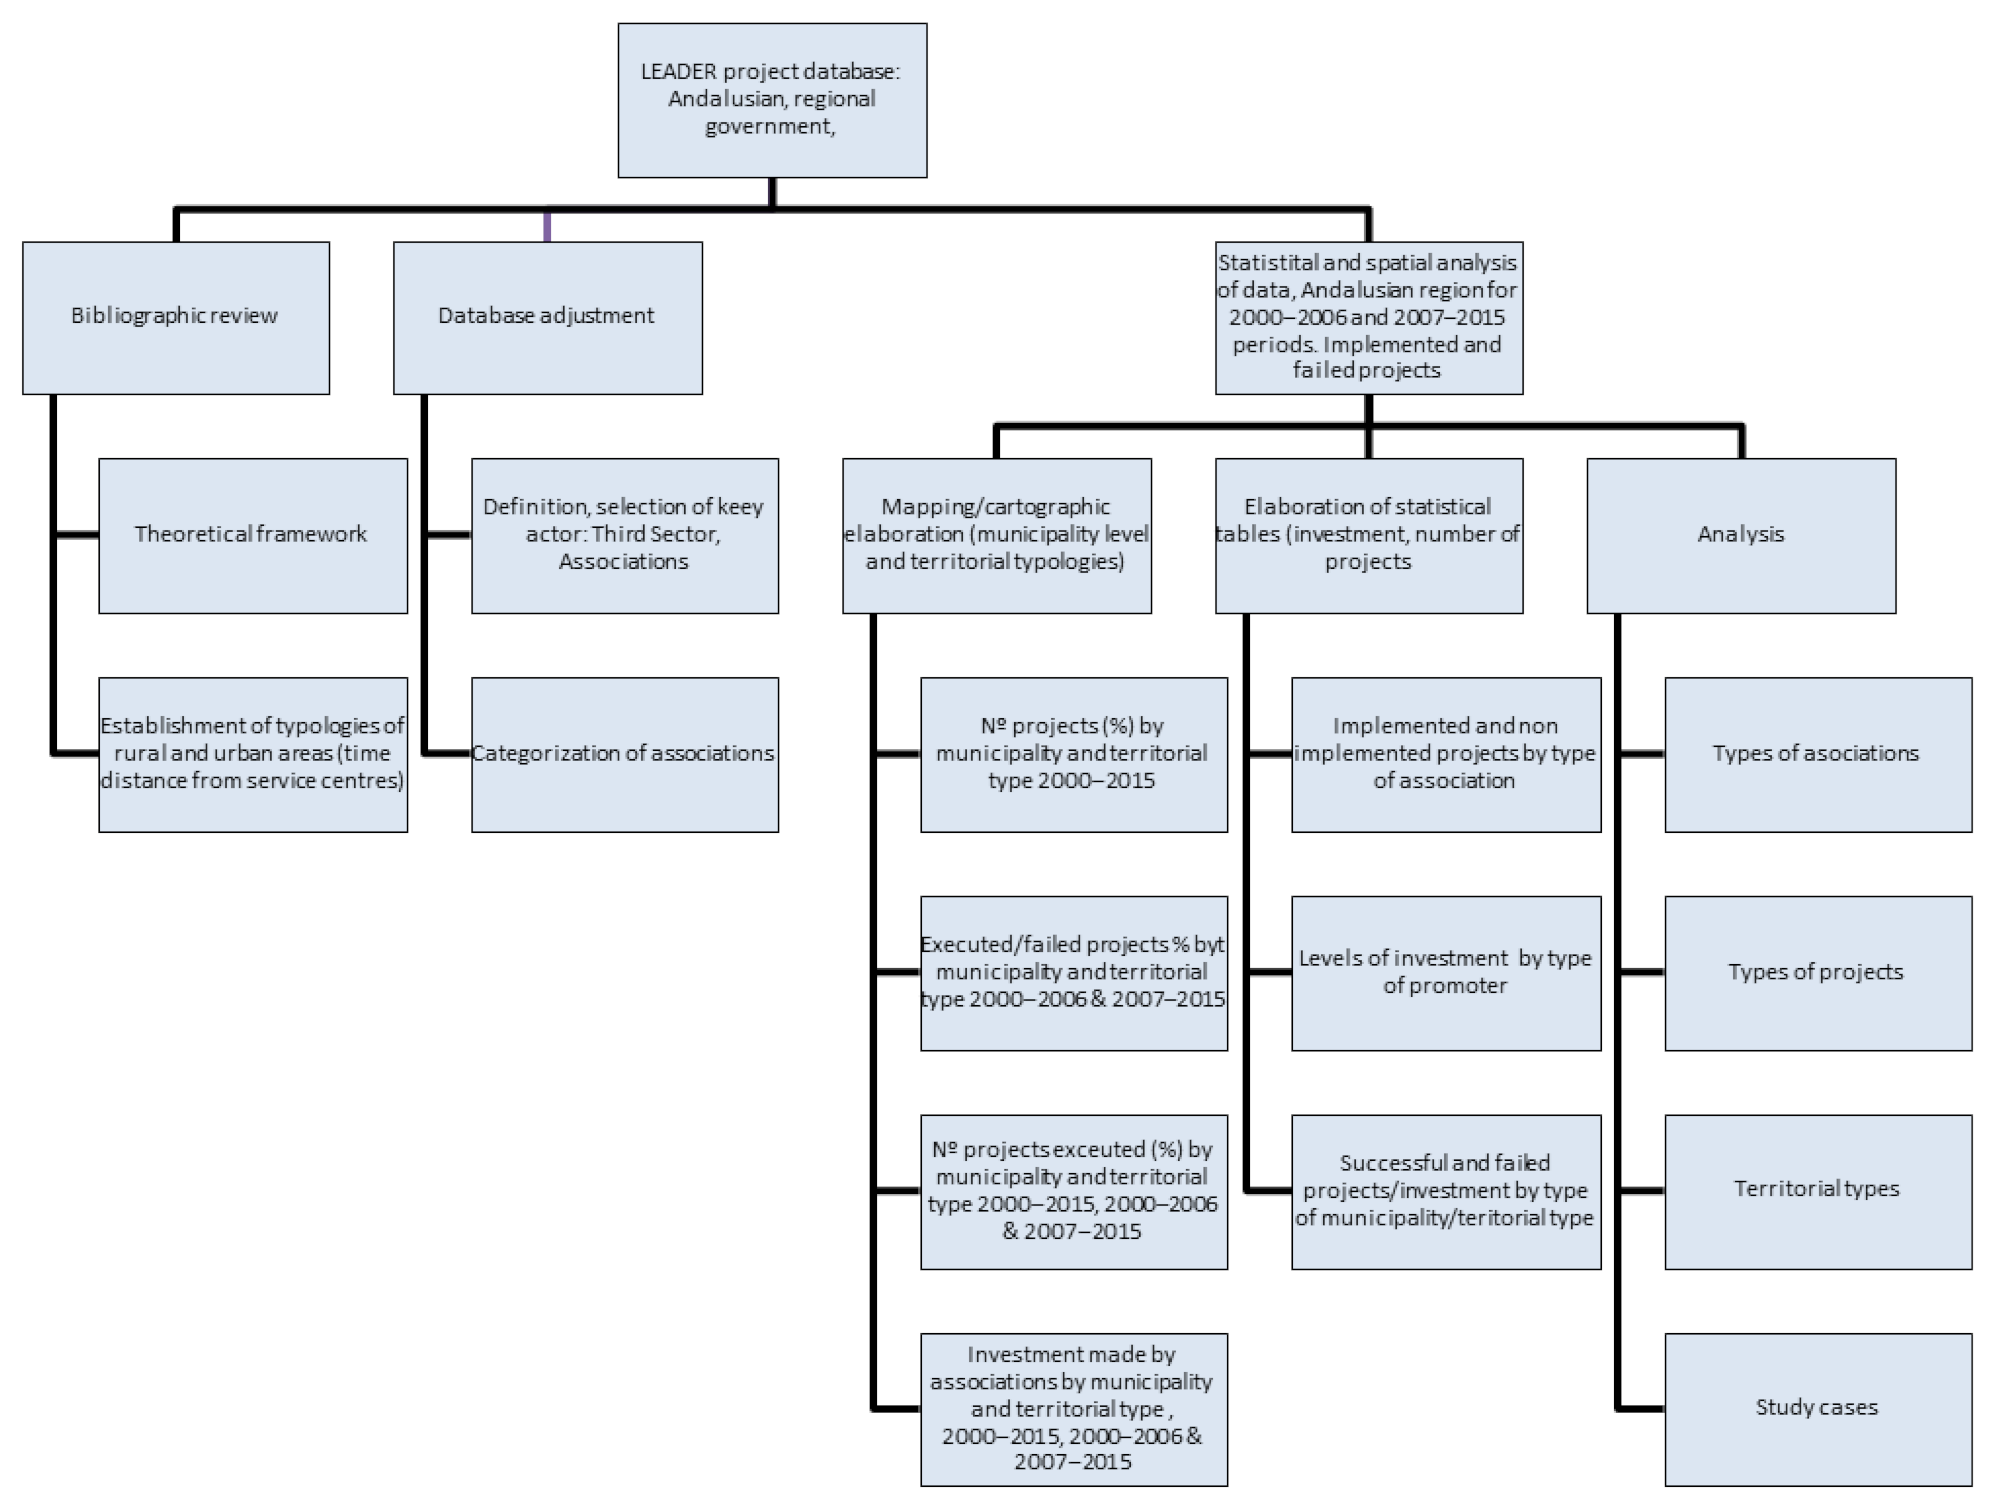
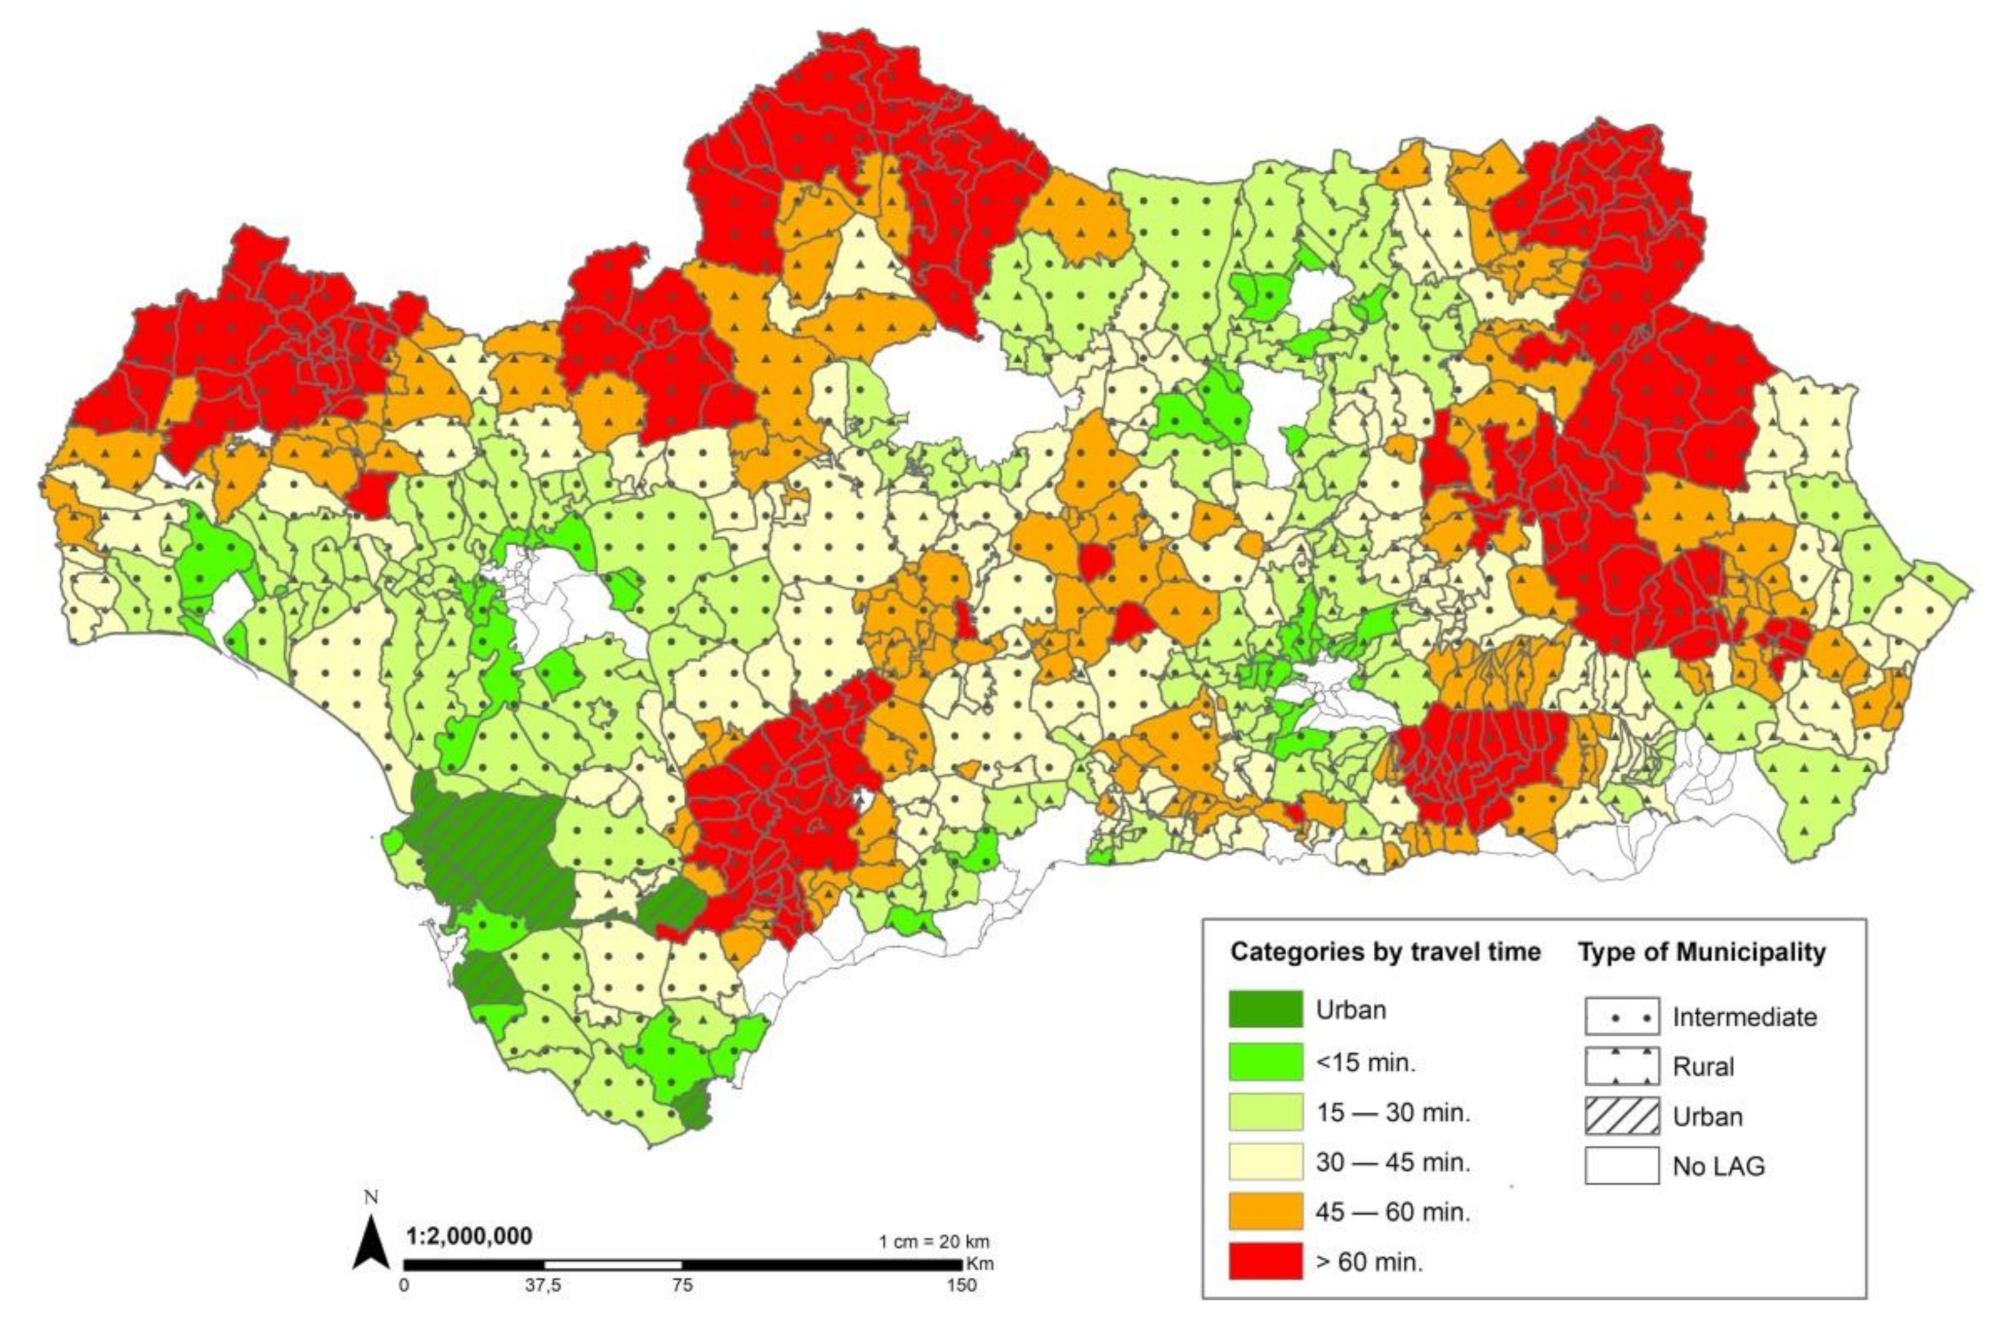
2. Sources, Methodology, and Study Area

In our study of the LEADER projects carried out by the third sector, we decided to prioritize the amounts of capital invested by this group and their spatial distribution, a form of analysis that could be classified within “impact evaluation in impact investing” [27] (Figure 1).
Our basic source of information was the list of the LEADER projects processed in Andalusia during the programing periods of 2000–2006 and 2007–2015. This list was provided by the Ministry of Agriculture, Fishing, and Rural Development of the Regional Government of Andalusia. A total of 9502 administrative files were consulted from the first period and 12,855 from the second, making a total of 22,357 over the whole study period of 2000–2015.
The “Others” classification within the promoters of LEADER rural development projects refers to those belonging to “civil society” or the “third sector” who, in most cases, are legally incorporated as foundations or non-profit making associations (including the Local Action Groups, LAGs), among others. All too often, due to their relatively small numbers, especially in terms of investment, these promoters are grouped together under the umbrella category of “Others”.
As a result, we know very little regarding, among others, the identification, typology, and objectives of this group of stakeholders in the development of our country towns and villages.
Each file contains the name of the promoter and their administrative code. This enables us to identify and classify them on the basis of the object and purpose of their respective projects. A total of 10 main types were identified (Table 1). We decided to exclude the LAGs from our analysis, as we were particularly interested in finding out more about the “other” promoters, who have largely been “forgotten” in research on the LEADER program.
Of the 22,357 files consulted, we identified a total of 2153 projects initiated by associations of these kinds, 919 in the first programing period and 1234 in the second. The variables we worked with include the number of projects, executed or not executed, the investment made, and the grant received by each project, over the study period of 2000–2015. These variables were also analyzed according to the different types of territory. The analysis was conducted at a municipal scale and we excluded those projects in which the name of the town in which it was to be implemented was not clearly stipulated in the project information. This reduced the number of projects to 1508, of which 677 were for the first programing period and 831 for the second. The results obtained from the statistical analysis are presented in an aggregated way for Andalusia as a whole, according to the promoter and type of territory. The maps used in this research are exports in jpg format of vectorial planes obtained from the ARCGIS 10.6. Geographical Information System.
The availability and reliability of the sources, the scale used, or the variables and the thresholds set to differentiate them were determining factors in the establishment of terrestrial typologies in both Spain and its neighboring countries. In Spain, the most commonly used method for distinguishing between different types of urban and rural areas is that established by the National Institute of Statistics (INE) based on total population. The European Union, in line with previous guidelines established by the OECD [28], established three large territorial categories (predominantly rural, intermediate, and predominantly urban) in which rural municipalities were distinguished from urban ones on the basis of a population density of less than 100 inhabitants/km². In Spain, at a local level, several very interesting proposals have been recently made regarding this issue. Molinero [29] established three categories within rural areas based on their population density: deep rural <5 inhabitants/km², stagnant 5–<25, and dynamic 25–<100 inhabitants/km². Cos and Reques [30] used geo-referenced sources and multi-criteria analysis to calculate the demographic and territorial vulnerability of Spanish municipalities, identifying nine categories according to their particular degree of vulnerability. Finally, in addition to population density calculated using a 1 km² mesh as the unit of territorial analysis, Reig, Goerlicht, and Cantarino [31] incorporated two other variables into their analysis, namely the accessibility to centers of economic activity and dynamism (in line with research by Brezzi et al. [32] for the EU), and land uses and covers. They used the accessibility variable to divide rural municipalities into different categories, while intermediate and urban municipalities were distinguished on the basis of their respective land uses and covers.
Our proposal is based on a modified version of the classification system proposed by Reig et al. [31]. Bearing in mind that our study focused above all on LEADER municipalities in which there are very few urban spaces, we combined the two categories of urban municipality, i.e., open and closed, into one. We also decided to classify the remaining municipalities according to their time distance to places in which services are provided. On this basis, the following timescale was established: <15 min, 15 < 30, 30 < 45, 45 < 60, and ≥60, differentiating in each of these categories between rural and intermediate municipalities (Figure 2). This is because we believe that the distance to economic and service centers is an essential variable when it comes to explaining the implementation of LEADER projects.
Table 2 presents various sociodemographic indicators according to typologies referring to 2011, a census year within the study period.
In 2011, 6% of the total area of Andalusia was classified as urban, and this was home to 49.5% of the inhabitants with an average population density of 709 inhabitants/km². In our research, these towns and cities are either a reference point for the calculation of time distances or are located in metropolitan areas at very short distances (around 4 min) from major cities. These urban areas are the most dynamic areas as can be seen by their constant growth since at least the 1960s, which has resulted in an increase in population of over 2 million people. Their population has similar levels of ageing to the regional average and higher than that in periurban areas nearby. They are the flattest areas in the region and those in which agriculture plays the smallest part.
Types 2 and 3, with average time-distances of 11 and 23 min respectively, are those in which the journey to a service center takes less than 30 min. These could be classified as “near” and behave in quite similar ways. There has also been a sharp rise in population in Types 2 and 3 (added together) since the 1960s of almost 830,000 people. They have a lower ageing index, especially in Type 2, which has an index of 65 compared to 90 in the urban areas. These are generally flat areas with average altitudes of 360 meters in which agriculture plays a slightly more important role than in the cities, although much lower, especially in Type 2, than in the other four types.
Types 4, 5, and 6 also share certain similarities, especially the last two, in which the following indicators show sharply increasing values: firstly, the constant loss of population since the 1960s that together amounts to about 500,000 inhabitants, of which over half were lost in Type 6 municipalities; secondly, the severe ageing of their populations as demonstrated by the fact that the ageing index in Type 4 is 110, while in Type 6 it is much higher, at 155; thirdly, the increasing importance of agriculture in their production systems, in which well over 40% of all those affiliated to the social security system are employed in agriculture; fourthly, the average altitude, which also increases sharply from almost 500 meters in Type 4 to 713 in Type 6; and, finally and most basically, the fact that they are the furthest away from service centers in terms of time distances, which range from 38 min in Type 4 municipalities to 73 min in Type 6.
There is one question that we should clarify. The non-urban categories (all except Type 1) include both rural and intermediate municipalities, a fact that must necessarily be taken into account in the analysis of the data. However, we believe that easy access to economic and service hubs and to public facilities is a key aspect of territorial dynamization and of the fight against depopulation, an assertion that is confirmed by the fact that even municipalities classified as intermediate are losing population in the remote regions (5 and 6) [33], while the opposite is occurring in in those nearest to cities (Types 2, 3, and 4) even when classified as rural.

3. Results

3.1. The Projects Carried Out by “Others”

3.1.1. Number of Projects and Their Level of Implementation

A total of 2153 projects were proposed by these promoters between 2000 and 2015. Of these, 1357 were executed, while 796 were not, making an overall success ratio of 1.7 (Table 3). If we observe the two periods, there was a much higher number of projects in the second period than in the first, with 1234 compared to 919 and with success ratios of 9.7 and 0.7, respectively. In the first period, these success ratio values were higher than the average for all promoters (9.7 compared to 6.4), while in the second they were lower (0.7 compared to 1.07) [34,35]. Of the failed projects, just 10.8% were presented in the first period (2000–2006), while 89.2% were presented in the second (2007–2015). These striking differences can be explained in part by the fact that, in the first programing period, the only projects classified as “not implemented” were those that were abandoned at an advanced stage of the bureaucratic process, after the promise to execute the project had been signed, while in the second period they counted all the projects that were not implemented, regardless of the stage of the bureaucratic process at which they happened to be.
Over the entire study period (2000–2015), the most important types of promoters (those with over 10% of the total number of projects) were business associations with 29.6% of all the projects and a success level of 1.5; cultural associations with 14.1% of the projects and a success ratio of 1.6; trade union associations with 11.5% and a significantly lower success ratio of 1.3; and religious associations with 10% of the projects and one of the highest success ratios in the “Others” group, i.e., 3.0. Other types of associations that did not reach the 10% benchmark include associations working with vulnerable groups, with 9.9% of the total and a success ratio of 2.2%, and women’s associations with 7.3% of the projects and a success ratio that was similar to the regional average.
Can any differences be observed between the results for each of the two programing periods compared to those for the study period as a whole? In terms of the promoters, results were very similar, as can be seen by the fact that the business associations and the cultural associations accounted for 50% of the projects in each of the two periods. However, differences can be observed, for example, in the case of trade union associations, which accounted for 8% of the projects started in the first period and 14% in the second. Religious associations, by contrast, played a more important role in the first period than in the second, with shares of 11.8% and 8.8%, respectively. The success ratios in the four categories referred to so far also followed a common trend in the two periods in that, while business and the cultural associations scored similar ratios to the average for each period (bearing in mind the methodological impossibility of comparing this figure between the two periods), religious and trade union organizations both had above average success ratios, especially in the first period. Women’s associations also showed a similar trend in the two periods in that their projects accounted for just over 7% of the total, and achieved similar success ratio values to the average success ratio value for each period.
Lastly, it is important to highlight the very marginal role, in numerical terms, played by other associations, which account for between 1 and 3%. A particularly striking case is that of youth associations with just 1% of the projects initiated over the whole study period, a figure that was even lower for the first period 2000–2006 at just 0.5% and slightly higher in 2007–2015 at 1.3%, albeit with very high success ratios. The same can also be said of educational institutions, which include universities, with values of just over 2% of the total in each of the two periods considered.

3.1.2. Investment

The other two variables that demonstrate the significant role played by these promoters are the amounts of capital invested and the grants received (Table 4).
The overall investment made by members of the “Others” category over the whole study period (2000–2015) came to €83.6 million, of which 43.9 million came in the form of government grants (52.6% of the total invested). The investment made in the first period 2000–2006 was much higher than in the second period, with €54 million compared to €29.6 million, respectively. This high level of investment could also be seen in the average investment per project, which was much higher, at €64,803 compared to €56,447. In the first period, investment also involved greater risk on the part of the investors, in that the government grant accounted for 50% of total investment while in the second period it accounted for 57%. It is also important to be aware that, in both of the analyzed periods, these average values for grants as a percentage of total investment were much higher than the average for all promoters, which was 37.5% in the first period and 40.7% in the second [36,37].
The breakdown of the investment between the different actors shows that it was the associations and foundations linked to the care and attention of vulnerable social groups that made the greatest investment, with 31.1% of the total; this value was practically identical for the two periods (2000–2006 and 2007–2015). This represents the average investment per project of almost €150,000 for the whole analyzed period, and an average of over €180,000 per project for the period 2000–2006. The other two important promoters as far as investment is concerned were business and religious associations, with over 18% each. Although in the case of religious associations this percentage is higher than the percentage for the number of projects, it is much lower in the case of business associations. However, while in the former the investment they made accounted for 21% of total investment in the first period (€11.4 million) and fell to 13.3% in the second (€4 million), the opposite trend was observed in business associations, whose investment increased from 15.2% to 24.1% in the second period, even though their total investment was lower, €1 million lower to be precise. Another important difference between these two kinds of association is that the average investment per project in the case of business associations was €40,000, while for the religious associations it was €95,000 and increased to almost €120,000 in 2007–2015. The fourth main player, albeit with considerably lower figures, were cultural associations and foundations, with 8.4% of investment over the whole study period, although their maximum share of investment was in the first period with 9.8% and €5.3 million compared to 5.8% and €1.7 million in 2007–2015. Their average investment per project was around €40,000. It is important to remember that, while for the business and cultural associations the government grants amounted to almost 70% of the investment made over the whole study period (2000–2015), this percentage fell to 33.9% for those attending to vulnerable groups and to 50% in the case of religious associations. The differences observed are probably due to the type of projects carried out by these different groups.
In short, during the period of economic crisis, both the associations that provide services to vulnerable groups and the religious associations strengthened their dominant position within the “Others” group by contributing 51.7% of the investments compared to 43.8% in the previous period. In the case of the religious associations, their levels of investment were quite similar to those in the economic boom period. The opposite trend was observed in business and cultural associations.
Other actors that played quite an important role in terms of the number of projects had a less significant role in terms of investment. One example was the trade union associations, which accounted for 5% of investment for the whole study period, a figure that increased to 7.5% over the period 2007–2015. The values for investment were half those for the number of projects executed and the average investment per project was about €30,000. A similar trend can be observed in women’s associations that initiated and executed over 7% of the projects, while accounting for just 2.1% of investment for the period from 2000 to 2015, with only slight variations between the two programming periods. This is due to the small average investment per project made by this group of almost €17,900, a figure that oscillates between €16,100 in the first period and €21,000 in the second, and these represent the lowest figures for all the different types of association. The other actors, such as youth associations, which were of little importance in terms of the number of projects were even less important in terms of investment. Only the educational institutions showed higher levels of investment (around 4%) compared to the number of projects (less than 3%).

3.2. What Type of Projects Did They Carry Out?

As mentioned earlier, one of the most important contributions made by this paper is to highlight the importance of these “Other” actors in rural development, most of whom belong to the third sector, and the wide variety of types of projects and of purposes at which they were aimed. In order to explore this aspect in greater depth, we will now analyze who made the investments and in what was invested, by looking at various specific projects.
Business associations. The business associations showed the greatest diversity in terms of the type of projects carried out, something to be expected given the sectorial nature of many of their projects. This is manifested by the fact that, together with more “general” associations, there were also others linked to different productive activities: commerce and transport, tourism, agriculture, and craftsmanship. There were also projects that sought to promote the development of certain areas.
As occurred in all the other categories, a considerable number of projects involved improving the facilities and refitting their main offices. As an example, in 2000–2006, the Martos Business Association applied for a project for the furnishing and equipping of their information and advice office for shopkeepers in the town of Martos (Jaén), with a total investment of €73,488, of which €60,000 came from government grants. We also found many projects involving the holding of conferences, meetings, among others, of an informative nature or training courses. In 2000–2006, the Pilas Businesspeople Association held their 4th Conference for Businesspeople in Pilas (Sevilla), which received LEADER funding of €2403 out of a total investment of €4716. Other projects centered on studies that sought to assess the situation of specific business sectors or territories. It was observed that, amongst the activities performed in the second programing period, there was an increase in those related with the stimulation of specific production activities aimed at increasing business in certain sectors, while there were fewer projects that sought to assess the current situation in a specific area or sector. Of these, those with tourism or agricultural profiles were the most common. Tourism-related projects included attendance and/or organization of tourism fairs, improving the quality of services, the use of ICT in bookings and the use of social networks, websites, etc. Thus, in 2000–2006, the Centre for Tourism Initiatives of the Vega del Guadalquivir set up a training programme to improve the quality of tourism services in the Medio Guadalquivir area in the province of Córdoba. This required an investment of €39,301 of which €31,440 was funded by grants. In the agricultural field, the most frequent projects were those linked to technical training in farm management, and those related to the quality of produce, its traceability, added value, and dynamization. In 2007–2015, the Baena Businesspeople Union carried out a project in Baena (Córdoba) to assess the potential for the development of olive groves and the industries for the transformation of olives via the application of new technologies for a total cost of €118,999, 99% of which came from government grants.
Women’s associations. In addition to fitting out and furnishing their premises, the vast majority of the projects organized by women’s associations were related to the holding of courses, meetings, and conferences on a variety of topics that ranged between “traditional” subjects, such as gastronomy and popular customs (folk dances, carols, embroidery, etc.), to others dealing with female entrepreneurship, new sources of employment, or balancing work and family obligations. As an example, in 2000–2006, the Los Tres Peñones Women’s Association organized the first general meeting of women’s associations in the Filabres-Alhamilla area, which was held in Lubrín (Almería). This project received a grant of €2164 out of a total investment of €2885. Also, In 2000–2006, the Rural Women and Families Federation (AMFAR)-Sevilla held a course in Huévar del Aljarafe (Sevilla) for beginners in the management of SMEs in the rural world with an investment of €7001 of which €3974 came from public funds. In the last programing period, we observed an increase in the number of projects linked with gender questions and the personal well-being and self-worth of women. Thus, in 2007–2015, the Almanzora Women for Equality Federation carried out a project in Purchena (Almería) for the management of natural resources, as a means of helping people in the Almanzora area enter the labour market. It received a grant of €17,468 out of a total of €19,424 invested.
Youth and neighborhood associations. In youth organizations, the most frequent types of projects were those associated with events or conferences related with the arts, especially music, and, to a lesser extent, those related with starting or running a business. In 2007–2015, the JUBEXAR Youth Association organized a meeting in Güevéjar (Granada) in relation to young people and urban arts, which was 100% funded from a grant of €14,669. In 2000–2006, the ETCÉTERA Youth Association organized the JAMONPOP Indie Pop Festival in Cortegana (Huelva) with an investment of €29,086 of which €12,679 came from public funds. In neighborhood associations, there were two clearly different types: on the one hand, the installation of collective services, most of which are related to rural electrification; and, on the other, those related with gatherings or events of a cultural or festive nature. In 2000–2006, the Lagunillas de Archidona Association carried out a project for the electrification of rural land in the "Lagunillas" area of Archidona (Málaga) with a total investment of €134,318 and a grant of €53,727. Also, in 2007–2015, the Toril Neighbours and Friends Association of Fuente Obejuna (Córdoba) organized the 8th Festival of Bread and Craftwork Exhibition, receiving €15,901 of the total sum of €22,716 invested.
Associations providing care to vulnerable people and cooperation. These groups carried out several projects, many of which required large investments, such as the creation, refurbishment, or equipping of centers or homes to attend to these people (old people’s homes, day centers, or centers that provide attention to people suffering from drug addiction, mental illness, dementia, etc.). In 2000–2006, the Association of Parents and Relatives of Mentally Disabled People from the North of Almería began the construction in Vélez Rubio (Almería) of a complex to provide all-inclusive attention to mentally disabled people, with a total investment of €2743,460 and a government grant of €420,836, creating 42 jobs. Large investments were also required for the purchase of vehicles adapted for disabled people and for purchasing the equipment necessary for holding workshops that they could attend. The Association of Families for Aid to the Disabled (AFADI) bought a minibus for the transport of disabled people in La Rinconada (Sevilla) for a total sum of €145,012 of which €94,243 came from government grants. Other projects included the organization of programs, events, and meetings to improve the integration of these groups and their families in society and the workplace. In 2000–2006, the “Juana Martos” Association for the Physically Disabled in the Cazorla area set up a project for social integration which remains active in 2021. The project, called ¿dónde vas? a todos sitios, (Where are you going? Everywhere), received a grant covering 100% of the investment of €33,309. Finally, we found various projects that involved improving the fittings and installations in their offices or facilities.
Culture and leisure associations. These groups were the most dynamic in terms of the enormous variety of projects that they carried out. For example, we found projects that involved taking cinema and theatre to rural areas; buying musical instruments for the town band; publishing magazines and other kinds of publication (recipes, literary, historical, and anthropological publications); holding all kinds of meetings, events, and conferences on a wide range of subjects similar to those dealt with in the publications; and the holding of educational workshops or awards and competitions that range from the “trovo” to mathematics. As an example, in 2007–2015, the ABUXARRA Cultural Association organized a competition entitled “Trovo alpujarreño: recovery and transmission” in Laújar de Andarax (Almería) with a total investment of €25,400, of which €22,860 came from government grants. In addition, the Pozo Alcón (Jaén) Parents Association has been organizing this activity for some time. For the 13th edition it received LEADER funds covering 97% of the €19,636 invested.Perhaps the most surprising projects were those relating to the recovery/restoration of properties and other assets belonging to or directly related to these associations. In 2000–2006, the Rural Heritage and Territory Association set up an Itinerant Interpretation Centre on the “Heritage of your Territory” with an investment of €770,091, 100% of which came from public funds. There were also activities related to sport and leisure, linked above all to enjoying nature, and especially activities related to hiking and horseback trails are very important in this category.
Religious associations. Religious associations, which include brotherhoods, parishes, or archdioceses, carried out three main types of projects. The first involved the refitting of churches, chapels, among others, by means of improvements in the electricity system, air conditioning, or ceilings. Thus, in 2000–2006, the Royal, Illustrious and Venerable Brotherhood of the Holy Charity and Mercy carried out a project for the restoration of the facade, ceiling and central roof of the church of Santo Cristo in El Arahal (Sevilla) with an investment of €108,614, of which €45,342 came from grants. The second type of projects involved holding meetings, events, and workshops on a range of issues, not just religious, some of which were linked to the management of centers for vulnerable people. In 2007–2015, the parish of our Lady of the Orchards restored and extended the Ntra. Sra. de las Huertas old people’s home in La Puebla de los Infantes (Sevilla), for which an investment of €677,427 was required of which €236,798 came from public grants. Finally, the most common type of projects, and also those that we consider most important and of greatest value, were those involving the restoration of religious buildings or objects, such as churches, chapels, wooding ceilings, processional floats, wooden sculptures, etc. In 2007–2015, the Archdiocese of Huelva took on the conservation and restoration of the Parish of Nuestra Señora de Guadalupe in the town of El Almendro (Huelva) with an investment of €438,710 of which €259,723 came from grants.
Trade Union associations. These groups organized projects in various different fields: fitting out their premises, especially to enable them to carry out various training activities; publications (books, leaflets, etc.) on a wide range of topics according to the particular organization; carrying out a wide variety of studies analyzing the situation of the local area, productive activities, how the legislation affects certain specific sectors, etc.; and finally, and perhaps most importantly, projects focusing on training. These projects were concerned with issues such as the official qualification required to be able to use phytosanitary products; agricultural skills and techniques (pruning olive trees, application of pesticides, etc.), or the use of ICT in business, among many others. As examples, in 2000–2006, the Cádiz Farming Organizations Federation (COAG) set up a network for the promotion of ecological agriculture in Jerez de la Frontera (Cádiz), which required an investment of €95,259 of which €57,146 came from LEADER funds. In 2000–2006, the Andalusian Confederation of Agricultural Cooperatives (FAECA) carried out a study of the impact of the reform of the CAP in agro-industrial cooperatives in the Bajo Guadalquivir area with an investment of €20,880, €18,000 of which came from public money. In 2007–2015, the Small Farmers Union (UPA) set up a training programme to enable people to obtain the official qualification required for handlers of phytosanitary products and for the transport of live animals. This project required an investment of €26,062, of which €22,674 came from grants. And also, in 2007–2015, the Young Farmers Association (ASAJA) requested finance from LEADER funds in order to train farmers about new Information and Communication Technologies (ITC) and business office software for the rural world in Jaén. 83% of the €15,975 invested came in grants.
Educational associations. These groups presented very few projects, four of which were carried out by Andalusian universities. These involved holding a scientific conference and two activities relating to the restoration and promotion of two buildings. In 2007–2015, the University of Córdoba carried out a project to enhance and promote the cave of Cañaveralejo in Adamuz (Córdoba). A total of €67,276 was invested of which €44,542 came from LEADER funds. Perhaps the most interesting project and the one that required most investment was the setting up of the School of Senior Public Sector Management by the Pablo de Olavide University in Sevilla. In 2007–2015, €100,947 was invested in a project in Carmona (Sevilla) of which €39,620 came from public funds.
PGI Control Bodies. Due to their specific nature, linked to geographic designations of origin or certified quality certificates, fundamentally of food products, these projects are related either with the promotion and dissemination of these products or with the establishment of procedures that enable them to maintain the identity and quality that distinguishes these products within the market. As one might expect in the largest olive-oil-producing region in the world, these include projects relating to olive oil and Ibérico de bellota (acorn-fed) ham, another world-renowned product. As examples, in 2000–2006, the "Montes de Granada” PGI Control Body carried out a study regarding the extension of the "Montes de Granada" PGI receiving 100% of the €4795 invested. And, in 2000–2006, the “Jamón de Huelva” PGI Control Body commenced the electronic identification of Iberico sows, investing €72,069 of which €51,126 came from public grants.

3.3. Where Do the “Others” Carry Out Their Projects?

We should remind the reader that there are differences between the variables analyzed in Section 1 and Section 3 of this paper, as Section 1 includes all the projects undertaken by the “Others”, while in Section 3 we only counted those projects in which the municipality in which they were carried out or were planning to implement the project was clearly specified, as explained in the Methodology Section. The result is that 70% of all the projects selected in Andalusia for the period of 2000–2015 were implemented in a specific town, 1508 to be precise. Of the projects that were successfully executed, 76% were carried out in a specific town, while in the case of failed projects 60% were attributed to a specific town. Another important fact is that the number of municipalities in which at least 1 project was implemented during the study period was 359, or 50% of the LEADER municipalities in Andalusia.

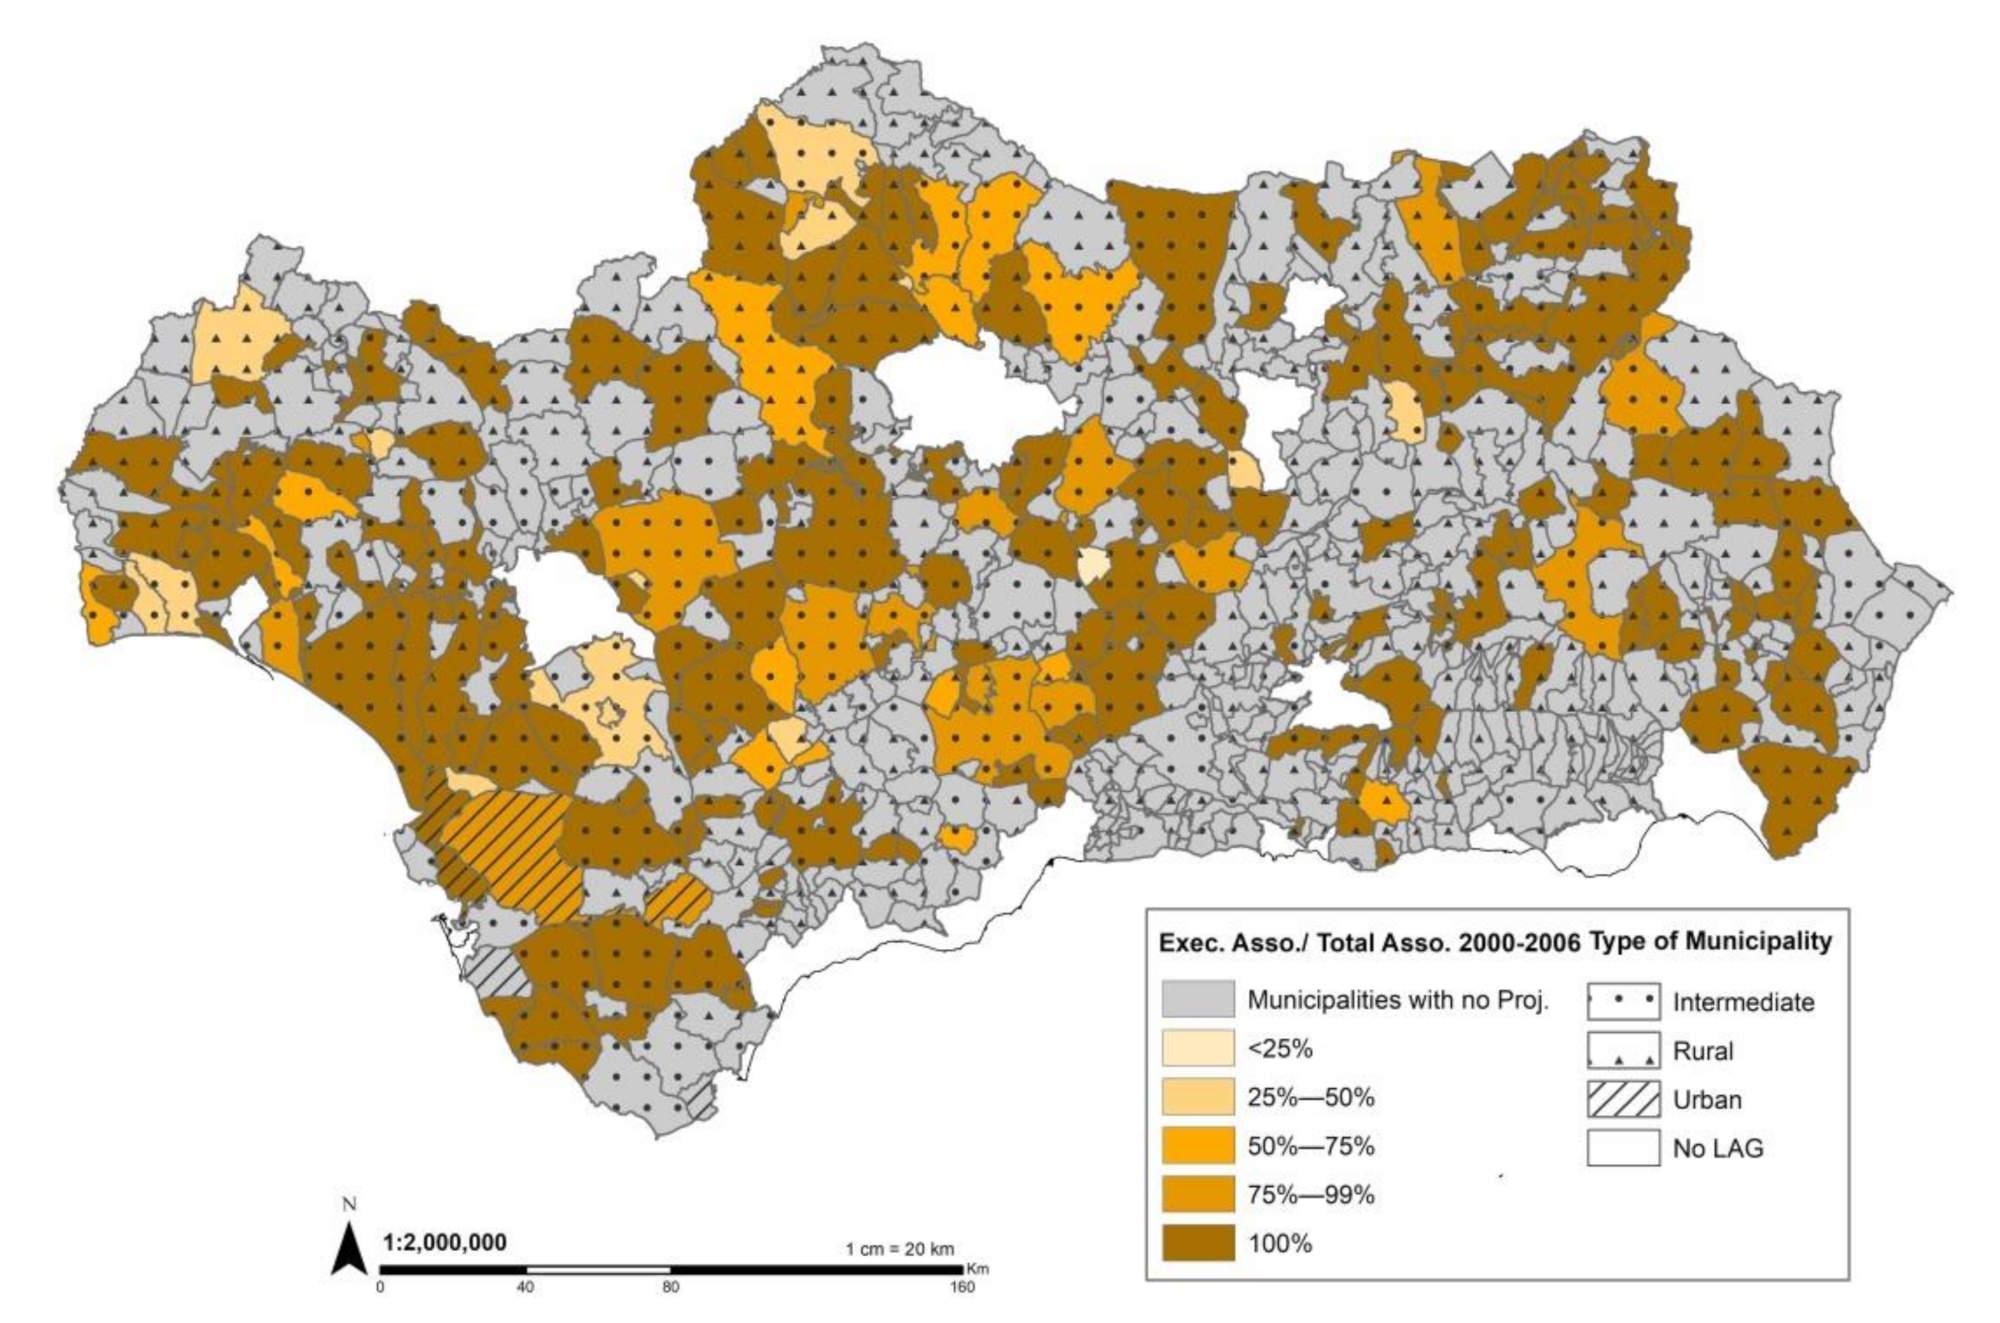
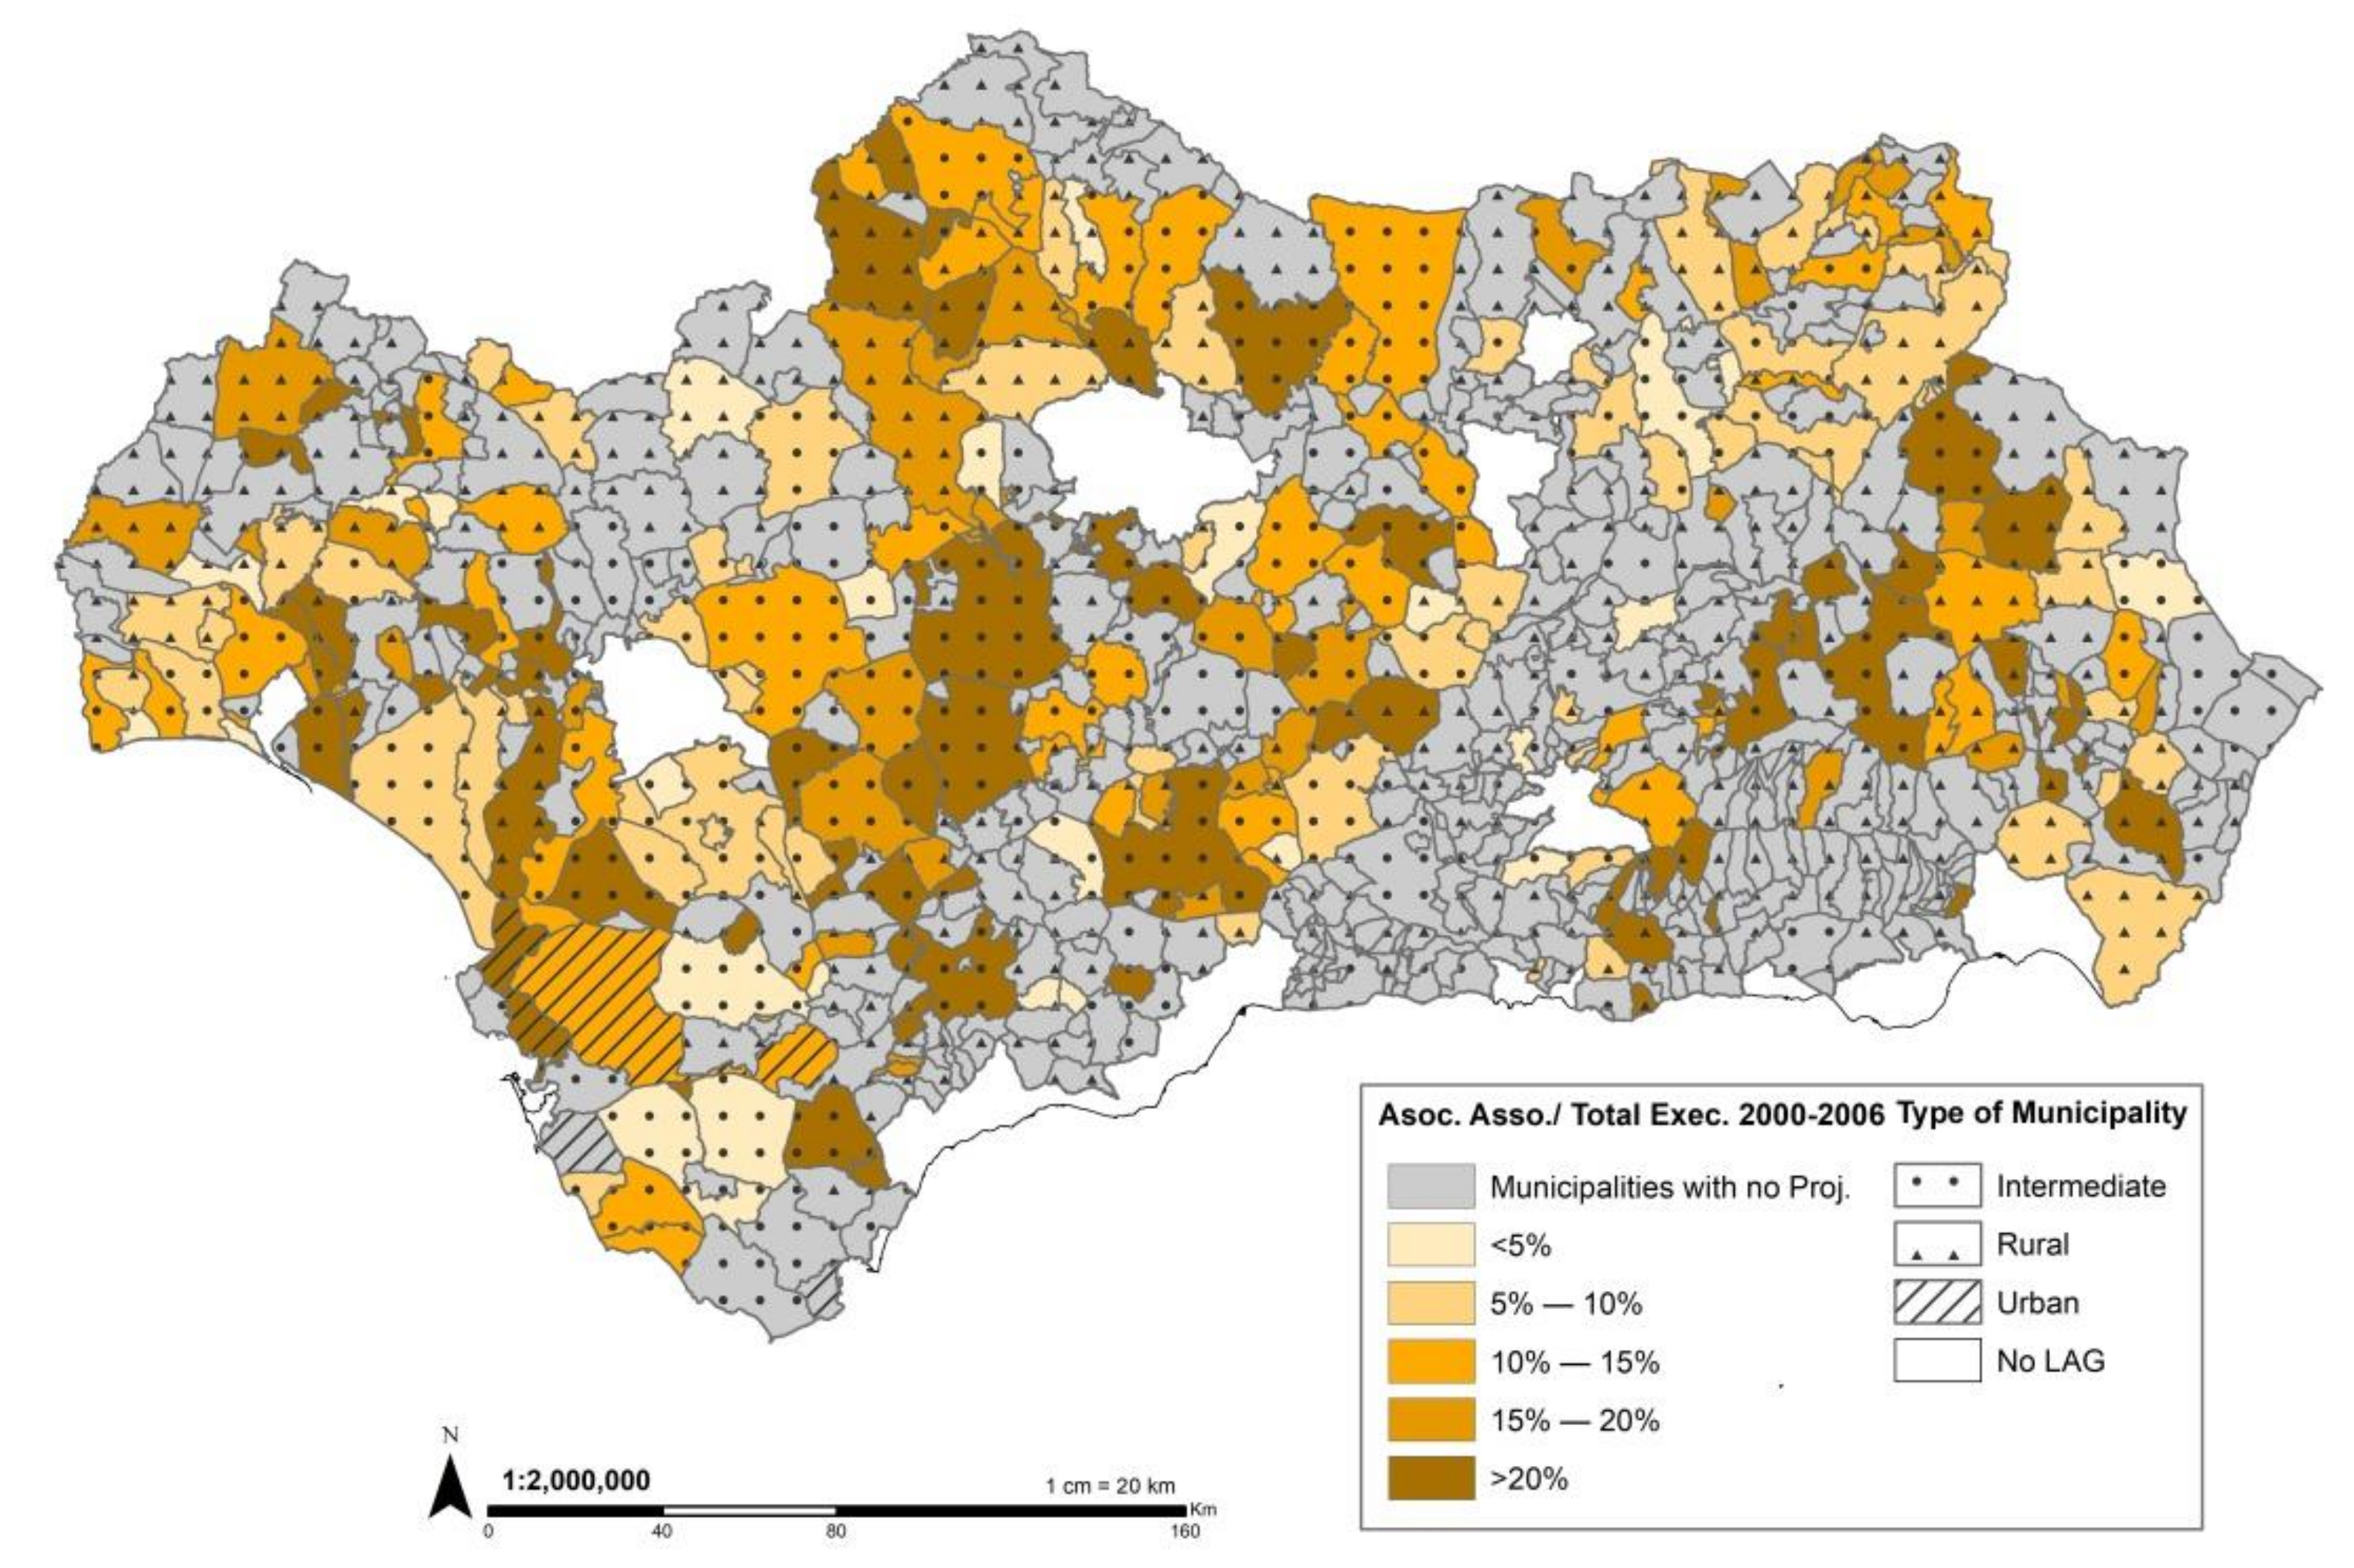
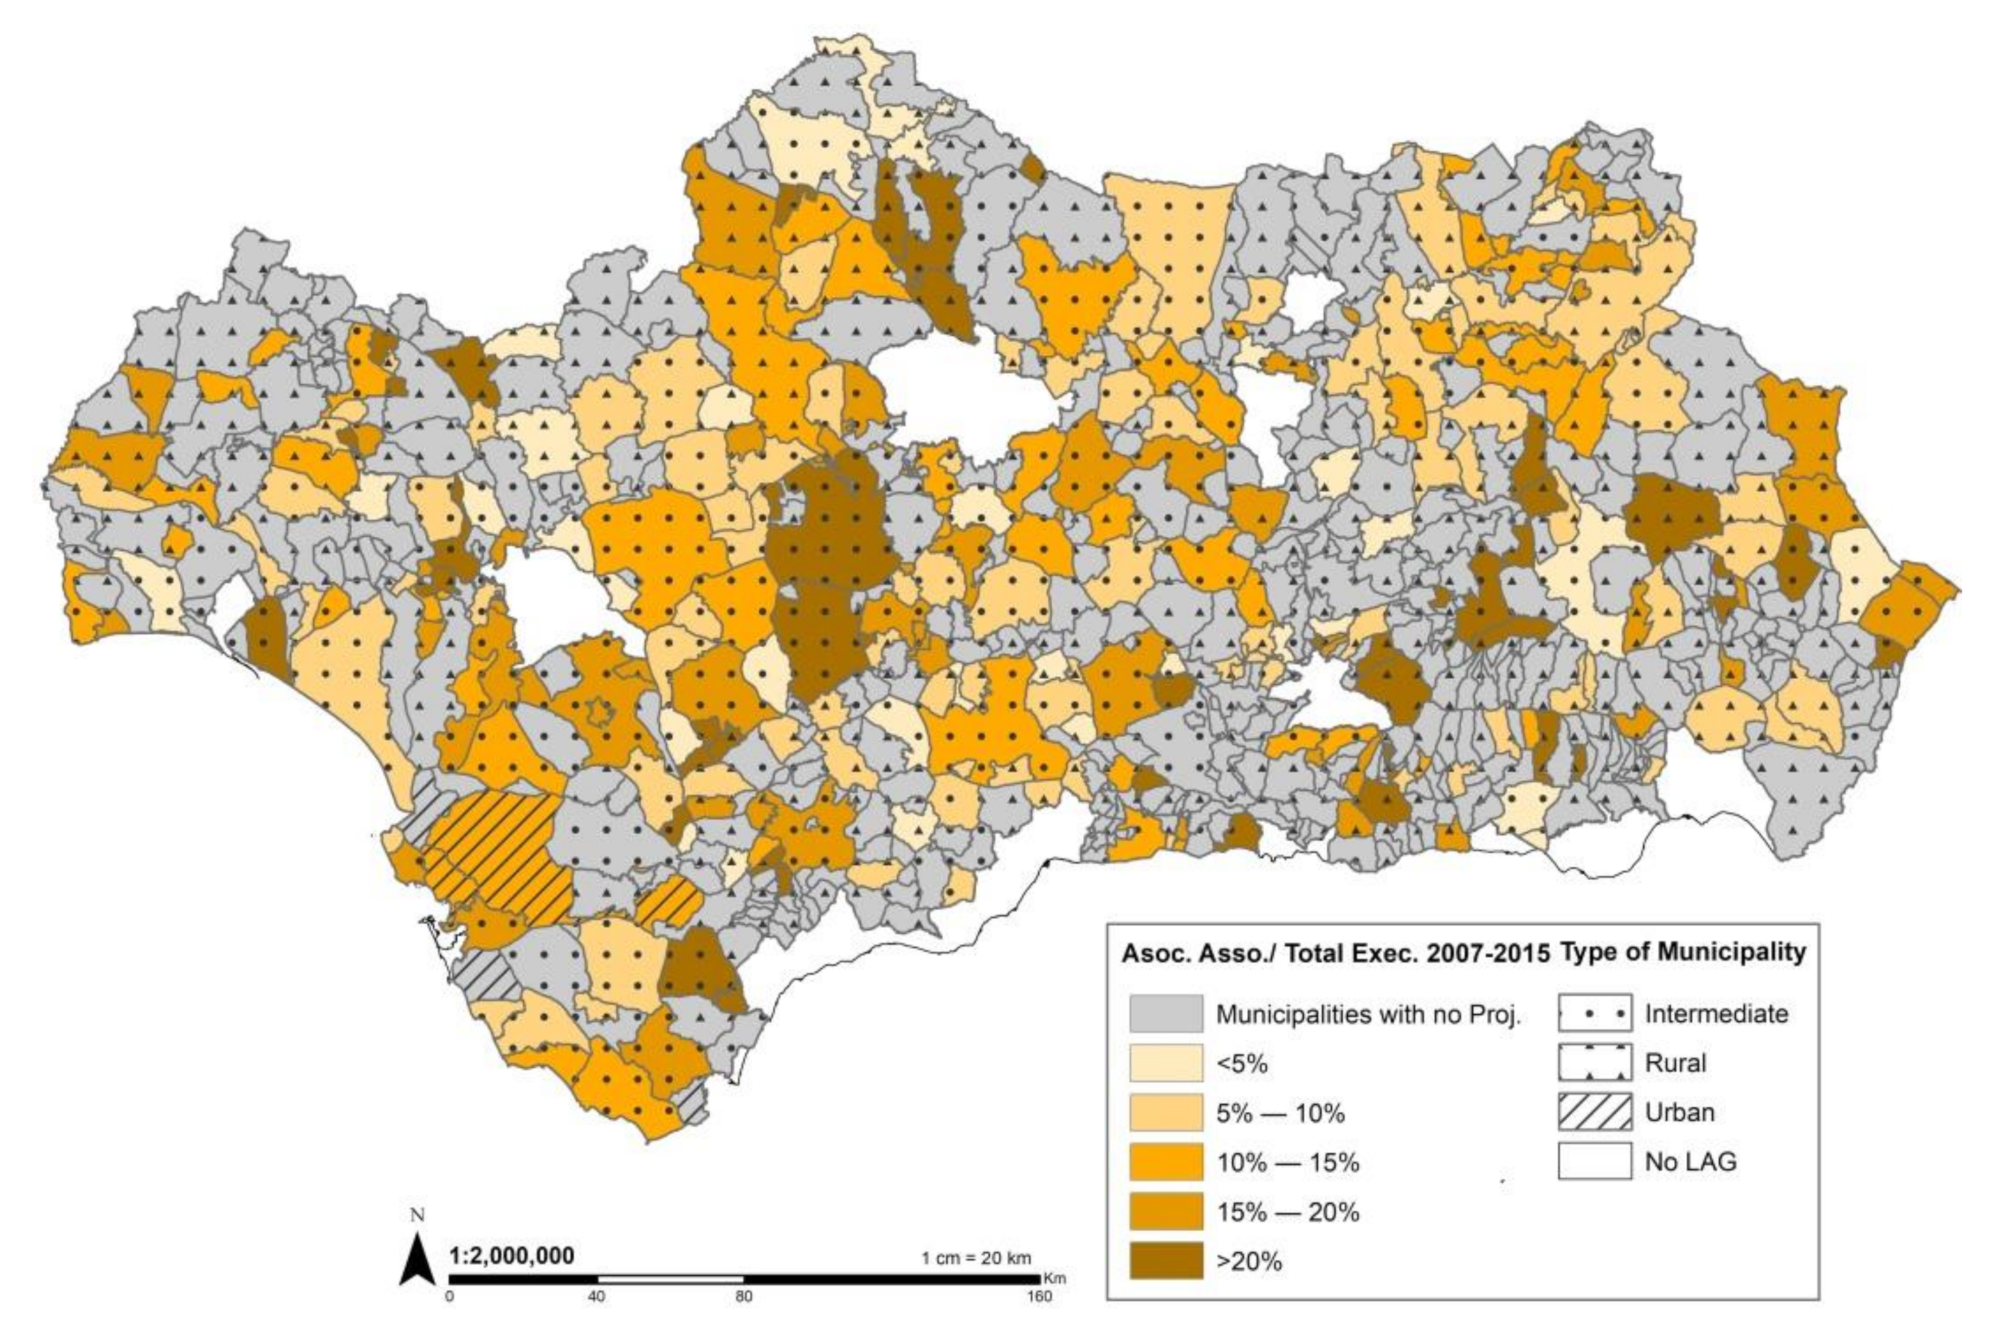
3.3.1. Projects Attributed to Specific Municipalities and Their Level of Implementation

We analyzed the successfully executed and failed projects attributed to a specific municipality according to the different types of rural area. The results are presented in Table 5.
Of the 359 municipalities in which the “Others” category executed at least 1 project between 2000–2015, 1 of the most important statistics to bear in mind is that in the first period 2000–2006, there were 126 municipalities in which no projects were started at all, 35.1% of the total. Of these 126 municipalities with no projects, around 40% were Type 2 and 3 municipalities (the nearest to large towns and cities), in which the absolute number of cases was very small. Slightly fewer, around 30%, were Type 4 and 5 municipalities, while the percentage went up again in Type 6, the deep rural areas, with figures similar to the average for Andalusia as a whole. If we analyze the differences between rural and intermediate areas, another interesting statistic is that the number of municipalities without projects is much higher in remote rural areas (37.8%) than in intermediate areas (31.3%). These differences occur in all the non-urban typologies and increase the more remote the rural areas. If we analyze the period 2007–2015, there were 100 municipalities in which no projects were executed, 28% of the total, an important fact in times of crisis. In addition, the differences between the intermediate and rural spaces were even more striking and the percentage of these municipalities increase in line with the increases in time distances, except in Type 4, which that did not happen in the first period.
The number of projects started in this period grew progressively from 65 in Type I, to the highest value of 434 in Type 4, before falling back to 248 in Type 6. In fact, 65.3% of the projects in which the application procedure was set in motion are concentrated in towns situated over 30 min away from more dynamic hubs.

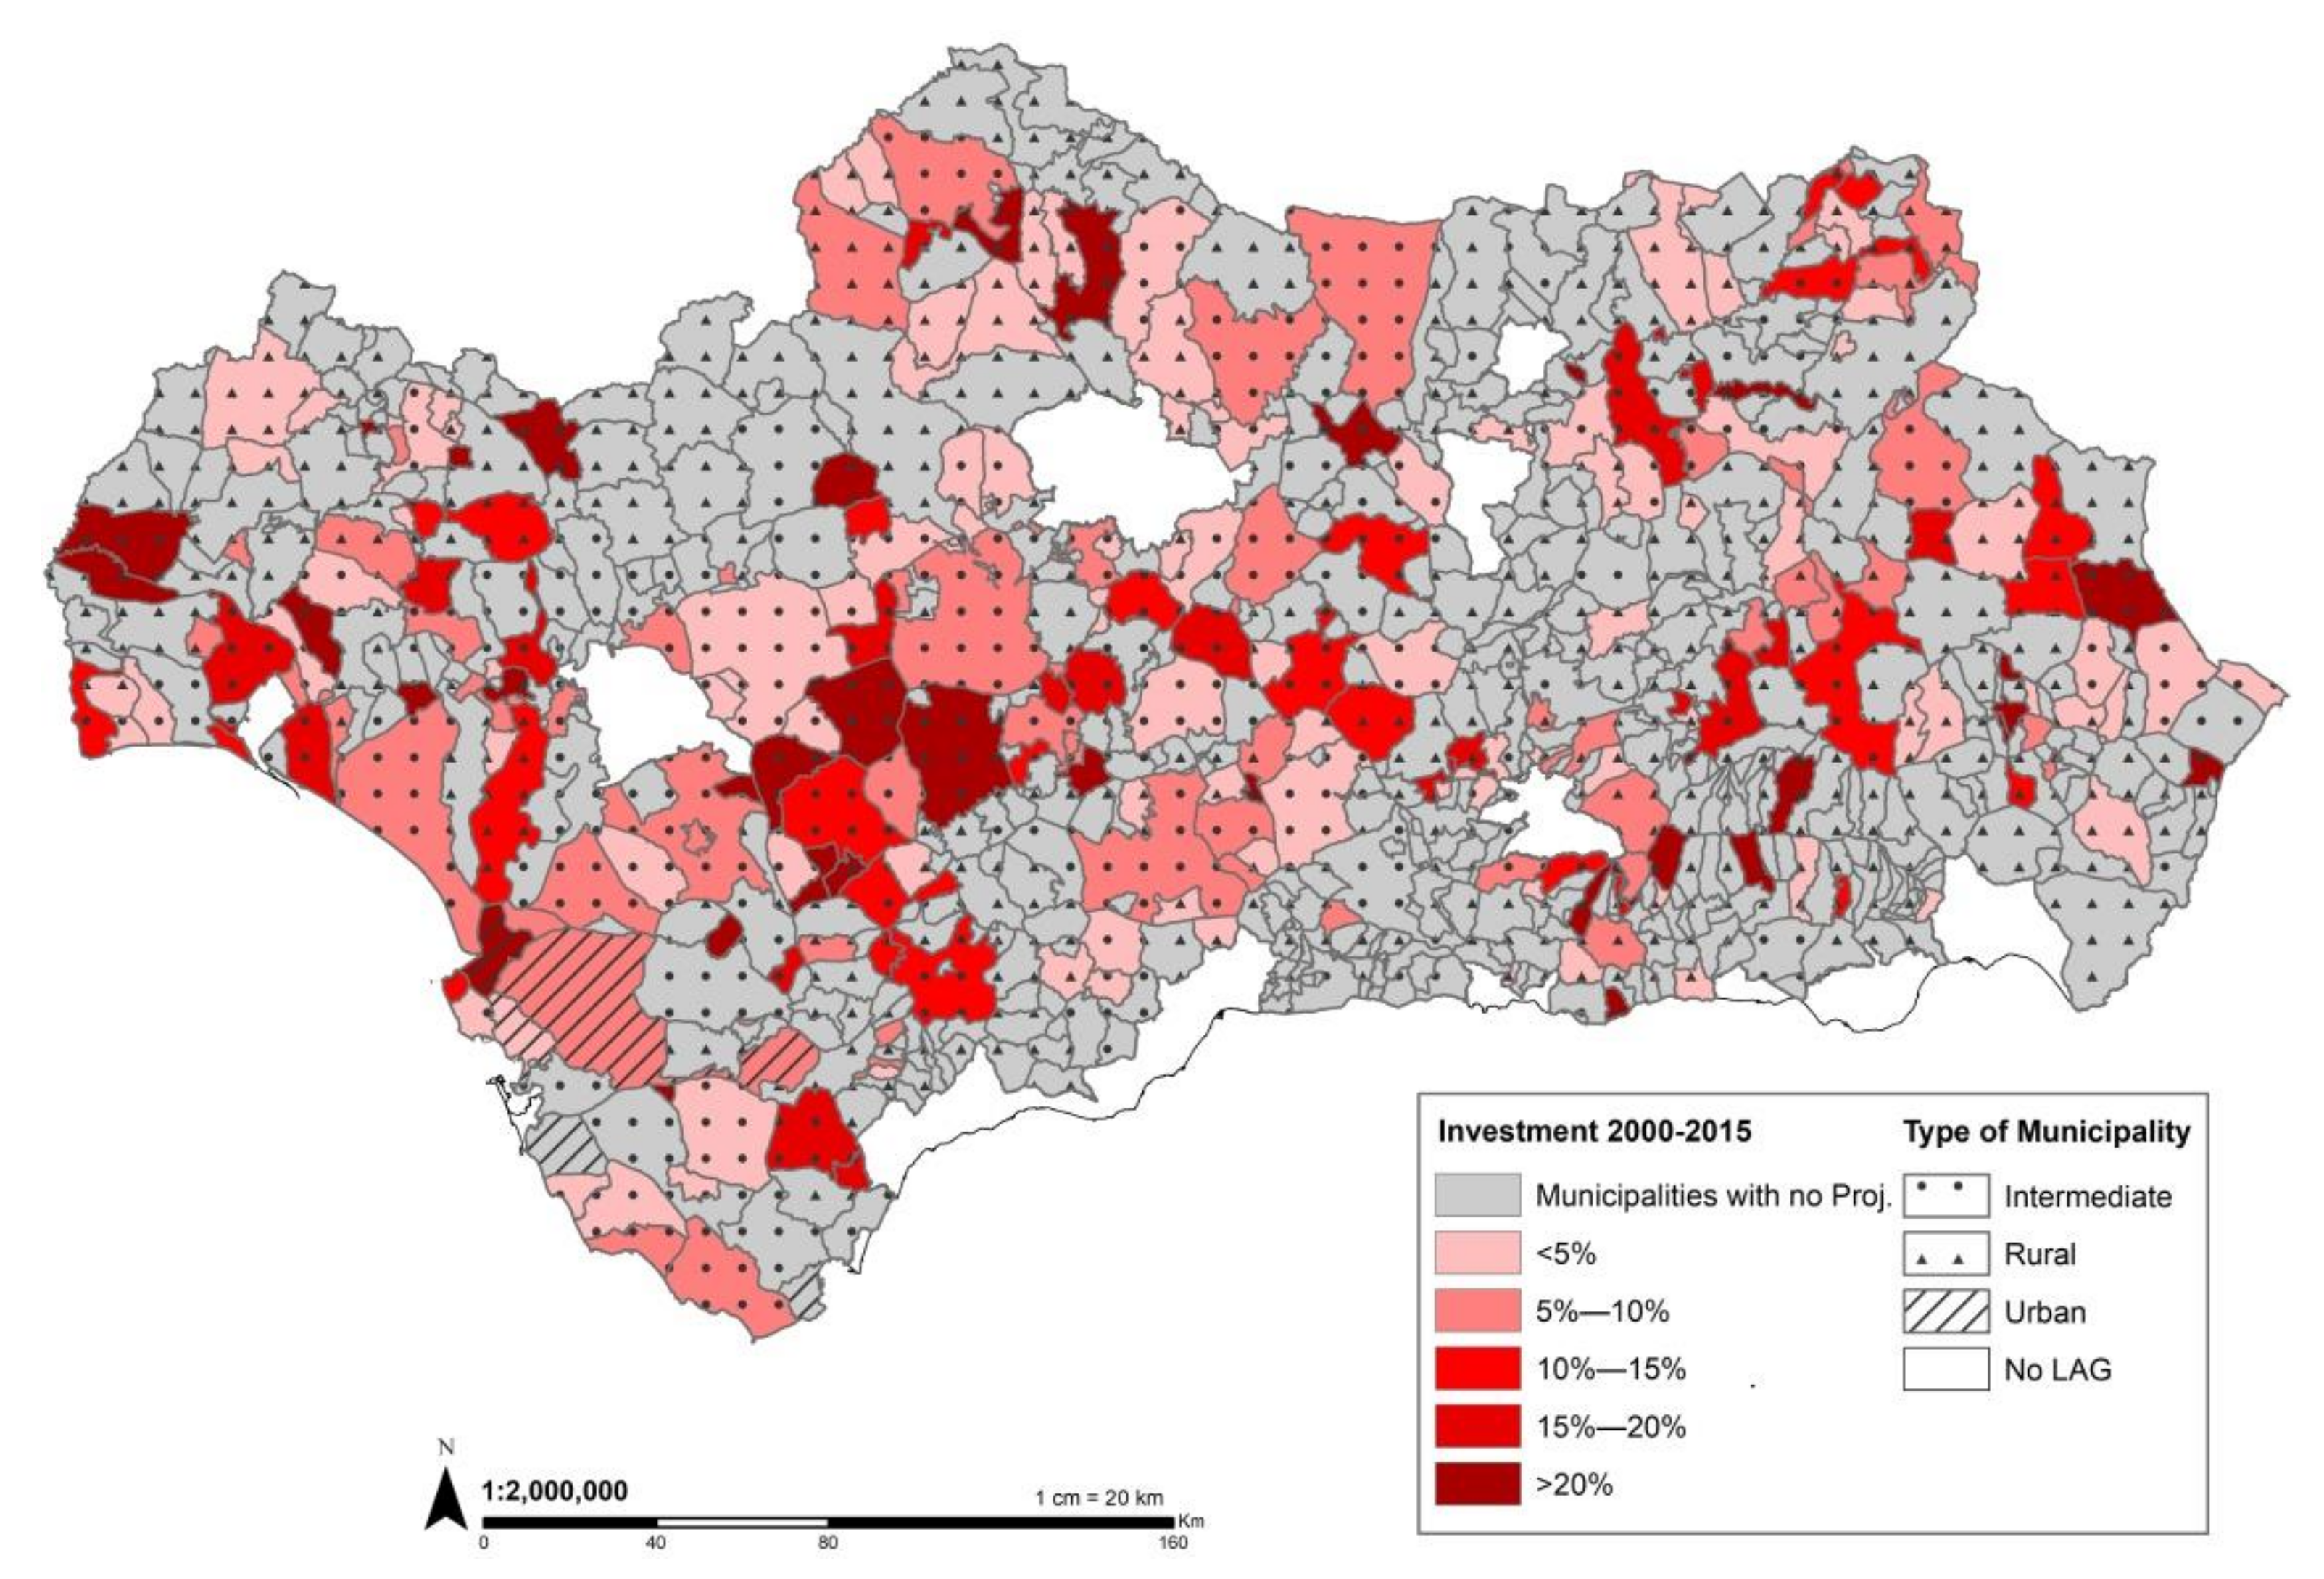
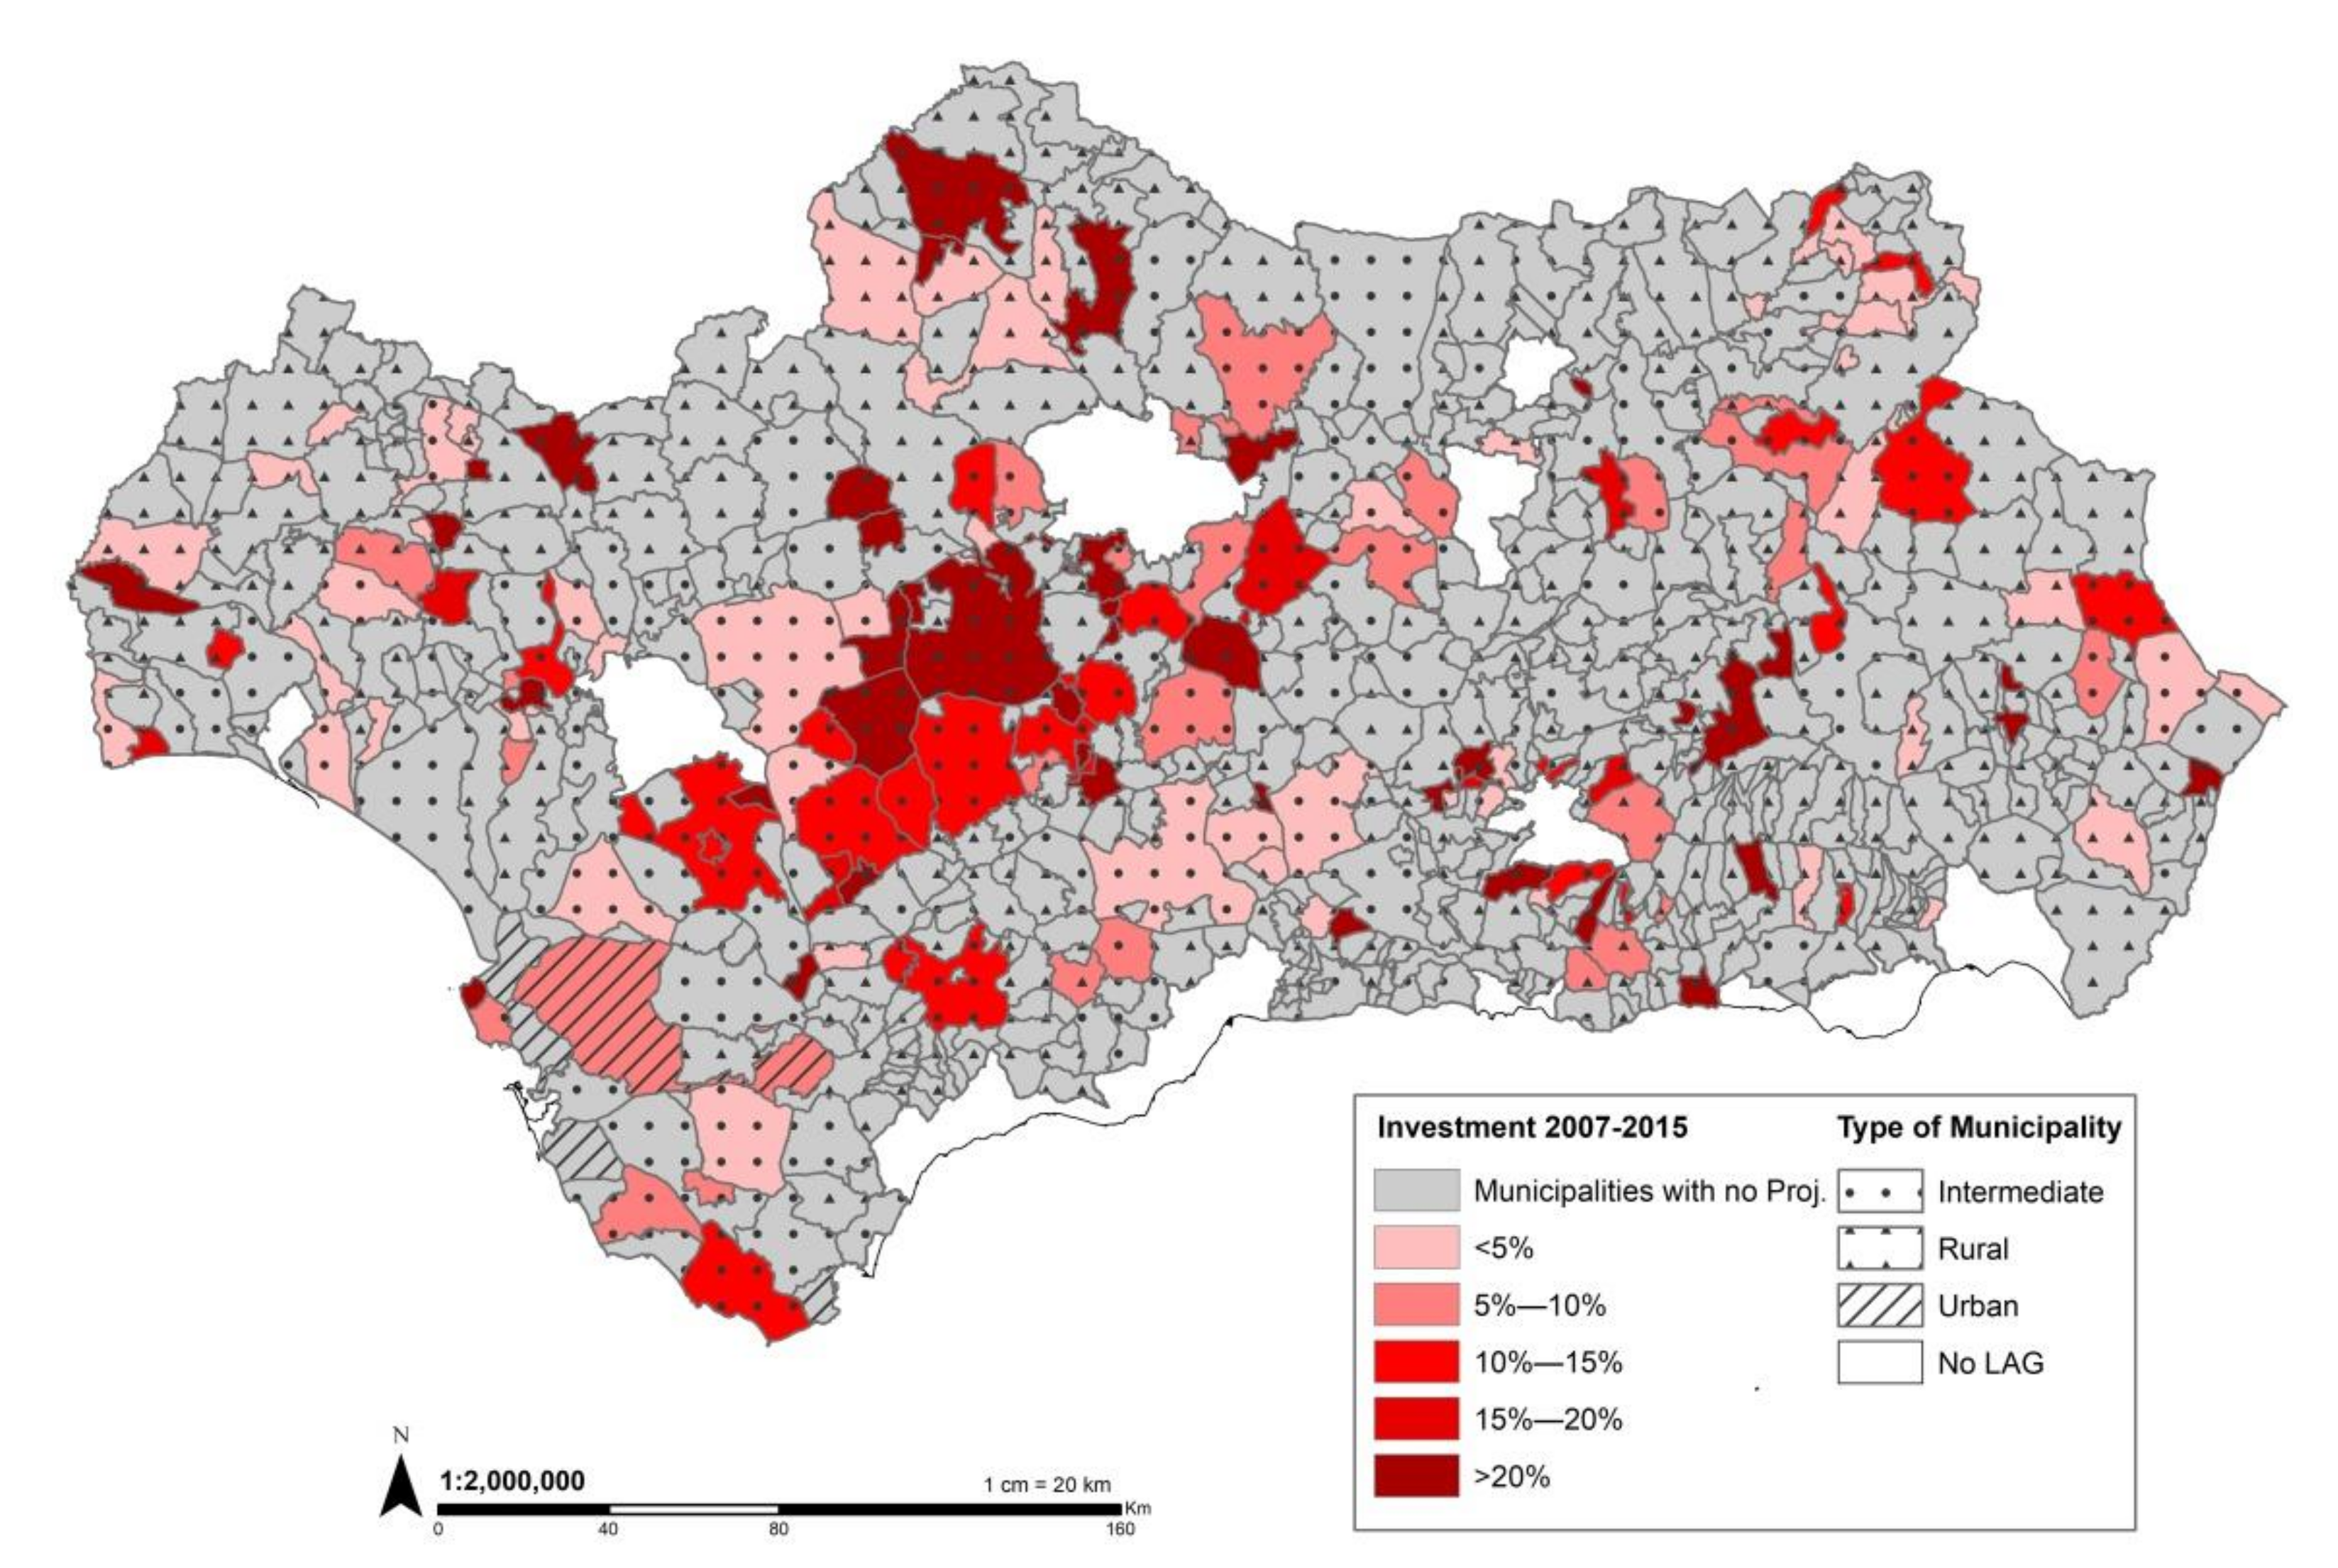
3.3.2. Levels of Investment

As happened with the number of projects, the investments made by the “Others” category in projects attributed to a specific municipality (83.6% for the whole study period) were lower than that recorded in Section 1 of this paper. This figure was higher in the first programing period (90%) than in the second (80.2%). These values are higher than for those for the number of projects set out in the previous section. These differences are clearly related with the projects that are abandoned soon after processing begins, as little administrative information is available about them; this is why for the period 2007–2105 there was a 23 percentage-point difference between the 2 values while for 2000–2006 it was just 6.3 points.
If we analyze the levels of investment according to the different types of rural area (Table 6), the highest levels of investment over the entire study period (2000–2015) were made in areas between 15 and 30 min time distance away from the most dynamic hubs with €21.6 million, almost one third of the total, the vast majority of which were located in intermediate spaces. This value falls as the distance increases, and it is only €10.6 million in the areas that are more than 60 min away, while the split between intermediate and rural spaces was quite evenly balanced. The average investment per project was much higher in all the intermediate territorial categories than in the rural spaces, and it was more than double the amount in the deep rural areas, €89,942 compared to €41,708. This explains why we find 2 apparently contradictory situations: on the one hand, a considerable number of small remote, inland mountain villages (39 in total), in which 65 projects were implemented with relatively small levels of investment, and, on the other hand, just 10 agrocities, in which 41 projects were carried out with a higher overall and average level of investment.
One way of analyzing in greater depth the investment contribution made by the “Others” category is to compare it with the total investments in LEADER projects at a municipal level. The average value for the period 2000–2015 was 6.6%, and a very similar percentage was recorded in each programing period. If we take this figure as a reference, no clear correlation can be observed between the level of investment and time distance, which could be observed in the number of projects and level of success. Indeed, the regional average was surpassed in categories 1, 3, and 5, while the opposite occurred in categories 2, 4, and 6. However, one constant trend is that, within each of the categories, the values increased in the intermediate areas compared to the rural areas, and the differences were greatest in category 6 the most remote, at 11.2% and 4.3%, respectively.
Finally, there are some significant differences between the two periods compared to the results for the whole study period of 2000–2015.
Indeed, during the boom period of 2000–2006, the most important difference is that, in Types 5 and 6, the remotest municipalities, the investment in rural municipalities was clearly higher than in intermediate ones, and even the percentage of investment made by the “Others” group as a proportion of the total invested in each territorial category was higher in Type 5. Neither of these issues can be observed when analyzing the study period as a whole. This is due to the fact that a very similar number of projects were carried out in rural and intermediate areas, and also to the fact that the average investment for each project was higher in the former than in the latter.
The results for the second period (2007–2015) are much more striking. As mentioned earlier, the overall investment made by this group (the “Others”) was 40% lower than in 2000–2006. This result was only to be expected given the economic crisis. The surprising thing is that this reduction affected the different territorial categories in different ways, with greater differences the higher the investment made in the previous period. For example, investment in category 3 municipalities fell from €15 million to €5 million, while in category 4 it fell from €9 million to €7 million. By contrast, in deep rural Category 6 areas, the investment remained practically unchanged. The result was that the investment made by the “Others” as a proportion of the total was higher in percentage terms, 10% and 8% in Types 5 and 6, respectively, and exceeded the regional average. This interest shown by the “Others” in remote areas at distances of over 45 min away was even more marked in the intermediate areas, 13.4% and 18.6%, than in rural ones, where the values obtained during the boom period were maintained at 7.6% and 4.2%, respectively. Although the fact that the level of government grants received was on average 11 percentage points higher than in the boom period is an important statistic that should be kept in mind, we do not believe it was the determining factor behind this trend. This is because these differences in terms of grants can be observed in all the territorial categories, while this additional investment effort compared to the previous period is not evident in all of them. This can be observed clearly in Type 3, the category in which the investment made by the “Others” fell most sharply, even though government grants were 25 percentage points higher, or the opposite situation in Type 6, where government grants were almost 20 percentage points lower than in the previous period.

3.4. Where Do the “Others” Invest?

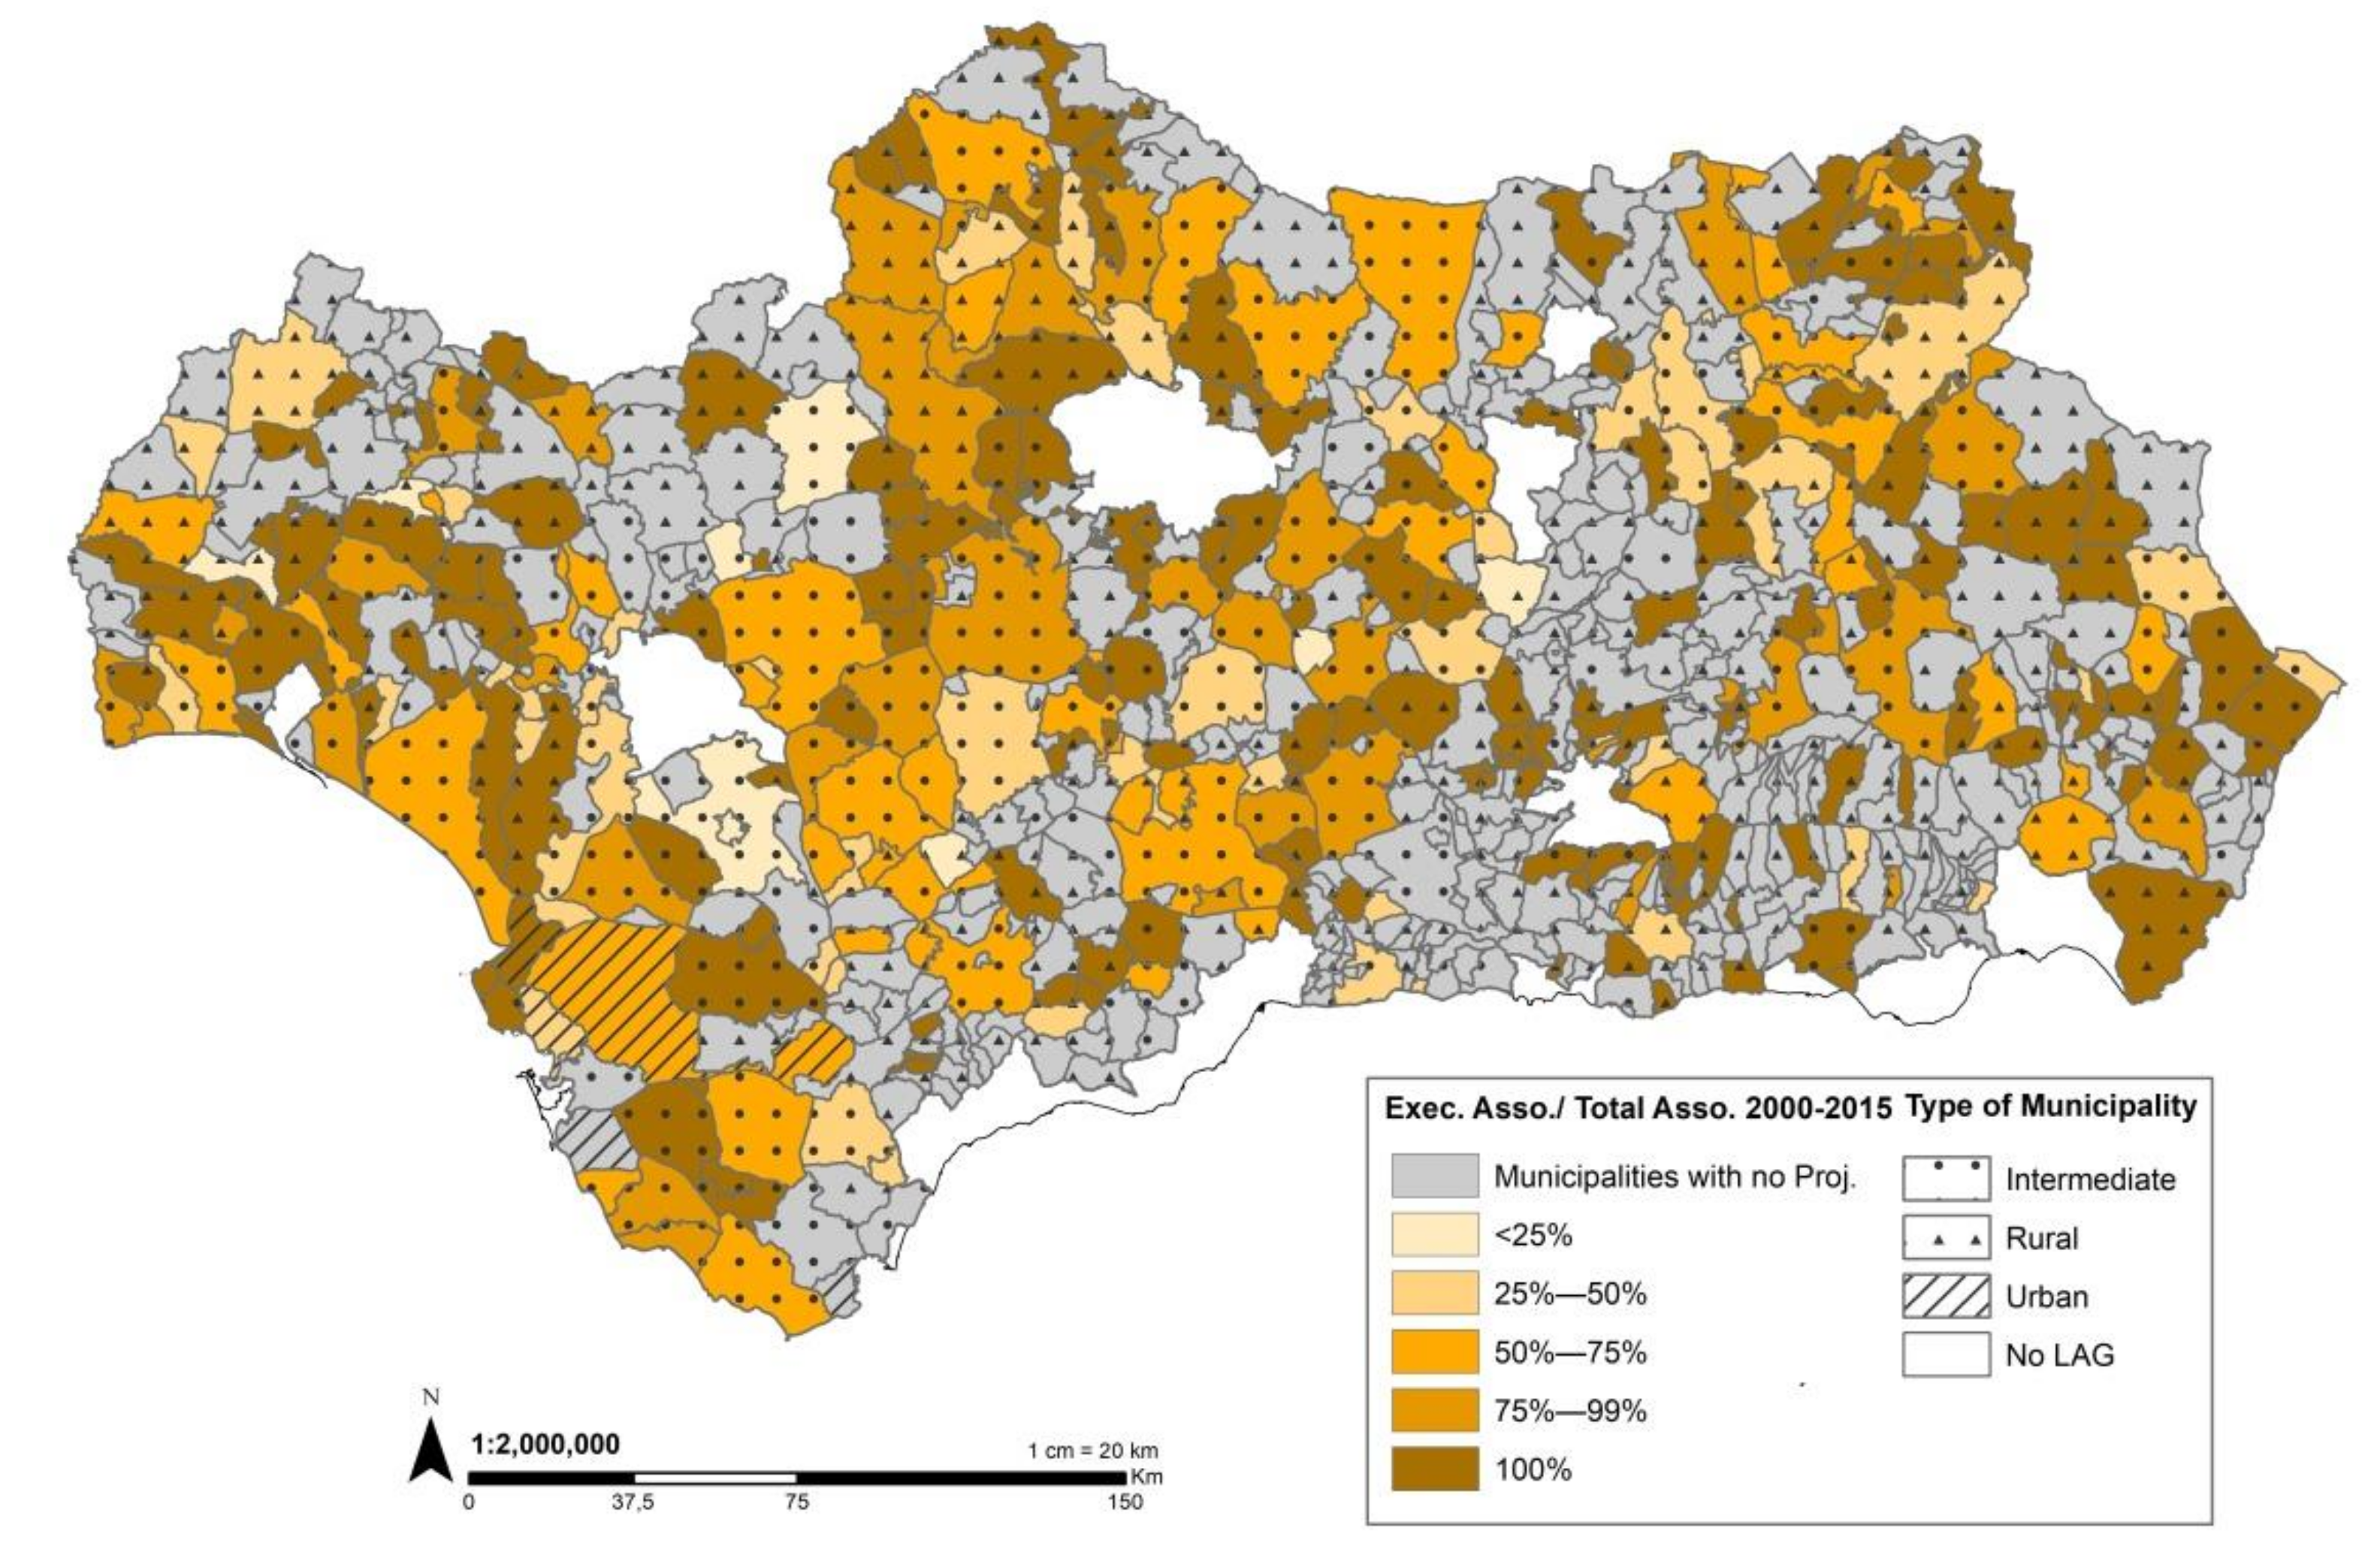
3.4.1. Successful and Failed Projects

As can be seen in Figure 3, most of the projects proposed by associations were successfully carried out. For the period of 2000–2015, in the majority of municipalities, over 75% of the projects were successfully executed and this figure frequently reached 100%. As regards the type of rural areas, we did not observe a higher percentage of success in intermediate areas than in rural areas. The real challenge was to initiate the project, but once processing had begun, on most occasions they were carried out successfully.
In the same way, important variations can be observed in the level of success according to the population and location of the municipalities.
The differentiated analyses for the periods of 2000–2006 (Figure 4) and 2007–2015 (Figure 5), however, reveal very different results. In the first period, most of the projects were executed, in some cases reaching 100%. In other words, all the applications for which files were opened were properly completed and the project was successfully carried out. This did not happen, however, in the period of 2007–2015, in which success was far from guaranteed. In many municipalities, less than 50% of those that initiated the application process finally executed their projects and, in some places, this figure was less than 20%. In addition, for the period of 2007–2015, the regional administration changed the way of counting the projects that were started and not completed at some stage of the application procedure, so increasing the number of projects that were counted as failed.
During the economic crisis of 2008, many promoters found it difficult to obtain funding or bank loans, a problem which also affected third sector promoters, even though their projects were given careful consideration and involved very little risk.
As regards the distribution of success or failure according to the different types of municipalities, the truth is that the lowest levels of success in the period of 2007–2015 were found in the intermediate municipalities, with a slight concentration in the Guadalquivir Valley (Osuna, Carmona, Lebrija, and El Palmar de Troya), an area with a high percentage of projects. Many of these municipalities have a relatively large population and are regarded as “agrocities”.
These towns in the Guadalquivir Valley were not the only ones in which the projects presented by associations had high levels of failure over the period 2007–2015. Figure 5 shows that similar levels of failure were also evident in large towns in the province of Jaén, such as Andújar, Úbeda, or Villacarrillo, which are also considered as intermediate municipalities.

3.4.2. Executed Projects

The spatial distribution of the projects carried out by associations over the period 2000–2015 as a proportion of the total number of projects carried out in the municipality highlights two important facts (Figure 6). The first is that they are more frequent in intermediate rural areas, a logical finding in that these towns have larger numbers of associations. However, in relative terms, they also have a larger number of projects in the most populated towns, such as Osuna in Sevilla (40% of projects executed), which is surrounded by other large towns, such as Ecija, Marchena, or Morón de la Frontera, all of which have over 15,000 inhabitants and have values of over 20% of the total number of projects. This shows, once again, the power of the medium-sized agrocities in Andalusia.
The second aspect we investigated is the location of the towns in which no projects were carried out by associations. Many of these towns are in the province of Granada and the southernmost sectors of the province of Jaén and western parts of Almería. When joined together these create large, mainly remote and deep rural areas with no third sector projects at all.
A similar situation can be observed in the mountain areas of Huelva, Sevilla, and Jaén, where there are small municipalities in which the representation of civil society in the form of associations is much lower.
Our separate analysis of the two programing periods, 2000–2006 (Figure 7) and 2007–2015 (Figure 8), showed several important differences that should be highlighted in this paper. Probably the most important is the large number of projects executed by associations during the first period as a proportion of all the projects executed in each town. Associations often accounted for over 20% of the total, and in some cases over 50%. In the period of 2007–2015, however, associations were not as dynamic and the percentages of projects carried out at municipal level frequently fell to levels of just 10 to 15% of the municipal total. Although this is a common trend throughout Andalusia, it was particularly obvious in the province of Huelva, in the Guadalquivir Valley, and in the flat countryside between Málaga and Córdoba. A significant difference can also be found in the territorial impacts of these promoters between 2000–2006 and 2007–2015 in Eastern Andalusia, in the provinces of Granada, Jaén, and Almería. There were relatively few projects in the first period, a fact that was compensated in the second, in which associations played a more important role, so evening out the situation for the whole study period.
Except for a few exceptional cases, the projects carried out by associations rarely accounted for more than 15% of the total, even in the most dynamic municipalities in the intermediate areas.

3.4.3. With Regard to the Investment Made

Although the number of projects carried out by associations enables us to assess their importance within the whole set of projects carried out by the different promoters in each municipality, the analysis of the investment is what really demonstrates the impact of these projects in local areas.
As can be seen in Figure 9, the municipalities in which the investment made by associations came to less than 5% of the municipal total were a majority across Andalusia for the period of 2000–2015. In a few cases, the threshold of 20% was exceeded in towns and villages, such as Marchena, El Arahal, and Osuna in Sevilla; Pozoblanco in Córdoba; Vélez Rubio in Almería; or Trevélez and Cañar in the Alpujarra region in Granada.
This spatial distribution, which is very irregular for Andalusia as a whole, with no clear dominance of some provinces over others or of a certain type of municipality compared to the rest, shows that the level of investment varied quite considerably, a fact that could have more to do with the characteristics of the associations promoting the projects and with the type of projects than with their specific location in Andalusia.
However, the overall data can disguise very different spatial dynamics according to the particular programing period analyzed, given that the economic situation was very different and so was the spatial distribution of investment. This can be seen very clearly in Figure 10 and Figure 11.
Over the period of 2000–2006 (Figure 10), the municipalities in which associations accounted for over 15%, and in some cases even 20%, of investment in LEADER projects were more numerous than in the period of 2007–2015. There were also more examples of such municipalities in all the provinces, except for the northern mountainous areas of Sierra Morena and the arid South East of Almería.
With the exception of some municipalities in Granada, in the period 2007–2015, the largest investments were concentrated in municipalities in the Guadalquivir Valley around the Osuna–Écija axis.
As can be seen in Figure 10, the high levels of investment made by associations during the period 2000–2006 in areas, such as the Atlantic coast of the provinces of Huelva–Cádiz and other areas near Sevilla, were not maintained in this period of 2007–2015 (Figure 11). In the first period, associations accounted for over 20% of investment in municipalities, such as Sanlúcar de Barrameda, Bollullos Par del Condado, Aznalcázar, Bonares, or Gibraleón. Values of over 15% were also reported in other important towns, such as Almonte or Ayamonte.
In the period of 2007–2015, as appears in Figure 11, a quite different trend can be observed, in that the investments made by associations on the Atlantic coast are much less important, accounting for less than 5% of the total.

4. Discussion and Conclusions

Our research shows that the “Others” group of promoters is made up of a very diverse group of actors with a wide range of purposes. Although the projects that they carry out share a number of common features, they are mostly specific to the type of association, so confirming our initial hypothesis. The members of this group have a similar legal status in that they are non-profit associations, foundations, organizations, etc. [38], which together, according to Hahn and McCabe [39], form a “third way” between the ideas proposed by social democracy and those of neoliberalism. This gives the third sector its own identity to the extent that economic profit is not the ultimate purpose of the work that it performs, which distinguishes third sector associations from private companies. They also carry out many projects that, in theory, should be performed by the public sector, but, in practice, they are not. These organizations, therefore, find themselves filling the gap between the private and public sectors. They perform a vital role in carrying out activities, which often have social and care objectives, but which also generate employment and indirect benefits for all concerned. In many cases, it would be difficult for local public institutions to cater for these needs. Together they make up what has been dubbed the third sector, which, in a general way, encompasses civil society. This confirms our initial hypotheses.
Indeed, the debate arises as to whether some of these many rural development actions carried out by “Others” in order to provide public services, such as caring for vulnerable groups in society, restoring local heritage, the recovery and dissemination of traditions or cultural assets, etc., should be tackled, firstly within LEADER and secondly by civil society, when in fact they should be provided by the public sector. Neither should we forget the increasing importance of the third sector in terms of wealth and job creation [1,40,41]. In short, the success of the “Others” reveals the limitations of the Welfare State and the challenges it faces—demographic, political, and economic [6]. These include the distinct, but complementary roles played by the two sectors (third sector and public sector) in relation to the governance of welfare [42]. Their role is a means of resisting the prevailing trend towards neoliberalism, so promoting human development, social justice [43], and even the view that it has failed to the extent that the world continues to be dominated by the same political and economic elites that held sway in the Bretton Woods era [44]. The third sector provides a necessary cushion between the public and private spheres that covers the services not provided by the public administration. It is also better at adapting to a varied range of specific circumstances in which it must attend as quickly and as flexibly as possible to the needs it serves to cover.
Another important question to bear in mind is that, within this group of “Others”, there are various associations who, while enjoying this legal status, also carry out business activities that can generate profit. However, due to the fact that they are non-profit-making entities with a cultural, social, political, artistic, humanitarian, or altruistic purpose, they are not allowed to redistribute their profits, which must be reinvested in the association itself and in the creation of employment within the association. In this case, these organizations are correcting market failures, not so much in terms of exchange, but more in terms of self-sufficiency [45] and dynamic complementarity [2]. These promoters receive much higher grants than other private entrepreneurs; they can enter into employment contracts, even with their own members, and they have similar tax obligations to those of a self-employed person or a limited company. Is it in fact a form of self-employment that enjoys a special legal status that is beneficial for the group of physical or juridical persons that make it up? Are there other characteristics that distinguish associations from private companies, so justifying this special favorable treatment? The most important difference lies in the fact that they are driven by values relating to solidarity, the fight against inequality, and attending to vulnerable groups in situations in which their members are actively cooperating and participating in society, principles that are very far removed from the workings of business and the profit that drives private enterprise [46]. Associations can also offer much greater flexibility, speed, and versatility compared to the public administration.
By contrast, another clearly differentiated profile is that of voluntary associations [47], cultural, youth, and women’s associations [48], among others, which carry out an essential role in boosting the development and fortification of social capital in towns and villages [19,49,50]. These types of associations promote relations, contacts, and meetings between the members of the collectives and with society as a whole by sharing and publicizing very diverse aspects, problems, needs, etc., through projects that generally require small investments and less capacity when it comes to raising funds, such as those provided by the LEADER program [51]. The fact that they are less active and play a less prominent role in rural areas of Andalusia, as shown in this article, is compensated in part by the Local Action Groups, who carry out projects aimed at generating social capital within women’s and youth associations, as well as improving the human capital within these collectives.
In the case of Andalusia, the third sector groups that carry out most projects are business, cultural, and trade union associations, a surprising finding when we think, a priori, about the specific actors that make up the civil society formed by the third sector. These could be referred to as “large entities”, i.e., those that carry out most projects. These projects normally involve both the work required for their own maintenance (e.g., repairs and refurbishment of their premises) and other very diverse and specific actions that vary in each case. In general, these projects enjoyed high levels of success during the boom period (2000–2006), in fact much higher than the average for all the different promoters [35], while the economic crisis prevailing during the second period (2007–2015) had a generally negative impact on the success of their initiatives as compared to the regional average and to the different promoters. Associations are the weakest actors from a financial point of view as their main source of finance is grants from the different administrations, and their non-profit-making nature practically excludes them from bank lending, especially in a period (such as the second one) of severe austerity and credit restriction. However, and this seemed to us particularly relevant, other groups that might be considered a more essential part of civil society when it comes to rural development, such as women’s associations and youth associations, have a much smaller presence. The same applies to universities, a privileged, qualified stakeholder in rural development. In terms of investment, the associations that care for vulnerable groups occupy the leading position with almost one third of the investment in both periods. They also had very high average levels of investment per project. In some rural areas, they were also in first position in terms of the number of jobs they create. In this way, they provide an extra social function in addition to that which is specific to them and differentiates them from other project promoters, namely the attention they provide to vulnerable groups. One example is the Valle de Lecrín–Temple area in the province of Granada. The other actor that plays an important role is religious associations, which in terms of the number of projects were much less prominent. In addition, their work had the most impact during the economic crisis, increasing their overall and average levels of investment per project compared to the “Others” group as a whole. For their part, the mission of cultural associations is to help to protect and reinforce intangible capital and territorial identity, among other important aspects.
The dominant position enjoyed by the associations that benefit the most from the LEADER programs, in addition to their lack of leadership or mobilization in these rural areas, may have prevented other initiatives or other opportunities from seeing the light of day. These include, for example, time banks [48] and the promotion and training required for the inclusion of women in the agricultural [52] or voluntary sectors. In particular, environmental and even social volunteering are niche activities that could be promoted and incentivized so as to increase the participation of young people and of youth associations in general [53]. They could also enhance the role played by older people [54]; “social farming” through third sector organizations [55,56]; or the fight against social inequality, fostering the social inclusion of marginal groups and certain ethnic minorities; and the fight against poverty, among other aspects, that should be considered by these organizations [57]. The vacuum created by this relative lack of representation, mobilization, and leadership has been filled by the Local Action Groups, who are also members of this third sector, although they are not studied in this paper. In this way, LAGs have become interested, actively involved parties that play a fundamental role in the rural development process. They are similar to footballers waiting on the bench, metaphorically speaking, on many occasions having to take the place of non-existent or inactive players.
In geographical terms, the “Others” group carries out projects in a relatively small number of towns and villages. We found that, of the 703 municipalities covered by the LEADER program, this group started at least 1 project in just 233 and 259 municipalities in the first and second periods, respectively. Although it is true that some of the projects are carried out at a larger, sub-regional scale and are not assigned to one particular municipality and therefore not counted in our spatial analysis, the fact that the “Others” group invested directly in a relatively small number of towns reveals the need for these areas to have a minimum population, especially in the most rural areas. In this context, groups of this kind, who are sensitive to and committed to solving common social problems, must assume a leading role in rural development through leaders with the necessary skills to promote projects of this kind. In both analyzed periods, most of the projects attributed to a particular municipality were located at a time distance of 15–45 min away from more dynamic spaces. In addition, the success levels of the projects that were finally executed were higher in the towns situated less than 30 min away from more dynamic hubs, and success rates were higher in intermediate municipalities than in rural ones. This leads one to conclude that this type of project has greatest impact and success in nearer, better connected spaces with a high population, located above all in the Guadalquivir Valley. This trend is maintained and even increases when we analyze both the overall investment and the average investment per project executed [58,59]. The associative fabric becomes weaker as the marginality and remoteness of rural territories increases, thus causing their level of activity to fall too.
Another interesting finding concerns the involvement of “Others” as promoters of projects in the areas furthest away from business hubs, categories 5 and 6. As well as being very important in quantitative terms, the fact that they maintained their share and even increased it during the period of economic crisis, 2007–2015, in both relative and absolute terms, highlights how vital they are for deep rural areas. The commitment shown by the “Others” group to these territories is not related to the grants they receive. This is very important due to the fact that the social innovations produced by the third sector in marginal rural areas play a very transcendental role [25] when it comes to enhancing the value of local resources, maintaining, and increasing population levels and nurturing the territorial identity of these places [60], and all this in spite of the decline in the population of these rural areas of Andalusia [61]. These organizations can play a vital role when it comes to creating a suitable atmosphere to encourage new people to come and settle, and integrating them into rural communities [62]. In this way, they can also contribute to spatial justice [15].
Finally, one of the aspects that we believe is most important to highlight when discussing the “Others” group is the social repercussions of their projects, both because of the way they deal with aspects, collectives, and needs that should in essence be covered by the public sector and due to the fact that they help to strengthen rural areas and make them more resilient. In many areas, this congregation of actors from the public, private, and third sectors is creating a new, more holistic, and systemic vision of rural development, known as “vitality policy”, which is based on the idea of place as a space for life [63], therefore going beyond the traditional approach based on improving business and industrial competitiveness and encouraging entrepreneurship as the main pillars of rural development [7]. This was manifested during the COVID-19 pandemic, in which associations of this kind have played a leading role, together with the public sector, in attempts to mitigate its effects [64,65]. This should not hinder us from calling on the third sector to step up and take on a more important role in the implementation of projects and in the making of decisions and strategic planning. The facts that these associations are often underrepresented in small villages and in LAGs and have sometimes lacked the necessary strength of leadership have often forced them to take a back seat in the implementation of rural development [20].

Author Contributions

Conceptualization, E.C.-G. and F.N.-V.; methodology, J.A.C.-P.; software, N.R.-M.; investigation, E.C.-G., F.N.-V. and J.A.C.-P.; writing—original draft preparation, E.C.-G., F.N.-V. and J.A.C.-P.; writing—review and editing, E.C.-G. and F.N.-V.; Visualization, N.R.-M. All authors have read and agreed to the published version of the manuscript.

Funding

Ministry of Economy, Industry, and Competitiveness, Research Project “Successes and failures in the practice of neo-endogenous rural development in the European Union (1991–2013), RURALWIN”. CSO2017-89657-P.

Institutional Review Board Statement

Not applicable.

Informed Consent Statement

Not applicable.

Data Availability Statement

Not applicable.

Acknowledgments

We appreciate the work undertaken by Enrique Fernández Seguí in for the layout of the work.

Conflicts of Interest

The authors declare no conflict of interest. The funders had no role in the design of the study; in the collection, analyses, or interpretation of data; in the writing of the manuscript; or in the decision to publish the results.

References

  1. Bassi, A.; Fabbri, A. Under Pressure: Evolution of the Social Economy Institutional Recognition in the EU. Ann. Public Coop. Econ. 2020, 91, 411–433. [Google Scholar] [CrossRef]
  2. Cafferata, R. Nonprofit Organizations, Privatization and the Mixed Economy: A Managerial Economics Perspective. Ann. Public Coop. Econ. 2002, 68, 665–688. [Google Scholar] [CrossRef]
  3. Rose-Ackerman, S. Altruism, Nonprofits, and Economic Theory. J. Econ. Lit. 1996, 34, 701–728. [Google Scholar]
  4. Lam, M. Public Leadership Under Resource Constraints: An Examination of the U.S. Nonprofit Sector. J. Leadersh. Stud. 2020, 14, 89–95. [Google Scholar] [CrossRef]
  5. Etxezarreta, E.; Bakaikoa, B. Changes in the Welfare State and Their Impact on the Social Economy: Contributions to the Theoretical Debate from a Systemic and Comparative Approach. Ann. Public Coop. Econ. 2012, 83, 259–280. [Google Scholar] [CrossRef]
  6. Pestoff, V. Towards a Paradigm of Democratic Participation: Citizen Participation and Co-Production of Personal Social Services in Sweden. Ann. Public Coop. Econ. 2009, 80, 197–224. [Google Scholar] [CrossRef]
  7. Makkonen, T.; Kahila, P. Vitality Policy as a Tool for Rural Development in Peripheral Finland. Growth Chang. 2021, 52, 706–726. [Google Scholar] [CrossRef]
  8. Hudson, R. New Geographies and Forms of Work and Unemployment and Public Policy Innovation in Europe. Tijdschr. Econ. Soc. Geogr. 2002, 93, 316–335. [Google Scholar] [CrossRef]
  9. Rantamäki, N.; Kattilakoski, M. On the Trail of Local Welfare Innovations in Rural Finland. Reg. Sci. Policy Pract. 2019, 11, 329–343. [Google Scholar] [CrossRef]
  10. Shucksmith, M. Endogenous Development, Social Capital and Social Inclusion: Perspectives from LEADER in the UK. Sociol. Rural. 2002, 40, 208–218. [Google Scholar] [CrossRef]
  11. Ray, C. Neo-Endogenous Rural Development in the EU. In The Handbook of Rural Studies; SAGE Publications Ltd.: London, UK, 2006. [Google Scholar]
  12. Steiner, A.; Teasdale, S. Unlocking the Potential of Rural Social Enterprise. J. Rural Stud. 2019, 70, 144–154. [Google Scholar] [CrossRef]
  13. European Commission; Directorate-General for Agriculture and Rural Development. Leader Approach A Basic Guide; Publications Office: Luxembourg, 2006; ISBN 978-92-79-02044-5. [Google Scholar]
  14. Furmankiewicz, M.; Janc, K.; Macken-Walsh, Á. The Impact of EU Governance and Rural Development Policy on the Development of the Third Sector in Rural Poland: A Nation-Wide Analysis. J. Rural Stud. 2016, 43, 225–234. [Google Scholar] [CrossRef]
  15. Shucksmith, M.; Brooks, E.; Madanipour, A. LEADER and Spatial Justice. Sociol. Rural. 2021, 61, 322–343. [Google Scholar] [CrossRef]
  16. Steiner, A.; Calò, F.; Shucksmith, M. Rurality and Social Innovation Processes and Outcomes: A Realist Evaluation of Rural Social Enterprise Activities. J. Rural Stud. 2021, in press. [Google Scholar] [CrossRef]
  17. Olmedo, L.; van Twuijver, M.; O’Shaughnessy, M. Rurality as Context for Innovative Responses to Social Challenges–The Role of Rural Social Enterprises. J. Rural Stud. 2021, in press. [Google Scholar] [CrossRef]
  18. Richter, R. Rural Social Enterprises as Embedded Intermediaries: The Innovative Power of Connecting Rural Communities with Supra-Regional Networks. J. Rural Stud. 2019, 70, 179–187. [Google Scholar] [CrossRef]
  19. Vercher, N.; Barlagne, C.; Hewitt, R.; Nijnik, M.; Esparcia, J. Whose Narrative Is It Anyway? Narratives of Social Innovation in Rural Areas – A Comparative Analysis of Community-Led Initiatives in Scotland and Spain. Sociol. Rural. 2021, 61, 163–189. [Google Scholar] [CrossRef]
  20. Furmankiewicz, M.; Macken-Walsh, Á. Government within Governance? Polish Rural Development Partnerships through the Lens of Functional Representation. J. Rural Stud. 2016, 46, 12–22. [Google Scholar] [CrossRef]
  21. Navarro, F.; Woods, M.; Cejudo, E. The LEADER Initiative Has Been a Victim of Its Own Success. The Decline of the Bottom-Up Approach in Rural Development Programmes. The Cases of Wales and Andalusia. Sociol. Rural. 2015, 56, 270–288. [Google Scholar] [CrossRef]
  22. Ostrom, E. El Gobierno de Los Bienes Comunes: La Evolución de las Instituciones de Acción Colectiva; Fondo de Cultura Económica: México City, México, 2000; ISBN 978-607-16-0617-4. [Google Scholar]
  23. Ostrom, E.; Vallina, M.M. Comprender La Diversidad Institucional; Elibro Catedra; Fondo de Cultura Económica, KRK Ediciones: Oviedo, España, 2015; ISBN 978-607-16-2554-0. [Google Scholar]
  24. Lovell, S.A.; Gray, A.; Boucher, S.E. Economic Marginalization and Community Capacity: How Does Industry Closure in a Small Town Affect Perceptions of Place? J. Rural Stud. 2018, 62, 107–115. [Google Scholar] [CrossRef]
  25. Kluvankova, T.; Nijnik, M.; Spacek, M.; Sarkki, S.; Perlik, M.; Lukesch, R.; Melnykovych, M.; Valero, D.; Brnkalakova, S. Social Innovation for Sustainability Transformation and Its Diverging Development Paths in Marginalised Rural Areas. Sociol. Rural. 2021, 61, 344–371. [Google Scholar] [CrossRef]
  26. Bourqia, R.; Sili, M. A Kaleidoscope of Ideas for Rethinking Development in the Global South. In New Paths of Development: Perspectives from the Global South; Bourqia, R., Sili, M., Eds.; Sustainable Development Goals Series; Springer International Publishing: Cham, Switzerland, 2021; pp. 1–21. ISBN 978-3-030-56096-6. [Google Scholar]
  27. Islam, S.M. Impact Investing in Social Sector Organisations: A Systematic Review and Research Agenda. Account. Financ. 2021, n/a, 1–29. [Google Scholar] [CrossRef]
  28. OECD. The New Rural Paradigm: Policies and Governance; OECD Publishing: Paris, France, 2006. [Google Scholar]
  29. Molinero Hernando, F. El espacio rural de España: Evolución, delimitación y clasificación. Cuad. Geogr. 2019, 58, 19–56. [Google Scholar] [CrossRef]
  30. De Cos Guerra, O.; Reques Velasco, P. Vulnerabilidad Territorial y Demográfica En España. Posibilidades Del Análisis Multicriterio y La Lógica Difusa Para La Definición de Patrones Espaciales. Investig. Reg.-J. Reg. Res. 2019, 2019, 201–225. [Google Scholar]
  31. Reig Martínez, E.; Goerlich Gisbert, F.J.; Cantarino Martí, I. Delimitación de Áreas Rurales y Urbanas a Nivel Local: Demografía, Coberturas del Suelo y Accesibilidad; Fundación BBVA: Bilbao, España, 2016. [Google Scholar]
  32. Brezzi, M.; Dijkstra, L.; Ruiz, V. OECD Extended Regional Typology: The Economic Performance of Remote Rural Regions. OECD Reg. Dev. Work. Pap. 2011, 2011/06, 1–21. [Google Scholar] [CrossRef]
  33. Del Valle Ramos, C.; Almoguera Sallent, P. Envejecimiento Demográfico y (Des)Población En Las Ciudades Medias Interiores de Andalucía (2008–2018). Cuad. Geogr. 2020, 59, 263–283. [Google Scholar] [CrossRef]
  34. Cañete Pérez, J.A.; Cejudo García, E.; Navarro Valverde, F.A. Proyectos fallidos de desarrollo rural en Andalucía. Boletín de la Asociación de Geógrafos Españoles 2018, 78, 270–301. [Google Scholar] [CrossRef] [Green Version]
  35. Cejudo, E.; Cañete, J.; Navarro, F.; Moya, N. Entrepreneurs and Territorial Diversity: Success and Failure in Andalusia 2007–2015. Land 2020, 9, 262. [Google Scholar] [CrossRef]
  36. Cañete, J.; Navarro, F.; Cejudo, E. Territorially Unequal Rural Development: The Cases of the LEADER Initiative and the PRODER Programme in Andalusia (Spain). Eur. Plan. Stud. 2018, 26, 726–744. [Google Scholar] [CrossRef]
  37. Cejudo García, E.; Navarro Valverde, F.A.; Camacho Ballesta, J.A. Perfil y características de los beneficiarios finales de los Programas de Desarrollo Rural en Andalucía. LEADER+ y PRODER2 (2000–2006). Cuad. Geogr. 2017, 56, 155–175. [Google Scholar] [CrossRef]
  38. Bidet, E.; Eum, H. Une Analyse Socio-économique de La Trajectoire Institutionnelle de l’entreprise Sociale: Le Cas de La Corée Du Sud. Ann. Public Coop. Econ. 2020, 2020, 12310. [Google Scholar] [CrossRef]
  39. Hahn, S.; McCabe, A. Welfare-to-work and the Emerging Third Sector in South Korea: Korea’s Third Way? Int. J. Soc. Welf. 2006, 15, 314–320. [Google Scholar] [CrossRef]
  40. Monzon, J.; Chaves-Avila, R. The European Social Economy: Concept and Dimensions of the Third Sector. Ann. Public Coop. Econ. 2008, 79, 549–577. [Google Scholar] [CrossRef]
  41. Fundación La Caixa, ESADE y PwC. La Reacción Del Tercer Sector Social al Entorno de Crisis; PwC, Exade, La Caixa: Valencia, Spain, 2014; p. 76. [Google Scholar]
  42. Chaney, P.; Wincott, D. Envisioning the Third Sector’s Welfare Role: Critical Discourse Analysis of ‘Post-Devolution’ Public Policy in the UK 1998–2012. Soc. Policy Adm. 2014, 48, 757–781. [Google Scholar] [CrossRef]
  43. Darby, S. Dynamic Resistance: Third-Sector Processes For Transforming Neoliberalization. Antipode 2016, 48, 977–999. [Google Scholar] [CrossRef]
  44. Puzuelo-Monfort, J. The Monfort Plan; John Wiley & Sons: Hoboken, NJ, USA, 2012; ISBN 978-1-119-19746-1. [Google Scholar]
  45. Valentinov, V. Non-Market Institutions in Economic Development: The Role of the Third Sector. Dev. Chang. 2008, 39, 477–485. [Google Scholar] [CrossRef]
  46. Cheverton, J. Holding Our Own: Value and Performance in Nonprofit Organisations. Aust. J. Soc. Issues 2007, 42, 427–436. [Google Scholar] [CrossRef]
  47. Onyx, J. Organizations, Voluntary. In The Blackwell Encyclopedia of Sociology; American Cancer Society: Atlanta, GA, USA, 2019; pp. 1–4. ISBN 978-1-4051-6551-8. [Google Scholar]
  48. Wilson-Thomas, J. Time’s up: Analyzing the Feminist Potential of Time Banks. Gend. Work Organ. 2021, 28, 2114–2131. [Google Scholar] [CrossRef]
  49. Fyfe, N.R. Making Space for “Neo-Communitarianism”? The Third Sector, State and Civil Society in the UK. Antipode 2005, 37, 536–557. [Google Scholar] [CrossRef]
  50. Collister, S. Social Media and The Third Sector; Waddington, S., Ed.; John Wiley & Sons, Inc.: New York, NY, USA, 2015; pp. 221–228. ISBN 978-1-118-40484-3. [Google Scholar] [CrossRef]
  51. Thompson, P.; Williams, R.; Kwong, C. Factors Holding Back Small Third Sector Organizations’ Engagement with the Local Public Sector. Nonprofit Manag. Leadersh. 2017, 27, 513–531. [Google Scholar] [CrossRef]
  52. Shortall, S.; McKee, A.; Sutherland, L.-A. The Performance of Occupational Closure: The Case of Agriculture and Gender. Sociol. Rural. 2020, 60, 40–57. [Google Scholar] [CrossRef]
  53. Leyshon, M.; Leyshon, C.; Walker, T.; Fish, R. More than Sweat Equity: Young People as Volunteers in Conservation Work. J. Rural Stud. 2021, 81, 78–88. [Google Scholar] [CrossRef]
  54. Yarker, S.; Heley, J.; Jones, L. Stewardship of the Rural: Conceptualising the Experiences of Rural Volunteering in Later Life. J. Rural Stud. 2020, 76, 184–192. [Google Scholar] [CrossRef]
  55. Dell’Olio, M.; Hassink, J.; Vaandrager, L. The Development of Social Farming in Italy: A Qualitative Inquiry across Four Regions. J. Rural Stud. 2017, 56, 65–75. [Google Scholar] [CrossRef]
  56. Elsen, S.; Fazzi, L. Extending the Concept of Social Farming: Rural Development and the Fight against Organized Crime in Disadvantaged Areas of Southern Italy. J. Rural Stud. 2021, 84, 100–107. [Google Scholar] [CrossRef]
  57. Klärner, A.; Knabe, A. Social Networks and Coping with Poverty in Rural Areas. Sociol. Rural. 2019, 59, 447–473. [Google Scholar] [CrossRef]
  58. Dijkstra, L.; Garcilazo, E.; McCann, P. The Effects of the Global Financial Crisis on European Regions and Cities. J. Econ. Geogr. 2015, 15, 935–949. [Google Scholar] [CrossRef]
  59. Copus, A.; Kahila, P.; Fritsch, M.; Dax, T.; Kovács, K.; Tagai, G.; Weber, R.; Grunfelder, J.; Löfving, L.; Moodie, J. ESCAPE. European Shrinking Rural Areas: Challenges, Actions and Perspectives for Territorial Governance: Applied Research; Final Report. Version 21/12/2020; ESPON: Luxembourg, 2020. [Google Scholar]
  60. Mahon, M.; Hyyryläinen, T. Rural Arts Festivals as Contributors to Rural Development and Resilience. Sociol. Rural. 2019, 59, 612–635. [Google Scholar] [CrossRef]
  61. Larrubia Vargas, R.; Natera Rivas, J.J. Envejecimiento y Masculinización de La Población Rural Andaluza. In Despoblación y Transformaciones Sociodemográficas de los Territorios Rurales: Los Casos de España, Italia y Francia; Cejudo, E., Navarro, F.A., Eds.; Universidad de Salento: Lecce, Italy, 2020; pp. 121–152. ISBN 978-88-8305-157-9. [Google Scholar]
  62. Kumpulainen, K.; Soini, K. How Do Community Development Activities Affect the Construction of Rural Places? A Case Study from Finland. Sociol. Rural. 2019, 59, 294–313. [Google Scholar] [CrossRef]
  63. Nogué, J. El reencuentro con el lugar: Nuevas ruralidades, nuevos paisajes y cambio de paradigma. Doc. D’anal. Geogr. 2016, 62, 489–502. [Google Scholar] [CrossRef]
  64. Coram, V.; Louth, J.; Tually, S.; Goodwin-Smith, I. Community Service Sector Resilience and Responsiveness during the COVID-19 Pandemic: The Australian Experience. Aust. J. Soc. Issues 2021, 56, 559–578. [Google Scholar] [CrossRef] [PubMed]
  65. Martins, V.; Ferreira, M.; Braga, V. The Role of the Fourth Sector in the Context of the COVID-19 Pandemic. Strateg. Chang. 2021, 30, 179–184. [Google Scholar] [CrossRef]
Figure 1. Methodological flow chart (copyright belongs to the authors).
Sustainability 13 13976 g001
Figure 2. Categorization of Andalusian municipalities on the basis of time distance to service centers. Source: Reig et al. [31], adapted by the authors.
Sustainability 13 13976 g002
Figure 3. Territorial distribution of the projects executed by associations in relation to the total of projects started. 2000–2015 (%). Source: Prepared by the authors using data from the Regional Government of Andalusia and types of rural area adapted from Reig et al. [31].
Sustainability 13 13976 g003
Figure 4. Territorial distribution of the projects executed by associations in relation to the total number of projects initiated. 2000–2006 (%). Source: Prepared by the authors using data from the Regional Government of Andalusia and types of rural area adapted from Reig et al. [31].
Sustainability 13 13976 g004
Figure 5. Territorial distribution of the projects executed by associations in relation to the total number of projects initiated. 2007–2015 (%). Source: Prepared by the authors using data from the Regional Government of Andalusia and types of rural area adapted from Reig et al. [31].
Sustainability 13 13976 g005
Figure 6. Territorial distribution of the projects executed by associations as a proportion of the total number of projects executed. 2000–2015 (%). Source: Prepared by the authors using data from the Regional Government of Andalusia and types of rural area adapted from Reig et al. [31].
Sustainability 13 13976 g006
Figure 7. Territorial distribution of the projects executed by associations as a proportion of the total number of projects executed. 2000–2006 (%). Source: Prepared by the authors using data from the Regional Government of Andalusia and types of rural area adapted from Reig et al. [31].
Sustainability 13 13976 g007
Figure 8. Territorial distribution of the projects executed by associations as a proportion of the total number of projects executed. 2000–2006 (%). Source: Prepared by the authors using data from the Regional Government of Andalusia and types of rural area adapted from Reig et al. [31].
Sustainability 13 13976 g008
Figure 9. Territorial distribution of the investment made by associations. 2000–2015 (%). Source: Prepared by the authors using data from the Regional Government of Andalusia and types of rural area adapted from Reig et al. [31].
Sustainability 13 13976 g009
Figure 10. Territorial distribution of the investments made by associations. 2000–2006 (%). Source: Prepared by the authors using data from the Regional Government of Andalusia and types of rural area adapted from Reig et al. [31].
Sustainability 13 13976 g010
Figure 11. Territorial distribution of the investment made by associations. 2007–2015 (%). Source: Prepared by the authors using data from the Regional Government of Andalusia and types of rural area adapted from Reig et al. [31].
Sustainability 13 13976 g011
Table 1. Types of promoters in the “Others” category.
Identification
IBusiness associations
IIWomen’s associations
IIIYoung People’s associations
IVAssociations helping vulnerable people/cooperation
VCultural and leisure associations
VINeighborhood associations
VIIReligious associations
VIIITrade union associations
IXEducational associations
XPGI Control Bodies
Table 2. Socioeconomic indicators according to time distance to cities.
VariablesType 1
Urban
Type 2
<15
Type 3
15 < 30
Type 4
30 < 45
Type 5
45 < 60
Type 6
≥60
Total
N° Municipalities4668168170156165773
Area (Km2)5896451521,13121,22515,73519,28487,786
Population (thousands)4,158,201791,0751,505,9901,042,169534,866357,5438,389,844
Density (inhab/Km2)7051757149341996
Travel time (minutes)4112338527340
Altitude (m)259363361477601713504
Women (%)51.549.749.249.849.749.750.5
Men (%)48.550.350.850.250.350.349.5
Av. Pop/Municipality90,39611,633896461303429216710,854
Real Growth 2015–2007168,94092,00699,42820,049–8765–19,103352,555
Real Growth 2011–19612,033,778421,615407,367–53,505–172,322–251,1182,385,814
Age 0–14 (%)16.318.317.015.614.413.616.3
Age 15–64 (%)68.969.869.167.366.465.268.5
Age ≥65 (%)14.811.913.917.219.221.215.2
Ageing Index 90658211013315593
Average Age38384143454643
% Affil. Gen. Reg.*80574338353463
% Affil. Agric. Reg.*2193542444218
* In the Spanish Social Security system, there are separate sections or regimes for General Workers and Agricultural Workers. “Affil. Gen. Reg.” refers to workers affiliated to the General Regime, while “Affil. Agric. Reg.” refers to those affiliated to the Agricultural Regime.
Table 3. Implemented and non-implemented projects in Andalusia (2000–2015).
Promotor2000–20062007–20152000–2015
ImpNon ImpTotalSuccImpNon ImpTotalSuccImpNon ImpTotalSucc
Business associations 255282839.11282283560.63832566391.5
Women’s associations 6467010.73552870.799581571.7
Young People’s associations 50 5100.0124163.0172214.3
Associations helping vulnerable people and cooperations 92101029.272821540.9164922561.8
Cultural and leisure associations 156221787.11001362360.72561584141.6
Neighborhood associations5155610.22026460.871311022.3
Religious associations102610817.060481081.3162542163.0
Trade union associations6767311.2741001740.71411062471.3
Educational associations192219.51124350.53026561.2
PGI Control Bodies 2212322.01210221.23411453.1
Total833869199.752471012340.7135779621531.7
Imp—Implemented. Non Imp—Non implemented. Succ—Successful.
Table 4. Levels of Investment in Andalusia 2000–2015.
Promoter2000–20062007–20152000–2015
InvestmentInvestment/ ProjectsGrants/InvestmentInvestmentInvestment/ProjectsGrants/InvestmentInvestmentInvestment/ProjectsGrants/Investment
Business associations 11,423,66744,79965.63,948,12030,84575.215,371,78940,13568.0
Women’s associations 1,032,49416,13382.2736,54021,04469.91,769,03417,86977.1
Young People’s associations 423,03784,60733.0793,95566,16348.01,216,99271,58842.8
Associations helping vulnerable people and cooperation 16,785,551182,45229.08,467,997117,61145.325,253,548153,98534.5
Cultural and leisure associations 7,039,11445,12363.83,526,35035,26455.910,565,46441,27161.2
Neighborhood associations2,880,75856,48543.9885,52444,27689.63,766,28253,04654.6
Religious associations8,191,10980,30550.47,127,481118,79149.715,318,59094,55950.1
Trade union associations2,230,91833,29773.52,208,79529,84978.64,439,71331,48776.0
Educational associations1,726,35790,86154.0915,40683,21943.62,641,76288,05950.4
PGI Control Bodies 2,247,757102,17154.5967,83780,65378.93,215,59594,57661.9
Total53,980,76464,80350.029,578,00456,44757.283,558,76861,57652.6
Table 5. Successful and failed projects attributed to a specific municipality (in Andalusia 2000–2015).
Types of
Municipalities
2000–20062007–20152000–2015
Mun. With No Proj.ProjectsMun. With No Proj.ProjectsMun. With No Proj.Projects
ExecNot
Exec
TotalSucc. RatioExecNot
Exec
TotalSucc. RatioExecNot
Exec
TotalSucc. Ratio
1Urban5252270.93514 24380.3783926650.60
2Total11272290.9362720470.57285422760.71
Intermed.9252270.9352320430.53244822700.69
Rural22 21.0014 41.0046061.00
3Total35153161690.91231011132140.47882541293830.66
Intermed.21114131270.901174951690.44531881082960.64
Rural14393420.93122718450.60356621870.76
4Total27181192000.91161171172340.50842981364340.69
Intermed.13118121300.91589801690.5344207922990.69
Rural14637700.90112837650.434091441350.67
5Total23116151310.892490811710.5375206963020.68
Intermed.3546600.9024738850.5518101441450.70
Rural20629710.87224343860.5057105521570.67
6Total27106151210.882874531270.5876180682480.73
Intermed.1416470.8722415390.62116521860.76
Rural26659740.88255038880.5765115471620.71
Total126608696770.901004234088310.51359103147715080.68
Exec—Executed. Mun—Municipalities. Succ—Successful.
Table 6. Investment attributed to a specific municipality according to the different types of territory in Andalusia (2000–2015).
Type of Territory2000–20062007–20152000–2015
Investm.Inv
Asso/Inv
Total
Gra/InvInv/ProjInvestm.Inv
Asso/Inv
Total
Gra/InvInv/ProjInvestm.Inv
Asso/Inv
Total
Gra/InvInv/Proj
1Urban1,366,24511.069.854,650967,7829.284.069,1272,334,0279.975.759,849
2All2,592,4225.439.496,0161,520,6265.169.056,3194,113,0485.350.376,168
Intermed.2,423,4345.537.696,9371,465,8075.567.863,7313,889,2405.549.081,026
Rural168,9893.865.084,49454,8191.799.613,705223,8082.973.537,301
3All15,998,2968.232.8104,5645,552,240557.154,97321,550,5367.039.184,845
Intermed.13,239,8359.131.2116,1393,918,5694.655.952,95417,158,4047.536.991,268
Rural2,758,4625.540.570,7301,633,6716.260.260,5064,392,1335.847.866,547
4All9,191,853551.350,7846,850,5416.759.858,55216,042,3945.655.053,834
Intermed.6,077,9885.457.551,5085,346,7648.262.360,07611,424,7526.459.755,192
Rural3,113,8654.439.349,4261,503,777451.253,7064,617,6424.343.250,743
5All8,813,9056.843.875,9826,388,97710.153.270,98915,202,8827.947.773,800
Intermed.3,999,7216.655.274,0693,700,14213.461.878,7267,699,8638.758.476,236
Rural4,814,184734.377,6482,688,8347.641.562,5317,503,0197.236.971,457
6All5,343,2625.458.550,4085,299,368839.571,61310,642,6306.449.059,126
Intermed.2,572,4687.448.562,7433,273,76018.627.5136,4075,846,22811.236.789,942
Rural2,770,7944.367.742,6282,025,6084.258.940,5124,796,4024.364.041,708
Total43.305.9836.543.771.22726,579,5346.955.062.83669,885,5186.648.067,784
Publisher’s Note: MDPI stays neutral with regard to jurisdictional claims in published maps and institutional affiliations.

