Article

Influence Mechanism of Cyanobacterial Extracellular Polymeric Substances on the Water Quality in Dynamic Water Supply System

1
School of Environmental Science and Engineering, Yangzhou University, 196 Huayang West Road, Yangzhou 225127, China
2
Jiangsu Surveying and Design Institute of Water Resource Co., Ltd., Yangzhou 225000, China
*
Author to whom correspondence should be addressed.
Sustainability 2021, 13(24), 13913; https://doi.org/10.3390/su132413913
Submission received: 27 October 2021 / Revised: 3 December 2021 / Accepted: 9 December 2021 / Published: 16 December 2021

Abstract

:
As a kind of high-organic-content contamination source, extracellular polymeric substances (EPS) secreted by cyanobacteria have become an important factor restricting the safety of supply water. In the dynamic batch mode water supply system, cyanobacterial EPS accelerated the decay rate of residual chlorine, resulting in a 21–26 times increase of the total viable bacteria count within 72 h. The water turbidity exceeded upper limit of the standards for drinking water quality within 4 h, with an increase of 306–332% within 72 h. The biological stability was reduced with BDOC and AOC increased by 41.4–43.8% and 331–396%, respectively. The main cause is that cyanobacterial EPS act as nutrients and metabolic energy for microorganisms, promoting their metabolic activity and secretion of extracellular organic components. This leads to the metabolic accumulation of tryptophan, fulvic acids and humic acids in the pipeline, thus further promoting the regeneration of bacteria. Compared with the influence of biofilm on pipe wall caused by long-term use of water supply network, the contribution of cyanobacterial EPS to the water contamination of pipe network is increased several times. Therefore, even in the presence of residual chlorine, the secondary contamination caused by cyanobacterial EPS in the water supply system could not be neglected.

1. Introduction

In order to improve the quality and safety of water supply, various water treatment processes in the water treatment plants are continuously upgraded and optimized, but the problem of secondary contamination of water quality in the water supply network is ignored [1,2,3]. The change of drinking water quality in the water supply network is caused by many factors, which are mainly affected by the content of residual pollutants in the treated water from the water purification plant and the breeding degree of microorganisms in the water supply pipeline [4,5]. Under the current implementation conditions of water supply system, the breeding of pipe wall biofilm has become an inevitable response trend with the increase of service life of water distribution pipelines. Studies found that the biofilm formation potential was also related to the chemical and microbiological characteristics of water [6,7,8,9]. Especially for the organic content of water, the organic-carbon availabilities would lead to different biofilm formation [10,11,12]. In addition, dissolved organic matters were difficult to remove effectively in conventional water treatment processes, and the residual content could become the increasing contamination load for tap water [13]. Even if the residual contamination source was trace or the content of BDOC exceeded 0.25 mg/L, it would pose a serious threat to the safety of water supply [13,14]. Therefore, the content level of pollutants that can enter the water pipe network and their migration and transformation in the presence of biofilm on the pipe wall have become a problem that needs to be analyzed and resolved for the current pipe network safety.
Cyanobacteria is a population with high production of dissolved organic metabolites [15]. The extracellular polymeric substance (EPS), which is continuously released to the water environment during the growth and reproduction of cyanobacteria, has gradually become a contamination problem of increasing concern [15,16,17]. The content of organic components of cyanobacteria EPS is as high as 70–80%, which has become a typical source of organic contamination in cyanobacteria-containing source water [16]. Cyanobacteria EPS is often distributed in dispersed phase or dissolved state with low removal efficiency. It is found that the typical water treatment process can not completely remove cyanobacteria during high algae-load period, with the cell density of cyanobacteria in the treated water exceeding 106 cells/ L and the removal rate of dissolved organic matters even as low as 40–60% [18,19]. Pan [20] also explored the conventional water treatment effect of cyanobacteria EPS, and its removal efficiency was only 67.73%. Therefore, the dissolved cyanobacteria EPS with high organic content is very likely to remain in the treated water residue, which has become an important factor restricting the safety of water supply. Organic pollution is the beneficial substrate for the growth of microorganisms in the water of the pipe network [21,22]. Then, how about the material transformation of the parts easy to biological absorption and assimilation in the residual cyanobacteria EPS? What are their effects on water quality and biological stability? Will they cause secondary contamination problems? These will be important parts of water supply safety analysis and management during high cyanobacteria-load period. Based on the current status of cyanobacteria contamination in water sources, the efficiencies of water purification processes and the operation of dynamic water supply pipe networks, the influence of cyanobacteria EPS on water quality safety of pipe network was analyzed to explore its secondary contamination causes.

2. Materials and Methods

2.1. Collection and Preparation of Water Samples

The cyanobacteria-containing water sample was taken from the Yangwan algae-water separation station in Taihu Lake, Wuxi City, Jiangsu Province, China. The sampling work was carried out three times in one month. The obtained cyanobacteria samples were taken back to the laboratory immediately for water quality analysis and EPS extraction. The characteristic parameters of the water sample are: pH 7.5-8.2, turbidity 176-232NTU, chlorophyll a concentration 353.4-428.6μg/L. The cyanobacteria-containing water sample was centrifuged by CR21GIII ultra-high-speed centrifuge (Beckman Coulter, Brea, CA, USA) at 2500× g for 15 min, and the supernatant was extracted and filtered by 0.45 μm filter to obtain the soluble EPS [17,23]. The extracted soluble EPS sample was added with ethanol in a ratio of 1:3, stirred and mixed until the flocculent precipitation appears, and then was placed in a refrigerator at 4 °C overnight to allow the EPS to be fully ethanol precipitated. After ethanol precipitation, the sample was centrifuged at 2500× g for 20 min to remove the supernatant, concentrated with nitrogen using MTN-2800W nitrogen blowing apparatus (Autoscience, Tianjin, China) until the EPS precipitates solid and keep constant weight. At the same time, the equal volume of cyanobacteria water sample was taken for EPS extraction, and the EPS was concentrated to 1 mL volume by alcohol precipitation and nitrogen blowing, which was then put into the experimental raw water according to the effluent quality of different cyanobacteria treatment levels during the cyanobacteria bloom period to prepare different concentrations of cyanobacterial EPS samples for experiment. The experimental raw water was taken from the treated water of Zhongqiao drinking water treatment plant in Wuxi City, Jiangsu Province, China.

2.2. Reagents

The disinfectant used to maintain the residual chlorine in the pipe network is analytical pure sodium hypochlorite. In order to ensure the detection value range of the residual chlorine content during the experimental period, the concentration of the sodium hypochlorite solution is prepared according to the effective chlorine content of 3.5 mg/L, and it is now ready for use.

2.3. Experimental Method

Four sets of small dynamic batch mode water supply network simulation systems formed by water tank, lifting pump, flowmeter and PVC-U pipes were set up for experiment (Figure 1). In the system, the total length of the pipe is 15 m with the diameter of 15 mm. Pipes were connected by elbows. The plastic three-way ball valves were set between the pipe sections and the elbows, and the sampling ports were set at the ball valves. In view of the actual long-term use of the domestic pipeline network, three of the experimental devices were run with tap water for 1 month, and started the formal experiment after the touchable viscous biofilms grew in the pipelines of the three devices. According to the concentration of cyanobacterial EPS in the treated water undergoing conventional treatment processes of drinking water treatment plant during the initial and peak periods of cyanobacteria outbreak in Taihu Lake, the experimental water with low cyanobacterial EPS concentration of 2.2 mg/L and high cyanobacterial EPS concentration of 4.4 mg/L were prepared. The three biofilm-growing experimental systems were set up according to the different concentrations of cyanobacterial EPS: system 1 was pumped into the experimental water without cyanobacterial EPS; system 2 was pumped into the experimental water with 2.2 mg/L cyanobacterial EPS; system 3 was pumped into the experimental water with 4.4 mg/L cyanobacterial EPS. In addition, the control system with no biofilm-growing was also set up and pumped into the experimental water without cyanobacterial EPS. The above four groups of experimental devices were placed indoors (25 °C) for operation, and controlled by the flowmeter to maintain the flow rate in the pipe at 0.5 m/s. The samples were taken from the sampling ports for analysis and testing under different time conditions, and each sample was performed for three parallel tests.

2.4. Detection Indicator

2.4.1. Residual Chlorine

The consumption of chlorine produced by substances in the pipeline was obtained by calculating the decay of residual chlorine of pipe water at different sampling time. The residual chlorine was determined by LH-C01 residual chlorine analyzer (Lohand Biological, Hangzhou, China).

2.4.2. Total Viable Bacteria Count

Based on national standards (GB 4789.2-2016) [24], the total viable bacteria count was determined by plate counting method [25]. The water sample of 200 μL was taken and evenly added onto the petri dish with LB agar medium for culture. The culture process was maintained in 37 °C incubator for 24 h. The rest of the operation and colony counting methods refer to the implementation of the standard [24].

2.4.3. Turbidity

The turbidity was measured by 1900C portable turbidity meter (Hach, Loveland, CO, USA).

2.4.4. Total Organic Carbon (TOC)

TOC was measured with TOC4200 total organic carbon analyzer (Shimadzu, Kyoto, Japan).

2.4.5. Biodegradable Dissolved Organic Carbon (BDOC)

BDOC was determined by the modified suspension culture method [26]. First, the 100 mL water sample from water source of the Yangwan algae-water separation station in Taihu Lake was taken and filtered with 2 μm filter membrane. The liquid was transferred into an erlenmeyer flask, sealed and placed in an incubator at 20 °C to let the bacteria in the water sample grow fully. It was taken out as the water sample inoculum 7 days later. At the same time, another 100 mL water sample was filtered with 0.45 μm mixed cellulose membrane and 20 mL of the filtrate was determined the TOC as the initial value DOC0. Then 50 mL of the filtrate was added with 0.5 mL water sample inoculum, mixed and placed in a 20 °C incubator for 3 days. After culture, it was filtered with a 0.45 μm cellulose acetate membrane needle filter and determined the TOC as DOC3. Finally, the BDOC was calculated as Equation (1) [26].
BDOC = ( DOC 0 DOC 3 ) / 0.4

2.4.6. Assimilable Organic Carbon (AOC)

AOC was determined by flow cytometry counting method [27,28]. First, the 5 mL water sample was filtered with 0.22 μm mixed cellulose membrane and stored at 70 °C for 1h. After that it was taken out and cooled to room temperature, then added with 0.5 mL Evian natural mineral water (water source: Evian, France, containing natural bacteria, the concentration is about 5 × 10³ cells/mL) [28] and cultured at 30 °C for 5 days. After culture, the water sample was stained with SYBR Green I dye. SYBR Green I was first diluted 100 times with dimethyl sulfoxide (DMSO) and used with 5 μL dye / 0.5 mL water sample. After staining, the number of bacteria in the water sample was counted by CytoFLEX flow cytometer (Beckman Coulter, USA), and the AOC concentration was calculated using a unified conversion coefficient of 1.0 × 10⁷ cells/1 µg AOC [27,28].

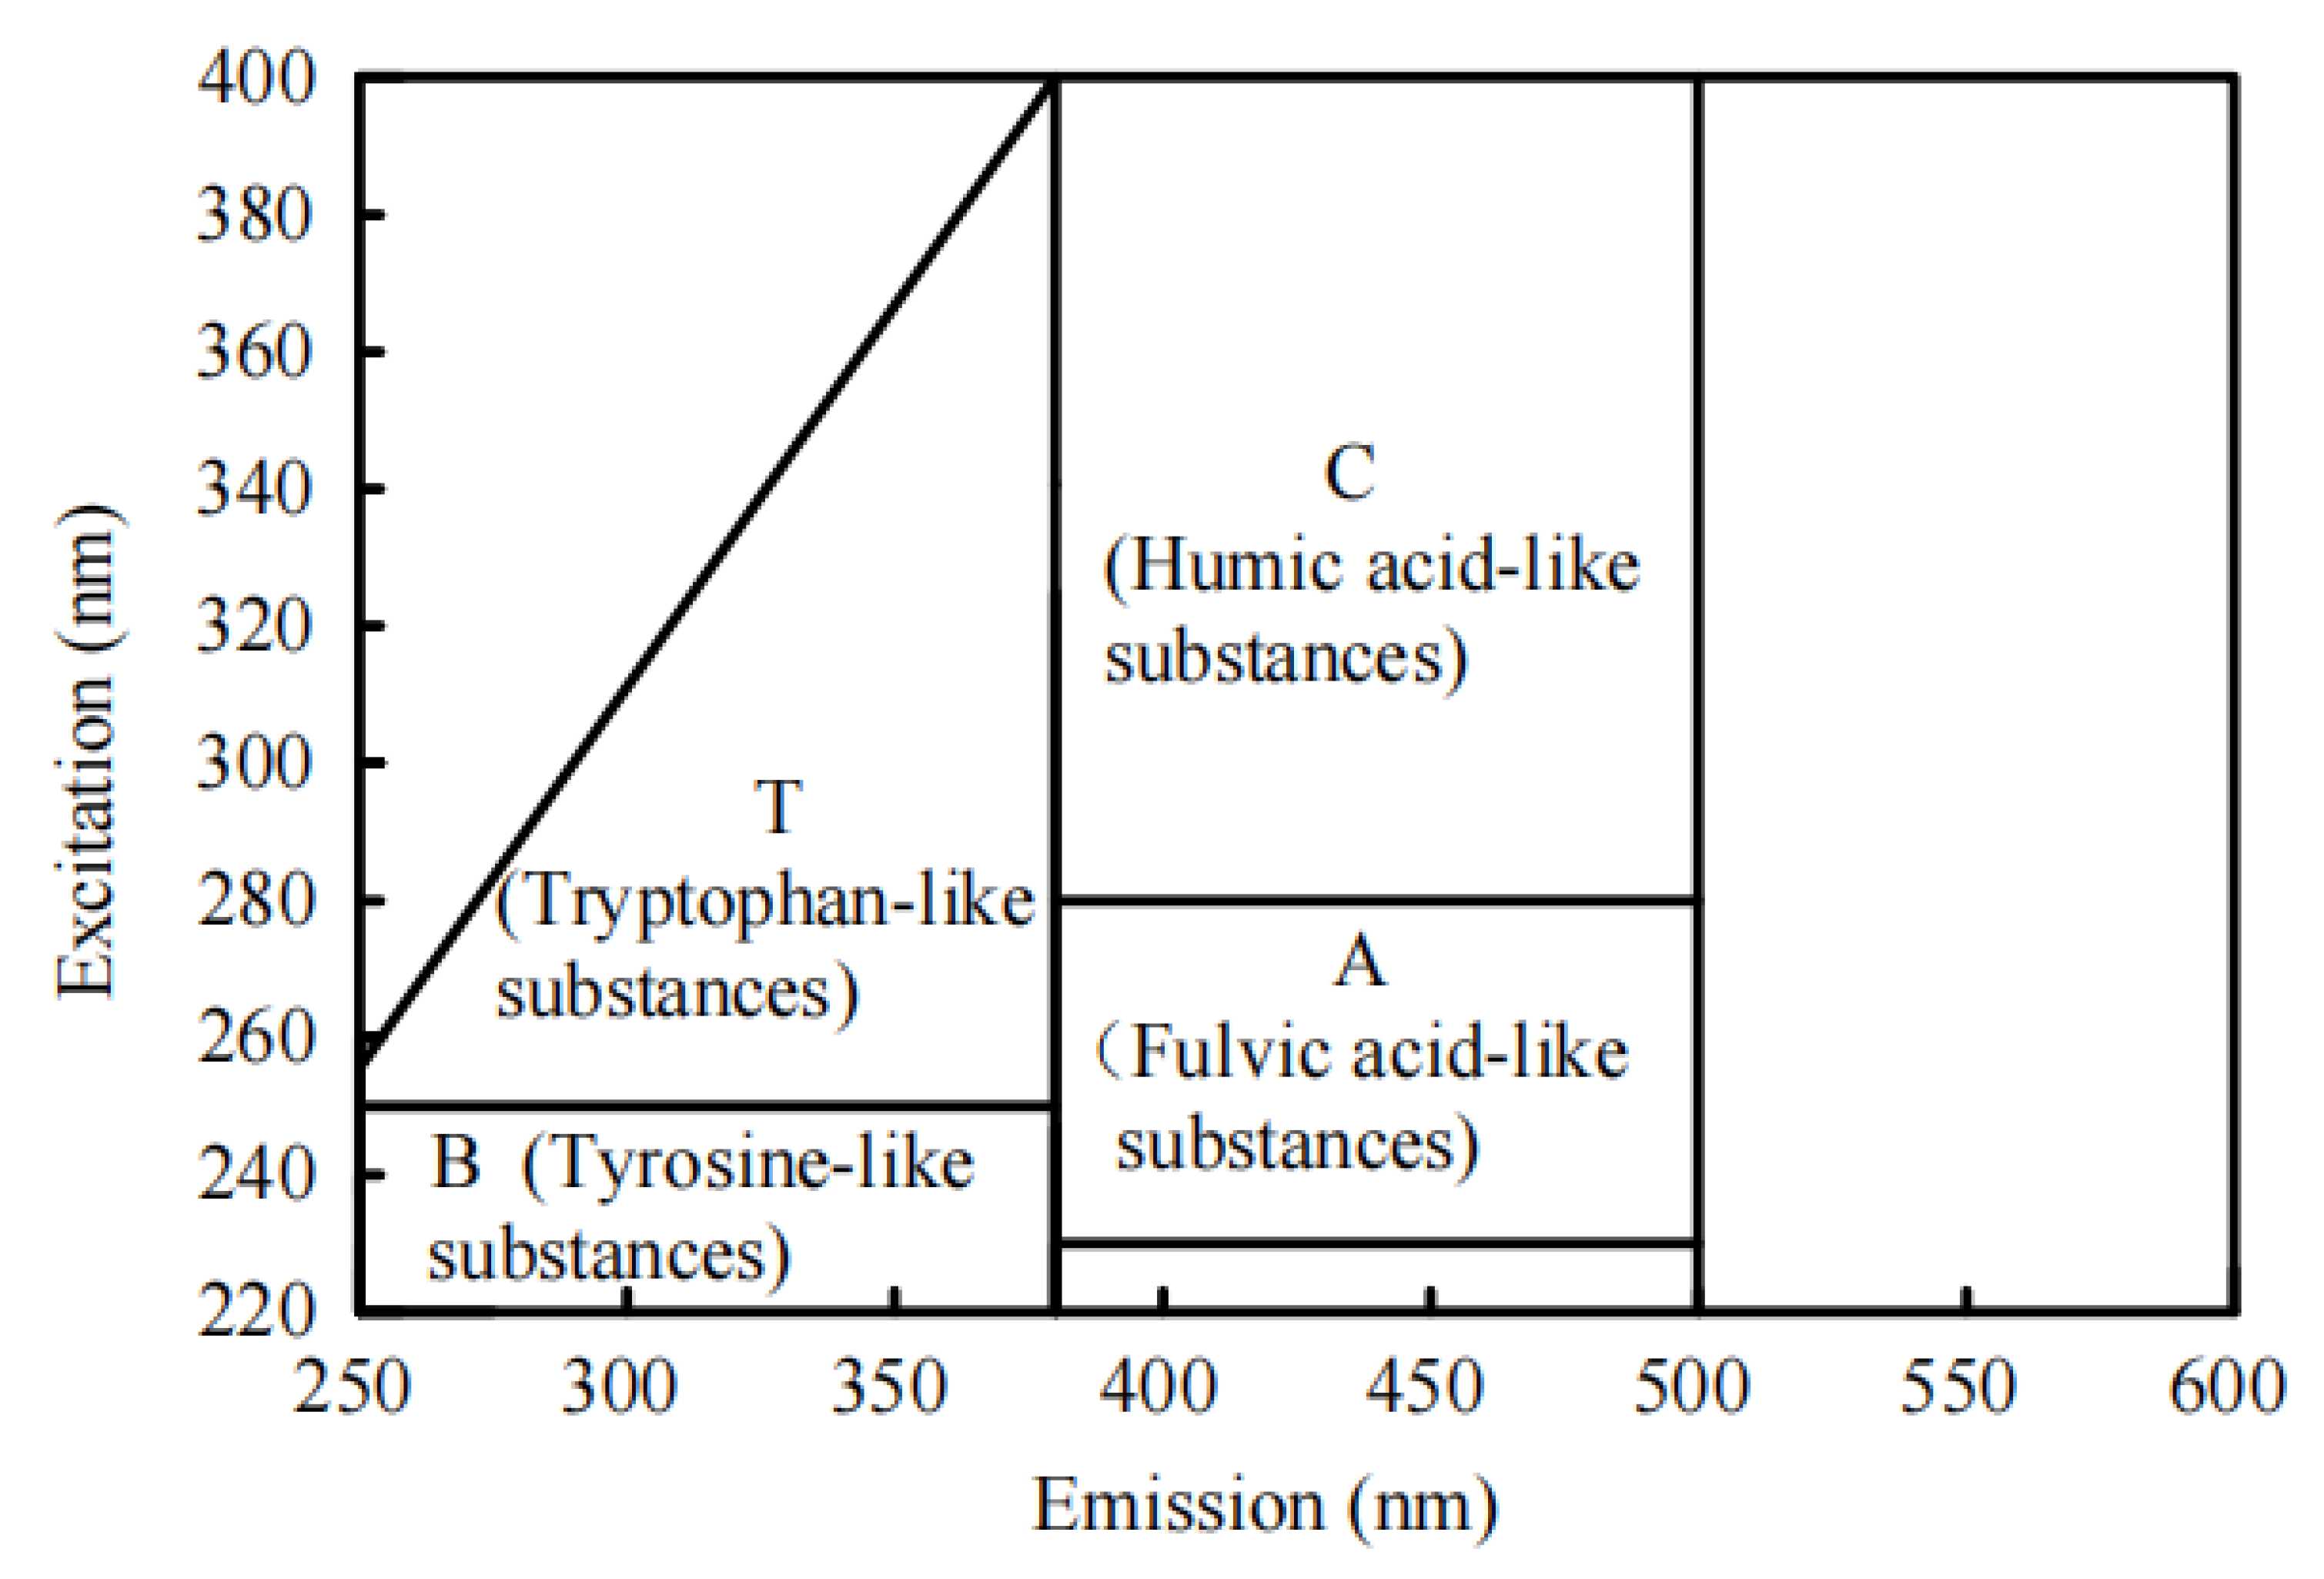
2.4.7. Fluorescent Organic Matters

Fluorescent organic matters were tested using F-7000 fluorescence spectrometer (Hitachi, Tokyo, Japan) with the xenon lamp as excitation light source. When testing, the wavelength of excitation and emission was set at 220–400 nm and 250–600 nm, respectively, and the slit width of excitation and emission was set at λEx = 5 nm and λEm = 1 nm, respectively. Scanning speed was 1200 nm/min. Before each scanning, the ultrapure water was used for a blank control determination to eliminate the influence of pure water. According to the characteristics of the organic matters and excitation and emission wavelength ranges of the cyanobacterial EPS, combined with previous studies [17,29,30,31], the measured spectrum was divided into four peak regions: peak A, peak B, peak T, and peak C. The wavelength boundaries of each region and the main representative characteristic material types are shown in Figure 2.

3. Results and Discussion

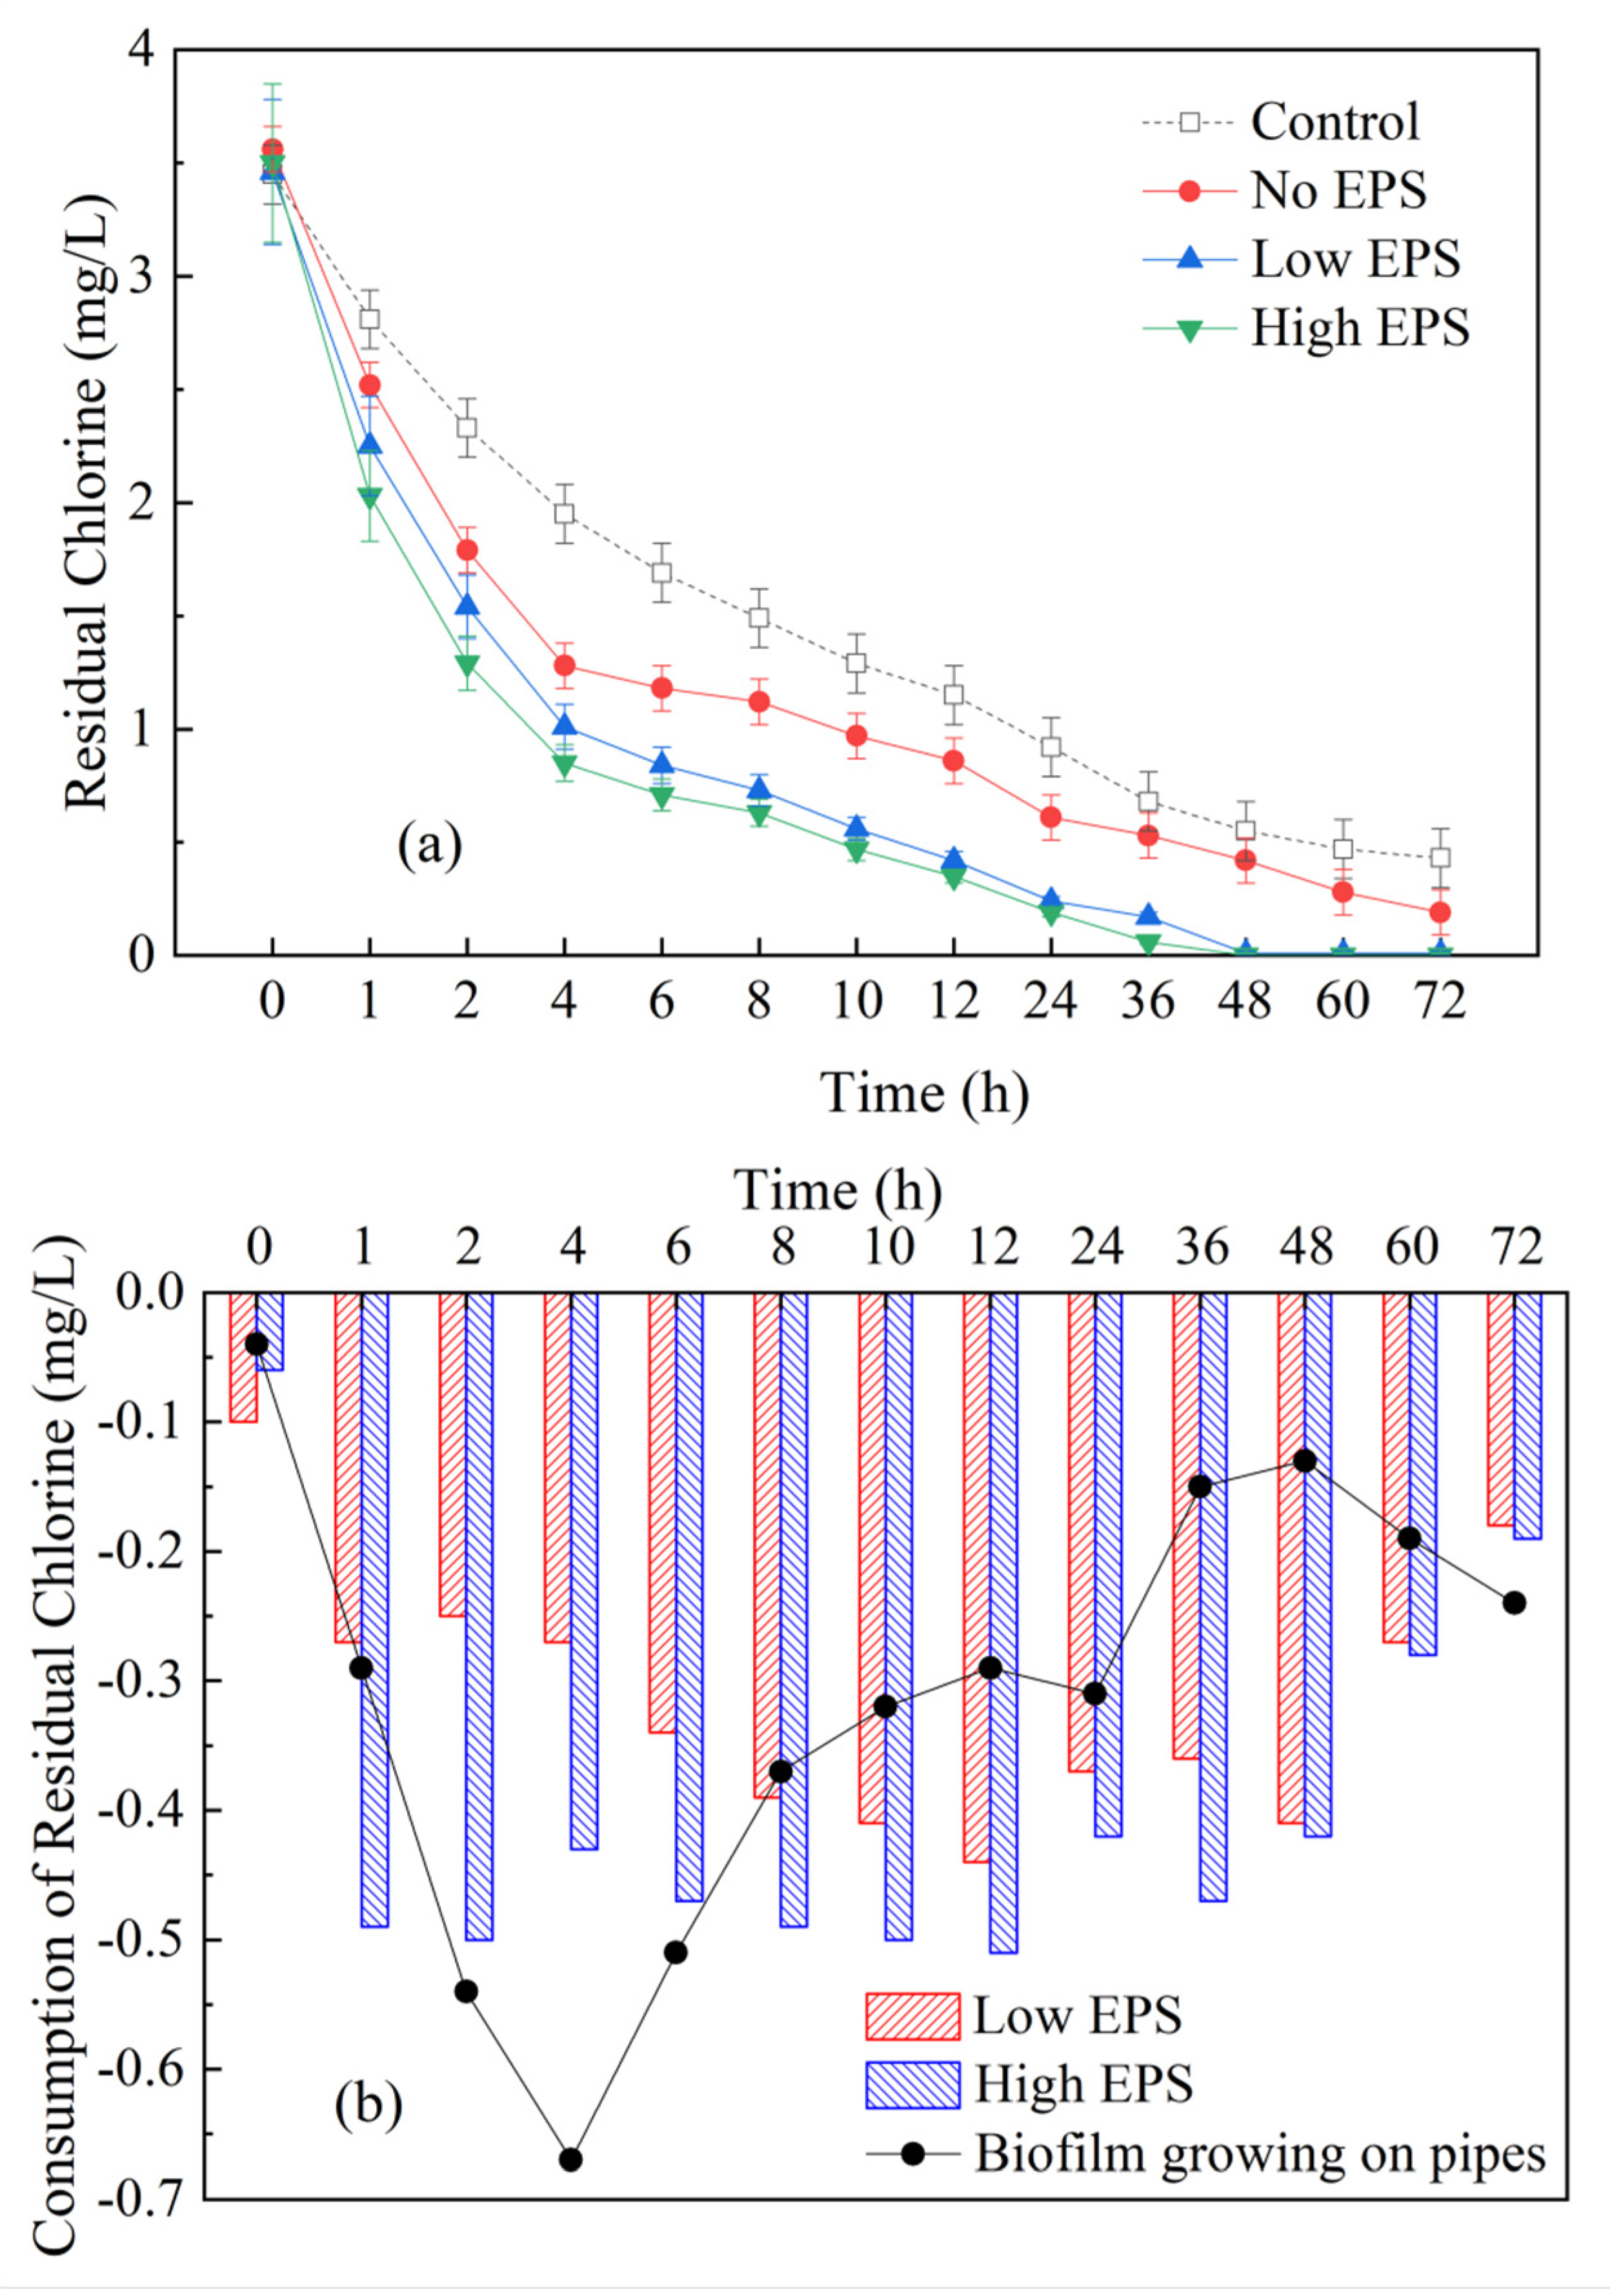
3.1. Influence of Cyanobacterial EPS on Residual Chlorine in Dynamic Water Supply System

According to the standard for drinking water quality in China, the content of free residual chlorine in the effluent of water treatment plant is not less than 0.3 mg/L, and that in the end of pipe network is not less than 0.05 mg/L [32]. The amount of residual chlorine in the four systems of this study all decreased significantly, and the decline rate was the highest in the first 4 h. The rapid decline of residual chlorine in a short time may be due to the quality of the experimental raw water, which could still contain some untreated substances that can chlorinate. Chlorine consumption was carried out by rapid reaction in the first 4 h of their initial contact with chlorine. Of course, the decay rate of residual chlorine in the four systems was not the same. In the control system, substances consuming chlorine was less in the pipe network, and the residual chlorine decayed slowly to 0.43 mg/L after 72 h (Figure 3). The variation of residual chlorine in the three systems with biofilm growing on the pipe walls all showed a more obvious attenuation than that in the control system. Among them, the non-EPS system decreased by 64.0%, the low EPS system decreased by 70.8%, and the high EPS system decreased by 75.7%. These more rapid decrease of residual chlorine is mainly due to the rapid reactions of chlorine with the cyanobacterial EPS components in the water and the biofilm on the pipe wall, which increases the chlorine consumption. The higher the content of EPS, the greater the consumption of chlorine. In the late stage of the reaction, the decay rate of residual chlorine decreased. It might due to the further growth of bacteria in the water under low residual chlorine conditions, which weakened the sterilization ability of low content disinfectants in the environment with high content microorganisms, and reduced the reaction rate. In addition, it can be seen that the decay rate of residual chlorine in the system with high concentration of cyanobacterial EPS was the fastest, and it could basically be reduced to 0 after 36 h; the decay rate of residual chlorine in the system with low concentration of cyanobacterial EPS was the second, which could be reduced to 0 within 48 h; and the decay rate of residual chlorine in the system without cyanobacterial EPS was slow. Therefore, both the biofilm on the pipe wall and the residual cyanobacterial EPS in the pipe water are the main reasons for the consumption of residual chlorine, and the existence of the cyanobacterial EPS can easily cause the residual chlorine in the pipe network not continuously meet the standard for drinking water quality within 48 h (0.05 mg/L). It is even possible that if the amount of chlorine added in the treated water is less than 3.5 mg/L, the consumption of residual chlorine will be in a shorter time.
Figure 3b compares the effects of different contents of cyanobacteria EPS and pipe wall breeding biofilm on residual chlorine in water supply network. From the consumption of residual chlorine, it can be seen that the biofilm breeding on the pipe wall can consume residual chlorine rapidly and in a large amount in a short time (0–4 h), but the consumption rate of residual chlorine will slow down after 4 h due to the decline of biological population base. The consumption rate of residual chlorine by cyanobacteria EPS is relatively gentle and stable compared with that of pipe wall biofilm, which is caused by the continuous chemical reaction between cyanobacteria EPS and residual chlorine.

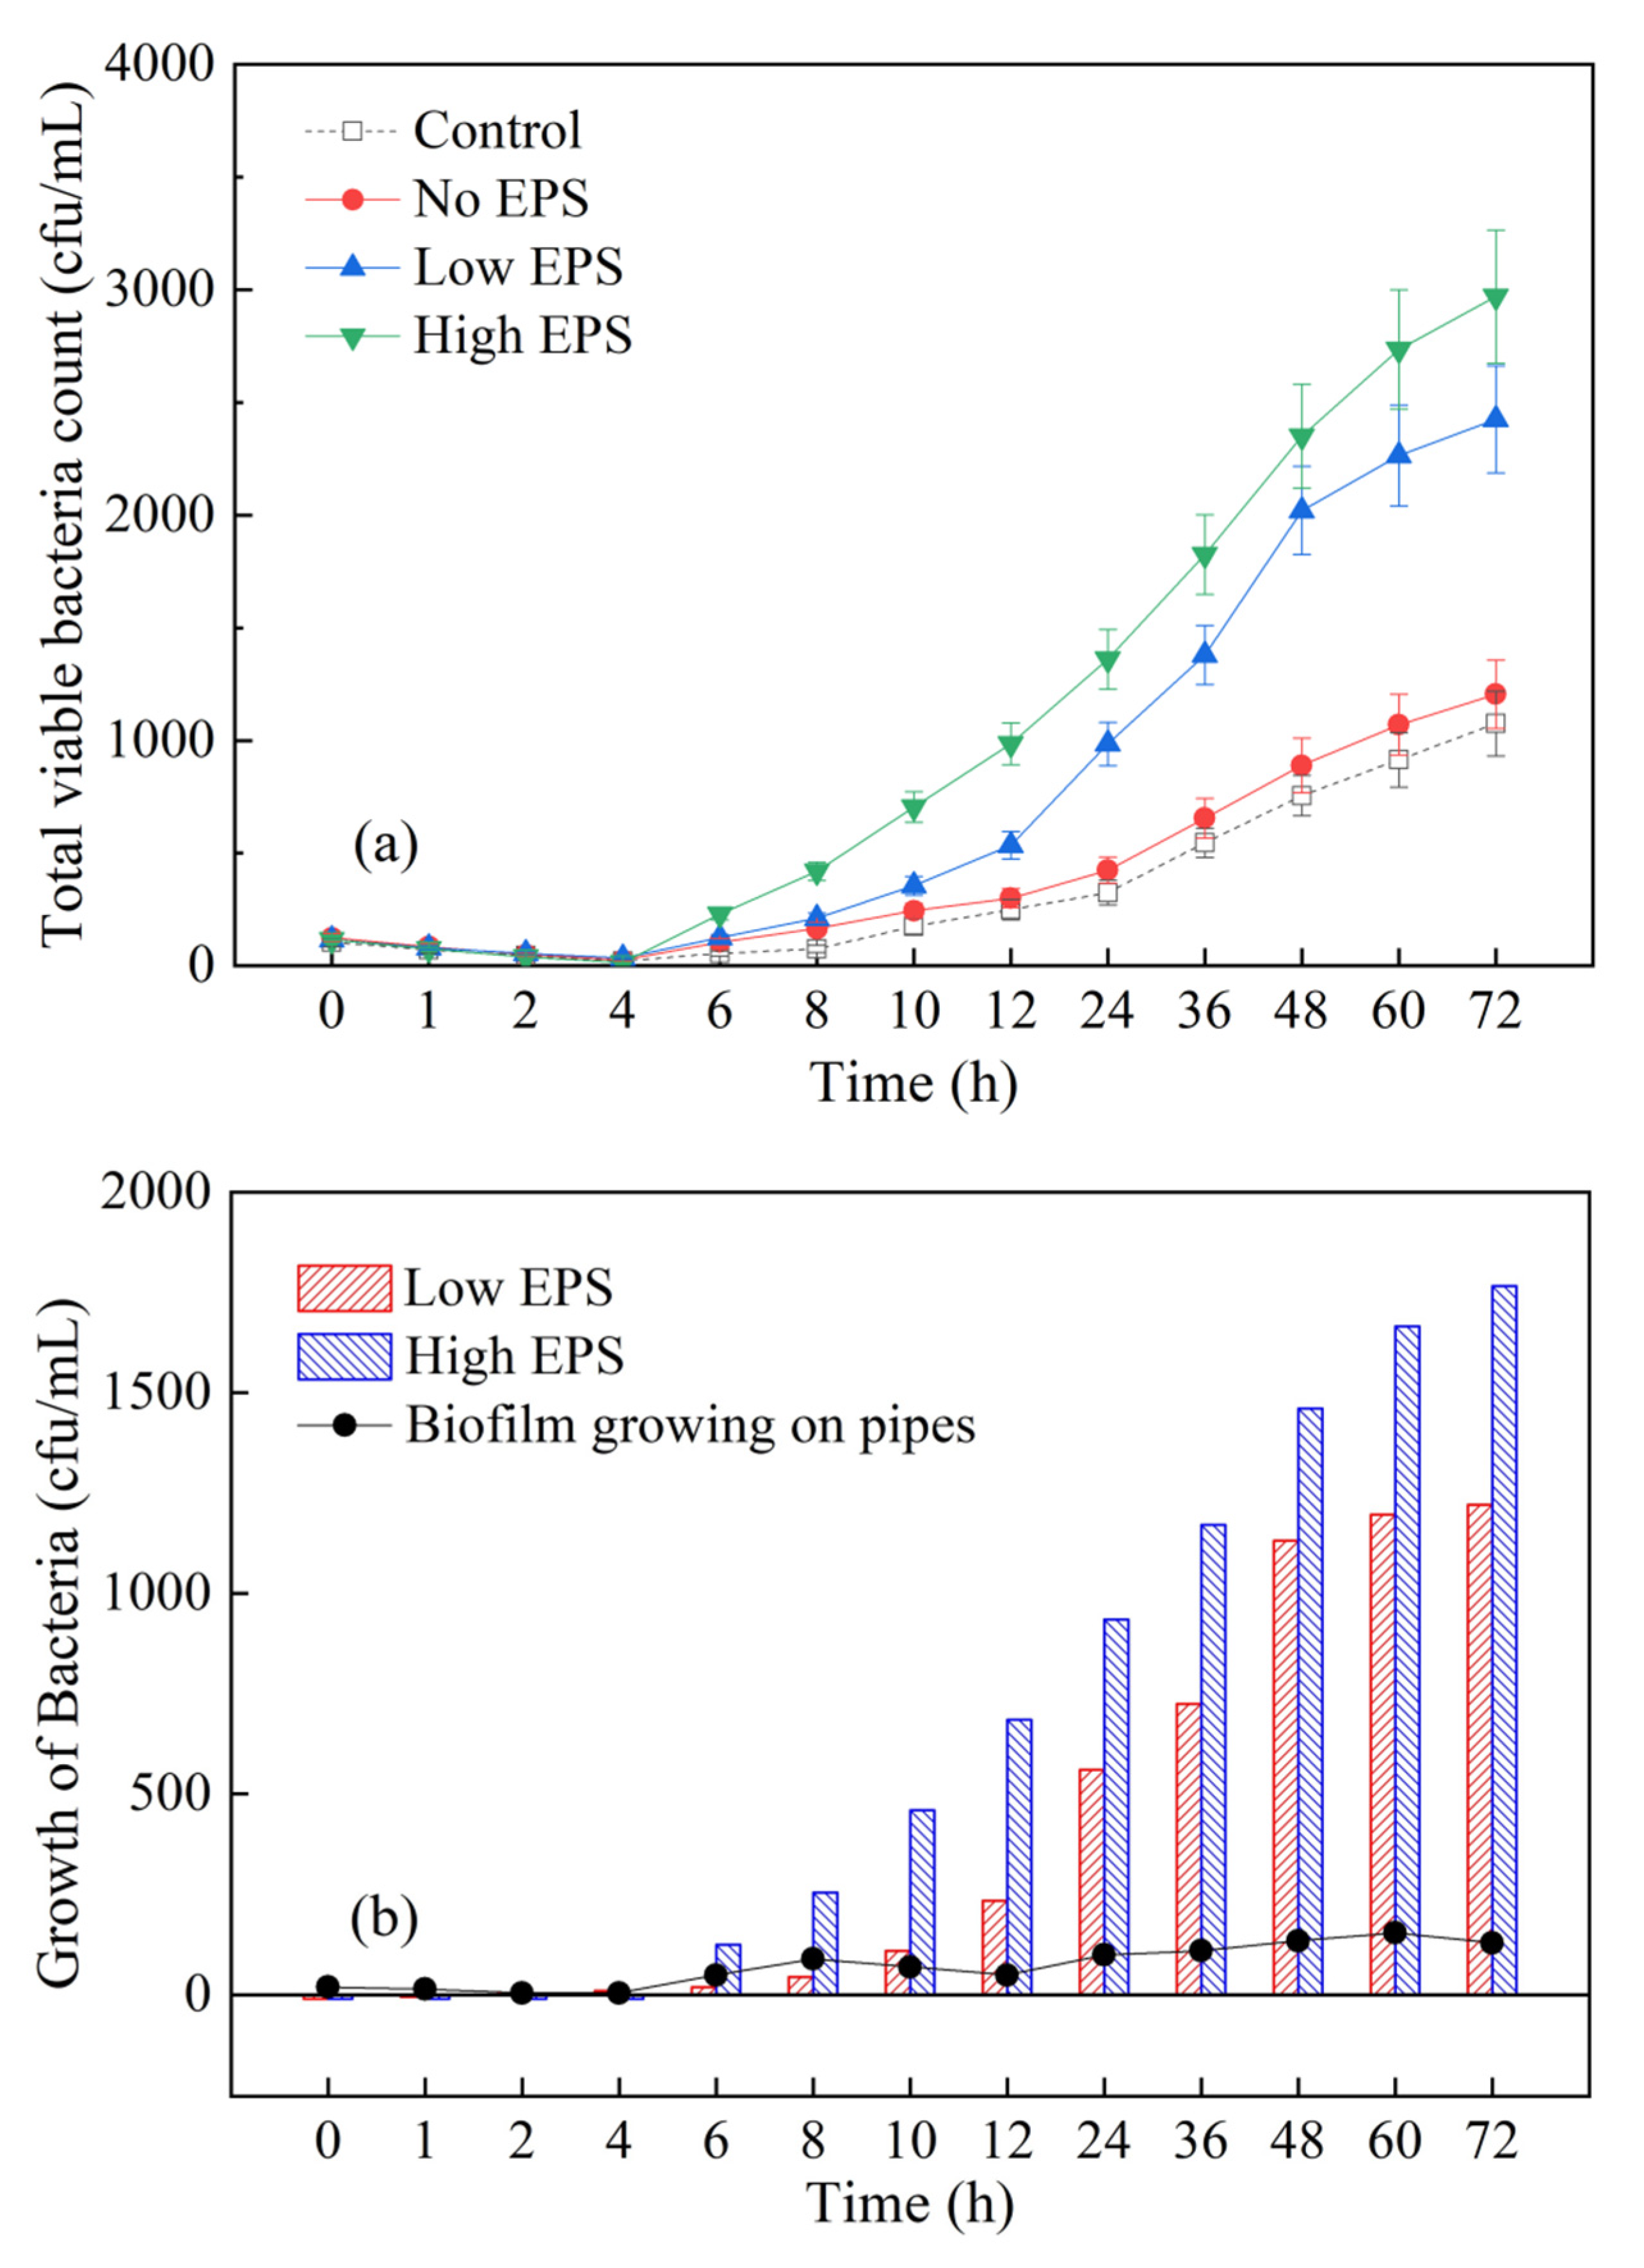
3.2. Influence of Cyanobacterial EPS on the Total Viable Bacteria Count in the Dynamic Water Supply System

The total number of viable bacteria can more intuitively show the degree of drinking water pollution caused by microbial reproduction. Figure 4 shows that in each system, the total number of viable bacteria presented an overall upward trend, with a slow decline in 0–4 h, and a rapid increase in 4–72 h. This is mainly because the residual chlorine in the pipe network can inhibit the growth of bacteria as a strong oxidant under high content conditions. When it gradually decays to a lower content, the inhibitory ability is weakened, which can easily cause the rapid growth and reproduction of bacteria. After 72 h of system operation, the growth rate of the total viable bacteria count in the control system was the smallest. The total viable bacteria count in the system without cyanobacterial EPS, in the system with low cyanobacterial EPS, and in the system with high cyanobacterial EPS, increased by about 10, 21, and 26 times, respectively, compared with the initial time.
Figure 4b shows that the contribution of cyanobacteria EPS to the growth of bacteria in the water of the pipe network can increase continuously from 0.4–2.5 times of 6 h to 9.6–13.6 times of 72 h compared with the influence of the biofilm on the pipe wall. It can be seen that even in an environment with dynamic water flow, the higher the content of cyanobacterial EPS in the water, the faster the decay of residual chlorine in the pipe network, the weaker the inhibition of residual chlorine on the growth of bacteria, the faster the recovery of microbial activity, and the more the growth and reproduction of bacteria in the pipe network. Therefore, in the actual current water supply system, the influence of cyanobacterial EPS on the growth of bacteria in the pipeline, the biological stability of water in the pipe network and even the safety of water quality should not be underestimated.

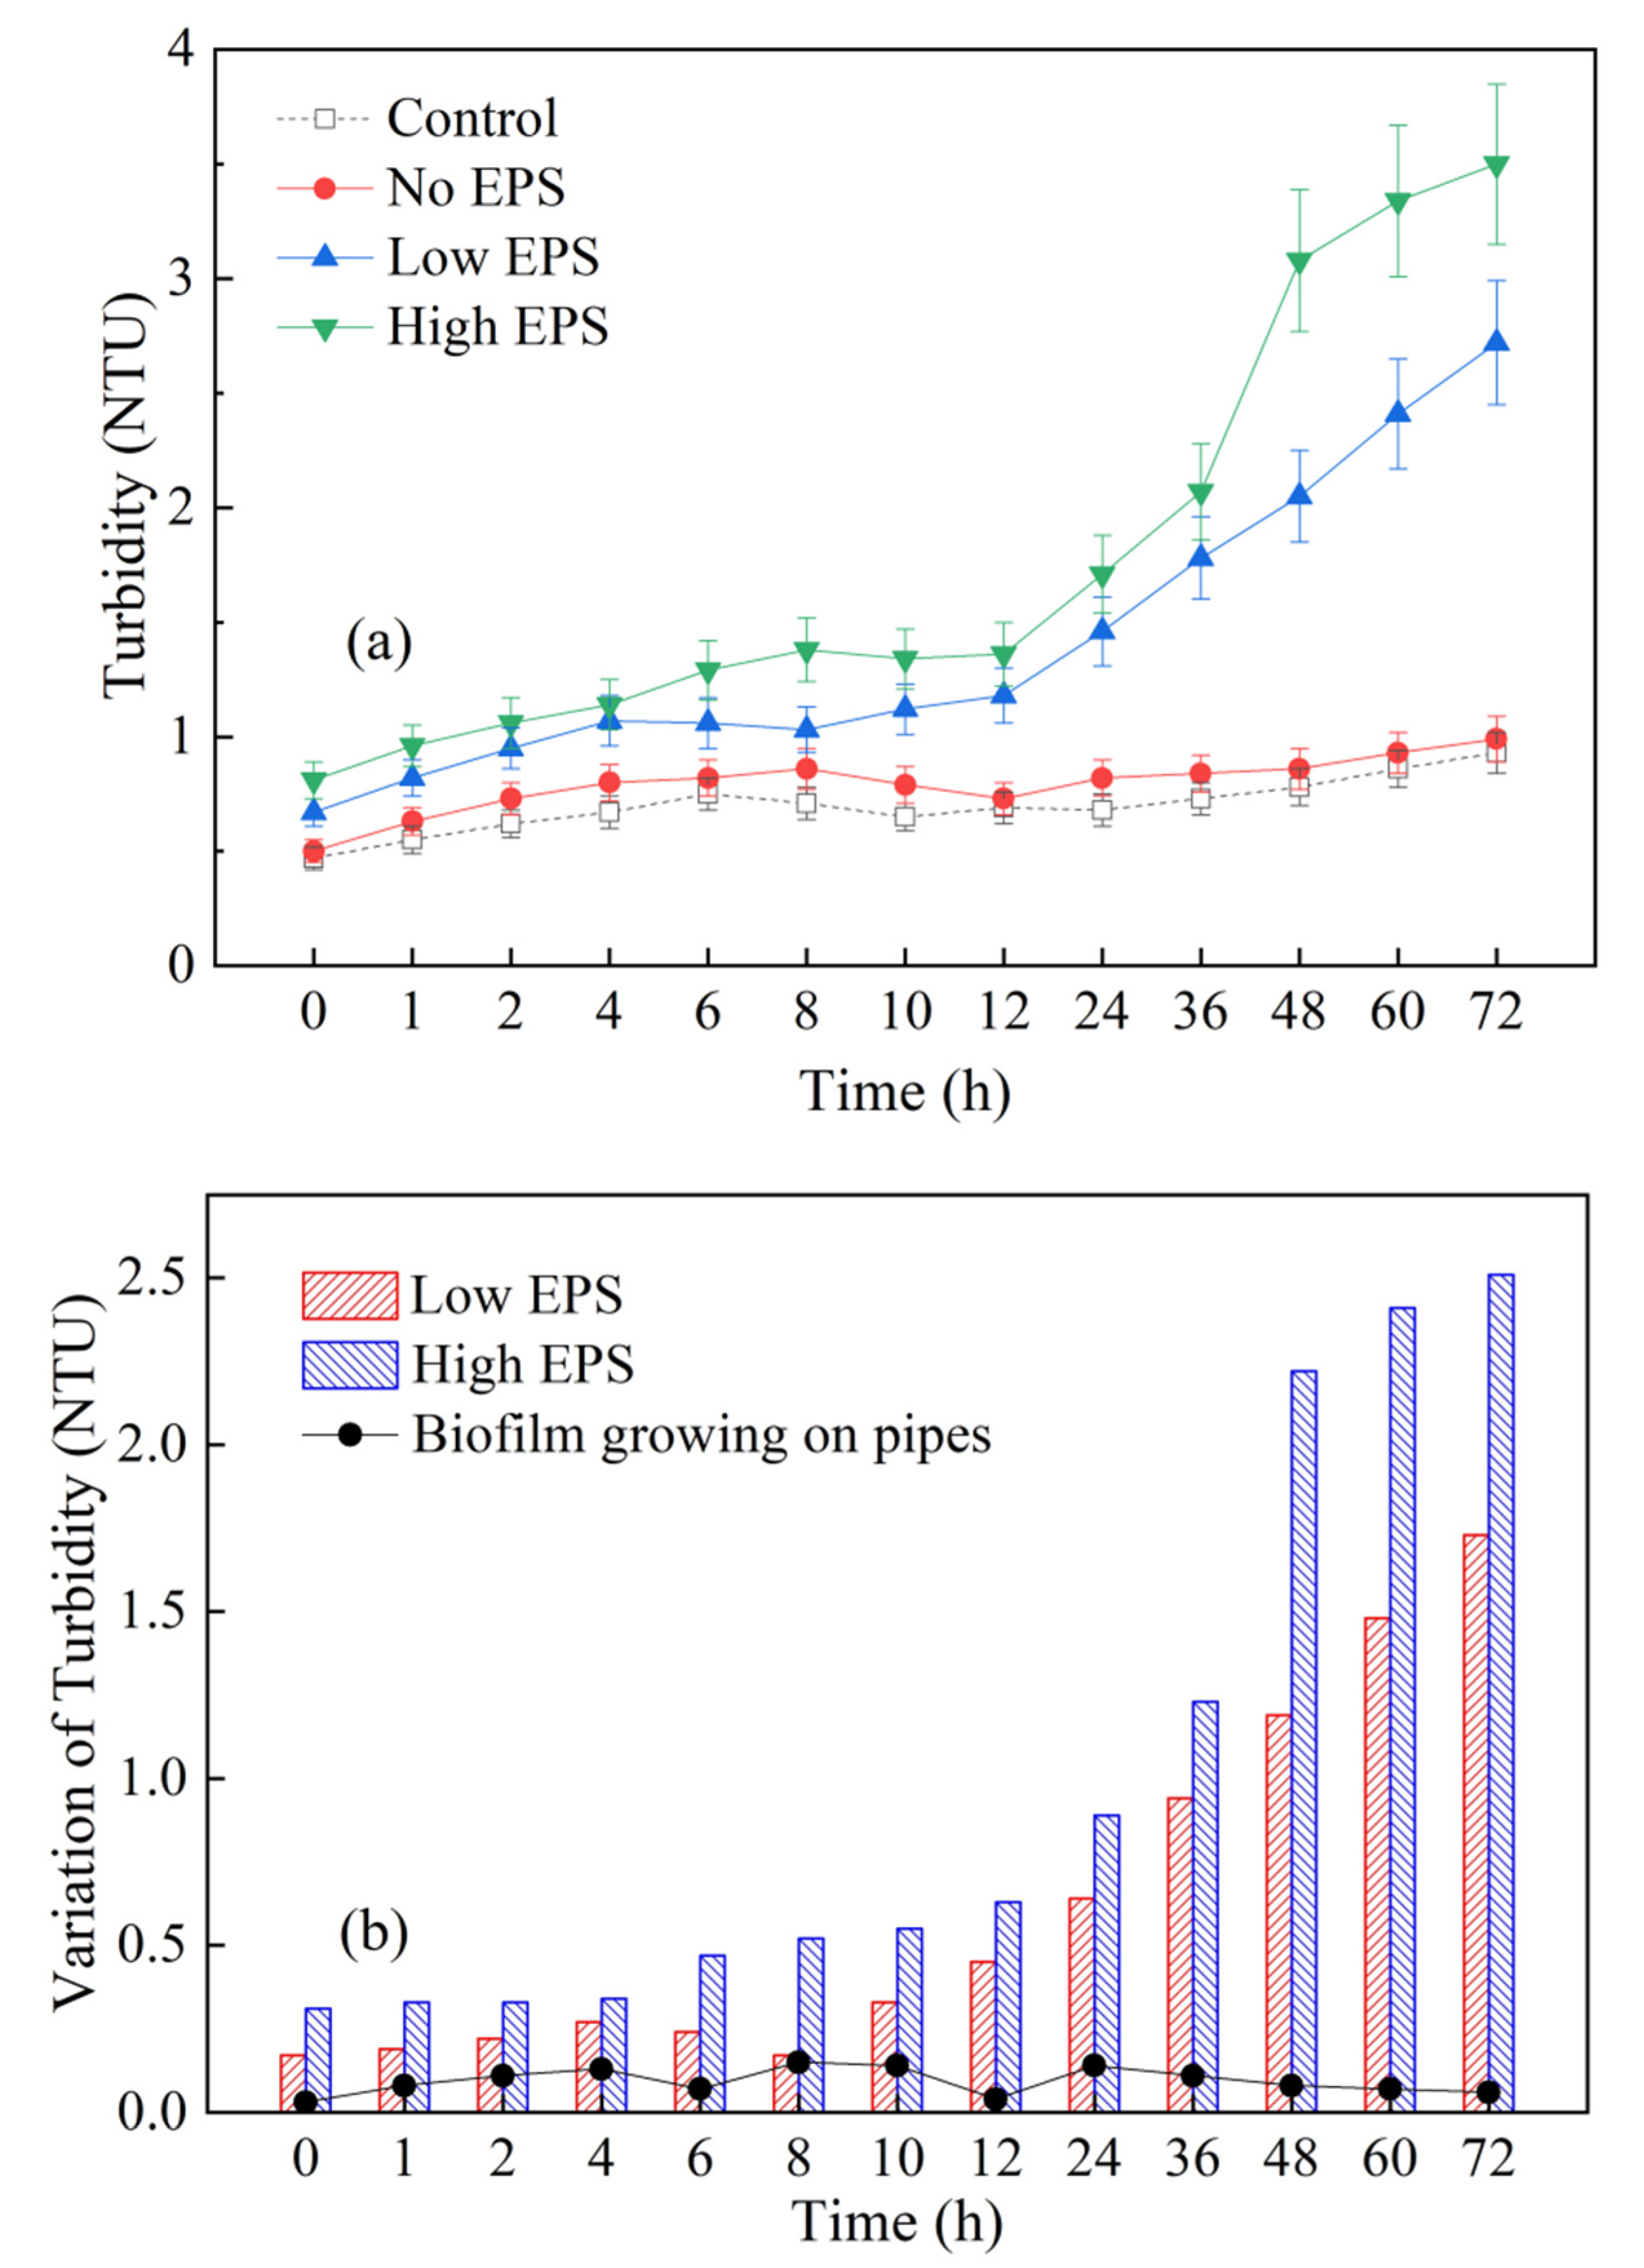
3.3. Influence of Cyanobacterial EPS on the Turbidity in the Dynamic Water Supply System

Turbidity is an intuitive indicator of water quality and safety [33]. According to the standard for drinking water quality in China, the turbidity of drinking water should not exceed 1 NTU [32]. The variation of the turbidity in each system was shown in Figure 5. In the control and no EPS systems, the variation range of turbidity was small. In the low EPS and high EPS systems, the turbidity exceeded the upper limit of the standard for drinking water quality (1 NTU) within 4 h, and the increased by 306% and 332%, respectively, within 72 h. That is to say, with the increase of time, the turbidity of the two systems with cyanobacterial EPS increased significantly, and the turbidity value of the system with high concentration of cyanobacterial EPS was generally higher and increased faster.
Figure 5b shows that the contribution of cyanobacteria EPS to water turbidity increases from 5.7–10.3 times in 0h to 28.8–41.8 times in 72 h. This is not only related to the contribution of cyanobacterial EPS to the turbidity value, but also related to the fact that EPS may act as a microbial nutrient to accelerate microbial growth and metabolic activity. With the continuous decay of residual chlorine in the pipeline, the inhibition of microbial growth was weakened. If the cyanobacterial EPS could provide a favorable carbon source and energy supply at this time, the microbial activity would be greatly increased, the growth and reproduction ability of bacteria would be strengthened, and their substance metabolism and transformation ability will be improved, which would thus lead to the increase of turbidity and affect the water quality.

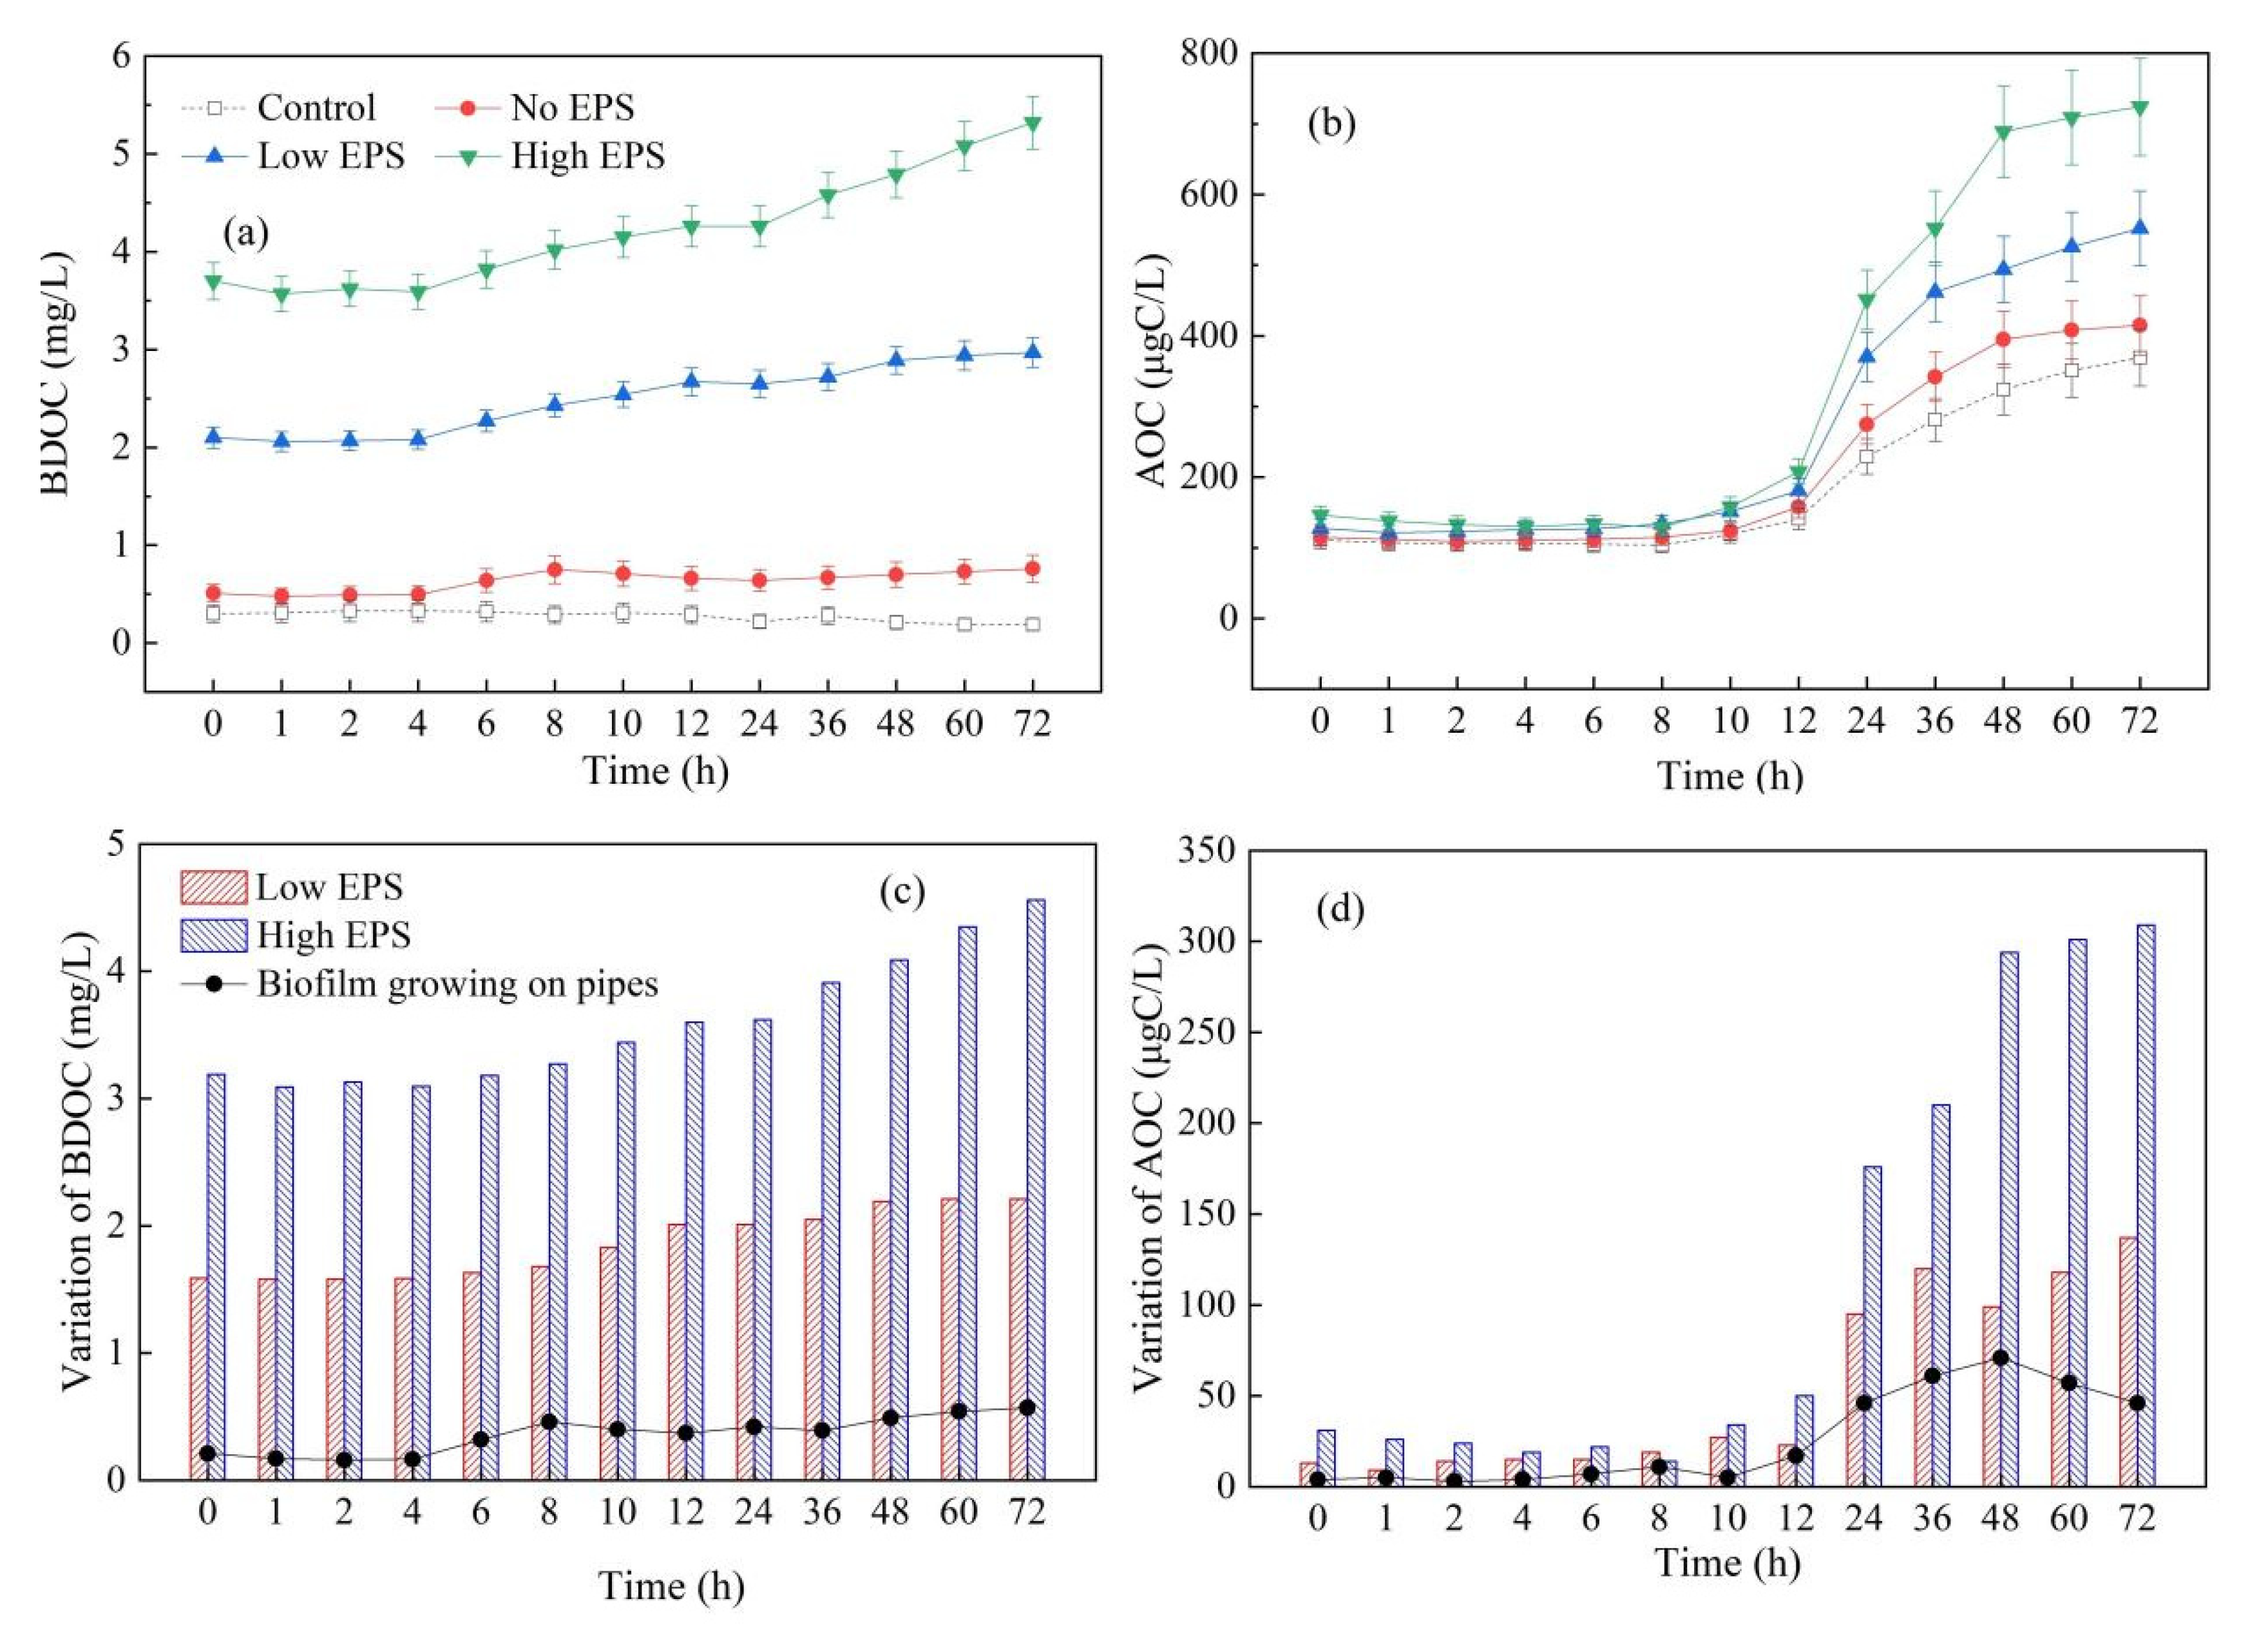
3.4. Influence of Cyanobacterial EPS on the Biological Stability in the Dynamic Water Supply System

The biological stability of drinking water represents that the organic matter in the water can provide the maximum possibility for the growth and reproduction of bacteria. BDOC and AOC are generally regarded as important indicators for evaluating biological stability in drinking water [34,35,36]. As an organic carbon source, EPS of cyanobacteria can be degraded or assimilated by bacteria and other microorganisms, and its contribution to biological stability indicators of water quality is an important factor affecting the water quality of the pipe network system in this study. Figure 6b showed that the BDOC in the three systems with biofilm growing on the pipe wall had more obvious cumulative growth trends than that in the control system, indicating that more conversions of organic matters in the three systems. They included not only the oxidative degradation of polymeric organic matters, but also the decomposition, absorption, utilization, metabolism, and secretion of organic matters by heterotrophic microorganisms. Besides, the migration and transformation of inorganic carbon sources (such as carbonate and bicarbonate dissolved in water) to organic carbon sources by autotrophic microorganisms, and the release of microbial metabolites and the dissolution of decayed microbial remains were also included. These substance conversions increased the accumulation of BDOC in the water and reduced the biological stability. Data showed that the higher the content of cyanobacterial EPS, the higher the initial BDOC, and the greater the growth rate of BDOC. Within 72 h, the BDOC in the low EPS system increased by 41.4%, and the BDOC in the high EPS system increased by 43.8%. It indicated that in the pipe network conditions containing cyanobacterial EPS, there were more obvious conversions and accumulations of organic or inorganic materials to BDOC that can be degraded and utilized by microorganisms. The higher the content of cyanobacterial EPS, the more obvious the transformation trend which is beneficial to the growth and reproduction of microorganisms. The variation of AOC in Figure 6b showed that the three systems with biofilm growing showed more obvious rising trends than that in the control system, 0–12 h change trend is not obvious, and the trends increased more rapidly at 12–72 h. This is most likely because partial organic matters were completely mineralized in the early stage of chlorination, which slowed the conversion of some macromolecular polymers into organic matters that can be directly assimilated and absorbed by bacteria, resulting in a slow rise in AOC. However, with the consumption of residual chlorine and the recovery of microbial activity in 12–72 h, the aggravation of bacterial reproduction and the rapid rise of AOC promote each other. By comparing the high EPS and low EPS systems, it can be seen that within 72 h, the AOC in the low EPS system increased by 331% compared to the initial time, and the AOC in the high EPS system increased by 396% compared to the initial time. Therefore, the higher the content of cyanobacterial EPS and the more chlorine consumption in the early stage, the faster the growth and reproduction of microorganisms using cyanobacterial EPS as nutrients, and the faster the accumulation of AOC, resulting in the biological stability of the water quality reduced greatly.
Figure 6c,d shows that compared with the tube wall biofilm, the cyanobacteria EPS showed a more obvious contribution to the growth of BDOC and AOC in the water of the pipe network, basically maintaining about 3–8 times the impact of the tube wall biofilm. This shows that while cyanobacterial EPS consumes residual chlorine in the pipe network, it is easier to aggravate the secondary contamination of the water quality of the water supply pipe network from carbon source conversion and other aspects. It should be a key concern for water purification and water supply departments in the process of water treatment and pipe network water distribution. Especially for the water treatment process during cyanobacteria outbreak period, enhanced removal technologies of cyanobacteria EPS such as pre-oxidation and advanced oxidation should be adopted.

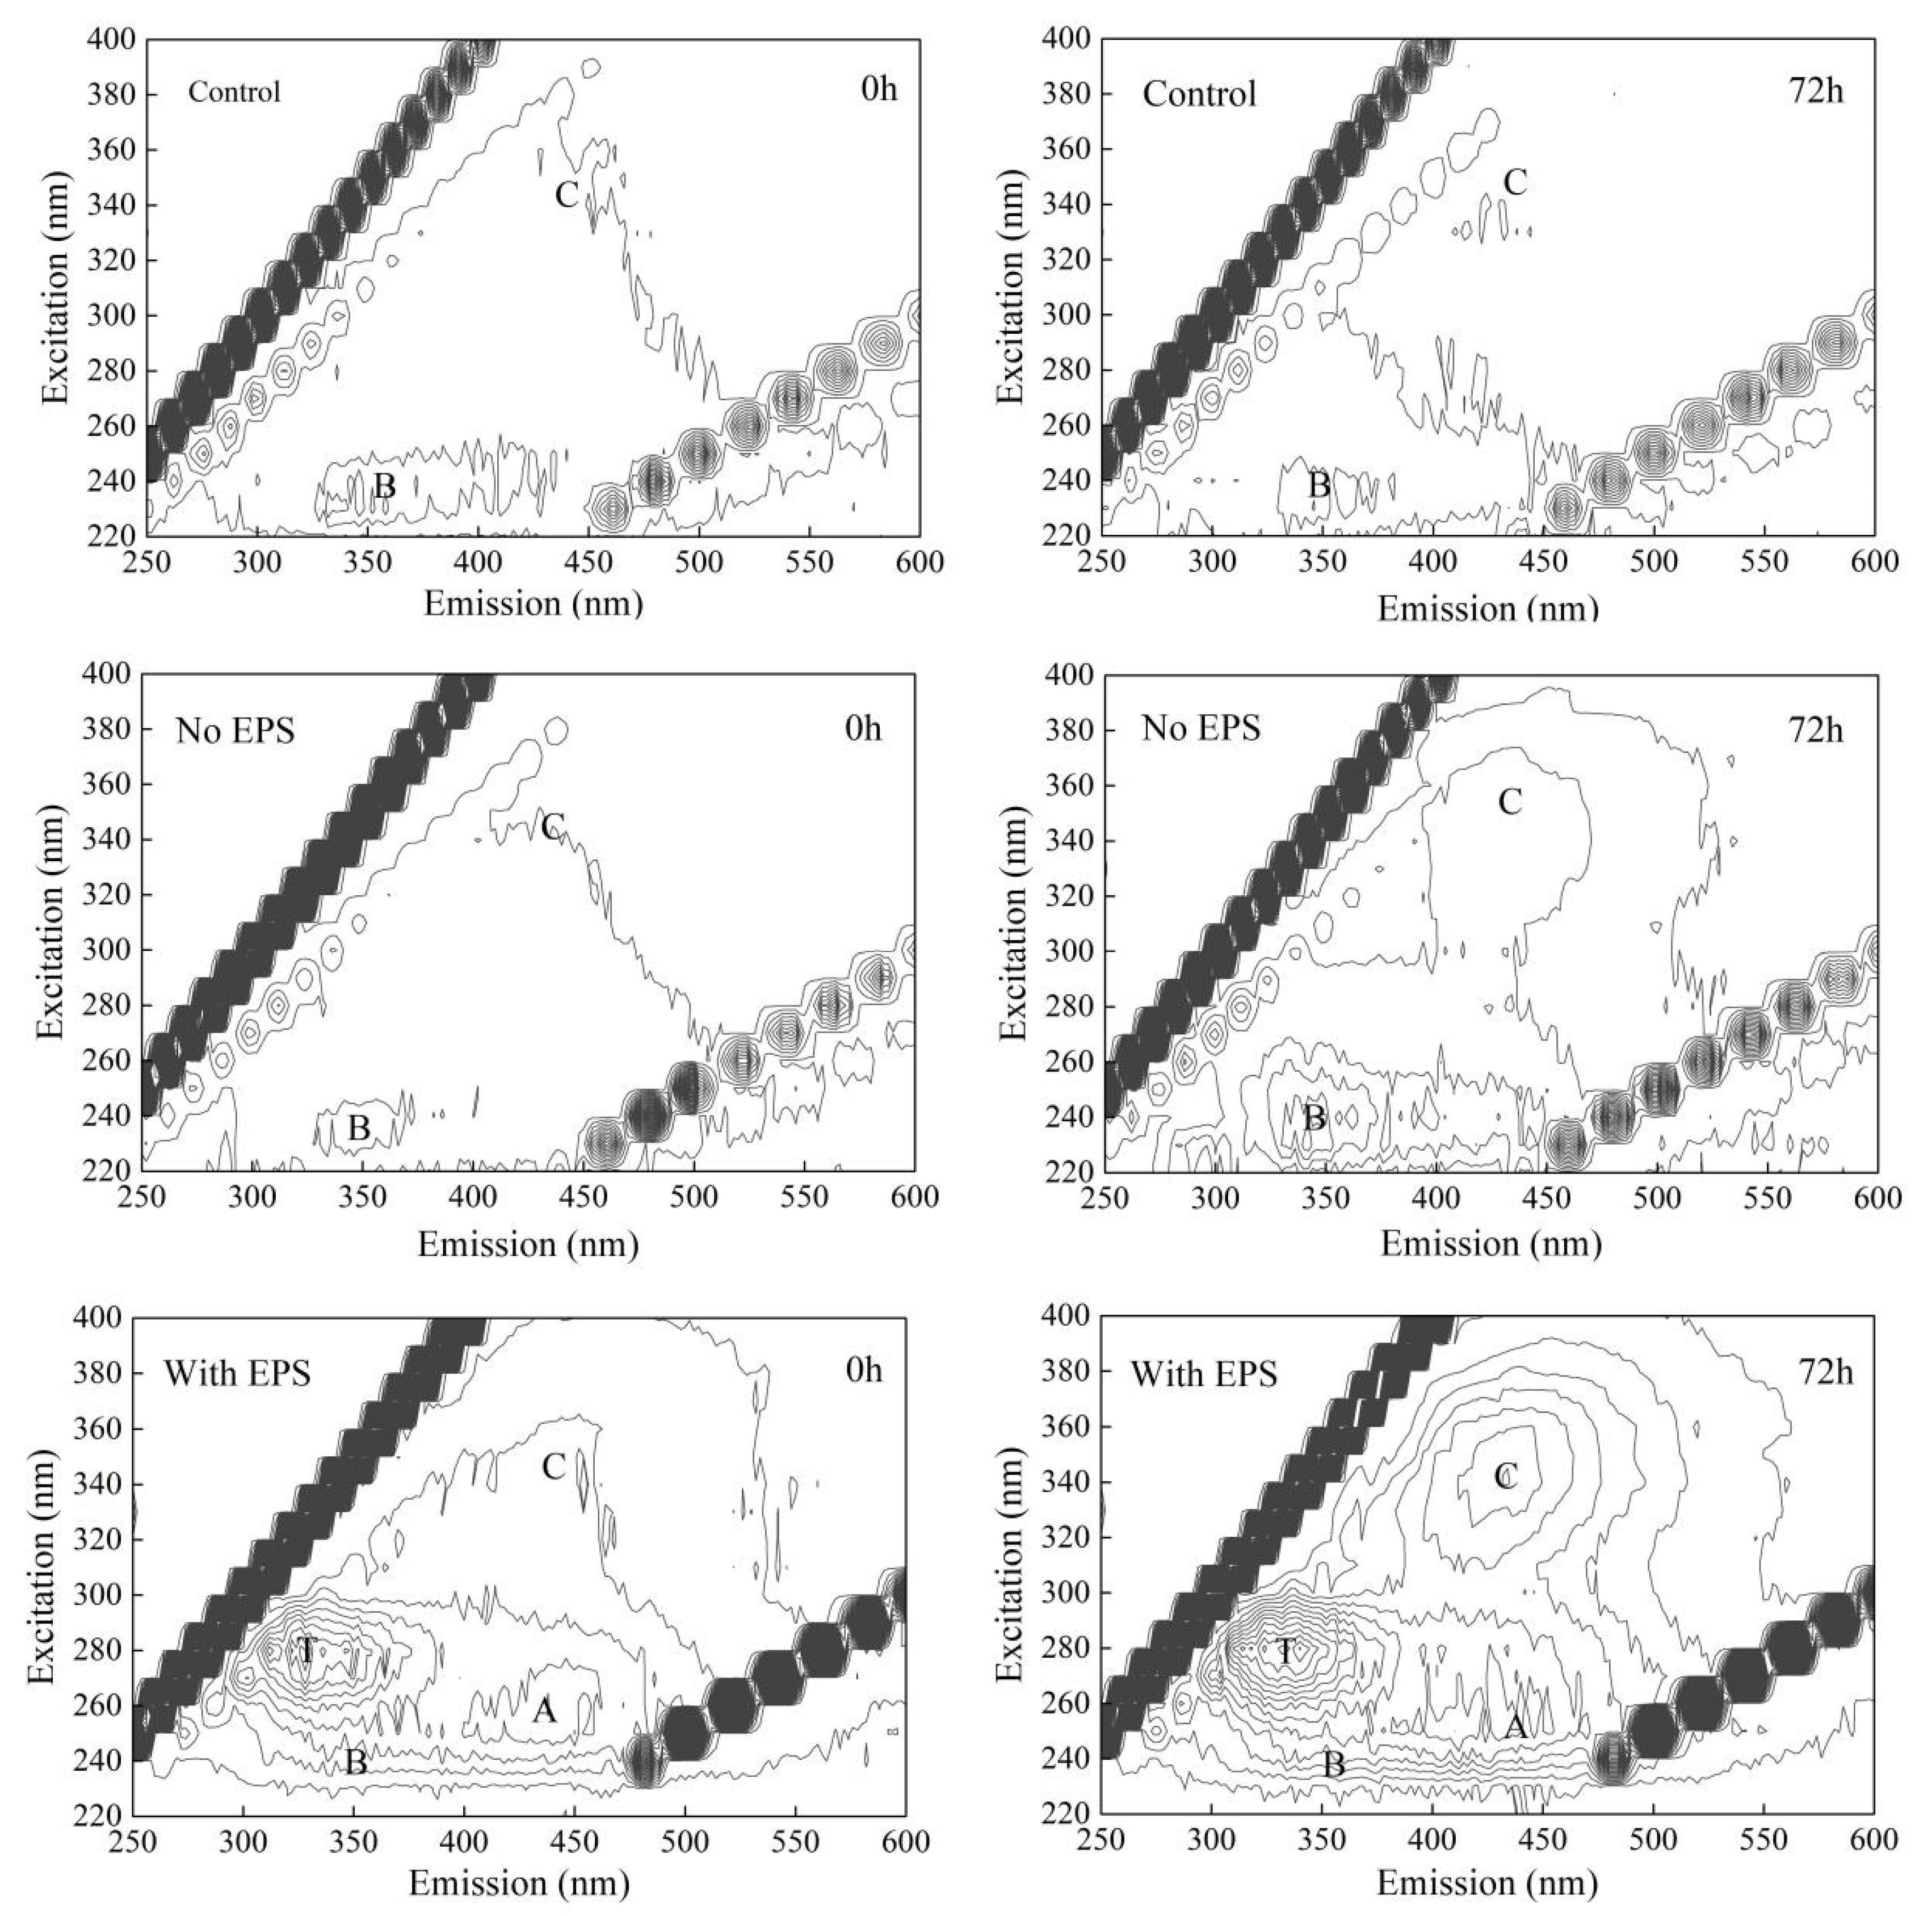
3.5. Analysis of Substance Transformation of Cyanobacteria EPS in the Process of Water Supply Network Transmission and Distribution

In order to further analyze the material transformation of cyanobacteria EPS during the distribution process of water supply pipe network and the influencing factors on water quality safety, we used three-dimensional fluorescence spectroscopy to characterize the changes of organic components in water supply pipe networks of different systems (Figure 7). Comparing the fluorescent peak division area and organic matter characteristics in Figure 2, there are two types of fluorescent peaks in the three-dimensional fluorescence spectrum of cyanobacteria free EPS system, namely tyrosine like fluorescent peak (peak B) and humic acid like fluorescent peak (peak C), which are caused by the original fluorescent characteristic organic matter residual components of experimental water. There are four types of fluorescence peaks in the three-dimensional fluorescence spectrum of the system containing cyanobacteria EPS, namely: fulvic acid-like fluorescence peak (peak A), tyrosine-like fluorescence peak (B peak), and humic acid-like fluorescence peak (peak C), tryptophan-like fluorescence peak (peak T), among which tyrosine-like substance (peak B) only showed weak peak shape fluctuation changes in the corresponding fluorescence region due to its low content. After 72 h of operation of the system, in the control group, because there was neither microbial matrix nor EPS nutrient source without cyanobacteria in the pipe network system, the residual tyrosine like and humic acid like substances in the water were more easily consumed by residual chlorine oxidation. In the system without EPS but with tube wall biofilm breeding, the intensities of tyrosine like fluorescence peak (b peak) and humic acid like fluorescence peak (C peak) gradually accumulate and increase, which indicates the breeding of tube wall biofilm or the metabolic activities of microorganisms without cyanobacteria EPS, It still promotes the potential increment of tyrosine proteins and humic acid like dissolved organic matter in pipe network water [37,38,39], However, due to the lack of organic nutrients such as protein, humic acid, and sugars that the cyanobacteria EPS can supply, the increase in organic matter is relatively slow. In the EPS-containing system, the intensity of the three types of fluorescence peaks of A, C, and T peaks all increased significantly, which indicates that under the stimulation of organic nutrients provided by cyanobacteria EPS, the bacteria and microorganisms in the pipe wall and pipe water are more active, and their ability to metabolize and release tryptophan-like, fulvic acid-like and humic acid-like substances is also stronger. The accumulation of these substances complements the re-growth of bacteria in the pipe network water, it is also an indirect reflection of the secondary contamination of water in the pipe network [38,39].

4. Conclusions

This study finds that in the dynamic water supply system, the cyanobacterial EPS has a very important influence on the growth of bacteria in the pipe, the biological stability of water quality in the pipe network, and the safety of supply water. Cyanobacterial EPS can significantly accelerate the decay rate of residual chlorine in the water pipeline. It leads to the turbidity of water exceeding the upper limit of the standard for drinking water quality within 4 h, and the increasing rate reaches 306–332% within 72 h. Cyanobacterial EPS has an important impact on the biological stability of water quality in water supply network, which makes BDOC increase by 41.4–43.8% and AOC increase by 331–396% within 72 h. This provides a very favorable condition for the growth of bacteria in the pipe network, even if there is residual chlorine in the pipeline. With the gradual declining of residual chlorine and the weakening inhibition ability to microorganisms, the bacteria can grow rapidly, resulting in a 21–26 times increase in the total number of viable bacteria within 72 h. Compared with the impact of the pipe wall biofilm on the water quality, the contribution of cyanobacterial EPS to the water contamination reaches its several times. This is mainly due to the fact that cyanobacterial EPS contains a lot of organic carbon sources such as humic acids and proteins, which can be used as microbial nutrient matrix and metabolic energy to stimulate the growth and reproduction of microorganisms. Besides, it is easier to stimulate the production of metabolic substances secreted by microorganisms at the same time as microbial nutrient consumption. This process further strengthens the accumulation of tryptophan, fulvic acid and humic acid components in pipe water and aggravates the secondary contamination of the supply water quality.

Author Contributions

Conceptualization, F.S. and H.C.; methodology, C.X.; validation, F.W. and H.C.; formal analysis, H.Y.; investigation, P.Y. and C.X.; data curation, H.Y.; writing—original draft preparation, P.Y.; writing—review and editing, Y.Z.; visualization, F.W.; supervision, F.S.; project administration, F.S. and H.C.; funding acquisition, F.S. and H.C. All authors have read and agreed to the published version of the manuscript.

Funding

This work was supported by the National Natural Science Foundation of China [grant number 51708480]; the Qing Lan Project of Yangzhou University; the Natural Science Foundation of Jiangsu Province [grant number BK20150456]; the Water Environmental Protection Engineering Laboratory of Jiangsu Province [grant number W1801]; and the Water Conservancy Science and Technology Project of Jiangsu Province [grant number 2020033].

Institutional Review Board Statement

Not applicable.

Informed Consent Statement

Not applicable.

Data Availability Statement

Not applicable.

Conflicts of Interest

The authors declare no conflict of interest.

References

  1. Fu, Y.L.; Peng, H.X.; Liu, J.Q.; Nguyen, T.H.; Hashmi, M.Z.; Shen, C.F. Occurrence and quantification of culturable and viable but non-culturable (VBNC) pathogens in biofilm on different pipes from a metropolitan drinking water distribution system. Sci. Total Environ. 2021, 764, 142851. [Google Scholar] [CrossRef]
  2. Moyo, W.; Chaukura, N.; Msagati, T.A.M.; Mamba, B.B.; Heijman, S.G.J.; Nkambule, T.T.I. The properties and removal efficacies of natural organic matter fractions by South African drinking water treatment plants. Environ. Chem. Eng. 2019, 7, 103101. [Google Scholar] [CrossRef]
  3. Zhang, C.Q.; Lu, J.G. Optimizing disinfectant residual dosage in engineered water systems to minimize the overall health risks of opportunistic pathogens and disinfection by-products. Sci. Total Environ. 2021, 770, 145356. [Google Scholar] [CrossRef]
  4. Chen, H.Y.; L, J.Q.; W, Z.Y.; Wei, Z.Y.; Zhang, H.H.; He, X.F.; Zhou, X.Y.; Qiu, S.D.; Hu, B.L.; Lou, L.P. Radial differences in contaminant distribution in large-diameter pipe scales of main pipelines in drinking water distribution system. China Environ. Sci. 2015, 35, 2706–2712. [Google Scholar]
  5. Pan, R.J.; Zhang, K.J.; Cen, C.; Zhou, X.Y.; Xu, J.; Wu, J.J.; Wu, X.G. Characteristics of biostability of drinking water in aged pipes after water source switching: ATP evaluation, biofilms niches and microbial community transition. Environ. Pollut. 2021, 271, 116293. [Google Scholar] [CrossRef]
  6. Skjevrak, I.; Lund, V.; Ormerod, K.; Due, A.; Herikstad, H. Biofilm in water pipelines: A potential source for off-flavours in the drinking water. Water Sci. Technol. 2004, 49, 211–217. [Google Scholar] [CrossRef] [PubMed]
  7. Aggarwal, S.; Gomez-Smith, C.K.; Jeon, Y.; LaPara, T.M.; Waak, M.B.; Hozalski, R.M. Effects of chloramine and coupon material on biofilm abundance and community composition in bench-scale simulated water distribution systems and comparison with full-scale water mains. Environ. Sci. Technol. 2018, 52, 13077–13088. [Google Scholar] [CrossRef]
  8. Tsvetanova, Z.G.; Dimitrov, D.N. Biofilms and bacteriological water quality in a domestic installation model simulating daily drinking water consumption. Water Sci. Technol.-Water Supply 2012, 12, 720–726. [Google Scholar] [CrossRef]
  9. Lehtola, M.J.; Juhna, T.; Miettinen, I.T.; Vartiainen, T.; Martikainen, P.J. Formation of biofilms in drinking water distribution networks, a case study in two cities in Finland and Latvia. J. Ind. Microbiol. Biot. 2004, 31, 489–494. [Google Scholar] [CrossRef] [PubMed]
  10. Lu, C.S.; Chu, C.W. Effects of acetic acid on the regrowth of heterotrophic bacteria in the drinking water distribution system. World J. Microb. Biot. 2005, 21, 989–998. [Google Scholar] [CrossRef]
  11. Hem, L.J.; Efraimsen, H. Isolation of natural organic matter—The influence on the assimilable organic carbon. Environ. Int. 1999, 25, 367–371. [Google Scholar] [CrossRef]
  12. Pang, C.M.; Liu, W.T. Biological filtration limits carbon availability and affects downstream biofilm formation and community structure. Appl. Environ. Microbiol. 2006, 72, 5702–5712. [Google Scholar] [CrossRef] [PubMed] [Green Version]
  13. Bai, X.H.; Zhang, L.; Zhu, B.; Jiang, C.T. Relationship between water biological stability and the bacteria growth in drinking water distribution system. China Environ. Sci. 2006, 26, 180–182. [Google Scholar]
  14. Niquette, P.; Servais, P.; Savoir, R. Bacterial Dynamics in the drinking water distribution system of Brussels. Water Res. 2001, 35, 675–682. [Google Scholar] [CrossRef]
  15. Qian, A.J.; Pan, R.; Sun, F.; Cong, H.B. Contamination and regulation trends of cyanobacterial extracellular polymeric substance. Environ. Pollut. Prev. 2017, 8, 916–919. [Google Scholar]
  16. Xiao, R.; Yang, X.; Li, M.; Li, X.; Wei, Y.Z.; Cao, M.; Ragauskas, A.; Thies, M.; Ding, J.H.; Zheng, Y. Investigation of composition, structure and bioactivity of extracellular polymeric substances from original and stress-induced strains of Thraustochytrium striatum. Carbohyd. Polym. 2018, 195, 515–524. [Google Scholar] [CrossRef]
  17. Sun, F.; Zhang, H.Y.; Qian, A.J.; Yu, H.F.; Xu, C.H.; Pan, R.; Shi, Y.J. The influence of extracellular polymeric substances on the coagulation process of cyanobacteria. Sci. Total Environ. 2020, 720, 137573. [Google Scholar] [CrossRef]
  18. Sun, W.H. Study on pollution characteristics of water soure and safety guarantee technologies of drinking water during cyanobacteria blooming. Master’s Thesis, Shanghai Normal University, Shanghai, China, April 2009. [Google Scholar]
  19. Peng, F. Experiment research on algae monitoring and removal in drinking water supply system. Master’s Thesis, Xi’an University of Architecture and Technology, Xi’an, China, June 2008. [Google Scholar]
  20. Pan, R. Research on the Secretion and Release of Free Cyanobacterial Extracellular Polymeric Substances and Its Migration during Water Treatment. Master’s Thesis, Yangzhou University, Yangzhou, China, June 2019. [Google Scholar]
  21. Liu, X.T.; Wang, M.S.; Zhang, S.J. Application potential of carbon nanotubes in water treatment: A review. Environ. Sci. 2013, 25, 1263–1280. [Google Scholar] [CrossRef]
  22. Qi, Z.H.; Zhao, Y.; Chen, H.T.; Wu, Z.Y.; Yu, X. Restrictive nutrients in pipe network and their impacts on biofilm formation. Environ. Sci. Manag. 2012, 37, 109–112. [Google Scholar]
  23. Xu, H.C.; Cai, H.Y.; Yu, G.H.; Jiang, H.L. Insights into extracellular polymeric substances of cyanobacterium Microcystis aeruginosa using fractionation procedure and parallel factor analysis. Water Res. 2013, 47, 2005–2014. [Google Scholar] [CrossRef]
  24. National Standards of the People’s Republic of China. GB 4789.2-2016 National Food Safety Standard, Food Microbiology Test, Detection of Aerobic Bacterial Count. China, National Health and Family Planning Commission of the People’s Republic of China, State Food and Drug Administration of the People’s Republic of China. 2016. Available online: http://www.360doc.com/document/18/0831/19/10819955_782766052.shtml (accessed on 8 December 2021).
  25. Liu, B.S.; Yu, Z.Q. A Modified plate count for a strain of highly sticky Bacillus subtilis. Heilongjiang Anim. Sci. Vet. Med. 2011, 9, 19–21. [Google Scholar]
  26. Li, X.; Ma, J.W. Dynamic method for determination of the biodegradable dissolved organic carban (BDOC) in drinking water. Harbin Inst. Technol. 2005, 37, 1183–1184. [Google Scholar]
  27. Hammers, F.A.; Egli, T. New method for assimilable organic carbon determination using flow-cytometric enumeration and a natural microbial consortium as inoculum. Environ. Sci. Technol. 2005, 35, 3289–3294. [Google Scholar] [CrossRef]
  28. Zhao, Z.Y.; Wen, G.; Huang, T.L. Variation of AOC during pre-chlorination of algae-containing water and its mechanism. China Water Wastewater 2016, 32, 46–51. [Google Scholar]
  29. Song, X.N.; Yu, T.; Zhang, Y.; Zhang, Y.; Yin, X.Y. Distribution characterization and source analysis of dissolved organic matter in Taihu Lake using a three dimensional fluorescence excitation-emission matrix. Acta Scien. Circum. 2010, 30, 2321–2331. [Google Scholar]
  30. Wei, Y.D.; Ma, J.; Wen, G. Characteristics of algal organics. Water Technol. 2015, 9, 9–14. [Google Scholar]
  31. Chen, J.X.; Gao, N.Y.; Li, L.; Zhu, M.Q.; Yang, J.; Lu, X.; Zhang, Y.S. Disinfection by-product formation during chlor(am)ination of algal organic matters (AOM) extracted from Microcystis aeruginosa: Effect of growth phases, AOM and bromide concentration. Environ. Sci. Pollut. Res. 2017, 24, 8469–8478. [Google Scholar] [CrossRef]
  32. National Standards of the People’s Republic of China. GB5749-2006 Standards for Drinking Water Quality. China, Minister of Health of the People’s Republic of China, Standardization Administration of the People’s Republic of China. 2006. Available online: http://c.gb688.cn/bzgk/gb/showGb?type=online&hcno=73D81F4F3615DDB2C5B1DD6BFC9DEC86 (accessed on 8 December 2021).
  33. Yang, X.P. Effect of turbidity in drinking water on disinfection efficiency and bacterial survival. Foreign Med. (Hyg.) 1983, 3, 184–185. [Google Scholar]
  34. Escobar, I.C.; Randall, A.A. Assimilable organic carbon (AOC) and biodegradable dissolved organic carbon (BDOC): Complementary measurements. Water Res. 2001, 35, 4444–4454. [Google Scholar] [CrossRef]
  35. Ren, X.L.; Chen, H.B. Effect of residual chlorine on the interaction between bacterial growth and assimilable organic carbon and biodegradable organic carbon in reclaimed water. Sci. Total Environ. 2021, 752, 141223. [Google Scholar] [CrossRef] [PubMed]
  36. Zhang, J.P.; Li, W.Y.; Wang, F.; Qian, L.; Xu, C.; Liu, Y.; Qi, W.Q. Exploring the biological stability situation of a full scale water distribution system in south China by three biological stability evaluation methods. Chemosphere 2016, 161, 43–52. [Google Scholar] [CrossRef] [PubMed]
  37. Li, B.L. Community diversity and resistance mechanism of the chlorine-resistant bacteria in drinking water distribution system. Master’s Thesis, Harbin Institute of Technology, Harbin, China, June 2015. [Google Scholar]
  38. Wang, Y.H.; Wu, Y.H.; Tong, X.; Yu, T.; Peng, L.; Bai, Y.; Zhao, X.H.; Huo, Z.Y.; Ikuno, N.; Hu, H.Y. Chlorine disinfection significantly aggravated the biofouling of reverse osmosis membrane used for municipal wastewater reclamation. Water Res. 2019, 154, 246–257. [Google Scholar] [CrossRef] [PubMed]
  39. Liu, B.; Wang, Y.H.; Wu, Y.H.; Wu, Y.H.; Hu, H.Y. Effect of ultraviolet disinfection on growth and secretion characteristics of microorganism in reclaimed water. Environ. Eng. 2020, 38, 28–34. [Google Scholar]
Figure 1. Dynamic batch mode water supply network simulation device.
Sustainability 13 13913 g001
Figure 2. Area division of three-dimensional fluorescence spectrum.
Sustainability 13 13913 g002
Figure 3. Influence of cyanobacterial EPS on the residual chlorine in dynamic water supply system. (a) decay of residual chlorine values; (b) consumption of residual chlorine relative to the control system.
Sustainability 13 13913 g003
Figure 4. Influence of cyanobacterial EPS on the total viable bacteria count in dynamic water supply system. (a) variation of total viable bacteria count; (b) growth of total viable bacteria count relative to the control system.
Sustainability 13 13913 g004
Figure 5. Influence of cyanobacterial EPS on the turbidity in dynamic water supply system. (a) detected turbidity values; (b) variation of turbidity relative to the control system.
Sustainability 13 13913 g005
Figure 6. Influence of cyanobacterial EPS on the biological stability in dynamic water supply system. (a) BDOC values; (b) AOC values; (c) variation of BDOC relative to the control system; (d) variation of AOC relative to the control system.
Sustainability 13 13913 g006
Figure 7. Three-dimensional fluorescence spectroscopy of the organic components in the water supply network of different systems.
Sustainability 13 13913 g007
Publisher’s Note: MDPI stays neutral with regard to jurisdictional claims in published maps and institutional affiliations.

