Article

A Parametric Study to Assess Lightweight Aggregate Concrete for Future Sustainable Construction of Reinforced Concrete Beams

by
Ismael Vives
,
Francisco B. Varona
*,
Antonio J. Tenza-Abril
and
Javier Pereiro-Barceló
Department of Civil Engineering, University of Alicante, 03690 San Vicente del Raspeig, Spain
*
Author to whom correspondence should be addressed.
Sustainability 2021, 13(24), 13893; https://doi.org/10.3390/su132413893
Submission received: 28 October 2021 / Revised: 7 December 2021 / Accepted: 13 December 2021 / Published: 15 December 2021
(This article belongs to the Special Issue Complex System Modeling Methods Applied to Sustainable Development)

Abstract

:
Lightweight aggregate concrete (LWC) is an attractive alternative to conventional concrete in building construction. It leads to lighter self-weight in beams and floor slabs and thus might have a positive impact on reinforcing steel consumption, also reducing the loads withstood by columns and foundations. However, LWC may increase cement consumption to maintain the required concrete compressive strength. This study presents compact equations for the design of reinforced LWC beams and subsequently applies them to a parametric analysis programmed in MATLAB. The aim of this analysis is to obtain an estimation of the equivalent carbon dioxide emissions associated with steel and cement consumption if using LWC instead of conventional concrete. The analysis involves more than 3 million beams simulating real scenarios by varying different design parameters, such as mix design, concrete strength, span length and applied loads and verifying both Ultimate and Serviceability Limit States. Whereas LWC of density equal or below 1600 kg/m3 does not seem to be feasible when trying adequately control cement content, the study shows that LWC with densities of 1800 and 2000 kg/m3 would not have a negative impact on the carbon dioxide emissions and would adequately comply with the various design restrictions.

1. Introduction

Sometimes the need to reduce the weight of a structural element is not less significant than the need to control an eventual loss of strength, especially in high-rise buildings and civil infrastructures such as bridges, where the structural self-weight is one of the main problems that structural engineers face. Lightweight aggregate concrete (LWC) is a very versatile material that, due to its properties, has great versatility and presents itself as an alternative to normal weight concrete (NWC). Governments and companies have been seeking to minimize the environmental impact of human industries for years and the unique functions of LWAC make it appealing and promising for a sustainable construction industry [1].
Regarding the use of LWC as structural concrete, the Eurocode 2 [2] limits the oven dry density of LWC to 2200 kg/m3. LWC can be produced with a proportion of artificial or natural lightweight aggregates (LWA) totally or partially replacing the normal weight aggregates (NWA)—usually it is the coarse NWA that is replaced by coarse LWA. It is possible to design LWC with a wide spectrum of densities for structural purposes. While Eurocode 2 and the Model Code 2010 [3] admit densities as low as 800 kg/m3, most experimental studies on reinforced lightweight concrete structures (beams, columns and frames) hardly ever consider densities below 1600 kg/m3 [4,5,6,7,8,9]. Apart from the dead load reduction, LWC also has a beneficial impact on the insulating properties. From an economic point of view, using LWC in high-rise buildings may lead to a notable reduction of the total costs, in terms of steel reinforcement amount, foundation sizes and consumption of the NWC required by the supports and foundations. LWC also has a lower elastic modulus which can elongate the period of natural vibration and has better deformability [10], which, in addition to its lighter weight, can potentially enhance the seismic performance of the structure.
Furthermore, LWC improves thermal and noise insulation [11,12] and reduces the operation costs of the building, thus diminishing the environmental impact thanks to the increase in energy efficiency [13,14]. Along with structural concrete that incorporates recycled aggregates from construction and demolition waste [15], LWC might have a positive effect on the sustainability of the construction industry either by creating a lightweight cementitious material that includes industrial waste, such as rice straw and cotton stalk ashes [15] or palm oil clinker [16], or by its aforementioned inherent potential to cover longer spans due to its lower self-weight, thus potentially reducing the number of columns or the size of foundations [17].
Research on lightweight concrete (LWC) covers a wide scope of applications. Its performance and flexural toughness in the context of fibre reinforced structural concrete LWC has been studied in [18,19]. LWC is also compatible with self-compacting concrete applications [20] and FRP retrofitting [4], with the latter also studying its performance subjected to shear force.
There has also been studies on the behaviour of LWC subjected to extraordinary design scenarios. For example, LWC frames (including both columns and beams) have been tested under quasi-static reverse cyclic loads in [21] (frame built at a 1:2 scale) and in [22] (frame at full scale). Although inherent imperfections were observed in terms of seismic behaviour, both studies concluded that LWC may represent a reliable alternative to conventional concrete in low-to-medium high-rise constructions, even with remarkable energy dissipation capabilities. Another type of extraordinary action is that of the fire. Research on the evolution of the physical and mechanical properties of LWC at high temperatures generally highlights its better performance at high temperature, compared with conventional concrete, but lower strength after cooling (residual strength) [23]. A striking recent study has addressed the adequate fire performance of 3D-printed LWC walls [24].
The actual structural performance of LWC has been experimentally tested at small-specimen scales [7,25] and with full-scale reinforced concrete beams [5,6,8,17], with a focus on flexural ductility, the determination of moment-curvature charts and the accuracy of the analytical models provided by different standards in comparison with experimental results. Moreover, the study by Ali et al. [8], which involved fibre reinforced lightweight and normal weight concrete, highlighted the greater workability of fresh LWC when challenged by the addition of fibres, compared to that of conventional fresh concrete.
Compared to experimental studies on lightweight reinforced concrete beams, there are remarkably fewer contributions dealing with columns. In fact, although the study by Charif et al. [5] explicitly includes columns, its experimental setup was limited to beams, subsequently generalizing the conclusions for columns by means of analytical procedures. Most experimental or numerical studies that deal with LWC and structural columns are indeed composite steel and concrete sections, usually LWC filled circular hollow steel sections. However, among those pieces of research that do focus on reinforced concrete supports made with LWC, the majority of them address the seismic flexural and shear performance [26,27,28] or the effect of ties on the confinement to enhance strength and ductility [29]. The general consensus seems to be that LWC columns require an increased amount of transverse reinforcement under the same design conditions as normal weight concrete. Indeed, empirical evidence shows that the shear contribution of LWC is around 75% to 85% of that of the NWC [4,30]. Nevertheless, a recent study by Deifalla et al. [31] found that the design codes might be underestimating the strength of LWC members subjected to pure shear or pure torsion. On the other hand, in terms of the shear contribution of the steel transverse reinforcement, a thorough study by Walraven et al. [32] involving experimental research and analytical and numerical models to evaluate the shear response of various types of concrete—including LWC—found that the limit of strut rotation does not significantly depend on the type of concrete.
There are several successful applications of LWC in civil and residential constructions that showcase its superior performance, such as seismic behaviour, crack controlling capabilities, enhanced durability, fire resistance and economic benefits [33]. However, the use of LWC may also be associated with a potential compromise in the concrete compressive strength [7,34], which leads to an increase in the consumption of Portland cement for a given strength grade. In spite of the aforementioned advantages of LWC, the latter issue should be properly addressed as a handicap of LWC from the environmental point of view [35]. This work aims at shedding light on this controversy and finding the range of densities in which LWC could have a net positive impact on the structural performance, as well as on the sustainability of the construction process.
First, the article develops compact design equations for Ultimate Limit State (ULS) of members subjected to bending, in compliance with the rules for structural lightweight concrete by Eurocode 2 [2]. Although these equations are based on well-known principles, such as strain compatibility and internal equilibrium, some additional features related to the adaptation of the parabola-rectangle diagram and, specially, the rotation capacity requirements for LWC have a significance that may not be obvious at first glance. The equations are then applied to a practical case study, which is intended to illustrate the positive and less positive effects of the use of LWC in a typical scenario with building elements. Next, a massive parametric analysis methodology is presented in order to draw conclusions or recommendations about the range of LWC densities that could have beneficial effects in terms of sustainability in the design and execution of building structures.

2. Basis of Design for Reinforced LWC Beams in Bending

This section first introduces the basis of design for lightweight aggregate structural concrete according to the Eurocode 2 [2] and develops compact equations for ULS design. As will be later discussed, Eurocode 2 recommends a reduction of the design strength of lightweight concrete (LWC) on account of sustained loading, whereas this penalization is not recommended for normal weight concrete (NWC). Consequently, and also because of the aforementioned concerns on the performance of LWC columns—that would require an increase in the transverse reinforcement to enhance confinement, ductility and seismic performance [4,22,30]—this work is mainly focused on simple bending, as typically exhibited by beams and slabs. During the last few decades, LWC has been successfully used in the horizontal structural elements of a variety of skyscrapers, ranging from the Twin Towers (1975) in New York to the Torre Emperador Castellana (2008) in Madrid. These are examples of how LWC is vital to reduce a huge amount of vertical loading. Nonetheless, the purpose of this work is to ascertain whether its application to high-rise buildings in general—not necessarily skyscrapers—would also entail an advantage from the point of view of a sustainable construction industry. Because of that, after the presentation of the design equations, a case study is then solved, illustrating the effects of the use of LWC in a reinforced concrete beam compared to normal weight concrete.

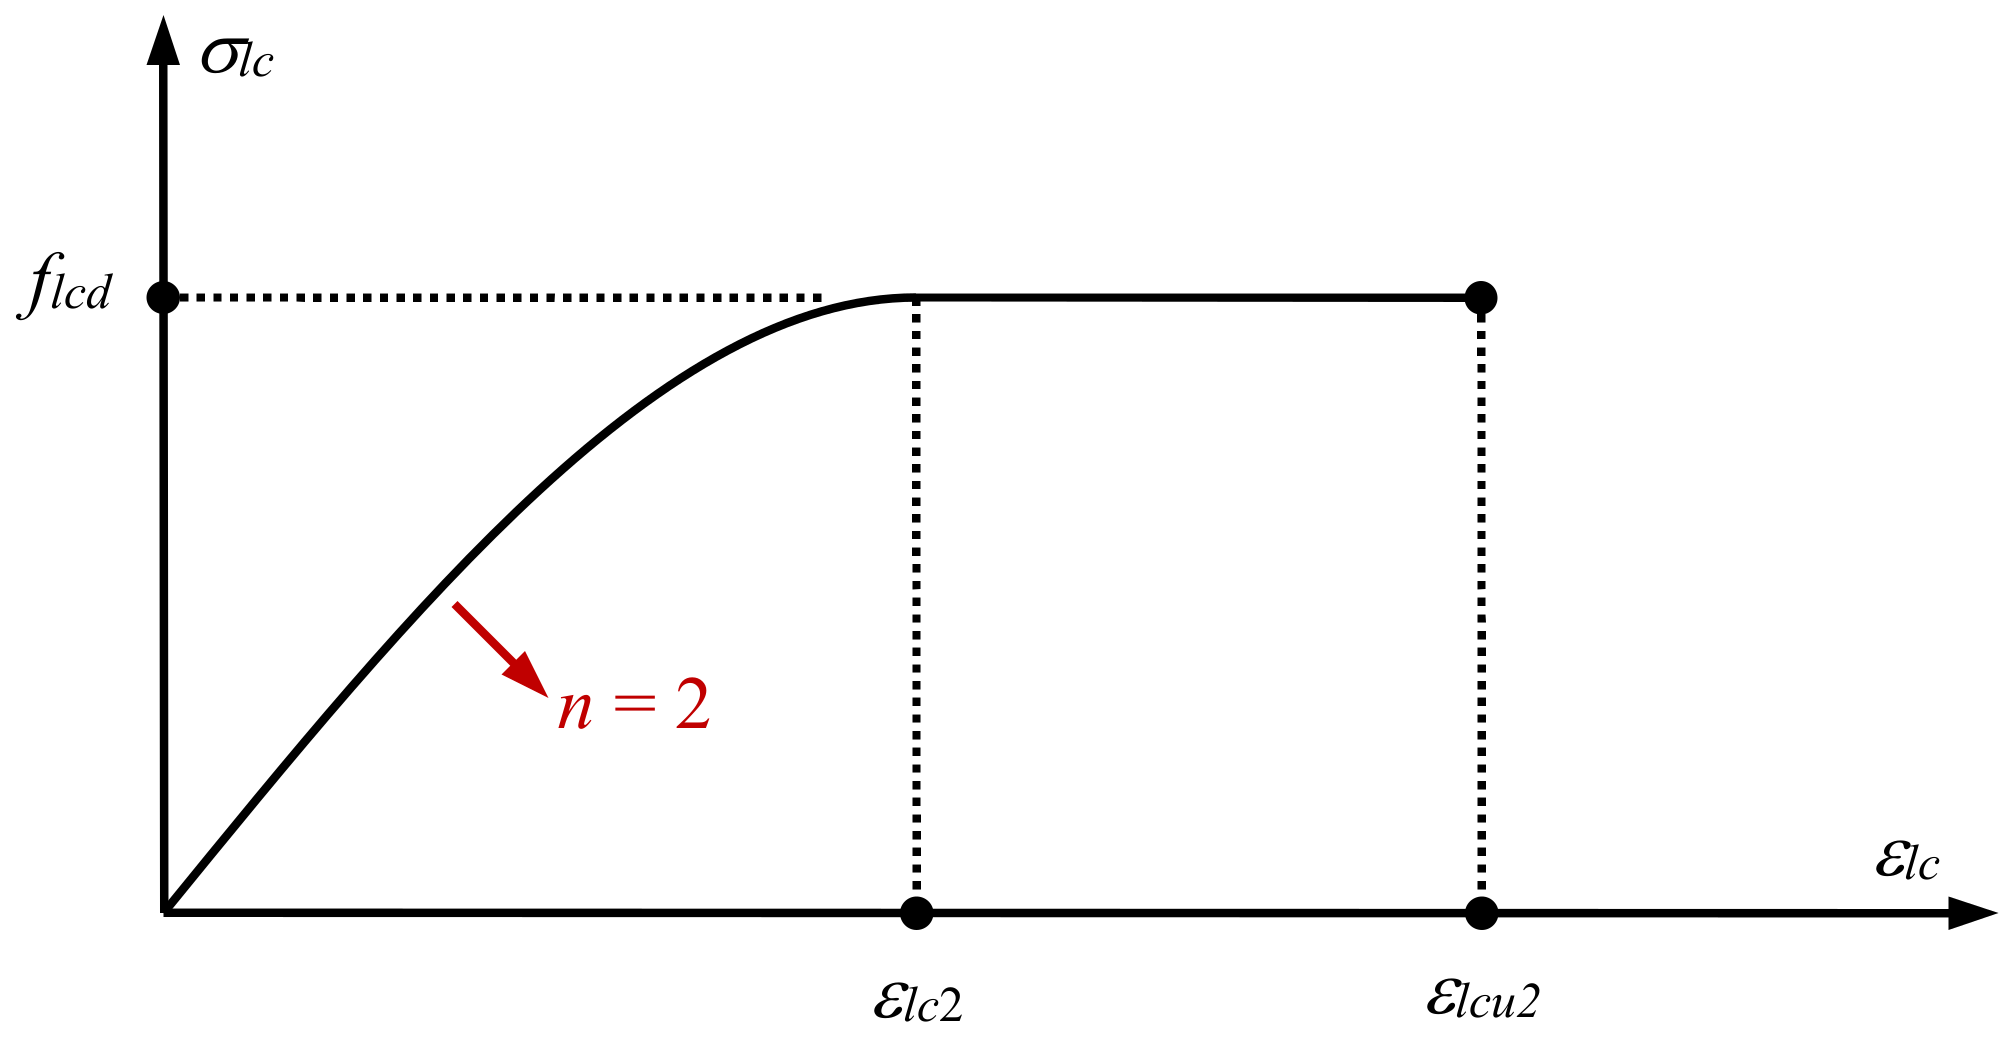
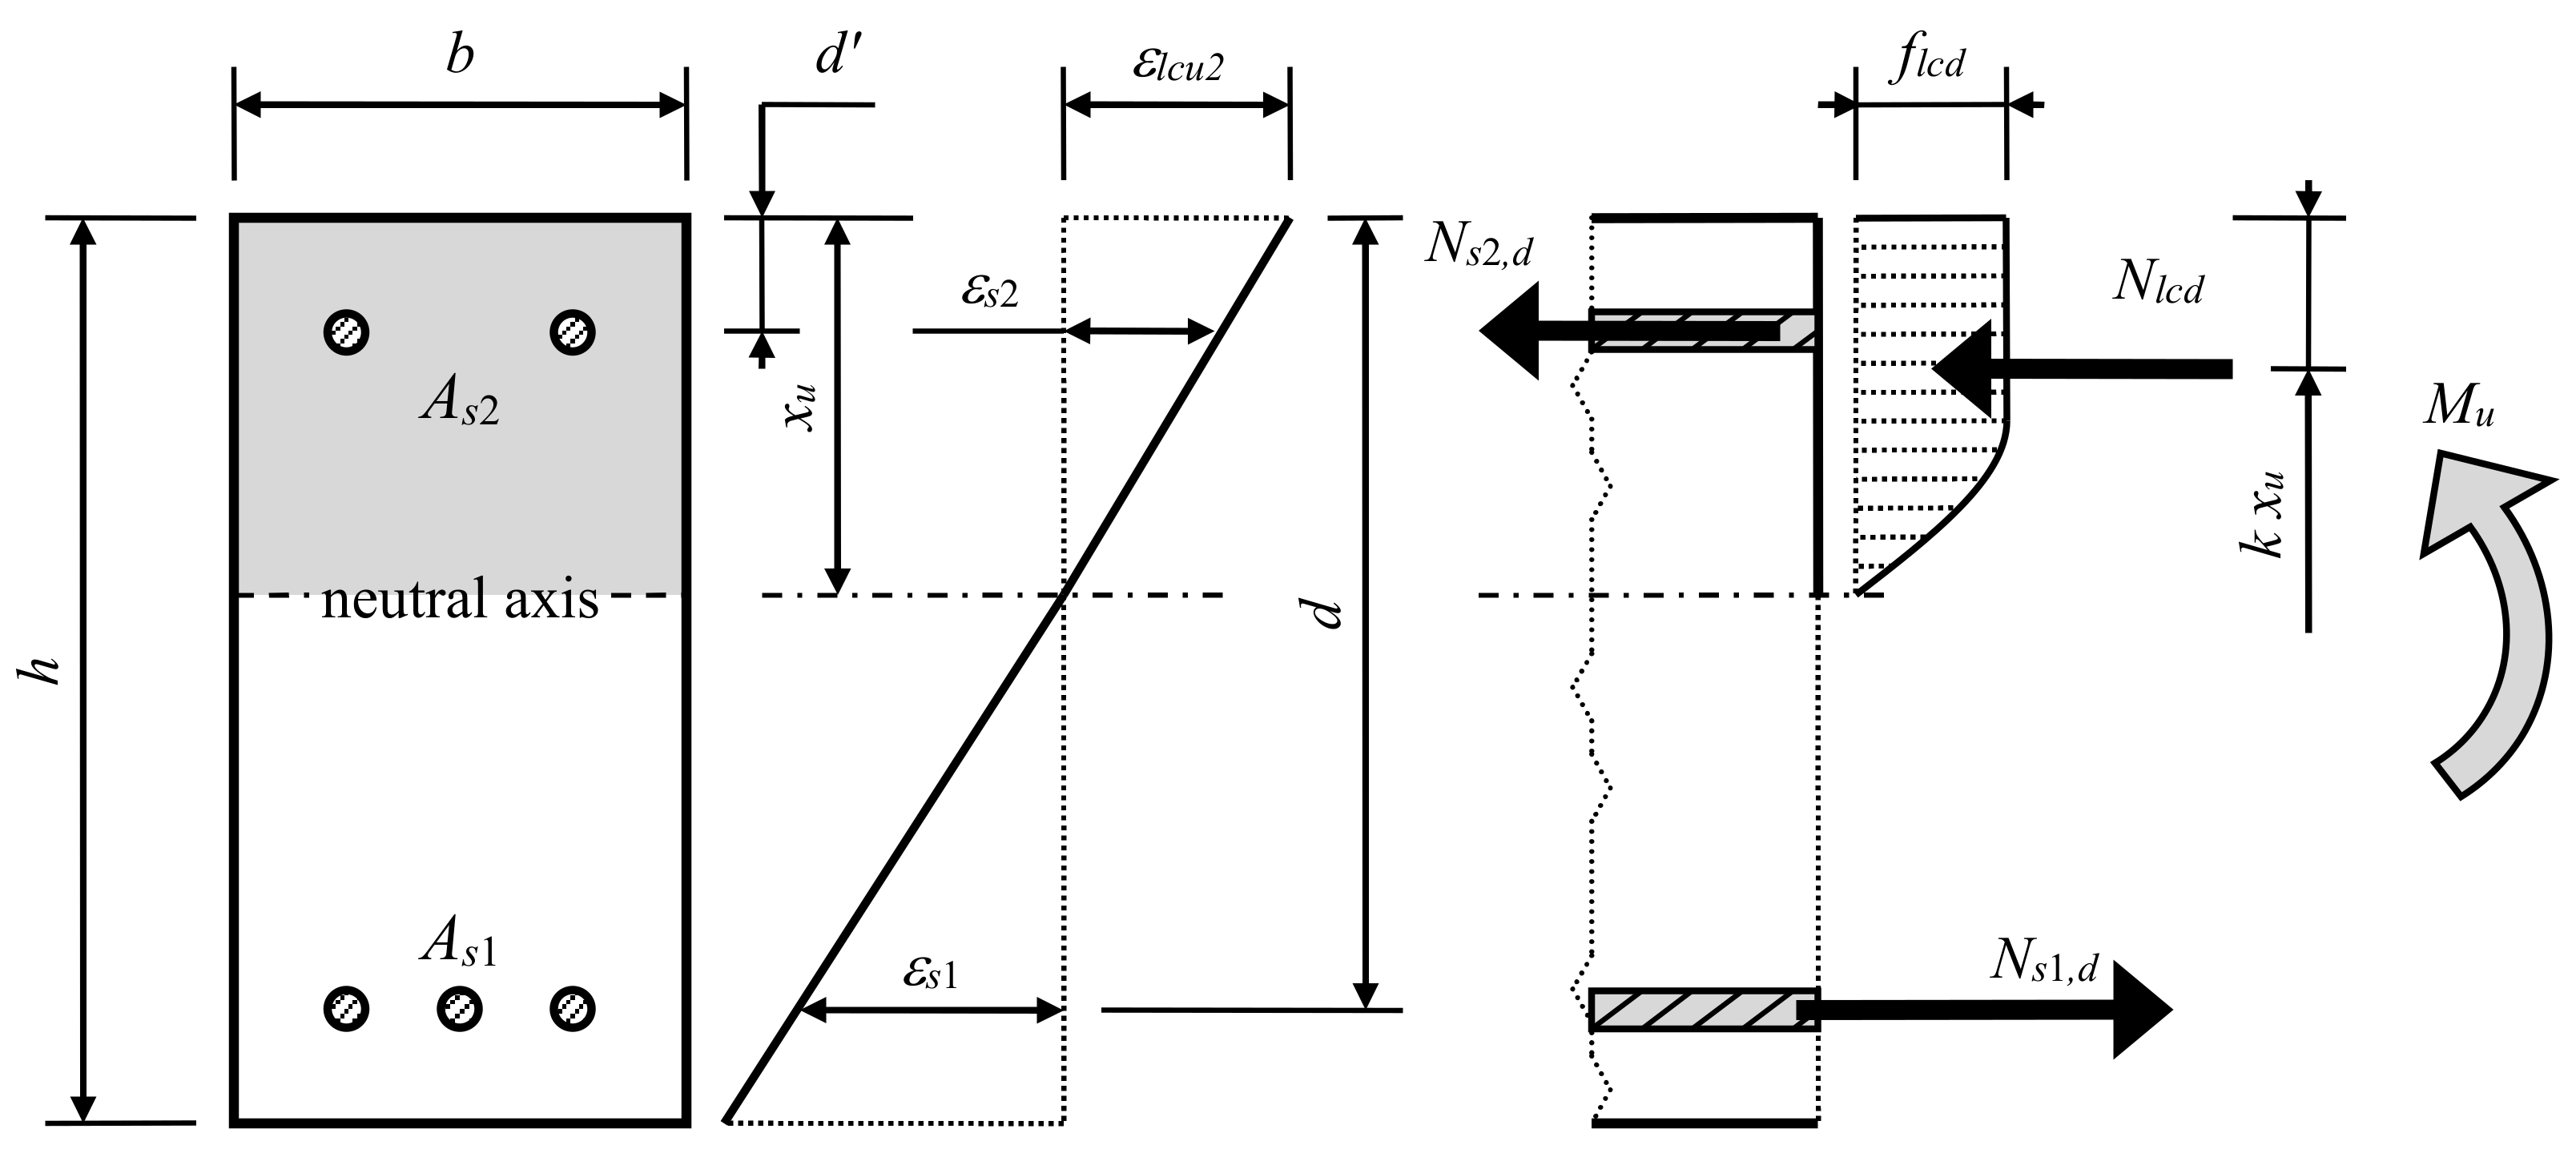
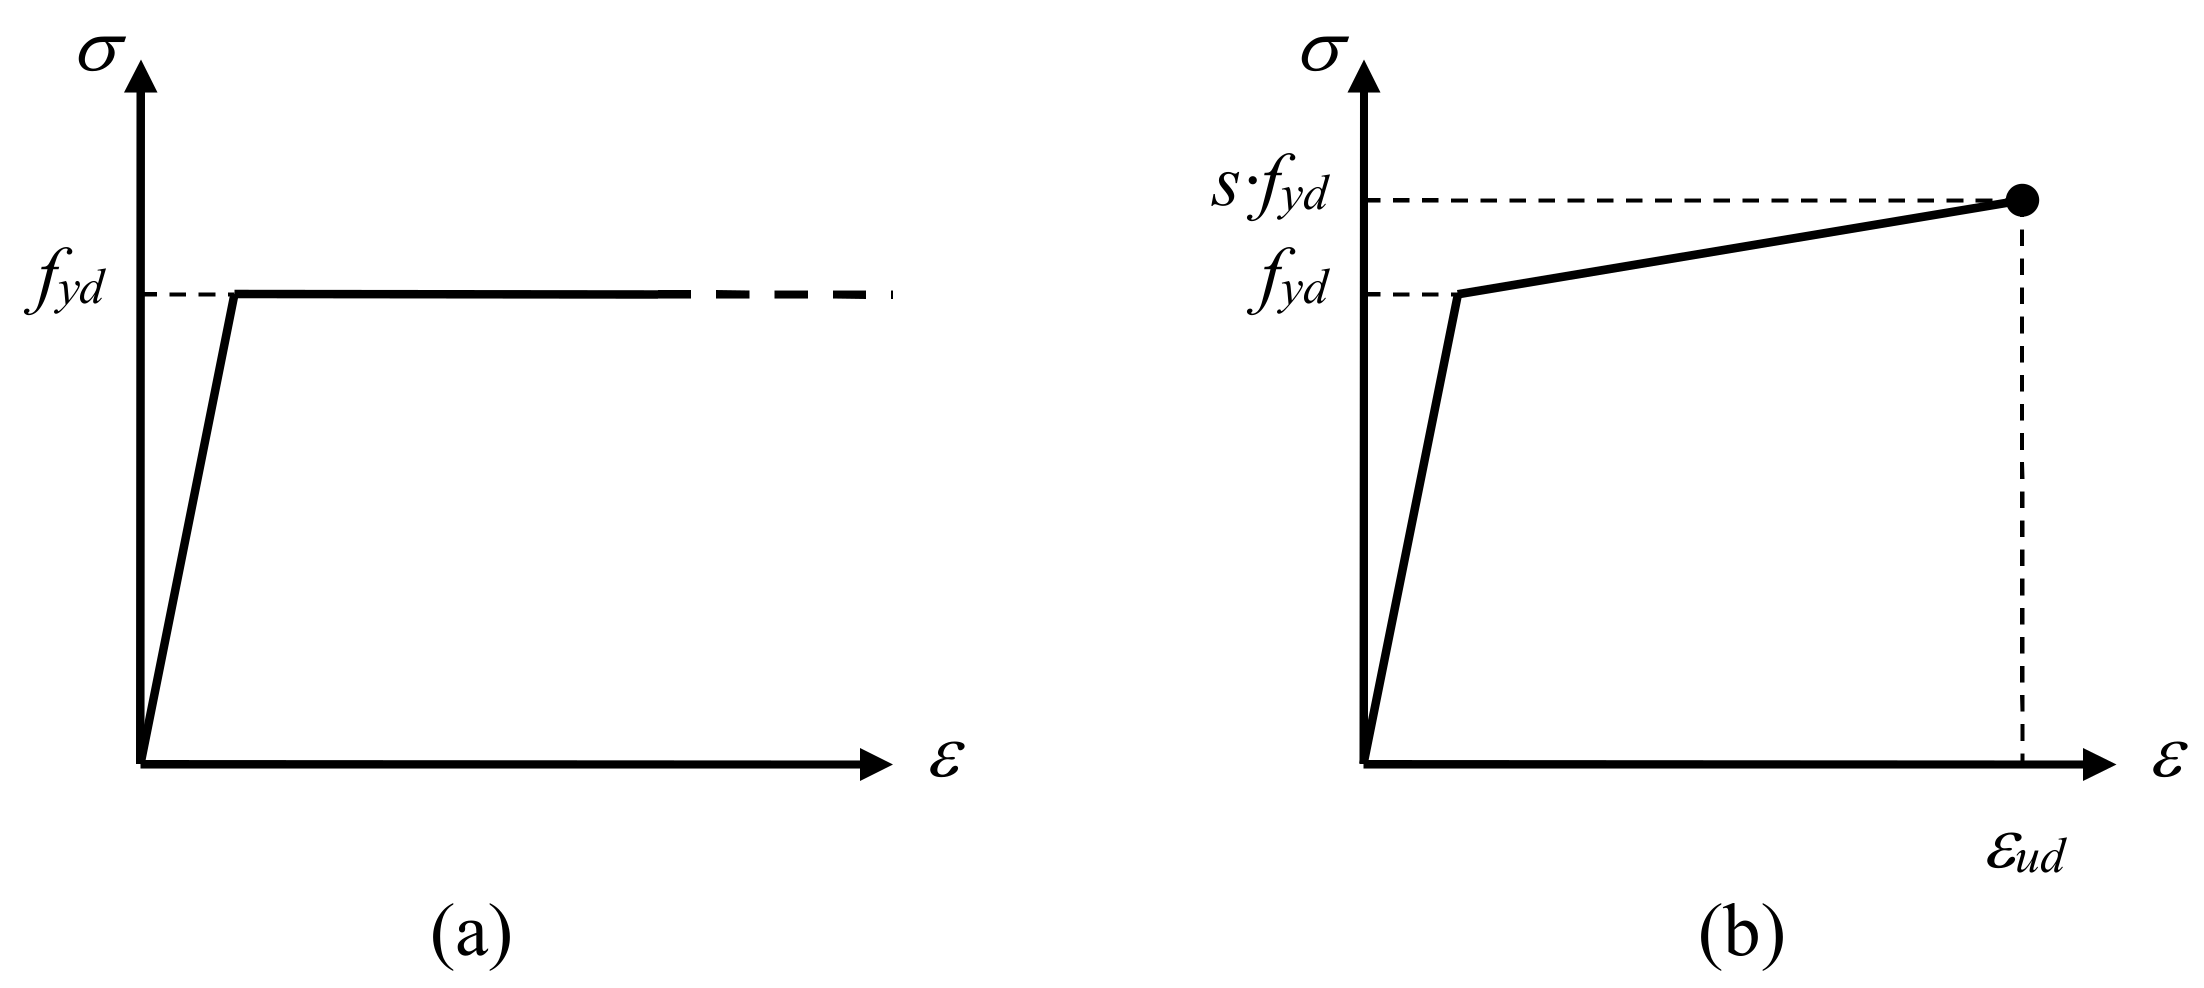
2.1. ULS Design Equations for Structures Subject to Pure Bending

This section presents, in the first place, the closed-form expressions that can be used for the design of reinforced lightweight aggregate concrete beams subjected to pure bending. Next, those expressions are generalized for their use if linear elastic analysis with limited redistribution is used to obtain the design bending moments and shear forces in statically indeterminate models (e.g., continuous beams and slabs).

2.1.1. Closed-Form Expressions for ULS Design

Regarding the structural design of lightweight aggregate concrete (LWC), the European standard EN 1992-1-1 (Eurocode 2) [2] admits the possibility of using a modified version of the parabola-rectangle diagram (Figure 1) just by adjusting the ultimate compressive strain of lightweight concrete in bending (εlcu2) through Equation (1).
ε l c u 2 = η 1   ε c u 2
where εcu2 is the ultimate compressive strain of conventional normal-weight concrete (NWC) which can be assumed to be equal to 0.0035 with normal strength concrete, i.e., if the characteristic compressive strength does not exceed 50 MPa.
Coefficient η1 in Equation (1) can be calculated through Equation (2):
η 1 = 0.4 + 0.6 ρ 2200
where ρ is the oven dry density of the LWC, in kg/m3. The parabola-rectangle diagram is shown in Figure 1 where the grade of the parabola is 2 for normal strength LWC. The value of the strain εlc2 in the diagram remains equal to that of NWC, i.e., εlc2 = 0.002.
Apart from the modification in strain εlcu2 with respect to NWC, another difference in the case of LWC is that the coefficient that accounts for the effects of long-term loading on its compressive strength (αlcc) has a recommended value of 0.85 compared to the recommended value of 1 in the case of the former concrete type. Thus, the design compressive strength of LWC for ultimate limit state (ULS) verifications is given in Equation (3):
f l c d = α c c f l c k γ c
where flck is the characteristic compressive strength of LWC and γc is the partial safety factor with a recommended value of 1.5. In order to find compact design equations, numerical integration is used to find the area and depth of centroid of the parabola-rectangle diagram. A rectangular reinforced concrete (LWC) cross-section is shown in Figure 2. Notice that, in compliance with Eurocode 2, if plastic hardening of the reinforcing steel is ignored in the design (Figure 3a), there is no need to check the tensile strain of the tension reinforcement (As1). Therefore, if the cross-section were subjected to pure bending, the stress–strain behaviour of the LWC in compression would always complete the full parabola-rectangle diagram in Figure 1.
The analytical solutions to the numerical integration of the parabola-rectangle diagram in Figure 1 across a rectangular area of width b and depth xu (depth of neutral axis) are given in Equations (4)–(6):
σ c = f l c d ε l c ε l c 2 2 ε l c ε l c 2                                         if   ε l c ε l c 2 f l c d                                                                             if   ε l c 2 < ε l c ε l c u 2
N l c d = λ L W C   f l c d   b   x u = f l c d   b   x u   1 1 3 ε l c 2 ε l c u 2
k   x u = x u   1 1 2 1 12 ε l c 2 ε l c u 2 2 1 1 3 ε l c 2 ε l c u 2
where Nlcd is the resultant compressive force developed by the LWC and (k xu) is the depth of force Nlcd (see Figure 2) which is required to obtain the lever arm with respect to the tension reinforcement As1. An equivalent rectangular stress block diagram for LWC is now possible, knowing the values of concrete force and centroid depth, as given in Table 1 for the different density classes compatible with structural application.
Notice how the values for density class 2.0 roughly match the classic values of the parabola-rectangle diagram for NWC. Indeed, the depth of the resultant compressive force in the concrete (Nlcd) might be taken as 0.4 of the neutral axis depth regardless of the density class. It is the resultant force Nlcd that is more affected by the density of LWC, with a 10% drop for density class 1 with respect to conventional concrete. Additionally, it should be noted that the value of flcd used in the calculation of Nlcd is 15% less than that of conventional concrete, because of coefficient αcc accounting for sustained loads. This reduction is not recommended for NWC. Combining both effects, the compressive response of LWC in a beam with a rectangular cross-section subjected to pure bending would be almost 25% less than in an analogous beam made with NWC.
For a rectangular reinforced concrete cross-section made with lightweight aggregate, the internal equilibrium of forces and moments is defined in Equations (7) and (8):
Force   equilibrium :           0 = λ L W C   f l c d   b   x u + A s 2   σ s 2 A s 1   f y d
Moment   eq . : M E d = λ L W C   f l c d   b   x u d 0.4   x u + A s 2   σ s 2 d d
where MEd is the design bending moment for ULS; As2 and As1 are the areas of the compression and tension reinforcements, respectively (see Figure 2); b and d are the cross-sectional width and effective depth, respectively; xu is the neutral axis depth at failure; d′ is the depth of the compression reinforcement; λLWC is the coefficient associated with the resultant compressive force of the equivalent rectangular stress block, which depends on the density class (see Table 1); fyd is the design yield strength of the reinforcing steel (see Figure 3); and σs2 is the stress of the compression reinforcement As2.
Solving the internal equilibrium equations, it is possible to develop the following closed-form expressions for ULS design, Equations (9) and (10):
If   M E d M 0.45 d , L W C     A s 2   not   required   A s 1 = λ L W C   f l c d   b   d 0.8   f y d 1 1 1.6 M E d λ L W C   f l c d   b   d 2
If   M E d > M 0.45 d , L W C     A s 2 = M E d M 0.45 d , L W C σ s 2 d d                                           A s 1 = A s 2 σ s 2 f y d + 0.45   λ L W C   f l c d f y d   b   d
The distinction between Equation (9) and Equation (10) depends on the design bending moment MEd in relation to M0.45d,LWC. The latter is the bending strength of a rectangular cross-section subjected to pure bending without compression reinforcement, when the neutral axis lies at a depth exactly equal to 45% of the effective depth d. For bending moments in excess of M0.45d,LWC the cross-section without compression reinforcement As2 would exhibit a neutral axis depth xu over 0.45d, which is the limit stablished by Eurocode 2 on account of sufficient rotation capacity at failure. The value of the bending moment M0.45d,LWC may be calculated through Equation (11):
M 0.45 d , L W C = 0.369   λ L W C   f l c d   b   d 2
Furthermore, in order to solve Equation (10), the value of stress σs2 is required and it can be calculated using Equation (12):
σ s 2 = η 1 1 2.22 d d · 700   MPa f y d
The latter equation is a consequence of the Navier hypothesis and the strain compatibility equations defining the strain distribution in Figure 2, assuming that the longitudinal modulus of elasticity of the reinforcing steel is 200 GPa and that the neutral axis depth is located at exactly xu = 0.45d.
As is well known, an increase in the design bending moment to be withstood by a reinforced concrete section requires taking into account the contribution of the compression reinforcement to the internal equilibrium in order to maintain the depth of the neutral axis and rotation capacity unchanged. Therefore, the “not required” annotation in Equation (9) means that the compression reinforcement (As2) is not needed for the internal equilibrium of the cross-section, regardless of a minimum amount of reinforcement that would undoubtedly be necessary on account of execution demands, shrinkage control, skin reinforcements or longitudinal support for the shear reinforcement. Unfortunately, as will be seen in the next section, the limit xu ≤ 0.45d would need further revision as, for lighter density classes, the required rotation capacity at failure is greater than that of NWC.

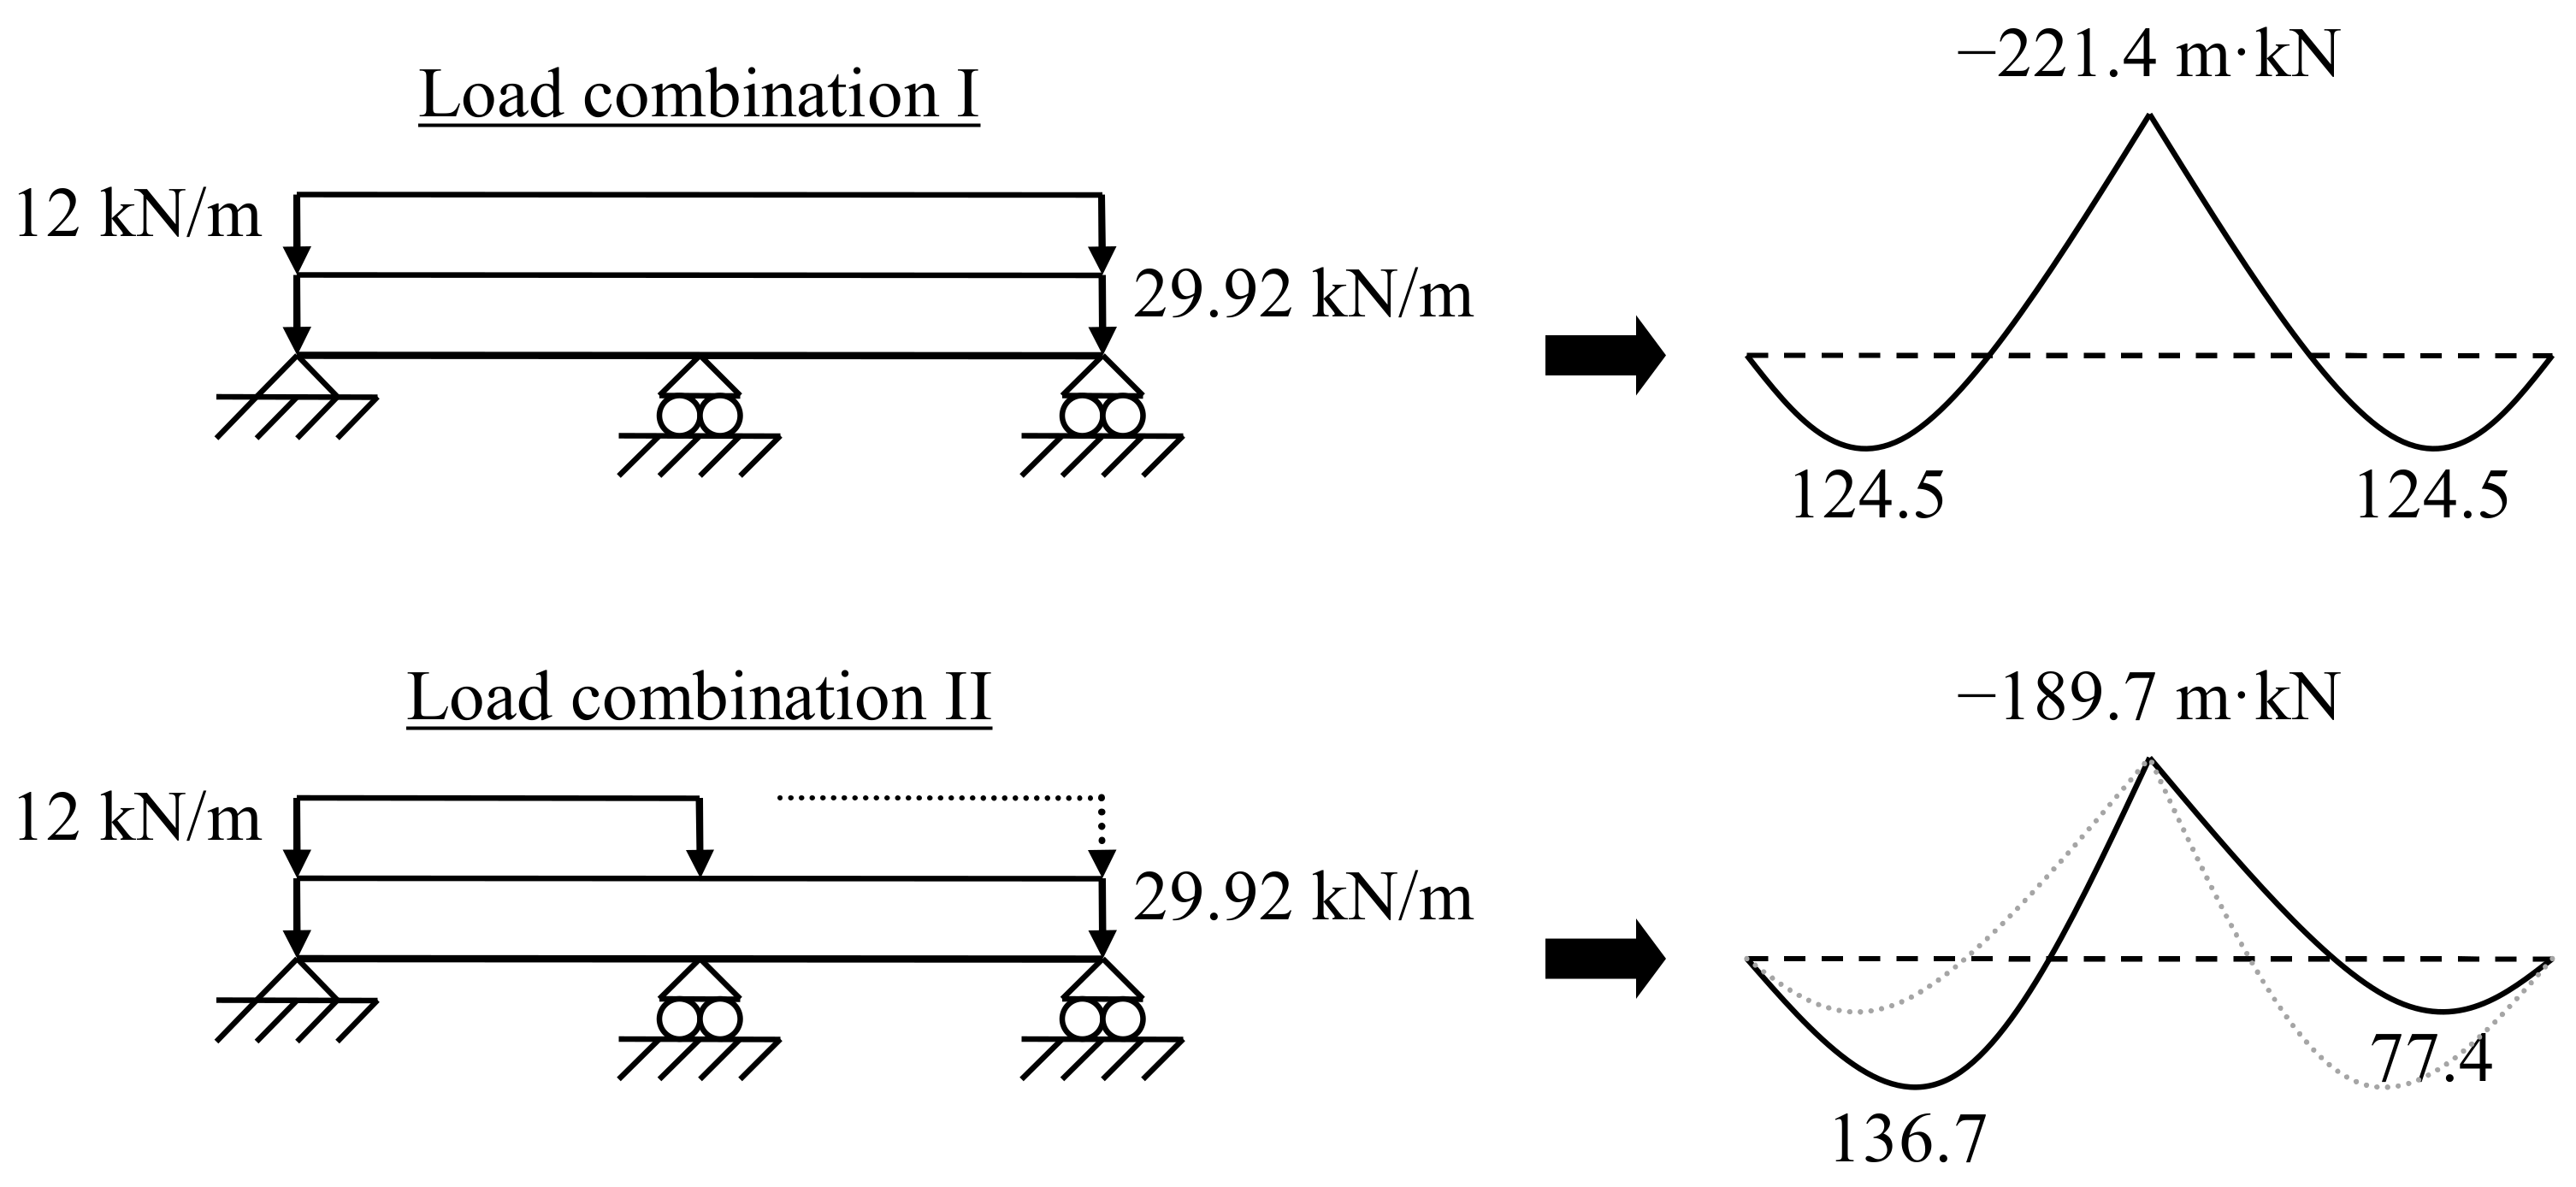
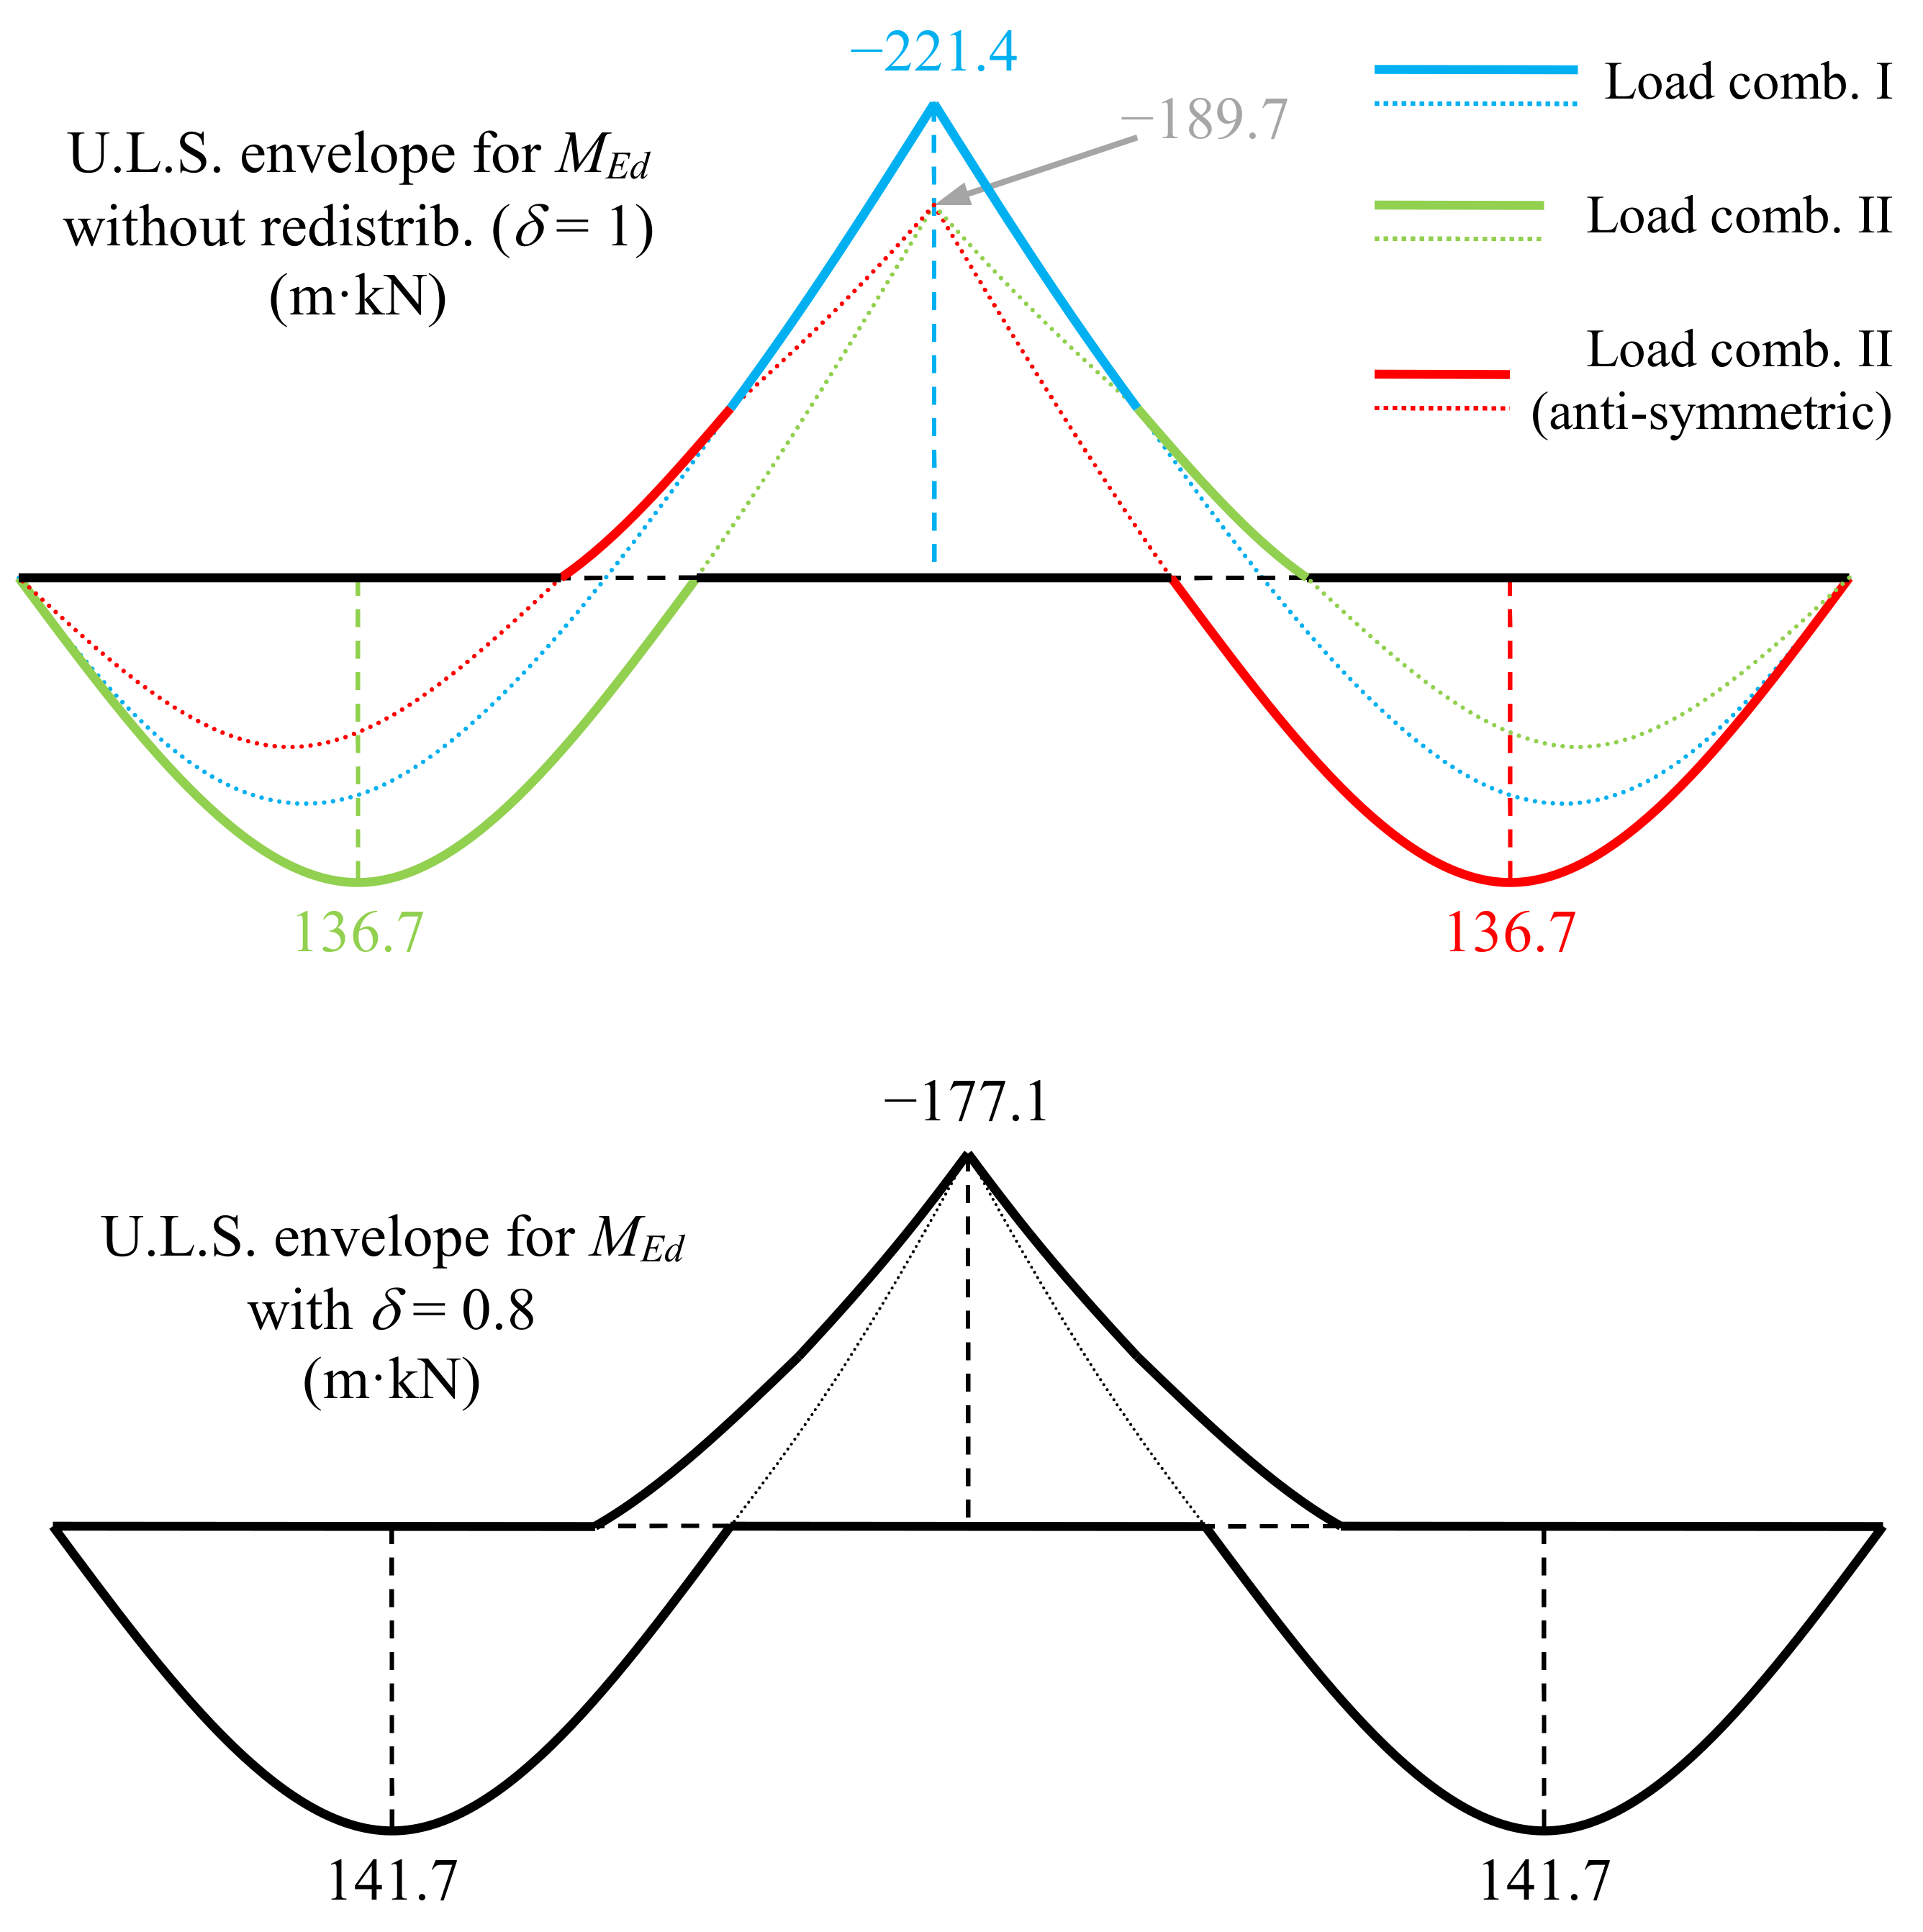
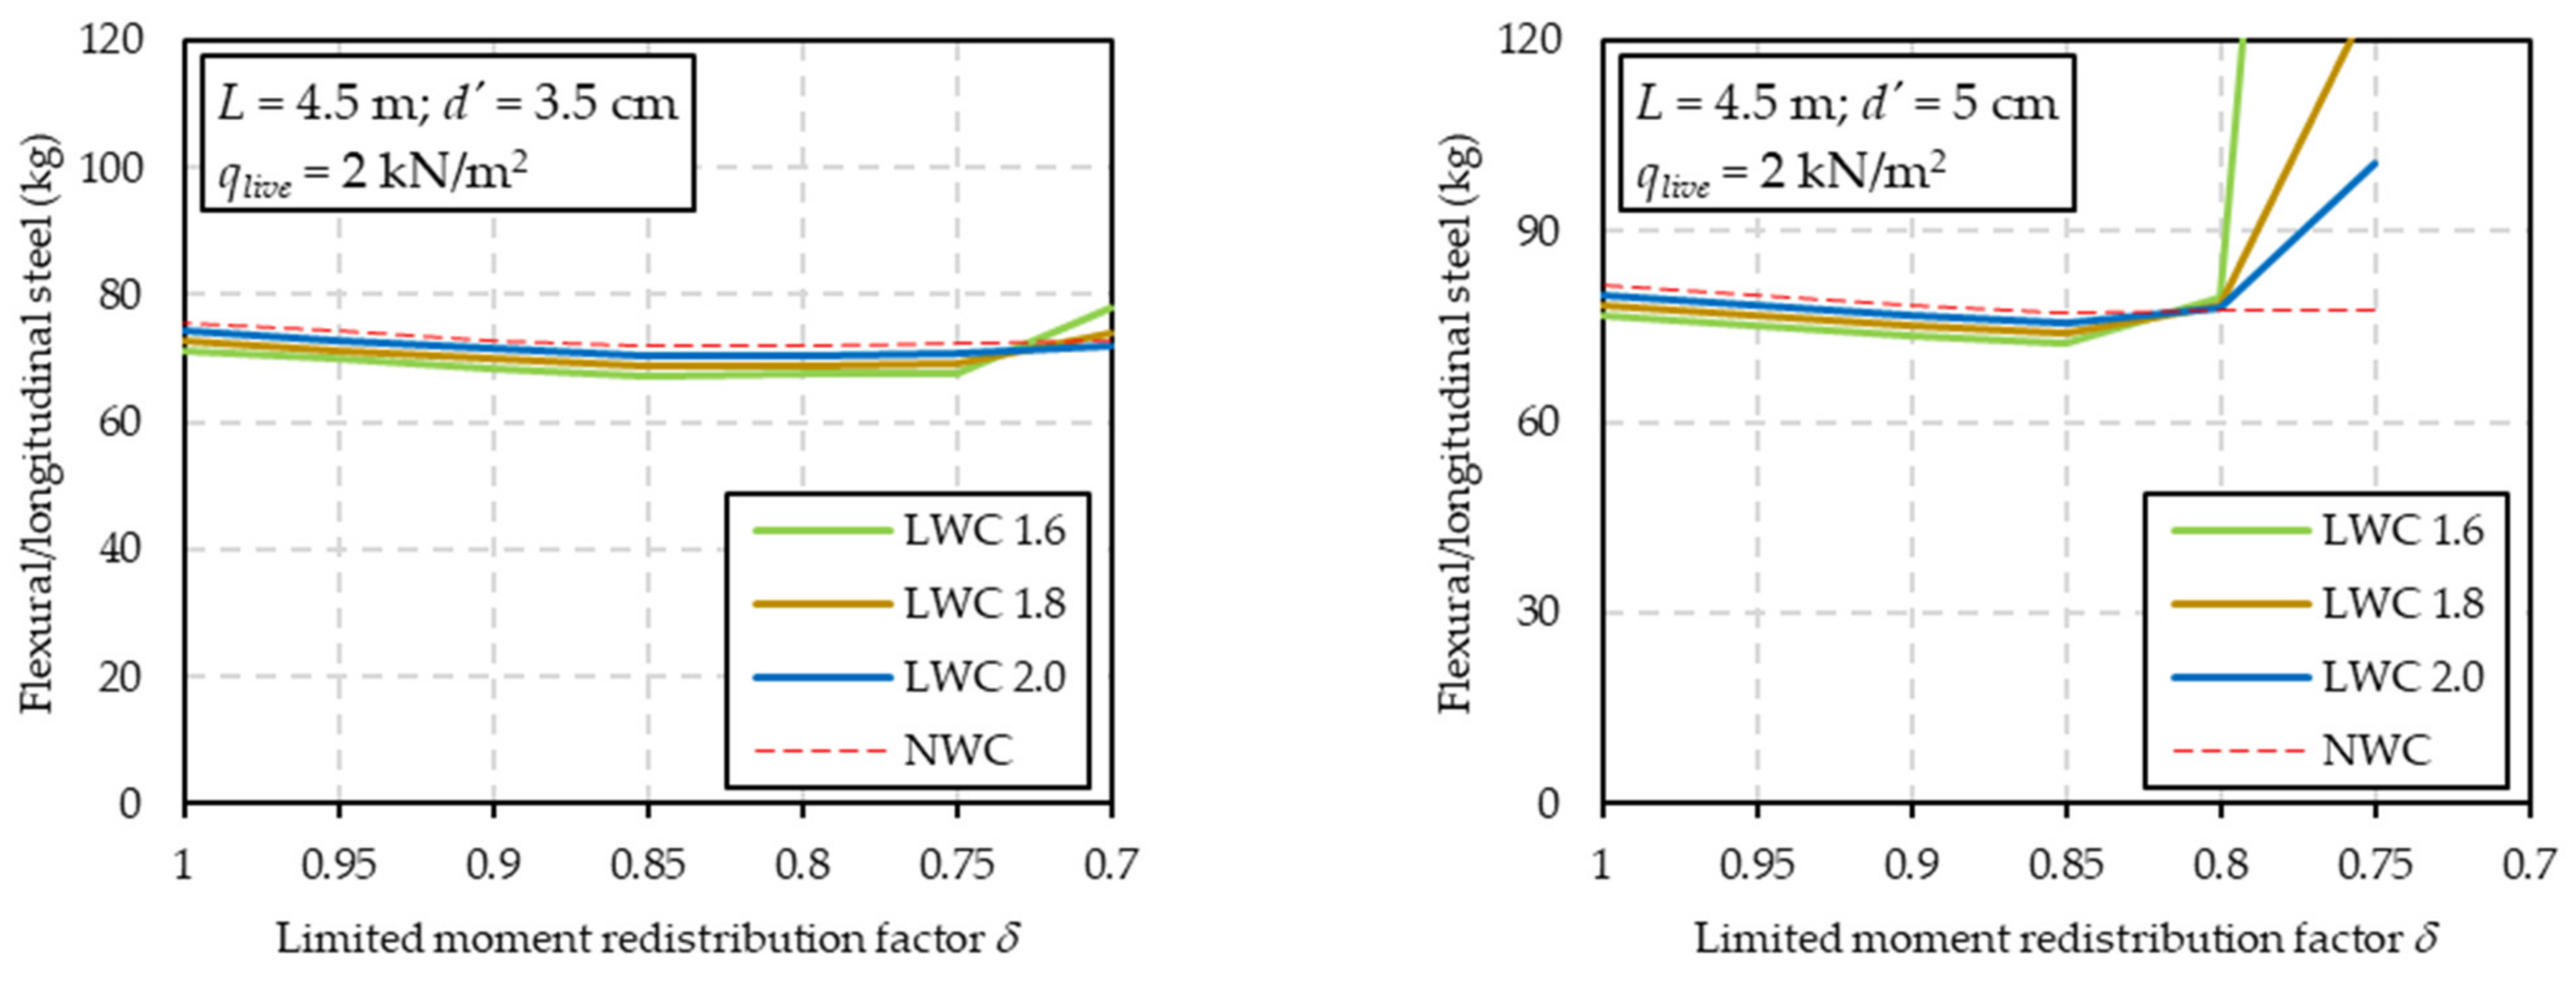
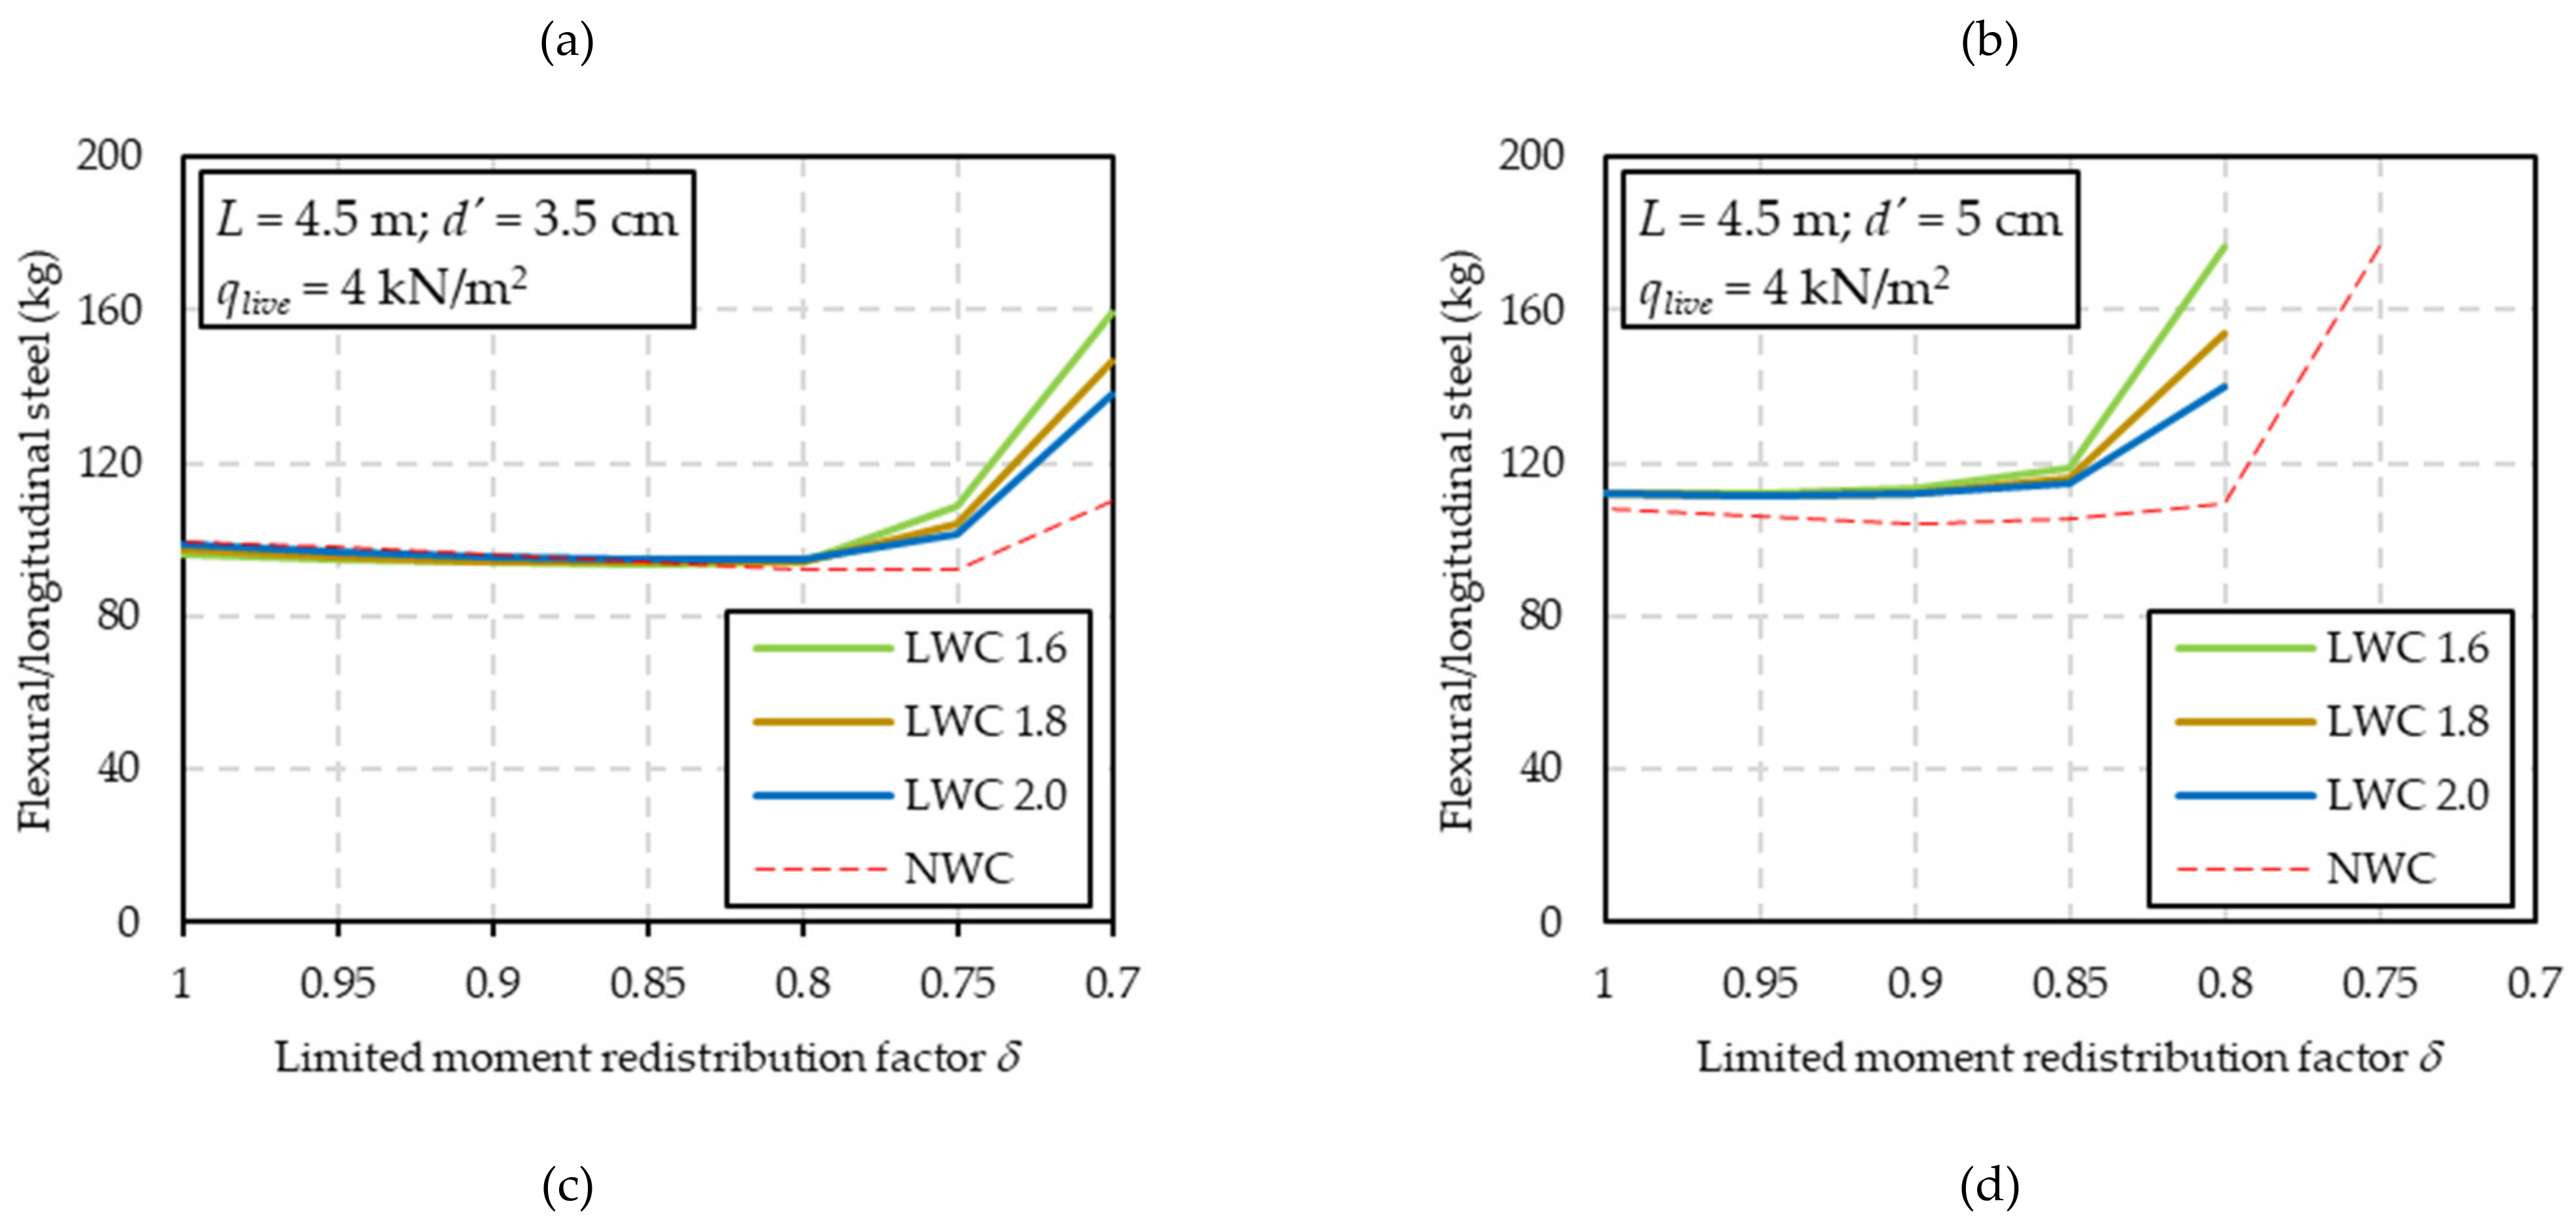
2.1.2. Linear Elastic Analysis with Limited Redistribution

Redistribution of the bending moments obtained through linear elastic analysis is possible in Eurocode 2 in the case of beams and slabs—not in supports and walls—provided that the cross-section at failure possesses sufficient rotation capacity. A simplified approach to check the rotation capacity limits the neutral axis depth to values shallower than 0.45d. In the case of normal strength lightweight aggregate concrete (with flck ≤ 50 MPa), the bending moment diagram resulting from linear elastic analysis may be multiplied by a factor δ, given in Equations (13) and (14):
δ 0.44 + 1.25   x u d 0.6 + 0.0014 ε l c u 2 = 0.44 + 1.25   x u d 0.6 + 0.4 η 1
x u d ξ m a x = δ 0.44 1.25 0.6 + 0.4 η 1
Moreover, factor δ cannot be smaller than 0.8 in the case of Class A steel reinforcements, nor smaller than 0.7 otherwise. Notice how Equation (14) now defines the maximum allowable neutral axis depth at failure as a function of the redistribution factor δ used in the global analysis for ULS verifications.
Let us assume that the results from a linear elastic analysis are used for the ULS design of a continuous beam in pure bending. In that case, the model is statically indeterminate and δ = 1. If the beam were made with normal-weight concrete (NWC), coefficient η1 would be equal to 1 and the ratio (xu/d) would be limited to a value ξmax = 0.448 (which roughly matches the 0.45d limitation discussed at the end of previous section). However, if lightweight aggregate concrete (LWC) is used, coefficient η1 is no longer equal to 1 (see Table 1), so the value ξmax in Equation (14) should be calculated specifically for each density class. Accordingly, while the value of ξmax is approximately 0.45 for NWC structures designed with linear elastic analysis in ULS (δ = 1), a LWC of density class 1.2 would have ξmax reduced to less than 0.4, or even less than 0.2 with δ = 0.7. Therefore, a new set of closed-form expressions is required to account for different density classes and redistribution factors. Going back to the internal equilibrium equations, it is possible to obtain a general methodology with accurate closed-form expressions, starting with those situations in which the design bending moment has low to moderate values and the cross-section analysis might safely ignore the contribution of the compression reinforcement. The required tension reinforcement area (As1) is given by Equation (15):
A s 1 = λ L W C   f l c d   b   d 0.8   f y d 1 1 1.6 M E d λ L W C   f l c d   b   d 2         if   M E d M t h r
where Mthr is a threshold bending moment in excess of which the LWC cross-section would call for a specific design compression reinforcement. This threshold bending moment can be calculated through Equation (16):
M t h r = Φ 1   f l c d   b   d 2         with   Φ 1 = λ L W C   ξ m a x 1 0.4   ξ m a x
For design bending moments MEd in excess of the threshold Mthr both compression and tension reinforcements must be provided, according to Equation (17):
If   M E d > M 0.45 d , L W C     A s 2 = M E d M t h r σ s 2 d d                                           A s 1 = A s 2 σ s 2 f y d + Φ 2   f l c d f y d   b   d     with   Φ 2 = λ L W C   ξ m a x
An important issue in the control of the neutral axis depth through the contribution of the compression reinforcement is whether the steel in compression yields or not. In that regard, it must be noted that Equation (9) is no longer valid, as it was specifically associated with the threshold position of the neutral axis depth at xu = 0.45d that corresponds to NWC—although it might be almost compatible with density classes 2.0 and 1.8—and a linear elastic analysis without redistribution (δ = 1). Otherwise, it is mandatory to redefine the strain compatibility analysis for the different threshold strain distributions at xu = d·ξmax in order to obtain the strain εs2 and the stress σs2 (with Es = 200 GPa). This is solved and presented in Equation (18), which now replaces Equation (12).
σ s 2 = η 1 1 d ξ m a x   d · 700   MPa f y d
On the other hand, the stress of the compression reinforcement to be used in Equation (17) is solved through Equation (18) for different ratios (d′/d) and shown in Table 2, as a function of the density class and the redistribution factor. A reinforcing steel with a characteristic yield strength of 500 MPa is considered in Table 2, with a safety factor γs = 1.15 as recommended in Eurocode 2, hence the value of 435 MPa.
Values of the ratio (d′/d) of 0.05 and 0.10 may correspond to deep beams in most cases, whilst values between 0.15 and 0.2 may be found in flat beams, wide-shallow beams (WSBs) and slabs. Notice that there are numerous instances in Table 2 in which the compression reinforcement does not match the yield strength. Moreover, for lighter density classes than 1.8, the compression reinforcement would be actually in tension if a high level of redistribution were used (δ = 0.7) and the compression reinforcement cover d′ were around 20% of the effective depth d. That would mean that the design problem would not have a practical solution in those cases and that it would not be sensible to use the highest level of redistribution allowed in Eurocode 2 with LWAC in flat beams, WSBs or slabs.

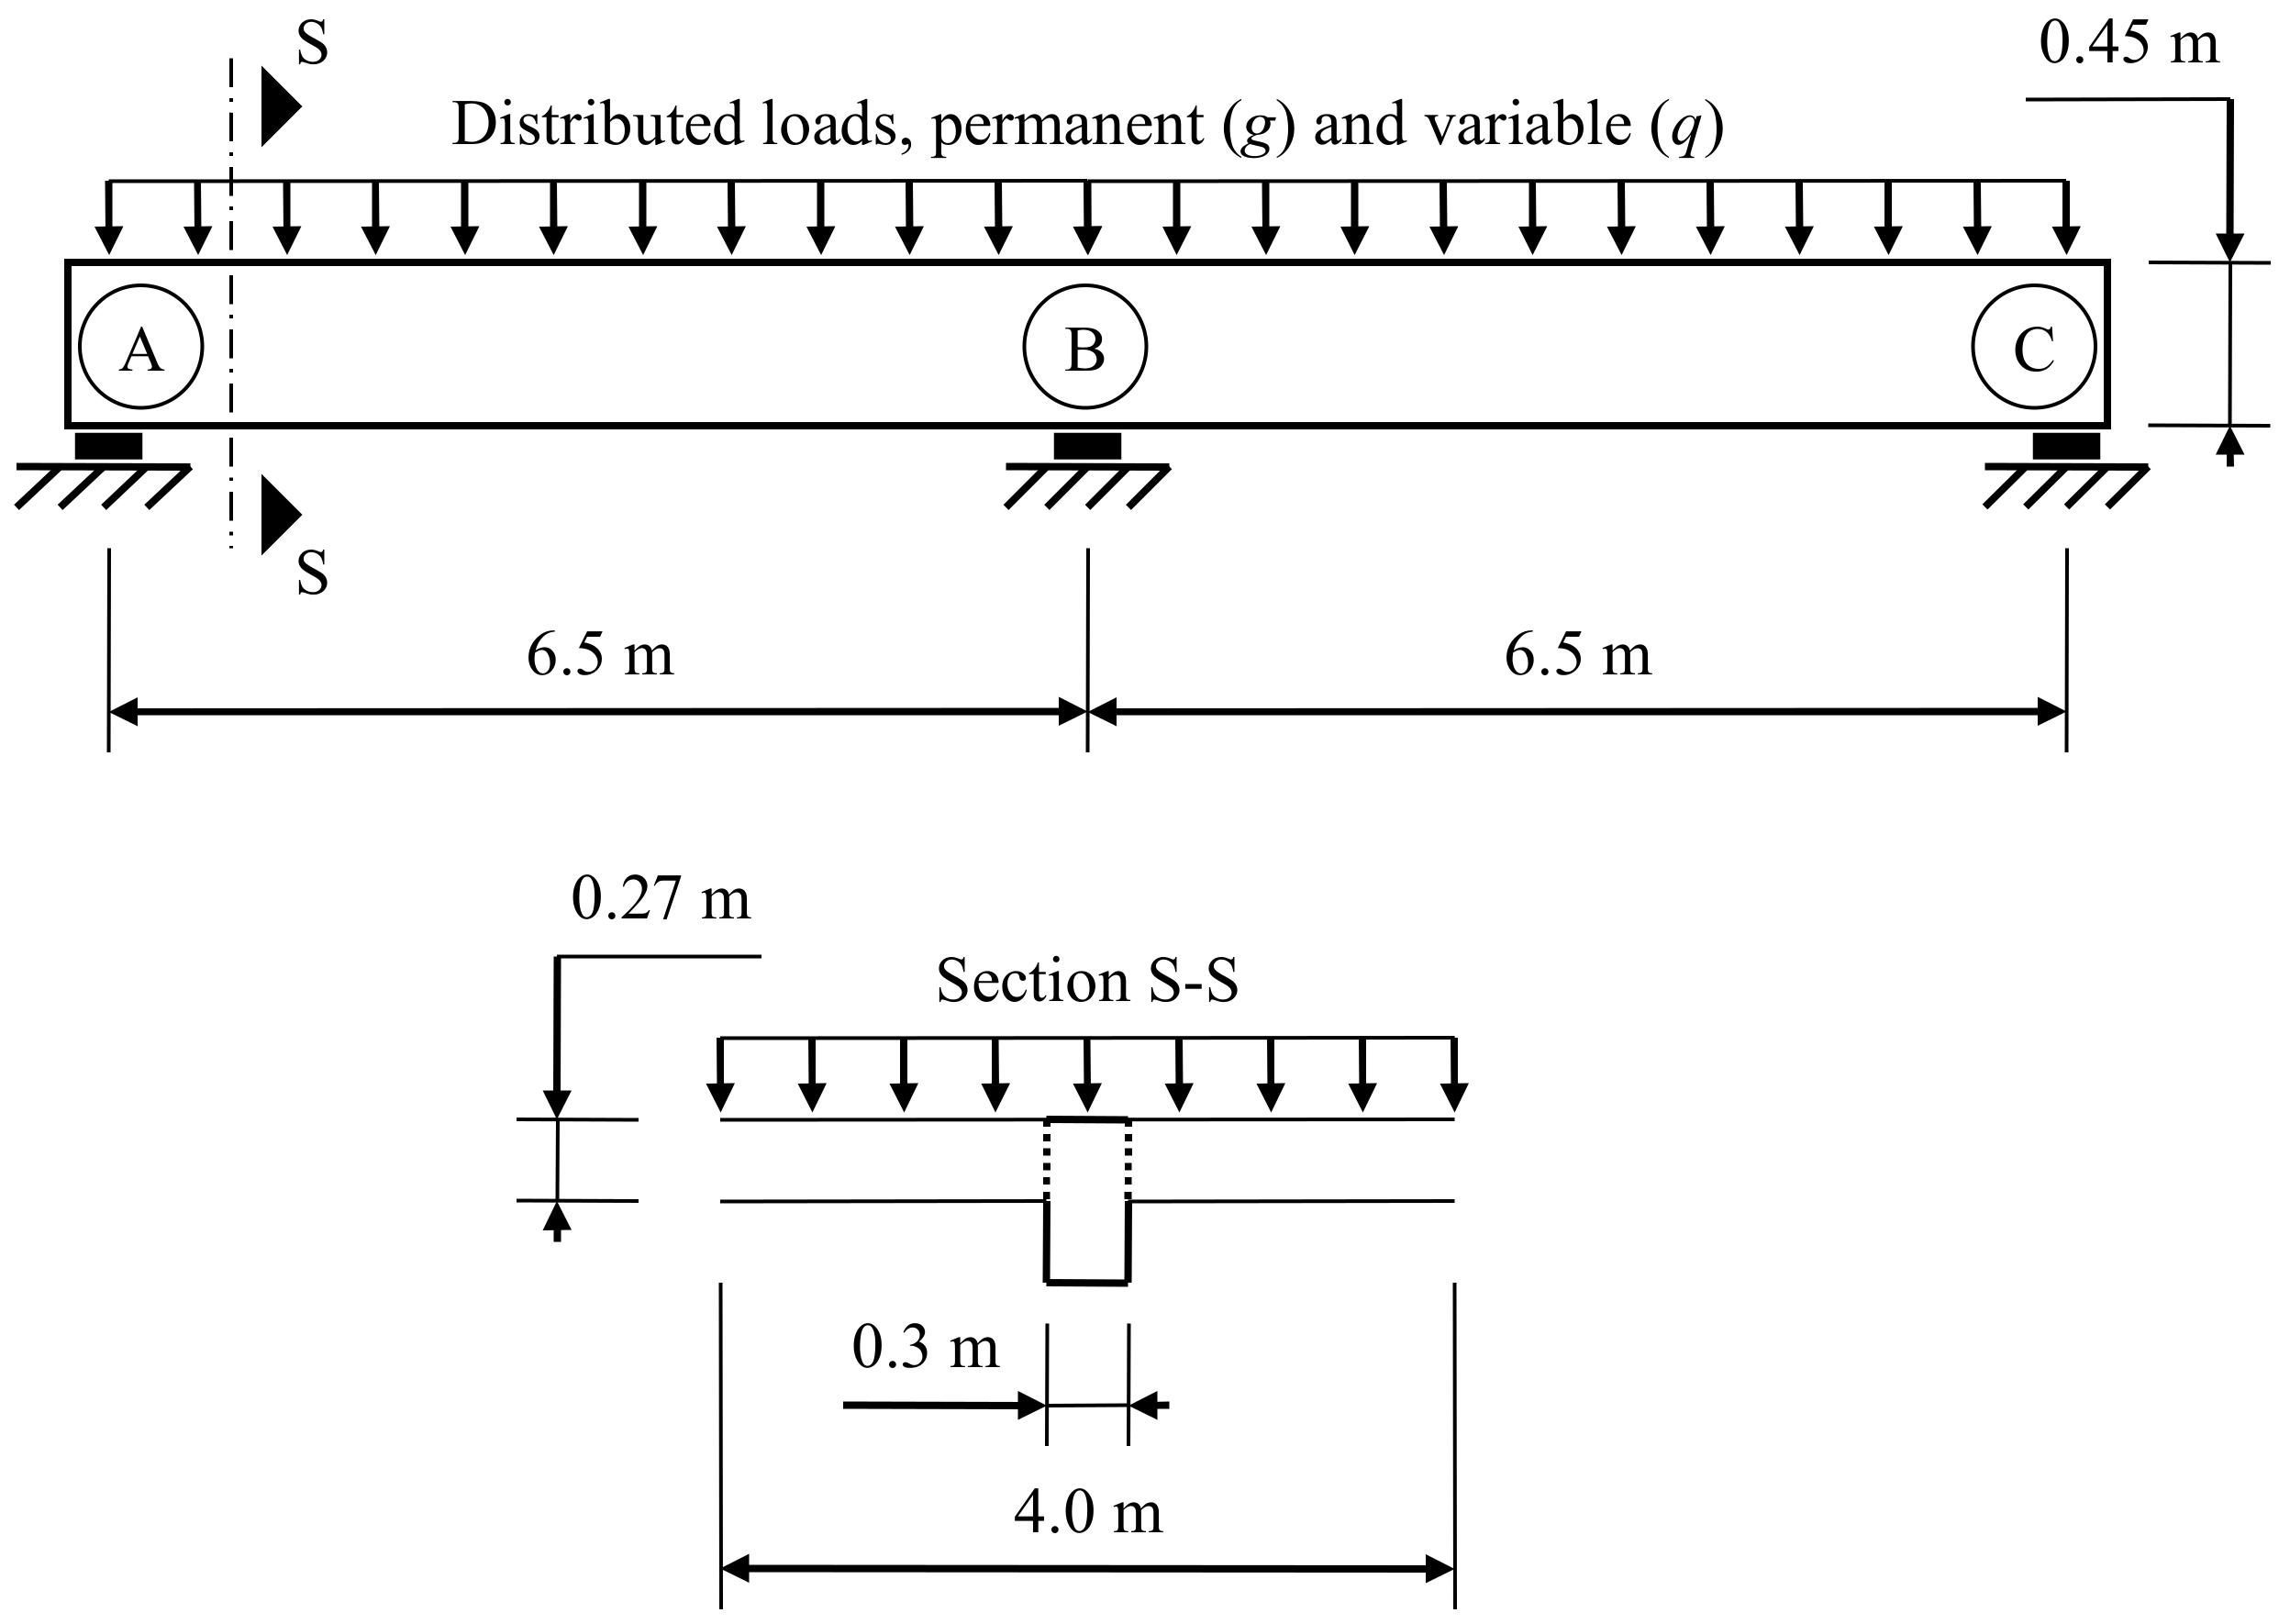
3. Case Study and Formulation of the Parametric Analysis

This section first applies the design equations presented above to a typical case in building construction, for three types of density class. The need for a structural parametric analysis is demonstrated and the input and output parameters are presented. This section also includes a brief discussion about the LWC class densities and dosages that would be feasible for the required concrete strength grades considered in the parametric analysis.

3.1. Case Study

The design of the continuous reinforced concrete (RC) beam in Figure 4 serves the purpose of showcasing the impact of lightweight concrete on the design of reinforced concrete elements. The beam has a rectangular cross-section with a total depth h of 45 cm, width b of 30 cm and an effective depth d of 41 cm. It is assumed that the compression reinforcement has a concrete cover d′ of 4 cm to the longitudinal rebar centre. The RC beam supports a floor slab with a tributary width of 4 m. Besides, its own self-weight and that of the floor slab, the RC beam must withstand a dead load of 2 kN/m2—which includes the weight of installations, partitions, ceiling, floor tiling and finishes—plus a live load of 2 kN/m2 (category A in accordance with Eurocode 1 [36]. Pattern loading is considered, meaning that the live load might be applied along the whole length of the beam or only upon one of the bays.
The reinforcing steel considered for this design has a characteristic yield strength of 500 MPa, with a Young’s modulus of 200 GPa. For the purpose of this case study, the design equations presented in the previous section are used, which are in accordance with the recommended default coefficients in Eurocode 2 [2]. Three different densities are considered for this design: a normal weight reinforced concrete (NWC) with a specific weight of 25 kN/m3; a LWC of density class 1.8 (with 19.5 kN/m3); and a LWC of density class 1.2 (with 13.5 kN/m3). The characteristic compressive strength of concrete is fck = flck = 25 MPa, regardless of the density. However, the long-term reduction coefficient αcc (see Equation (3)) has the recommended value 1 for NWC and a smaller value 0.85 for both types of LWC.
The global analysis for calculation of bending moments applied on the beam is performed with δ = 1 (without redistribution), δ = 0.8 and δ = 0.7 in order to compare how this factor would affect the impact of using lightweight concrete. Nonetheless, notice that the vertical reactions transmitted to the supports are those of the linear elastic analysis (δ = 1) because moment redistribution can be used for the reinforcement design of horizontal elements of moment resisting frames (i.e., beams and slabs).
Regarding the use of LWC, it is assumed that it is only used for the horizontal elements of the building (RC beams and floor slabs), and not for supports. In the case of the floor slabs, they are built with a beam and block system, including precast prestressed concrete beams (made with NWC, self-weight of 0.27 kN/m), infill blocks (1 kN/m with a repetition interval of 70 cm) and cast “in situ” normal weight concrete or LWC (with an area of 0.0467 m2/m for a repetition interval of 70 cm). The floor slab would then weight 3.35 kN/m2 (normal weight “in situ” concrete); 3.12 kN/m2 (lightweight “in situ” concrete of density class 1.8); and 2.72 kN/m2 (lightweight “in situ” concrete of density class 1.2). The total vertical load transmitted to the supports is given in Table 3, where it can be noted that the total vertical load for ULS design of the supports could be reduced by almost 12% in this particular case.
The value pEd,ULS,max is the design value of the uniformly distributed load applied on the beam for ULS verifications, with both permanent and live loads acting with unfavourable effect, i.e., the total permanent load (gbeam + gfloor + gdead) would be multiplied by γG = 1.35 and the live load (qlive) would be multiplied by γQ = 1.5.
The results associated with the design of the longitudinal reinforcement at the critical sections are given in Table 4 (linear elastic analysis), Table 5 (redistribution of bending moments with δ = 0.8) and Table 6 (redistribution with δ = 0.7). The effect of pattern loading on the redistribution analysis is shown in Figure 5 and Figure 6, which correspond to the design that uses LWC of density class 1.8. Load combinations I and II (used in Table 4, Table 5 and Table 6) are shown in Figure 5 and they, respectively, produce the maximum negative bending moment at B (hogging bending) and the maximum positive bending moment along the bay (sagging). The bending moment diagrams represented in Figure 5 are obtained with linear elastic analysis and the envelopes of design bending moments for ULS are shown in Figure 6 for redistribution values δ = 1 and δ = 0.8. Notice how the redistributed bending moment at B is less than the original bending moment at B for combination II, which causes a slight increase of the sagging bending moment from 136.7 to 141.7 (by 3.7%).
Finally, in order to compare the impact of the redistribution factor and the density class on the reduction of steel used for longitudinal reinforcement, the following assumptions are made: all cross-sections predominantly subjected to negative bending moments have the same longitudinal reinforcement as the cross-section at B. Likewise, cross-sections predominantly subjected to positive bending will have the same longitudinal reinforcement. Furthermore, a minimum amount of longitudinal steel in compression of 113 mm2 is always considered, in compliance with the Spanish Standard for Structural Concrete [37]—Eurocode 2 does not define a minimum ratio for the longitudinal compression rebars for beams. With the aim of estimating the total consumption of steel for longitudinal reinforcement, it will be assumed that 25% of the span is subjected predominantly to negative bending moments. Thus, it would be possible to have an estimation of the longitudinal amount of steel along the span by adding 0.75·As,total,sagging + 0.25·As,total,hogging, which would then be converted into kilograms by using the span length and the density of steel. This estimation is summarized in Table 7.
Notice that the values annotated in Table 7 correspond to the longitudinal reinforcing bars. The reinforcement of RC beams includes also the shear reinforcement. In accordance with Eurocode 2, the contribution of the concrete to the shear strength cannot be added to the shear strength provided by stirrups, which is not affected by the use of LWC, which agrees with empirical evidence reported by Walraven et al. [32]. Furthermore, given that the design loads have been reduced, it could be possible to use greater spacing between stirrups at the critical sections, thus consuming less steel. Nevertheless, it has not been addressed here and it will be assumed that the shear reinforcement of the beam does not change because of the density class.
If a traditional linear elastic analysis, endorsed by Eurocode 2 for ULS design, is used to calculate the bending moment envelope, the impact of density class 1.2 on the steel consumption is positive, saving 7.5% in the longitudinal layout. Arguably, the most significant finding is that the best and the worst results are obtained using redistribution and density class 1.2, which may lead to a reduction of 10% in steel consumption—with respect to the conventional NWC and the traditional linear elastic analysis—or to an additional waste of almost 25%, just by slightly modifying the redistribution factor δ from 0.8 to 0.7.
An important factor to be accounted for is the making of the LWC. While it may seem an optimum choice to specify a class 1.2 LWC and proposing a linear elastic analysis with a redistribution factor δ = 0.8 for the previous example, it should be noted that for a given compressive strength, the lighter the concrete the greater the cement content required, among other materials. Besides, one specific example cannot possibly be generalized to reach sound conclusions, hence the need for a massive structural parametric analysis.

3.2. Definition of the Parametric Analysis

In order to showcase the interrelation between the different variables that may affect the design, a continuous two-span beam is now studied, but for a much wider scope of design variables. These are the following:
  • Live load qlive: four possible alternatives of 2, 3, 4 and 5 kN/m2.
  • The tributary width TW of the floor slab supported by the beam: six possible values ranging from 3.5 m to 6 m, at 0.5 m intervals.
  • Cross-sectional dimensions b (width) and h (depth) (m). Two different typologies have been considered: (i) downstand beams, with depths h between 35 and 55 cm (at 5 cm intervals) and widths b of 25, 30 or 35 cm; and (ii) flat beams or wide-shallow beams (WSBs) with a depth h equal to that of the floor slab (27 cm) and seven different values of the cross-sectional width b, ranging from 40 to 70 cm at 5 cm intervals.
  • Concrete cover d′ (to longitudinal rebar centre): four possible values ranging from 3.5 cm to 5 cm, at 0.5 cm intervals.
  • Concrete compressive strength fck or flck: four possible grades, 20, 25, 30 and 35 MPa.
  • Density class: three types of LWC with classes 1.6, 1.8, 2.0 plus the conventional concrete, NWC.
  • Cement type: two cement strength grades are considered, 42.5 or 52.5 MPa. This parameter, along with the density class and concrete strength, determines the cement consumption of the LWC or NWC used by the beam and the floor slab.
  • Span length L: seven different values ranging from 4 m to 7 m, at 0.5 m intervals.
  • Redistribution factor: seven different values ranging from 1 to 0.7, at 0.05 intervals.
The beam-and-block system and its dimensions, as described in the case study, are maintained (i.e., 27 cm thick floor slab). Likewise, yield strength of steel and dead load are also the same. In all cases, the beam is analysed as a continuous two span element.
The number of possible designs is 1,053,696 with flat beam/WSB typology and 2,257,920 with downstand beam typology, making a total of more than 3.25 million models to be studied. This massive parametric analysis has been programmed in MATLAB, applying the design methodology and equations presented in the previous section. The outputs of the analysis are the following:
  • Maximum ULS design load (in kN) transmitted to the three supports of the continuous beam.
  • Cement consumption (in kg) of the cast ‘in situ’ LWC concrete used in both the beam and the tributary floor slab that is supported by it.
  • Mass of steel (in kg) used in the longitudinal reinforcements of the beam.
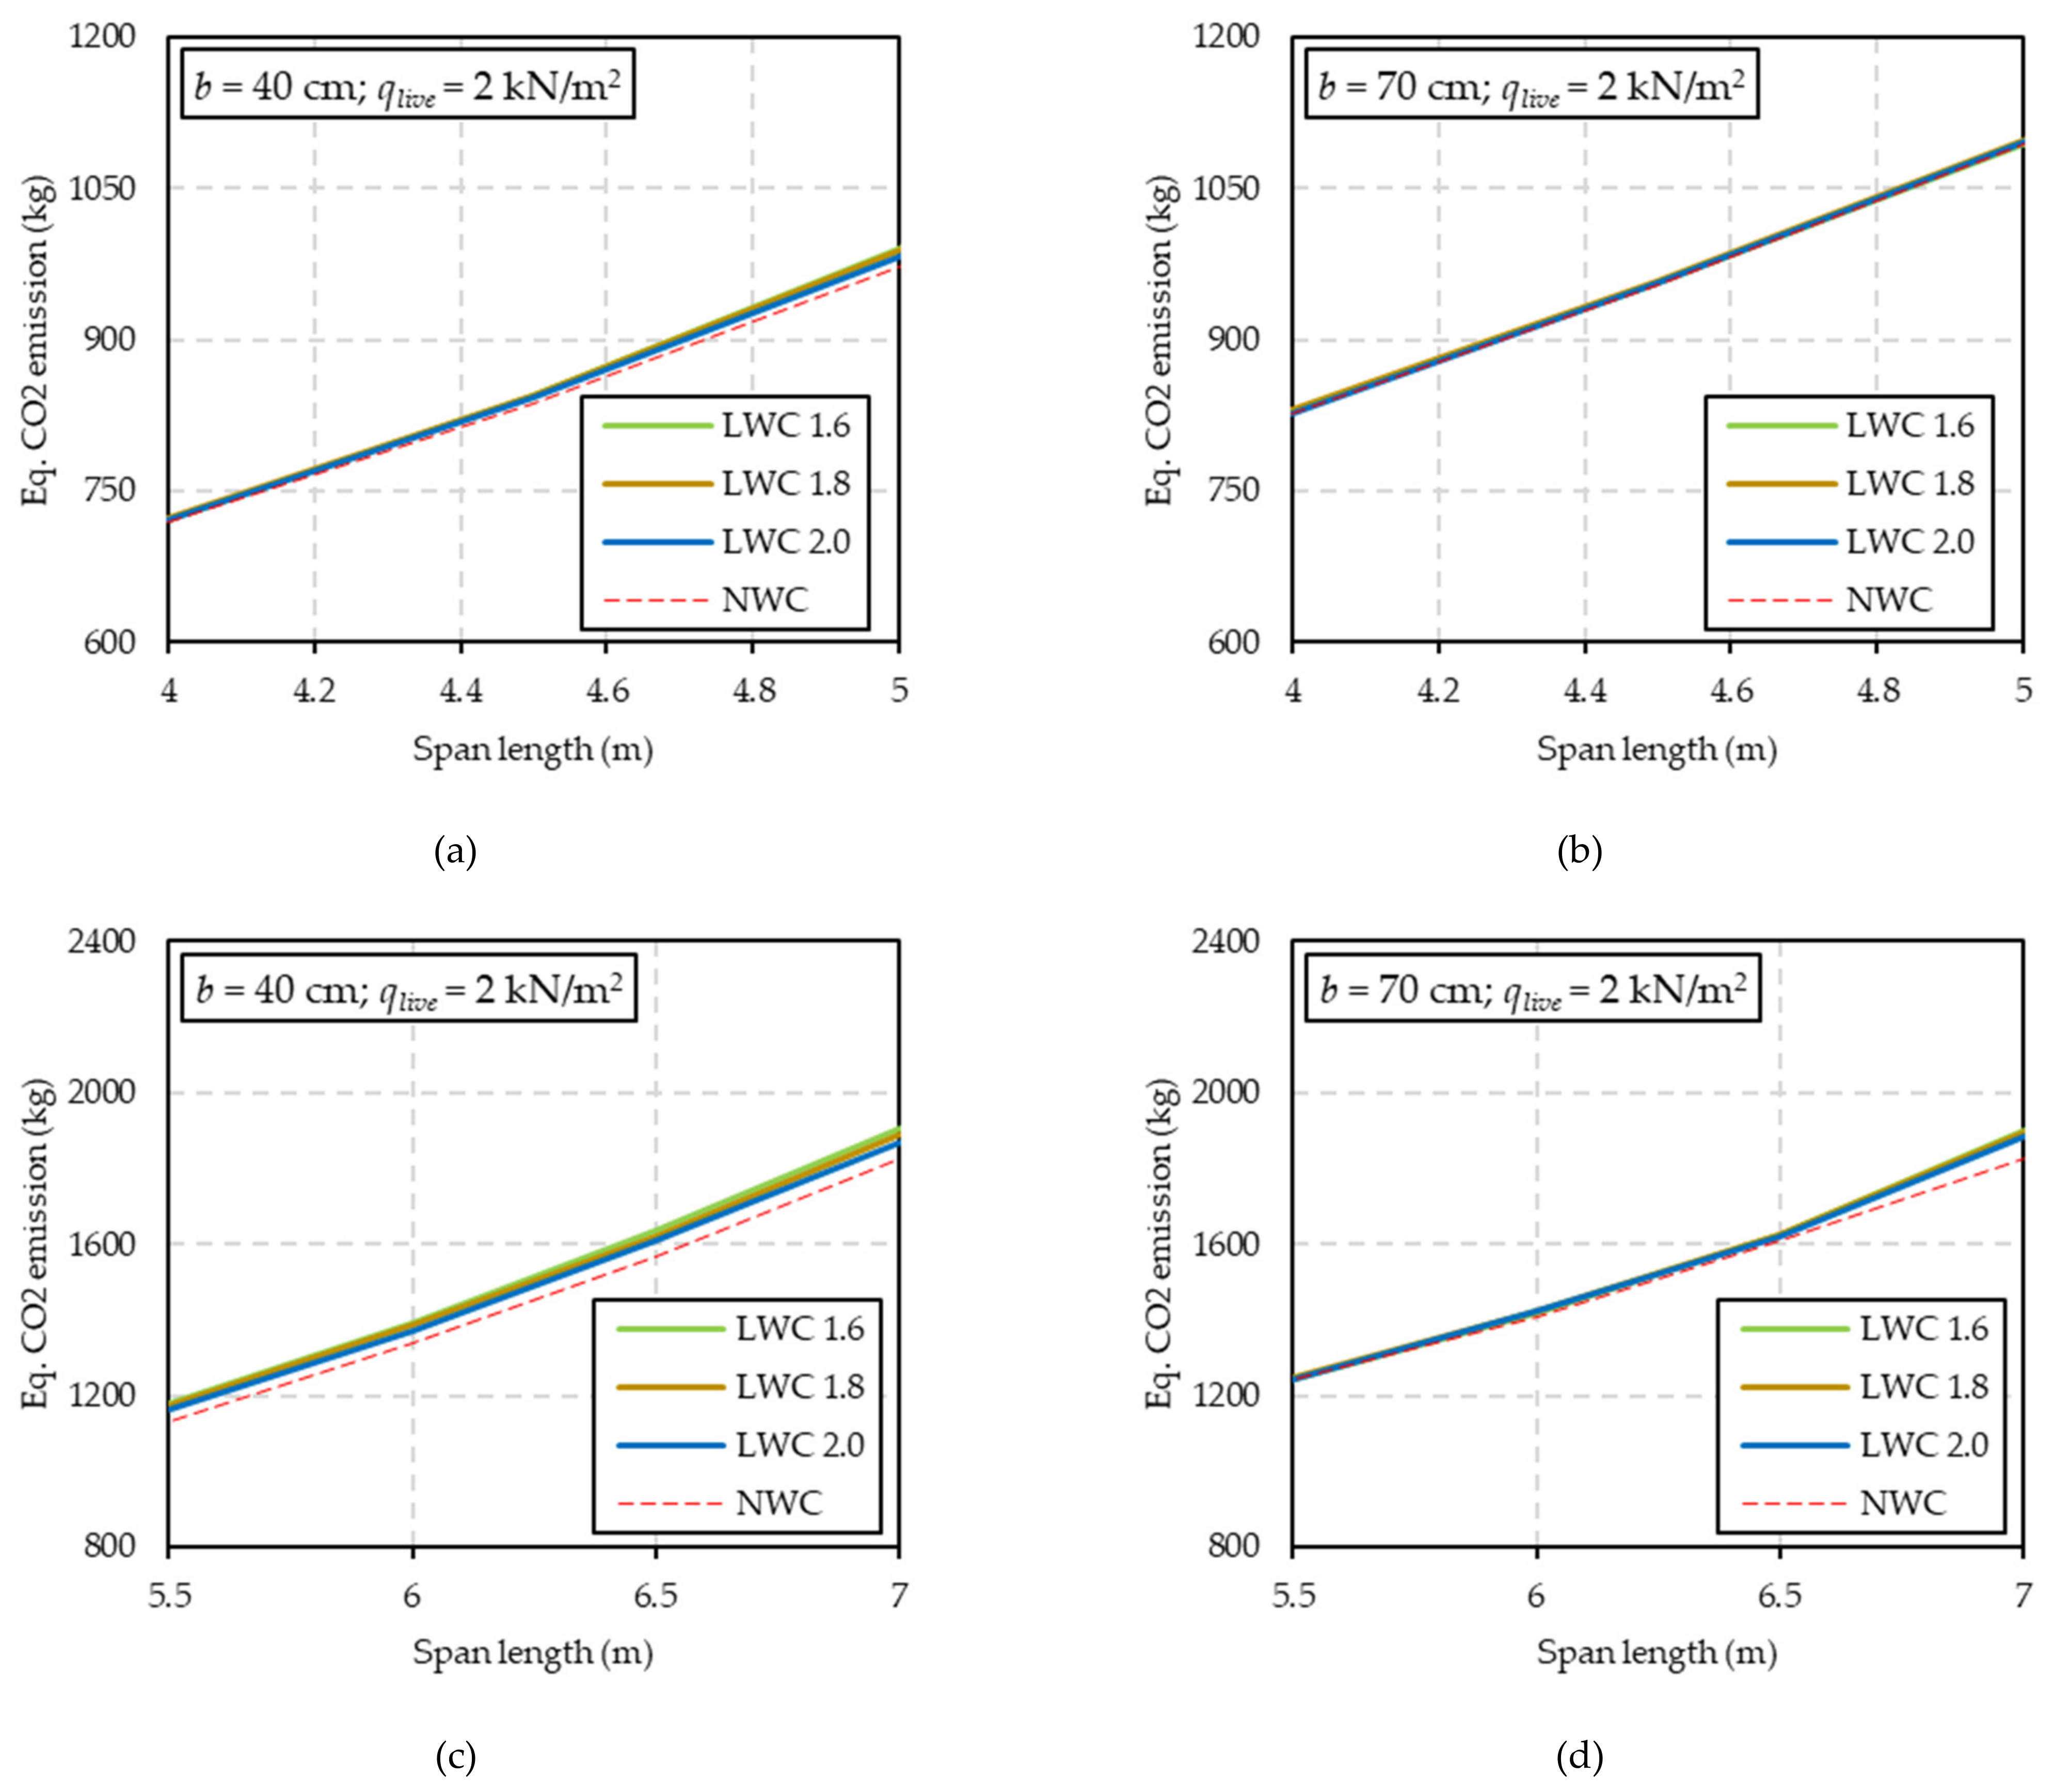
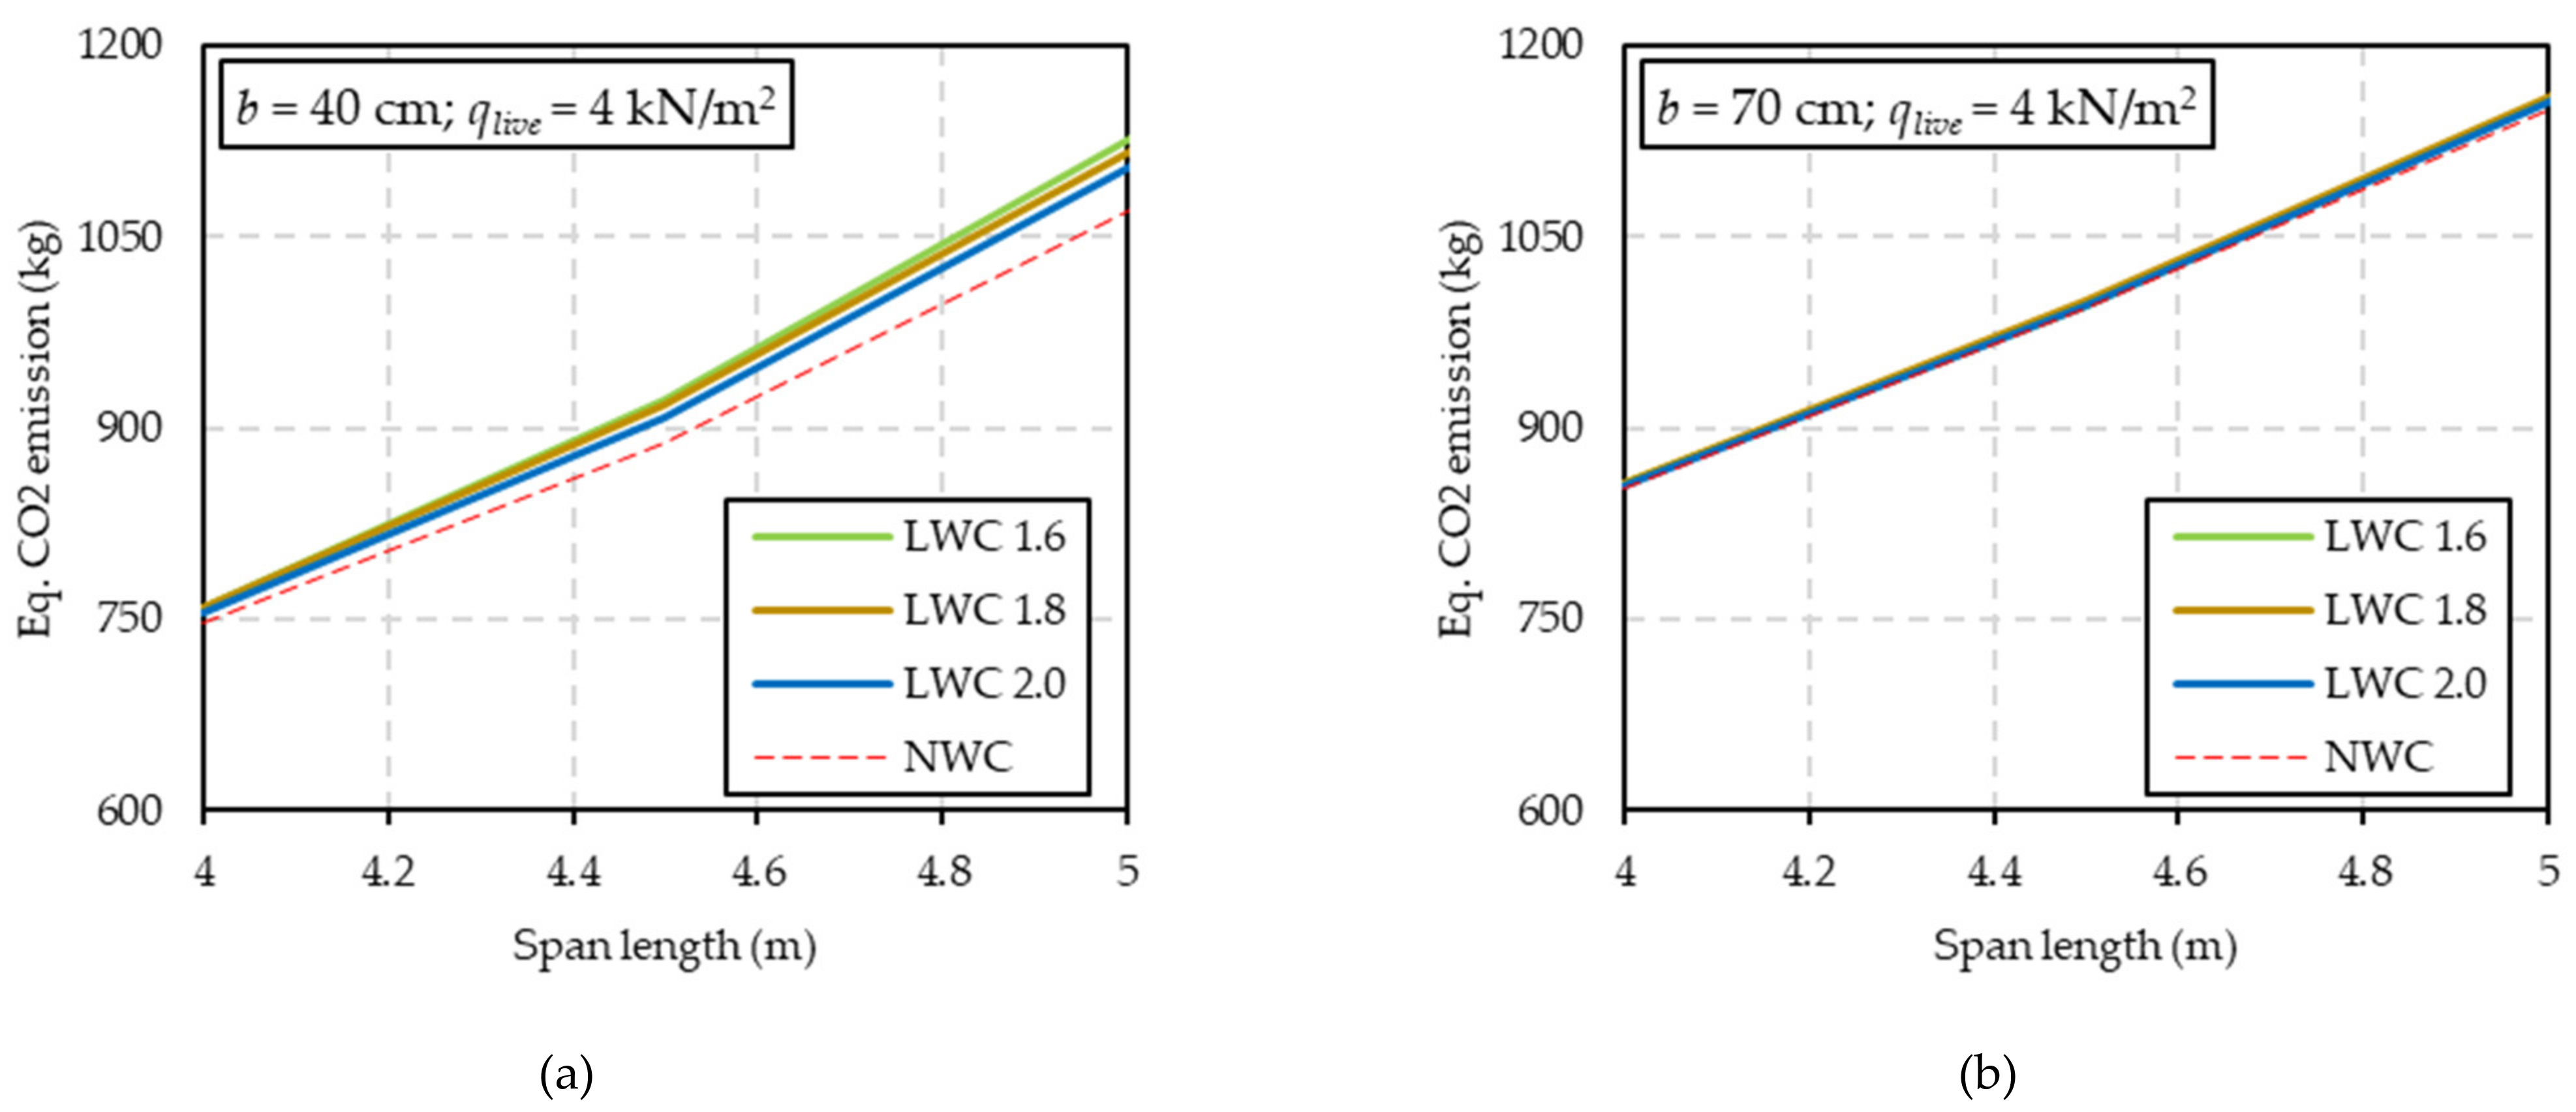
  • Estimation of the equivalent carbon dioxide (CO2) emissions associated with the cement consumption and steel used as longitudinal reinforcements.
  • Compliance of the designs with the Serviceability Limit State (SLS). The cracked cross-sectional inertia of the critical sections is calculated to obtain the tensile stress of the longitudinal reinforcement under the relevant SLS combination of loads. This stress is then used to verify cracking without direct calculation—as described in Eurocode 2 [2]—and the limiting ratio of span length L to effective depth d, to omit an explicit analysis of the vertical deflection—also in compliance with Eurocode 2.
In the calculation of the CO2 emissions, it has been assumed that the manufacturing of one ton of reinforcing steel produces 1.85 tons of CO2 emissions [38]. Regarding cement, one ton (using an average of 76% of clinker in Europe) would approximately require 0.66 tons of CO2 [39].
In the calculation of the modular ratio of steel to concrete that is used in the cracked cross-sectional constants for SLS design, the longitudinal modulus of elasticity Elcm of LWC is penalized according to Equation (19), thus complying with Eurocode 2:
E l c m = E c m   η E             with   η E = ρ 2200 2
where Ecm is the modulus of elasticity of a conventional concrete of the same compressive strength. Furthermore, the limiting L/d ratio in LWC beams is reduced by η E 0.15 with respect to that of the equivalent NWC due to the greater long term creep behaviour, which would then lead to slightly deeper cross-sections (d increased by η E 0.15 ). Finally, it should be noted that the global analysis for SLS verifications is linear elastic without moment redistribution, as required by both Eurocode 2 [2] and Model Code 2010 [3].

3.3. Cement Consumption in Lightweight Concrete

Lightweight structural concrete introduces an additional dimension in concrete mix design. As previously mentioned, the reduction in concrete density can have a considerable impact on the concrete compressive strength. Therefore, it may be necessary to increase the cement content to reach the desired strength grade and maintain a specific fck (flck in the case of LWC).
Regarding LWC dosages, the method developed by Bogas and Gomes [40] has been used to determine the cement content required by the three types of LWC class densities included in the parametric analysis. Furthermore, two cement strength grades have been contemplated, 42.5 and 52.5 MPa. The calculated cement content is given in Table 8. The lightweight aggregates considered are expanded clay manufactured by Arlita in Spain, with a particle density of 1290 kg/m3, total porosity of 52%, a 24 h water absorption of 12.1% and a granulometric fraction of 3/10. The expected lightweight aggregate strength in concrete is assumed to be 59.2 MPa, based on the data reported in [40].
Pertaining to the conventional concretes’ mix design, a classic method by Fernández-Canovas [41] has been used. The cement contents given in Table 8 would correspond to a low-slump concrete made with natural crushed coarse aggregates with a maximum particle size of 20 mm. These conditions of consistency and aggregate size would usually yield a lower amount of required cement, which would make the subsequent comparisons with LWC less favourable for the latter.
In accordance with the methodology presented in [40], it was not possible to design LWC with density classes equal or below 1.4. Other types of artificial lightweight aggregates were considered, but it was not possible to match concrete strengths greater than 20 MPa and that was only at the cost of excessive cement and water consumption.

4. Results and Discussion

This section provides the parametric analysis results and their interpretation. It has been divided into three main sections that cover, respectively, the Ultimate Limit State (ULS) of downstand beams, the ULS of flat beams or wide-shallow beams and, finally, the Serviceability Limit State (SLS) compliance of both typologies. Design parameters are discussed within each part.

4.1. Downstand Beams

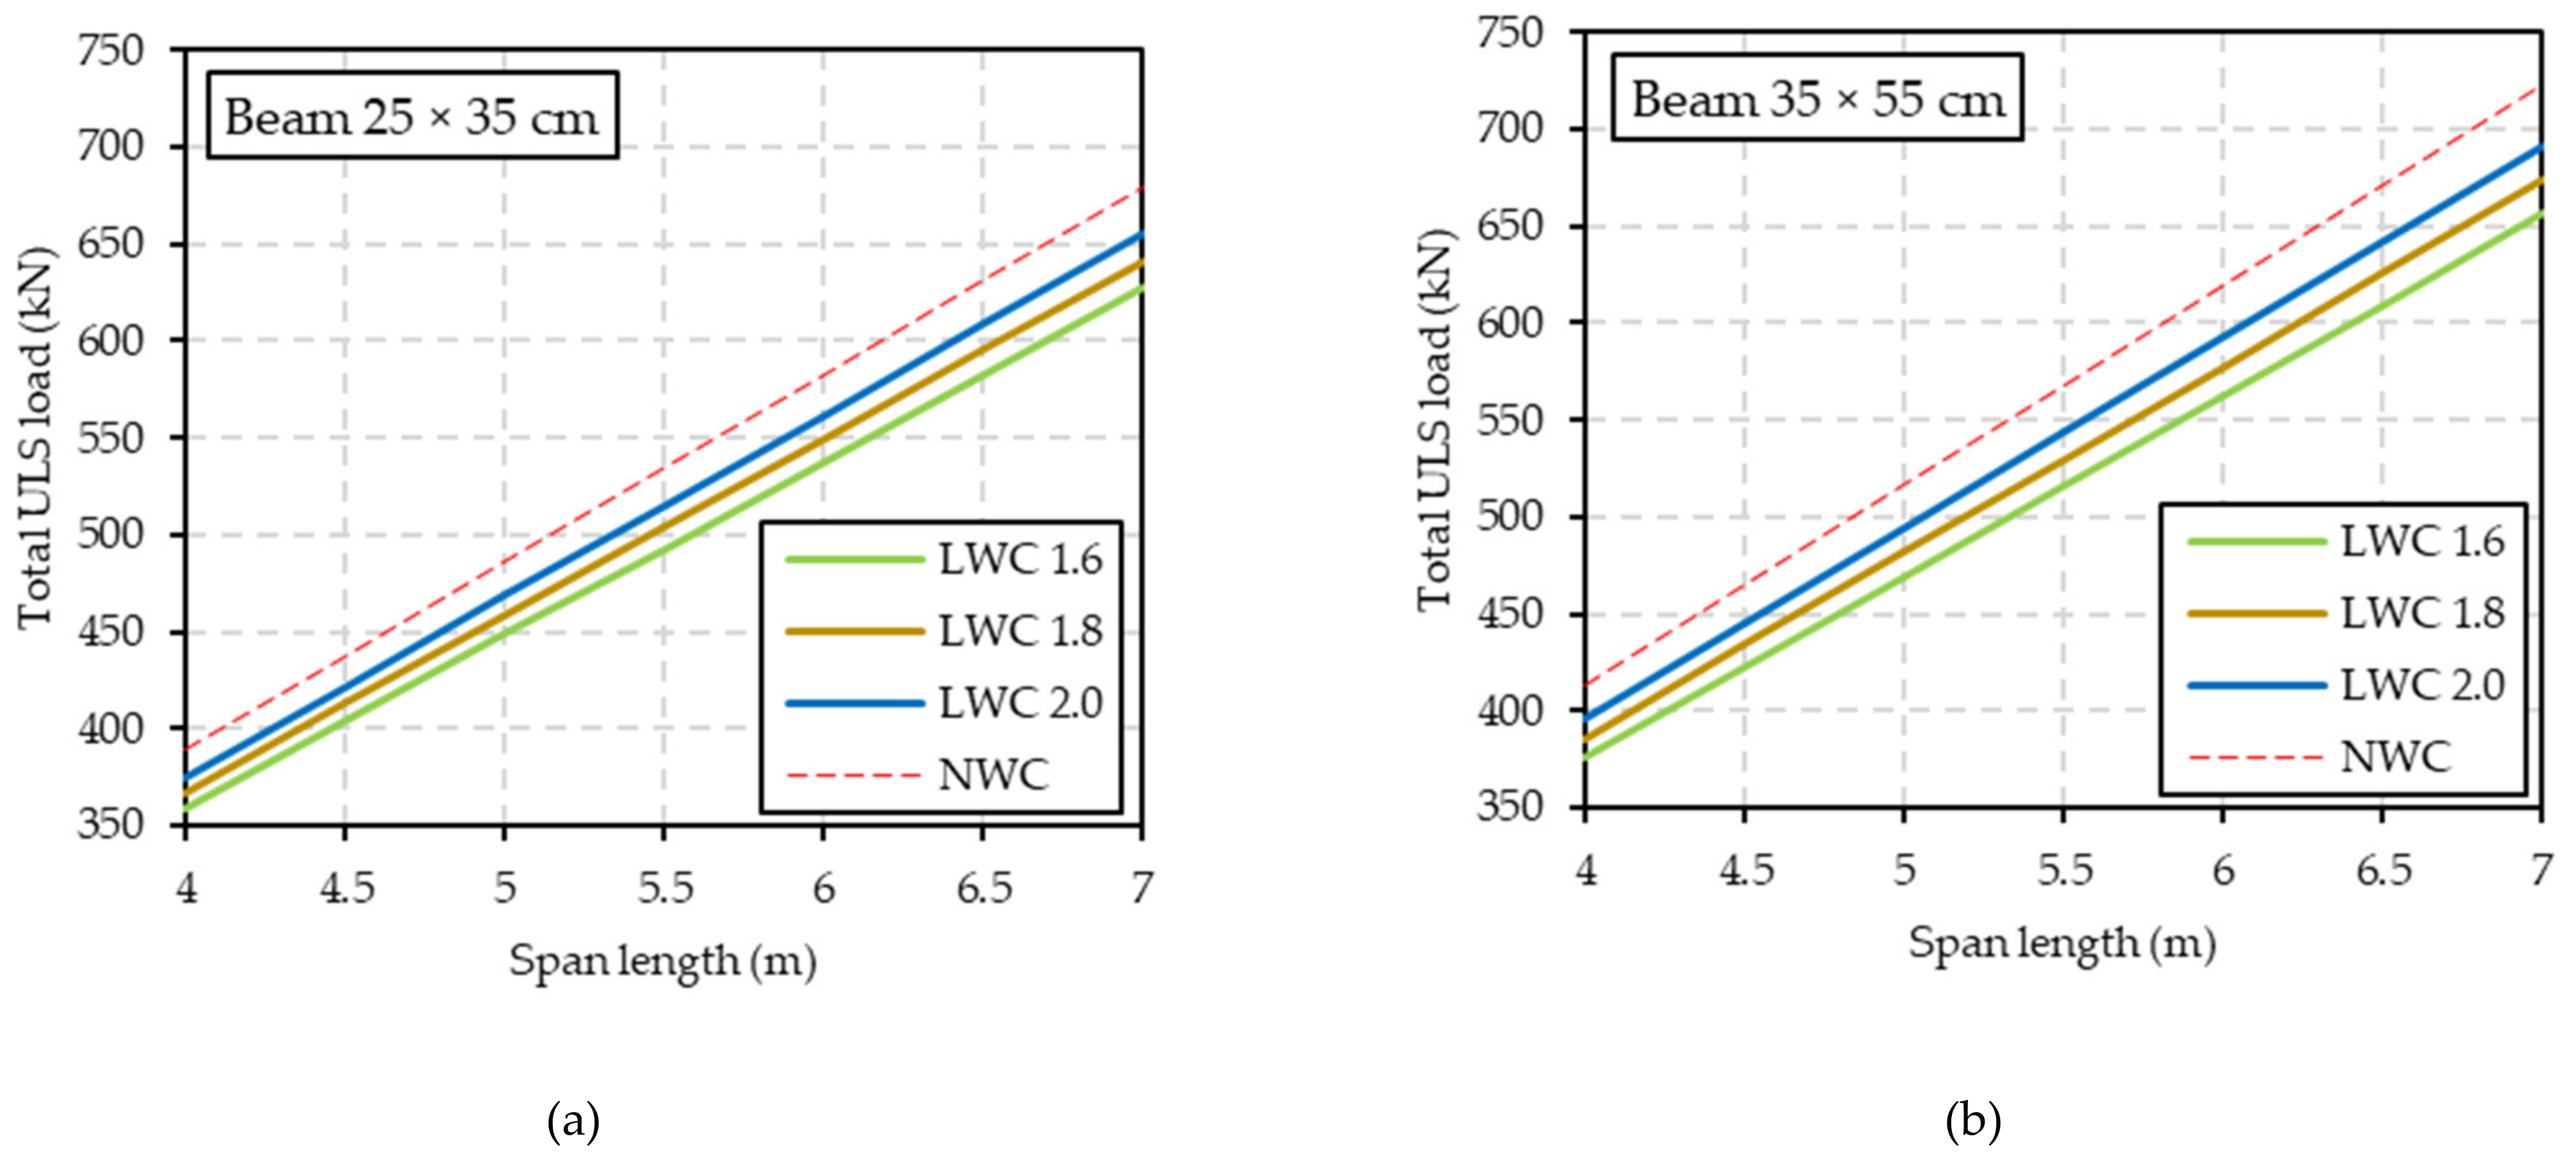
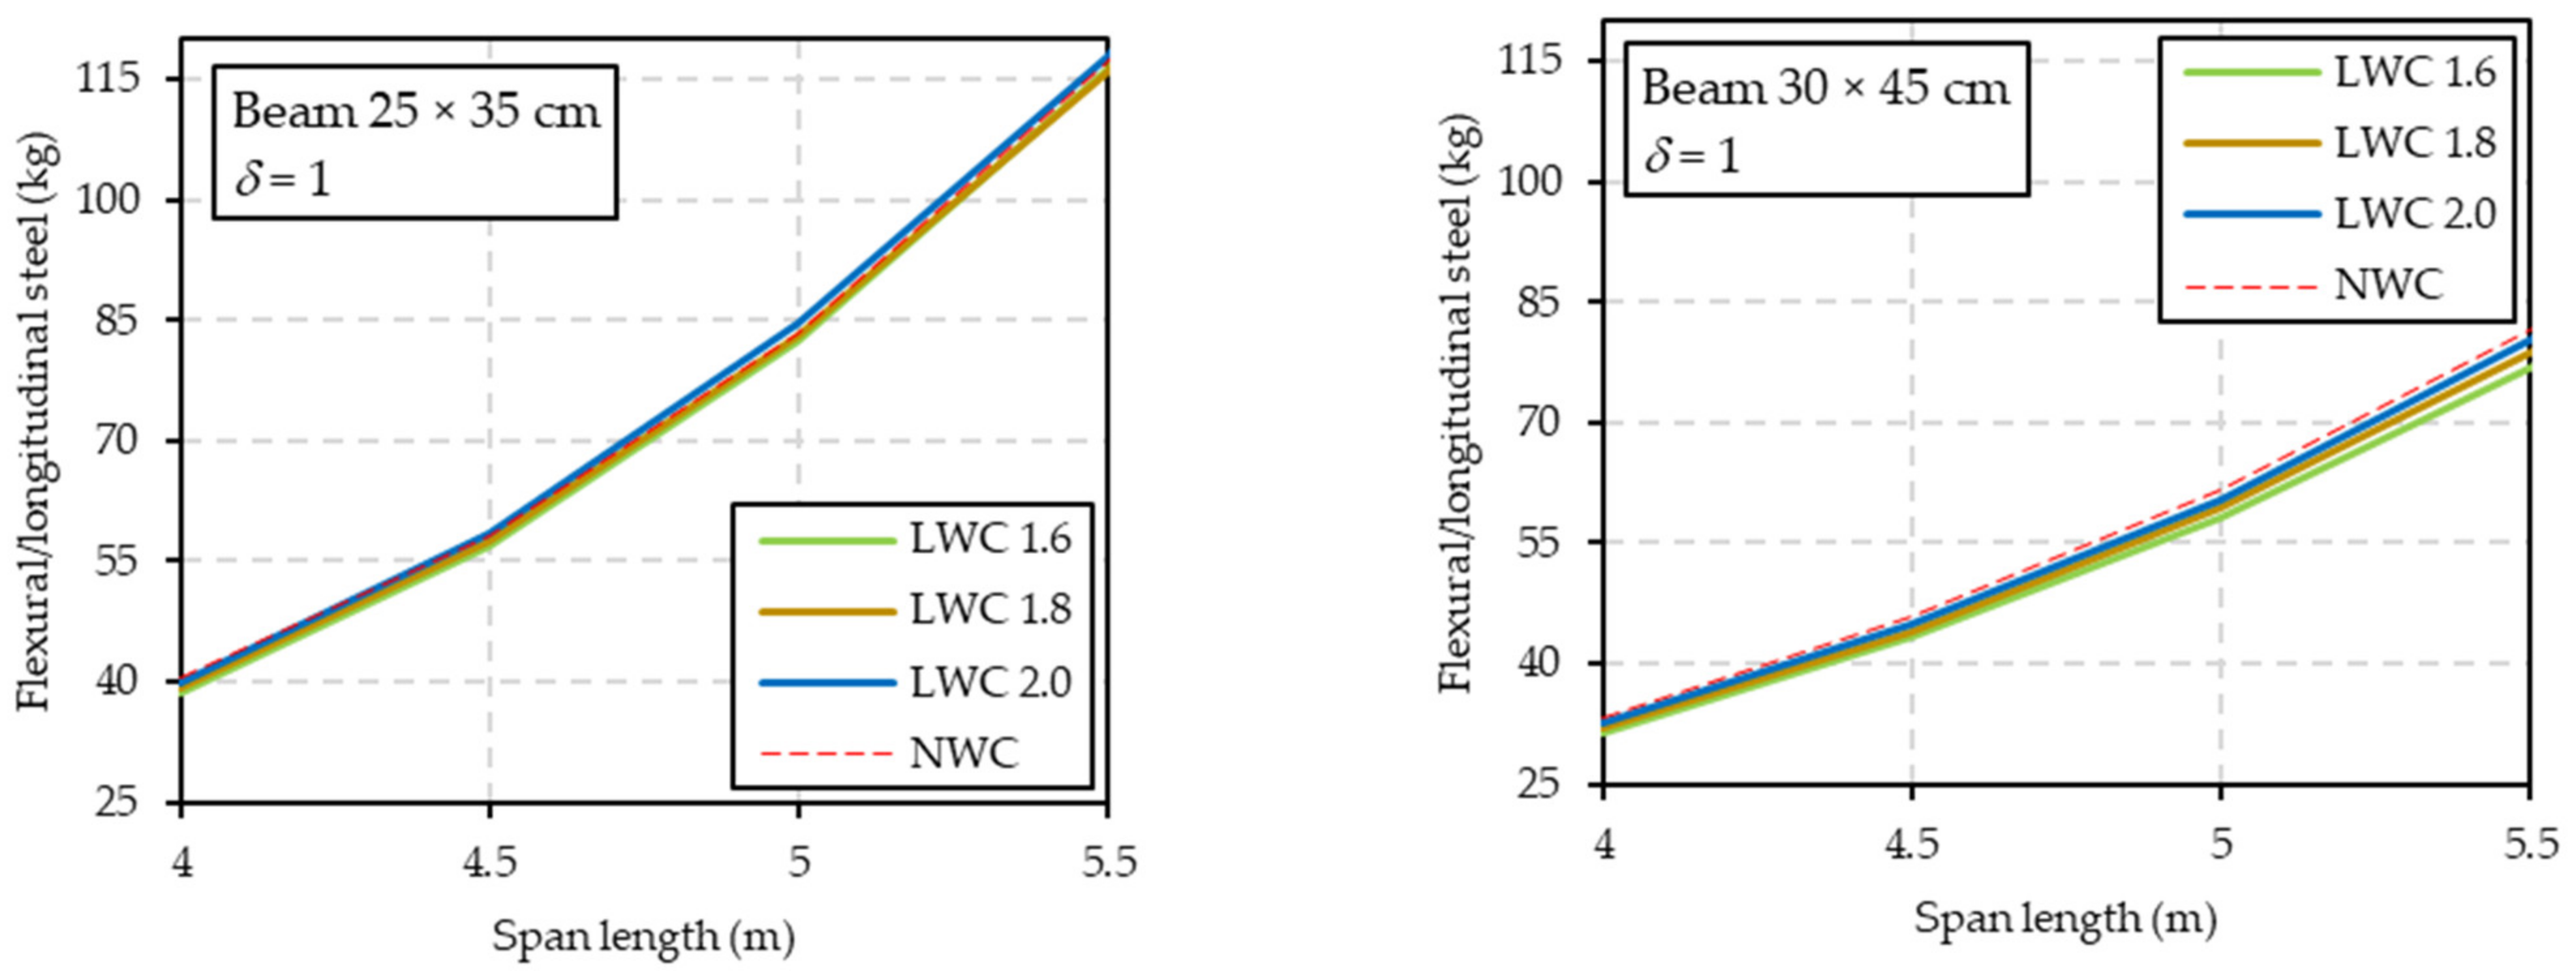
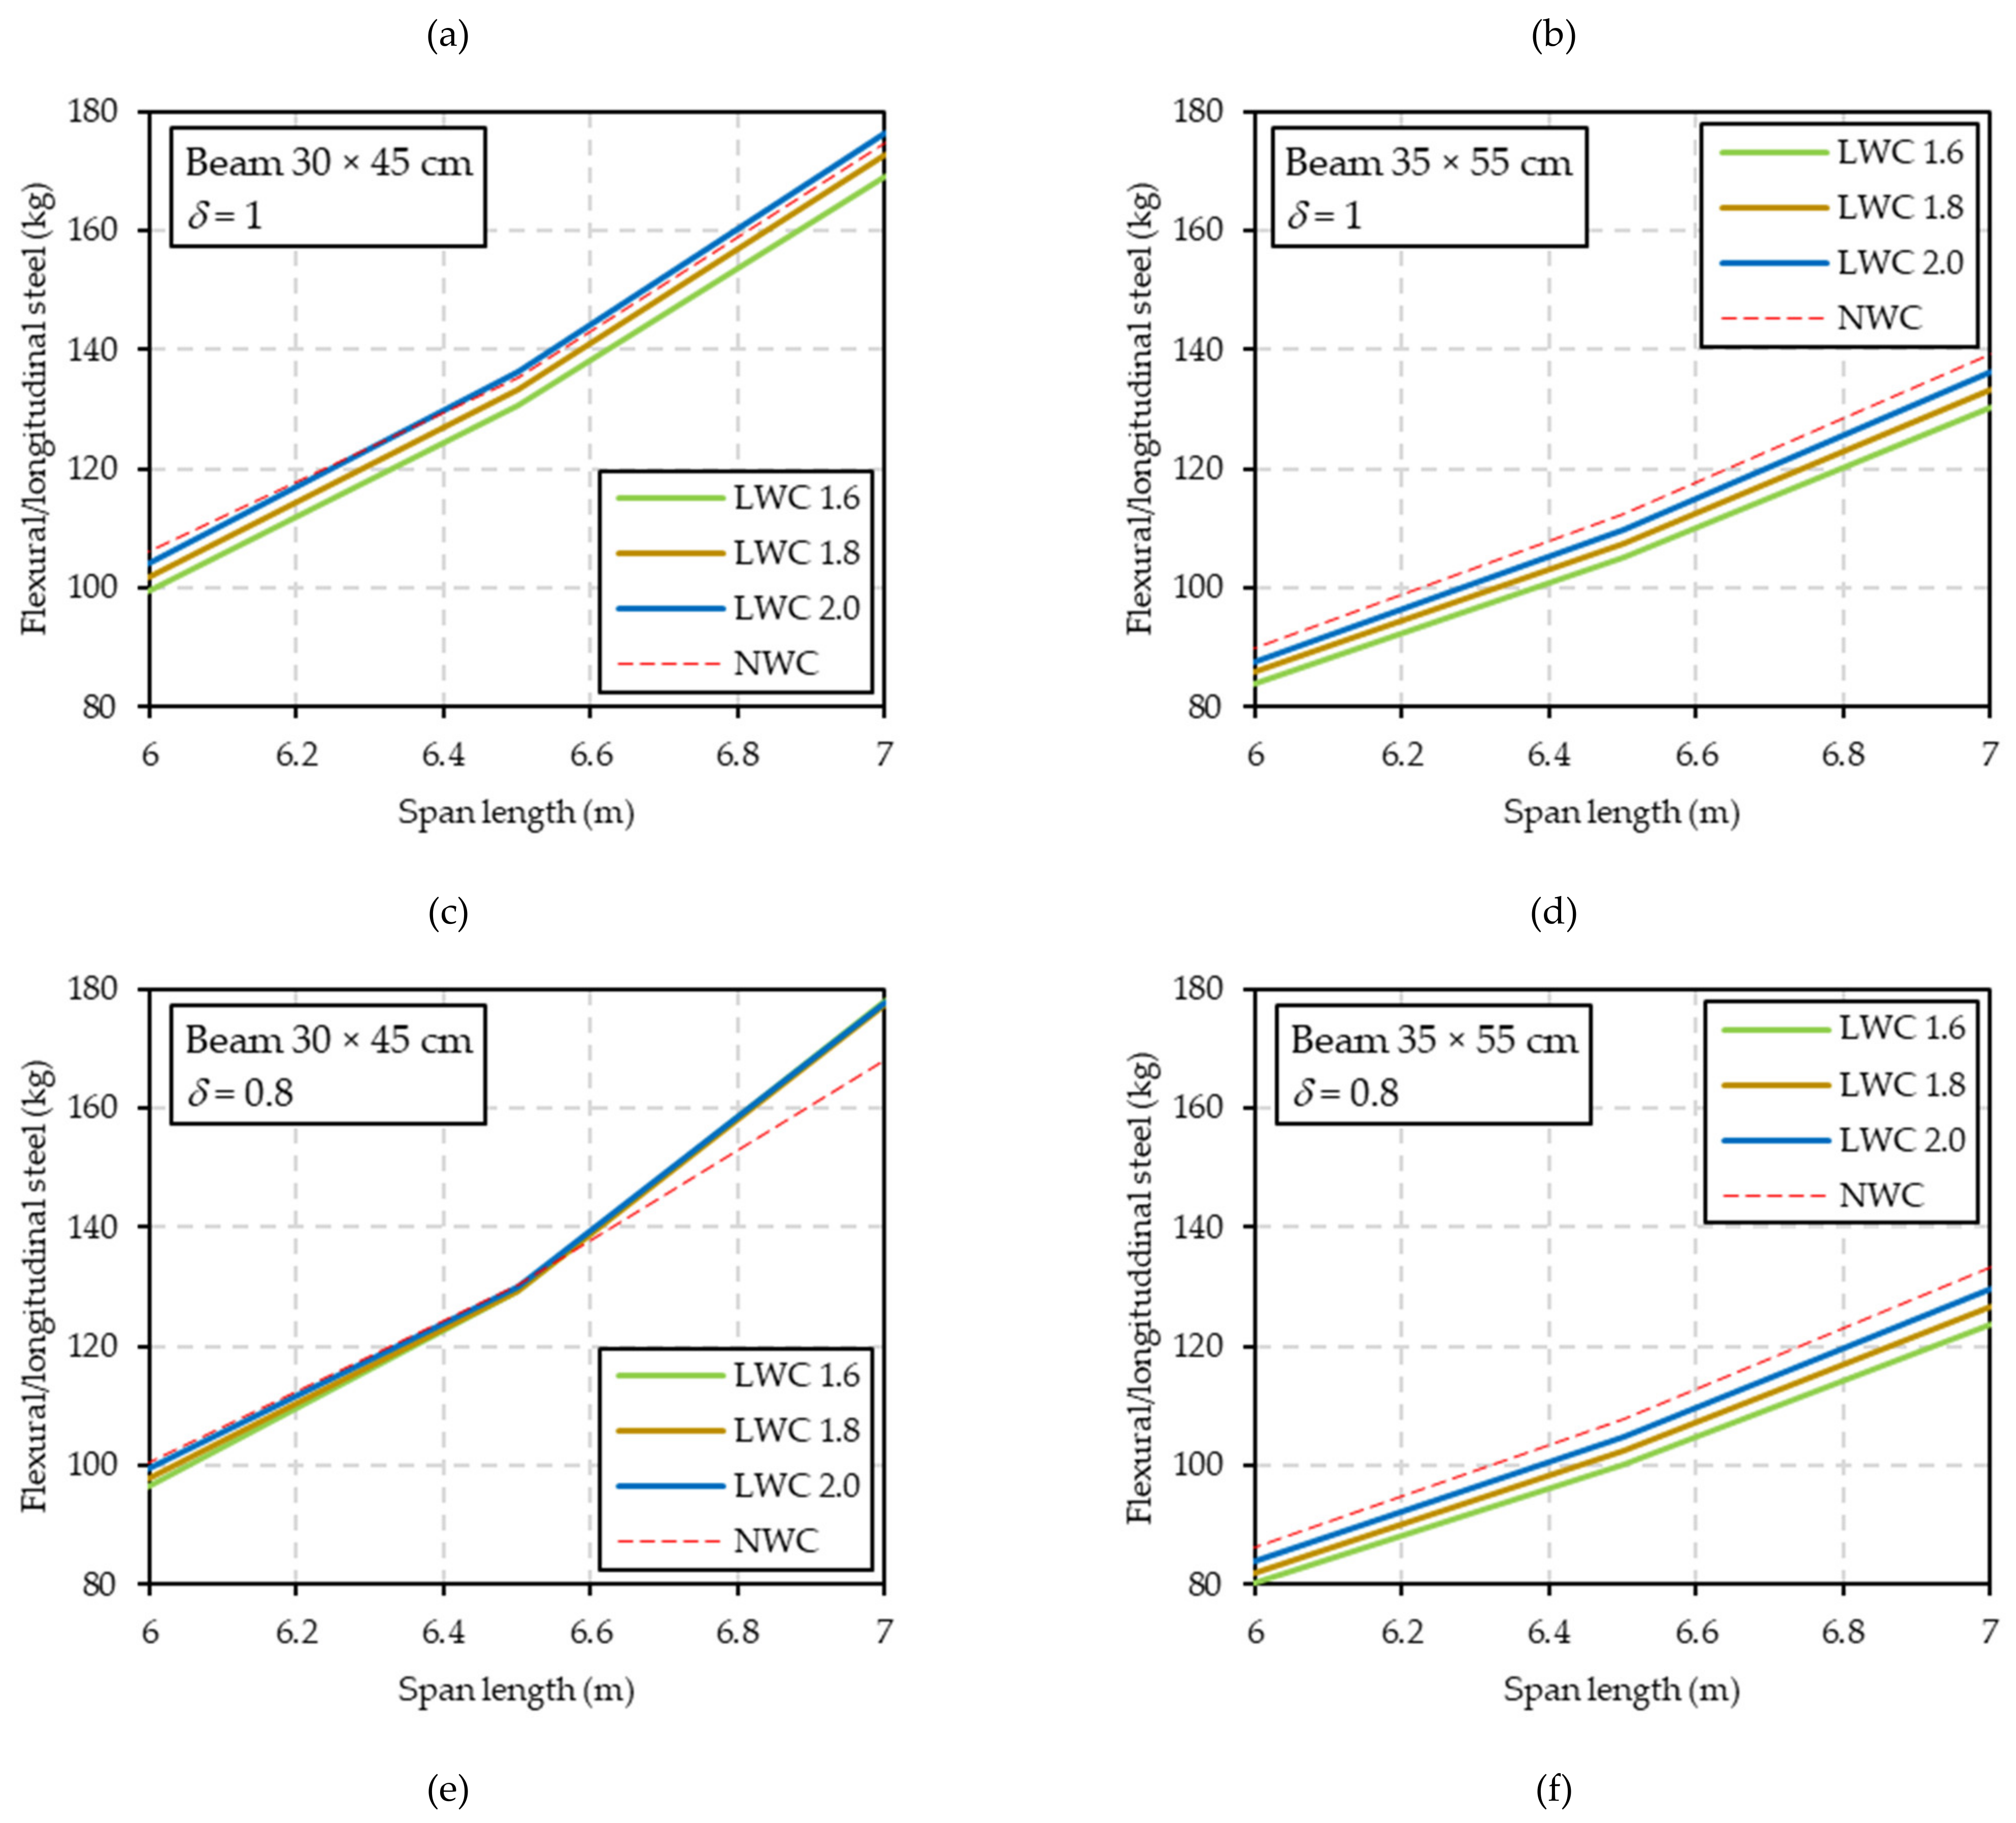
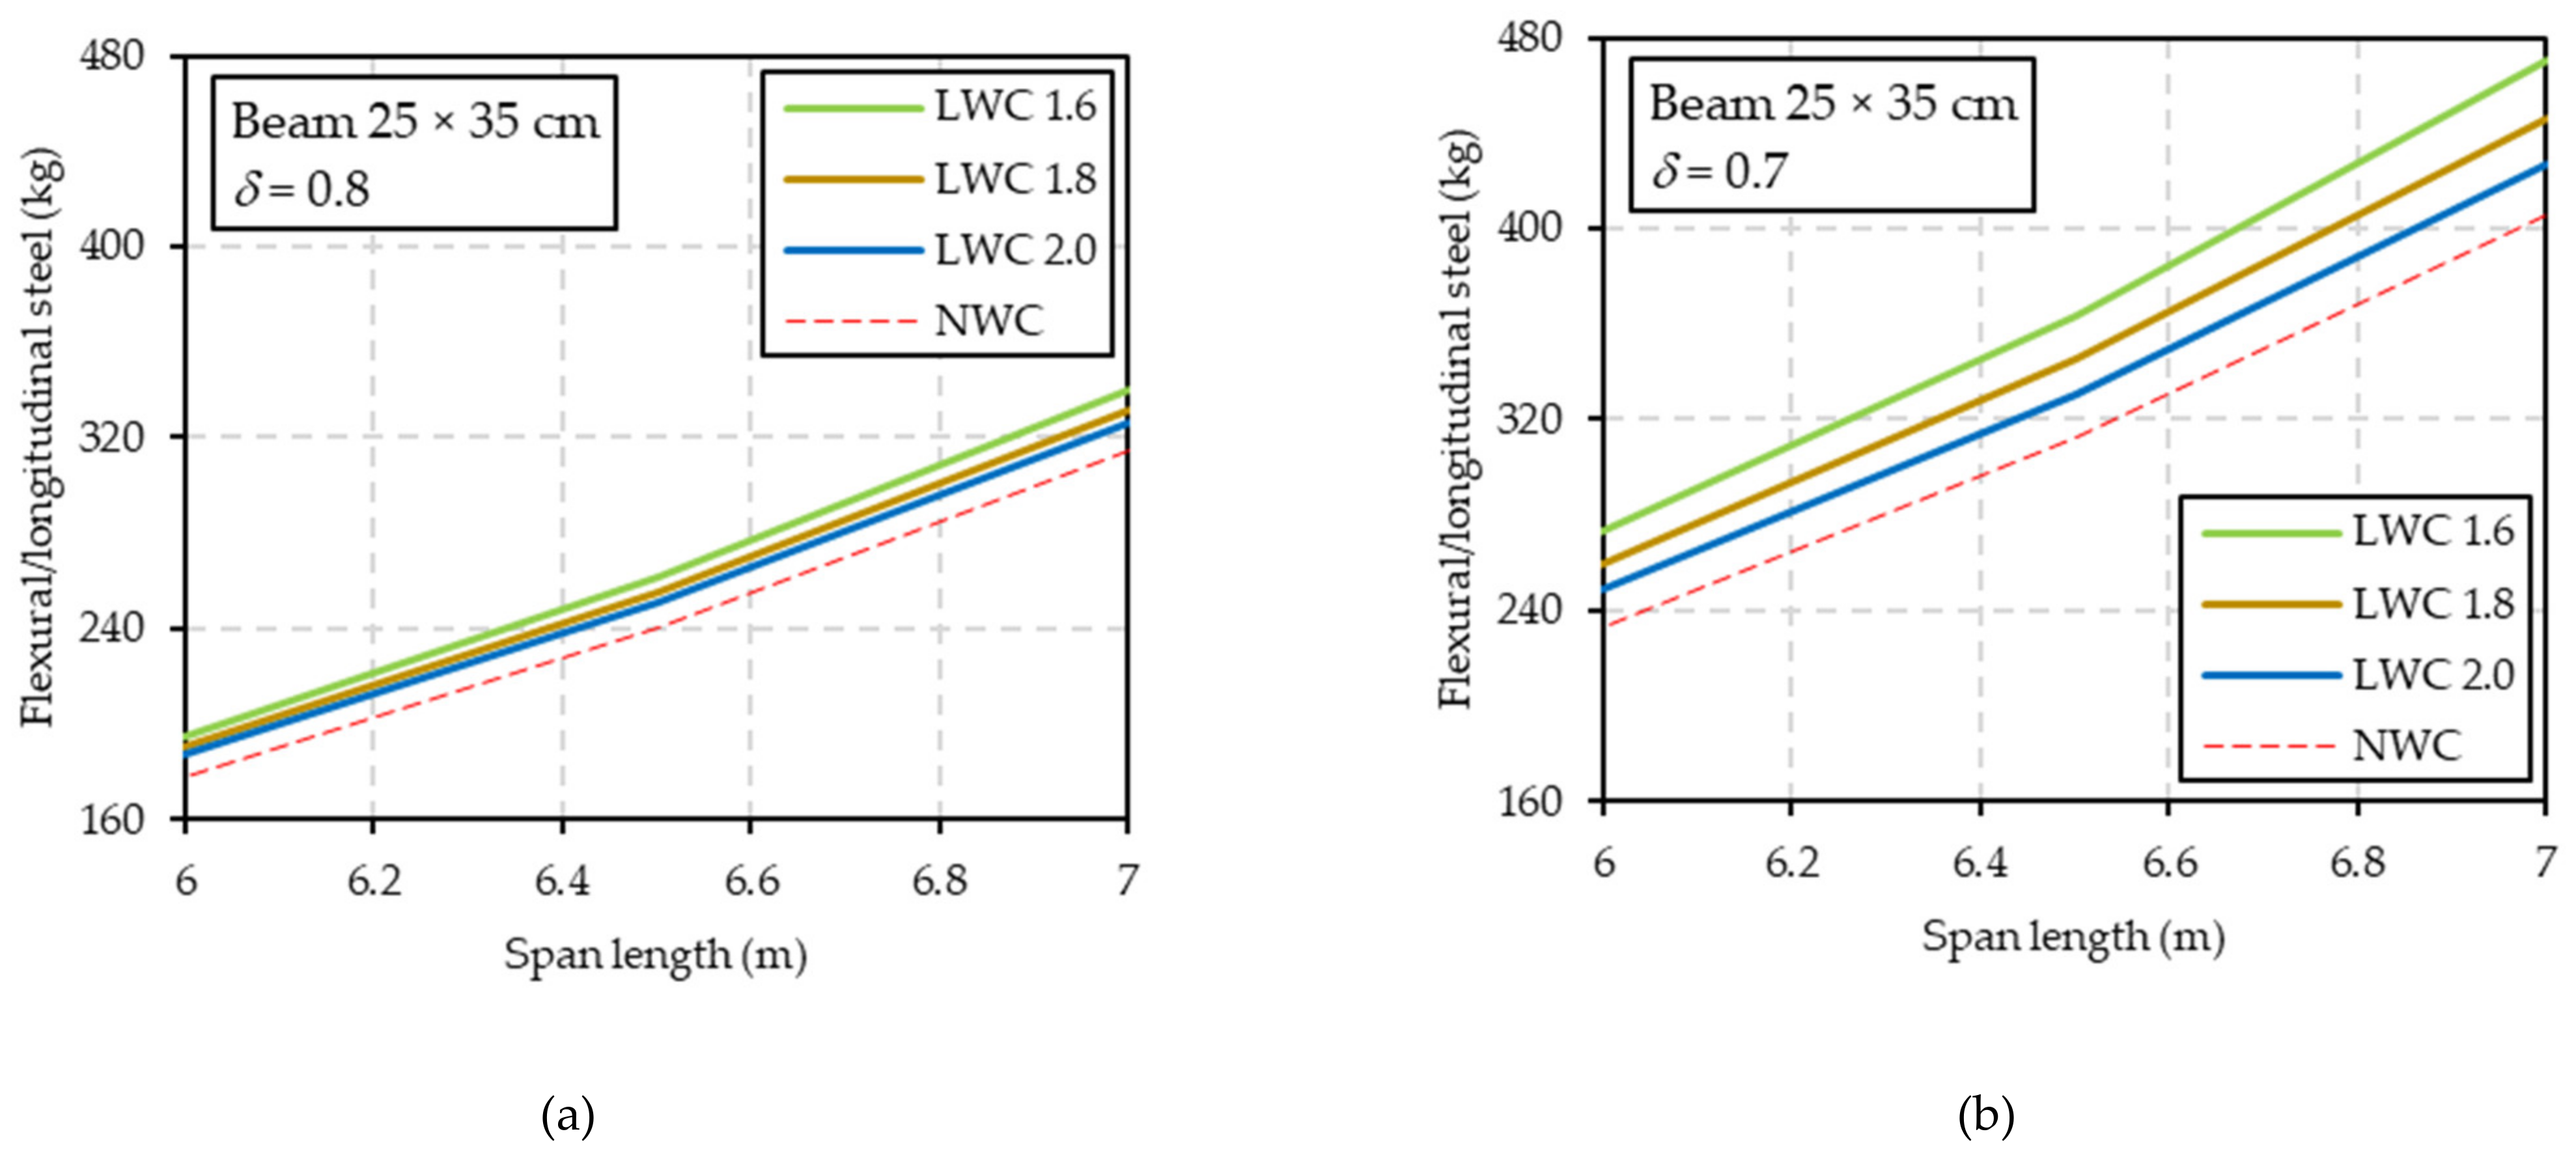
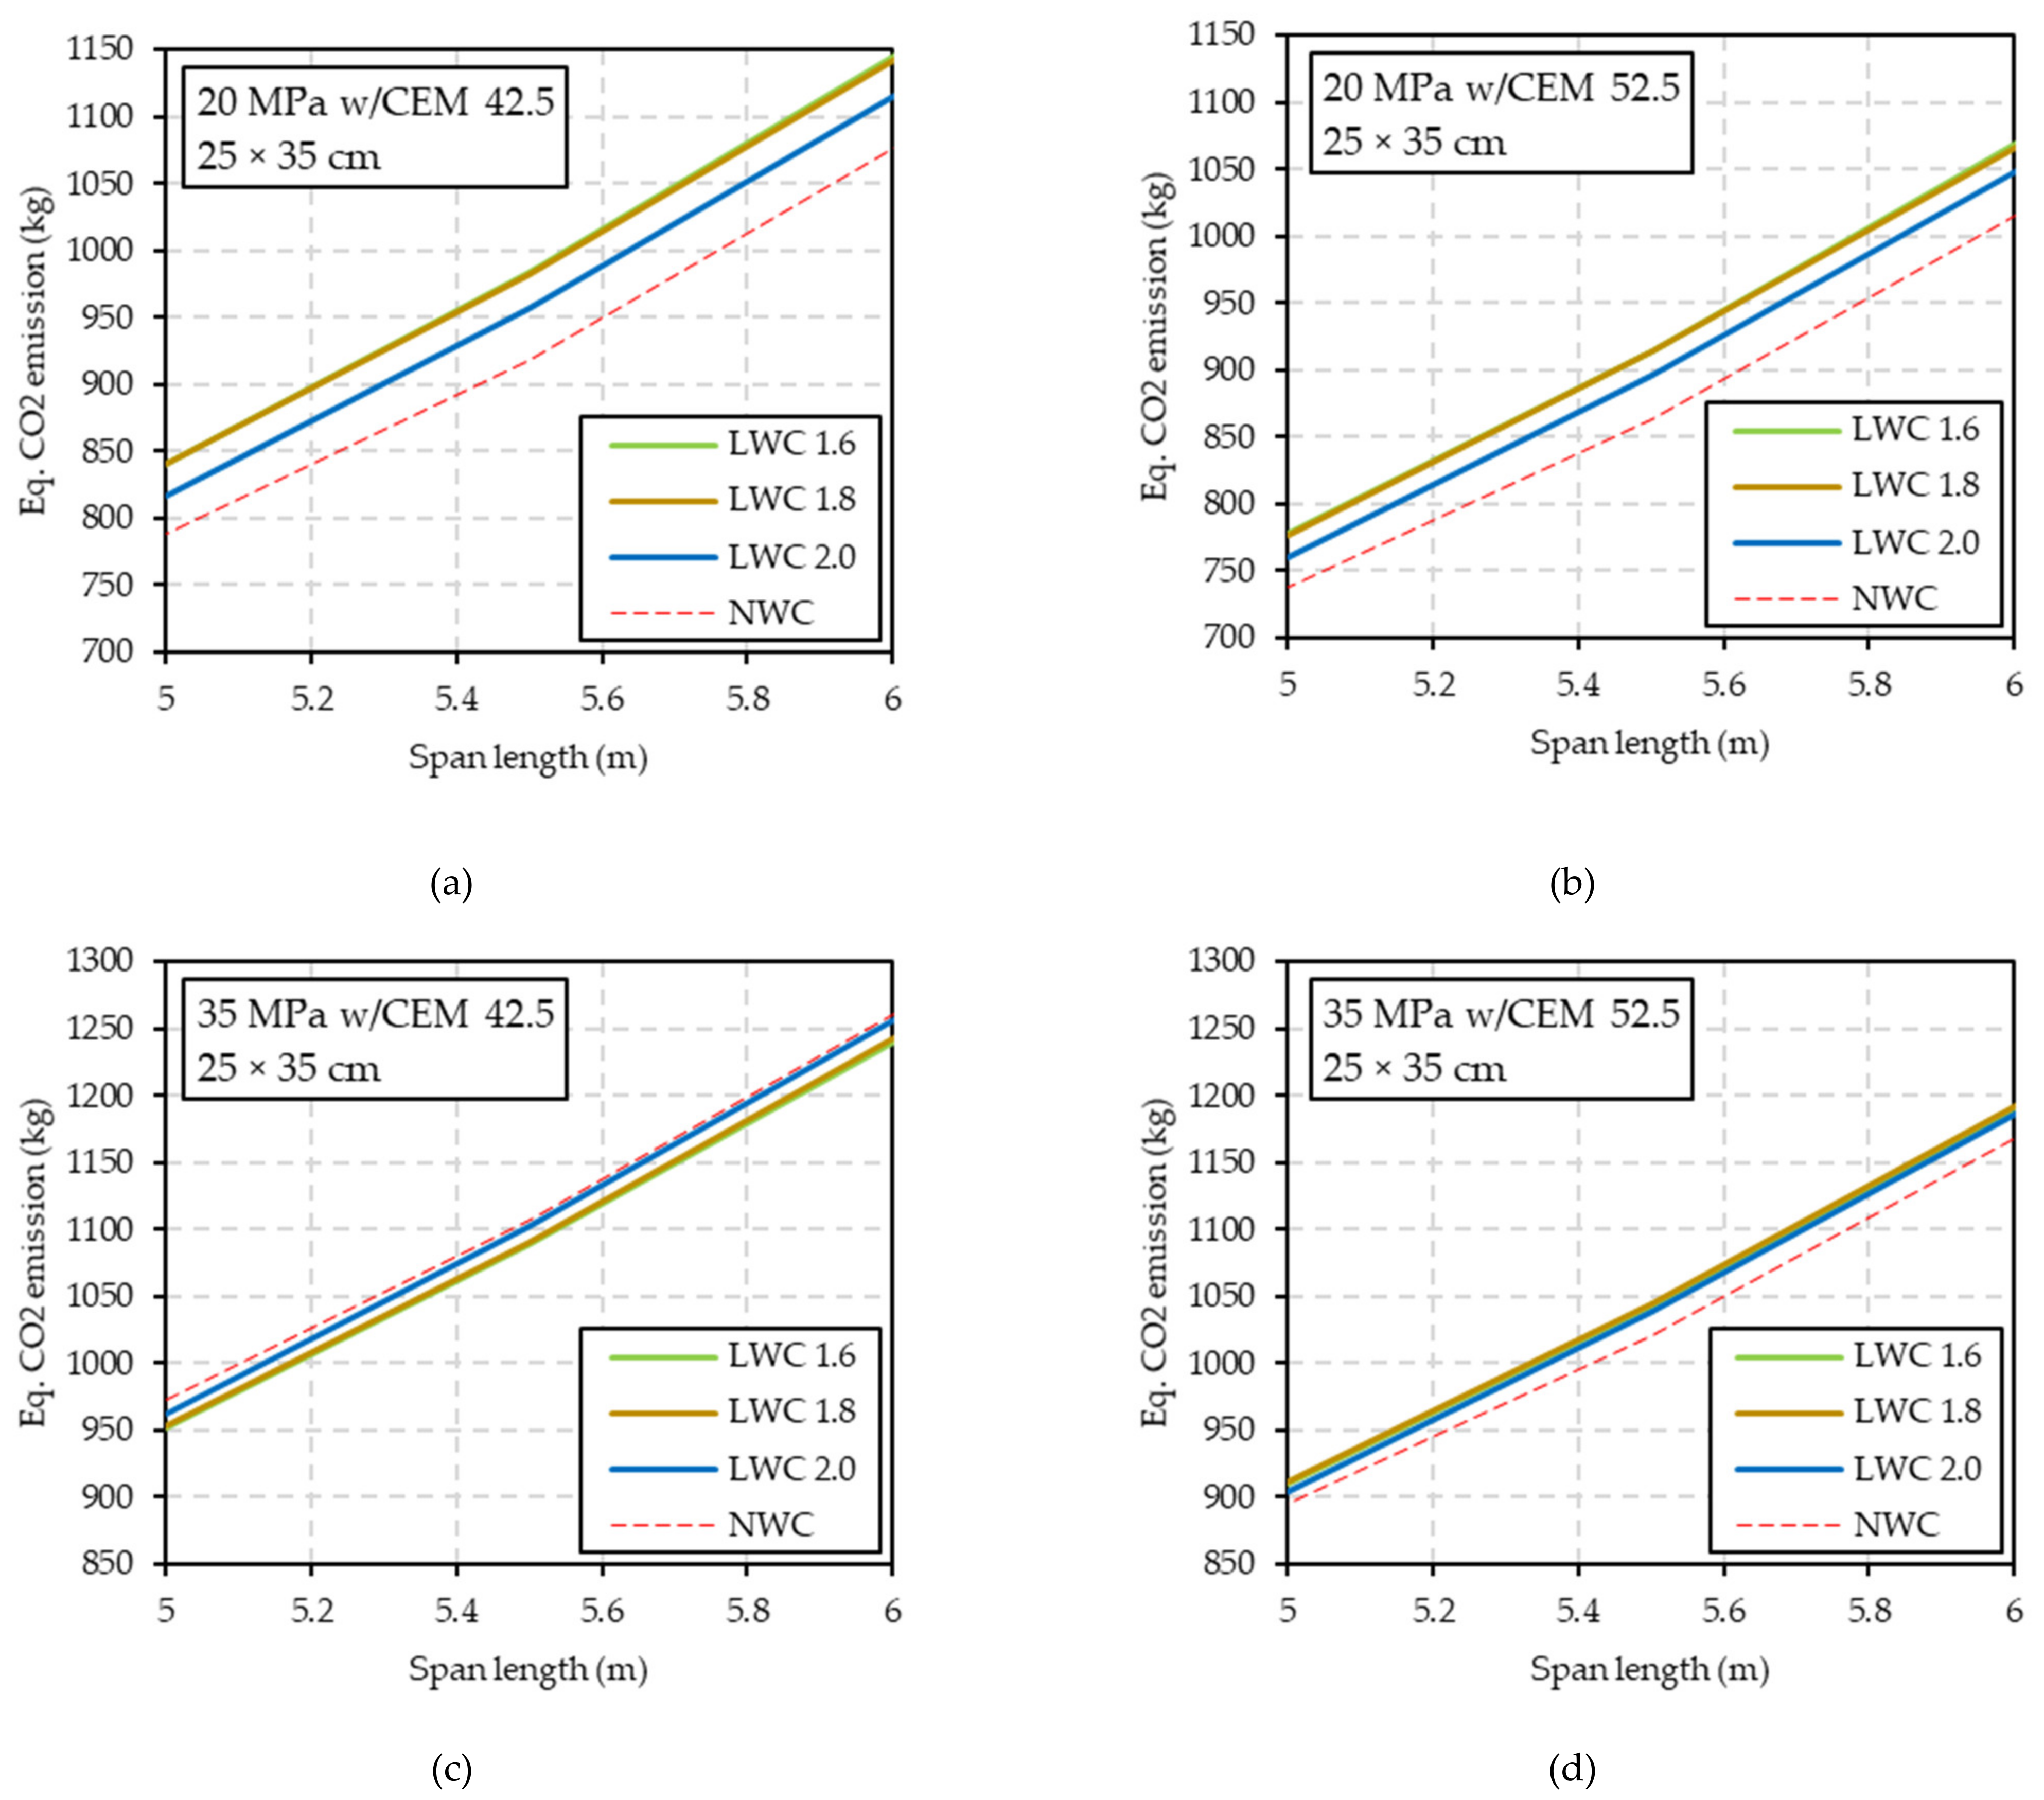
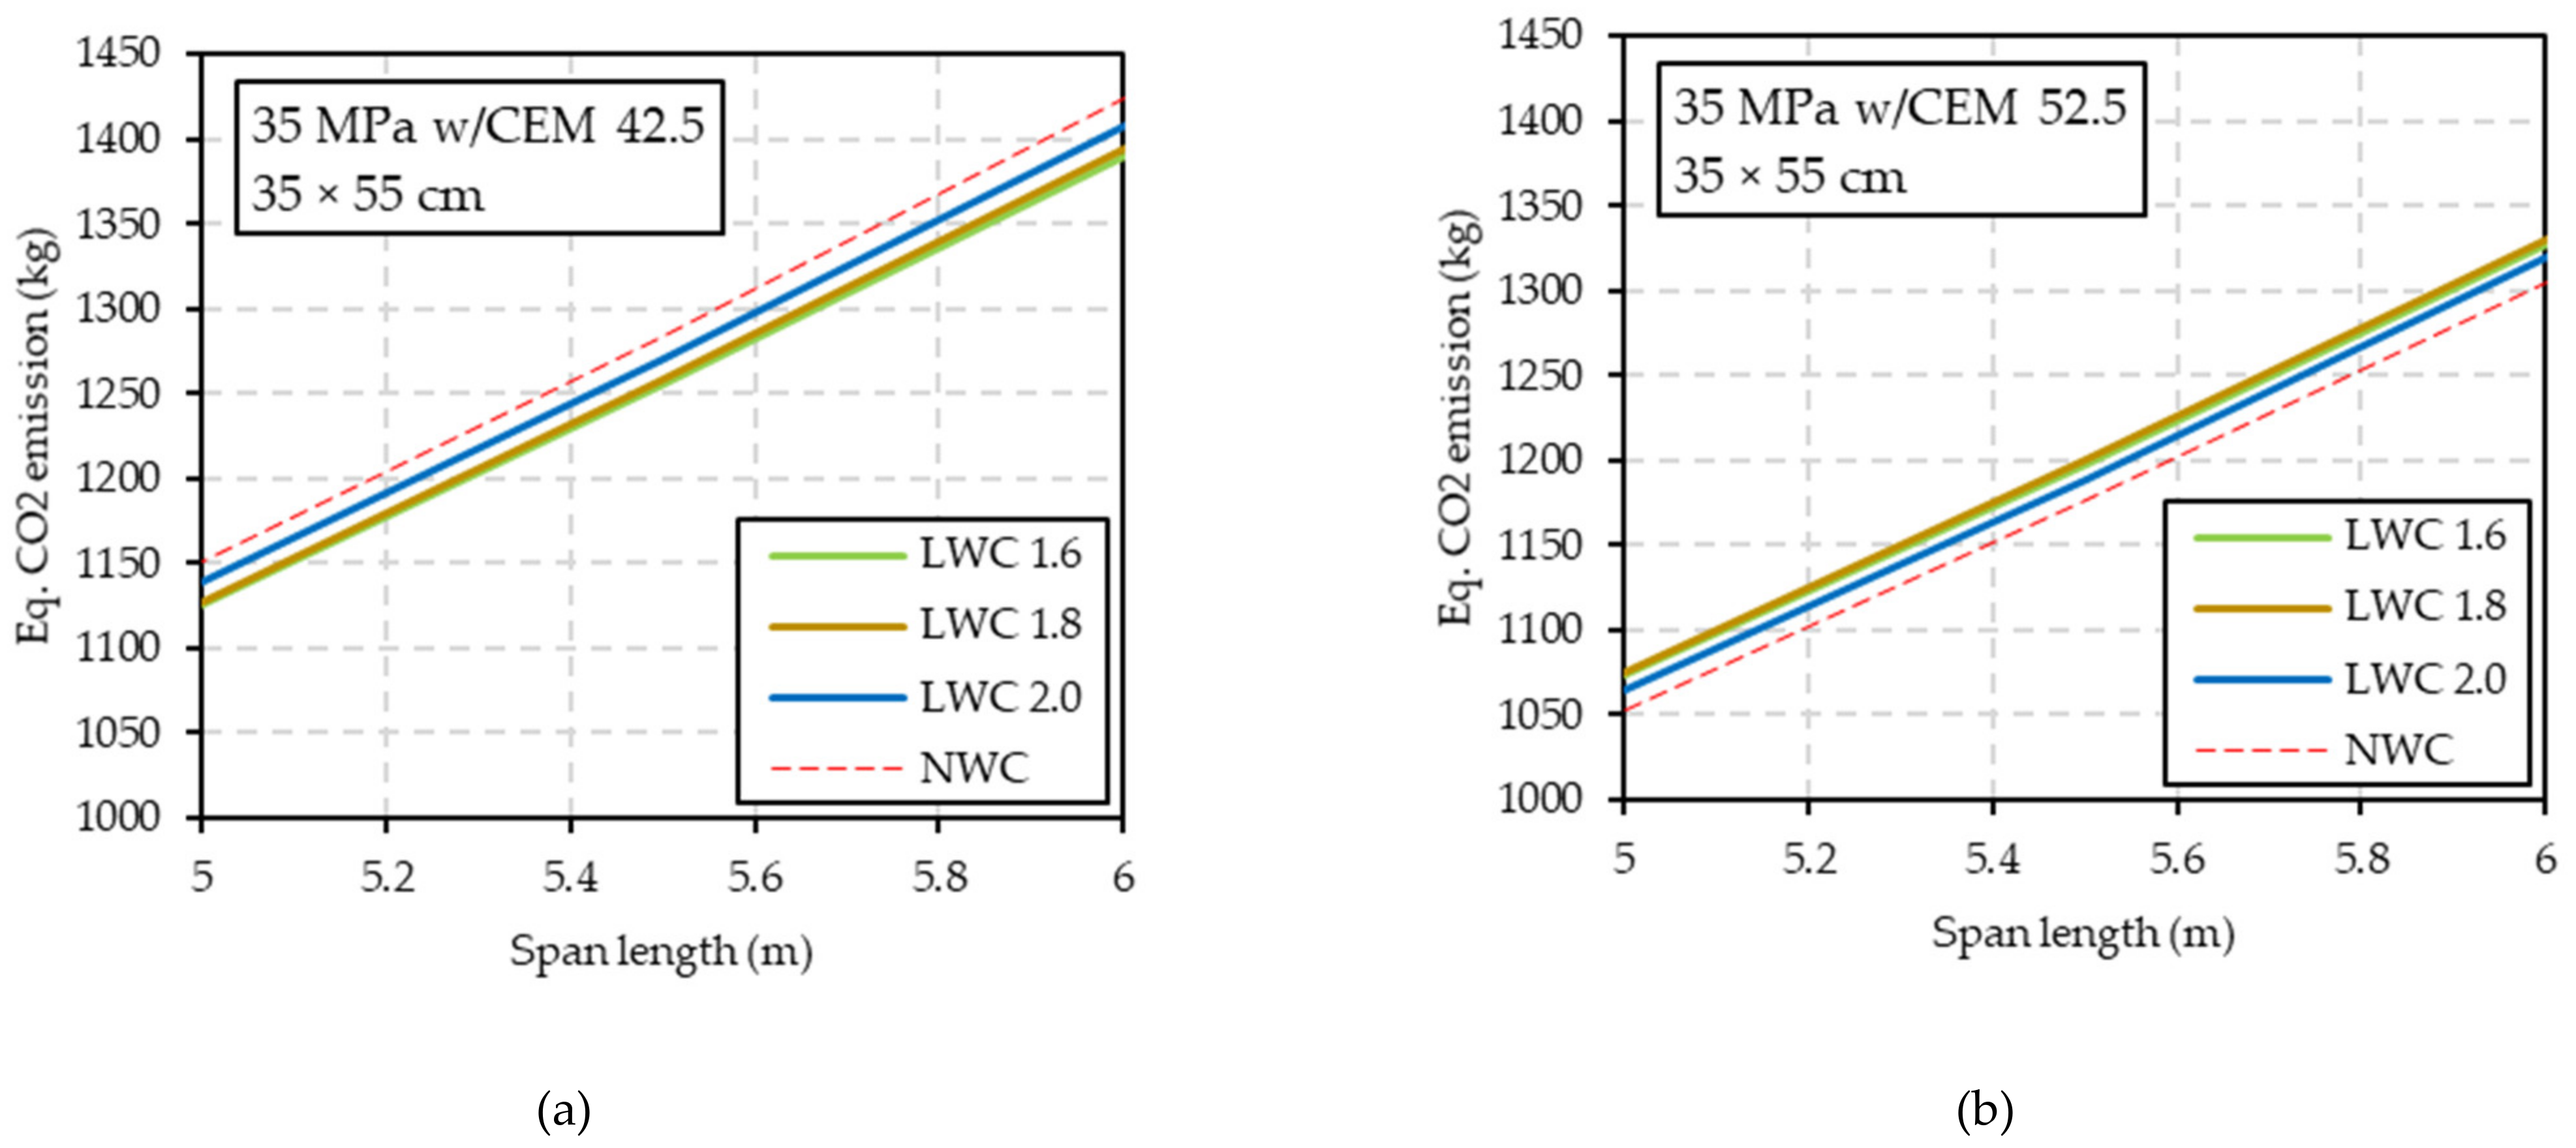
4.1.1. Beam Size, Concrete and Cement Strength and Redistribution Factor

This sub-section deals with the impact of the cross-sectional dimensions (width b and depth h), the span length (L, in m) the characteristic concrete compressive strength (fck or flck, in MPa), the cement type (given by its strength, 42.5 or 52.5 MPa) and redistribution factor used in the structural analysis (δ). The output variables that are analysed here are: (i) the total load (ultimate limit state, ULS, design value, in kN) that must be withstood by the three supports of the beam; (ii) the steel total mass used as longitudinal reinforcement (in kg); and (iii) the equivalent CO2 emissions (in kg), accounting for both cement consumption—by the beam and the floor slab—and longitudinal reinforcements.
In order to better illustrate the impact of each design parameter, the rest of the parameters have constant values. The live load (qlive) is 2 kN/m2 (residential buildings, according to [12]). The tributary width (TW) is 4.5 cm. The concrete cover to the longitudinal rebar centre (d′) is 4 cm (which is a typical value for interior environments).
Neither concrete strength nor cement type have an impact on the loads transmitted to the columns, which is fundamentally a function of the concrete density and the span length in this sub-section (see Figure 7a,b). The total ULS design load upon the three supports could be reduced by 3.6% (LWC of class 2), 5.7% (class 1.8) and 7.7% (class 1.6) when using the smallest beam considered in the analysis (25 × 35 cm, Figure 7a). In the case of the largest beam (35 × 55 cm, Figure 7b), the reductions would be higher: 4.3% (class 2), 6.7% (class 1.8) and 9.2% (class 1.6).
It should be noted that the reduction of the structural self-weight in the horizontal elements (beams and floor slabs) has a positive impact, not only on the structural requirements of columns and foundations, but also on the seismic forces applied on the structural frame.
Regarding the steel consumption for longitudinal reinforcements, the results are graphically shown in Figure 8. In this case, the values of qlive, TW and d′ remain the same as before, but now the characteristic concrete compressive strength (fck, flck) has a value of 25 MPa (regardless of the cement type used in the mix).
Judging from the information in Figure 8, the use of LWC would seem to have a positive impact on steel consumption, i.e., it would help reducing the required longitudinal reinforcements. However, with the smallest cross-sectional size considered in the analysis (b × h = 25 × 35 cm, Figure 8a) the use of LWC has a negligible effect—a slight increase in steel consumption by 0.2% with LWC of class 1.8.
For moderate and large size beams (Figure 8b–f) the steel consumption is generally reduced. As an example, and following with density class 1.8, the steel would be reduced by an average of 2.6% (b × h = 30 × 45 cm) or 4.5% (b × h = 35 × 55 cm).
Pertaining to the impact of the redistribution factor in the global analysis of bending moments, it should be noted that this feature ought to be used wisely. For instance, with large cross-sections (e.g., b × h = 35 × 55 cm), factor δ does have a positive effect, with a slightly greater reduction in steel reinforcement: from 4.5% (δ = 1 in density class 1.8) to 4.8% (δ = 0.8 in density class 1.6, Figure 8f). However, in the case of moderate size beams (e.g., b × h = 30 × 45 cm), Figure 8e clearly shows that LWC’s would increase the longitudinal reinforcements with spans longer than 6.5 m. Focusing on the impact of moment redistribution on the smallest size beams considered here, Figure 9 not only confirms that LWC would not help reducing the reinforcing steel requirements, but also shows that activation of limited redistribution analysis in the structural design software would have undesirable effects.
To better illustrate this discussion, Table 9 lists the values of reinforcing steel mass required by NWC and class 1.8 LWC continuous beams with 4.5 m and 6.5 m long spans, accounting for the possibility of carrying out a linear analysis (δ = 1) or a limited redistribution analysis (with δ = 0.8). The concrete strength remains 25 MPa. The smallest and the largest cross-sectional sizes are discussed.
In the case of small size beams (25 × 35 cm) for shorter span lengths (L = 4.5 m, L/h ≈ 13), Table 9 shows that the use of LWC and/or limited redistribution analysis has a very negligible effect on longitudinal steel consumption (1 kg out of 58 at the most). If this small cross-section were used for longer spans—L/h ≈ 19, which does seem slightly too slender for downstand beams– the steel consumption would be around four times larger and the combined use of LWC and redistribution would be the less sustainable (16% increase in steel mass with respect to NWC and the traditional linear analysis). On the contrary, by designing an appropriate size cross-section for that longer span (b × h = 35 × 55 cm for L = 6.5 m, L/h ≈ 12), an analysis with δ = 0.8 and a LWC of density class 1.8 would make it possible to use almost 9% less steel.
The overall effect that LWC density class, concrete compressive strength, cement type and cross-sectional size have on the global CO2 emission is illustrated in Figure 10 (beams with b × h = 25 × 35 cm) and Figure 11 (b × h = 35 × 55 cm). The estimated CO2 emission is based on only the reinforcing steel mass and the cement consumption, because it is assumed that the rest of the sources of CO2 emissions associated with building construction would hardly be affected by the type of concrete (NWC or LWC).
The general observation regarding the results shown in Figure 10 and Figure 11 is that the use of LWC does not seem to have a global positive effect on sustainability if we focus only on the isolated impact of those structural elements that may have been built using LWC (the beams and floor slabs). Although the reduction in self-weight can potentially be beneficial (Figure 7)—leading to less concrete and cement consumptions in columns and foundations on account of structural self-weight and seismic performance—and although the use of LWC could help saving reinforcement requirements (Figure 8 and Figure 9), the impact of LWC on the concrete mix design has dramatic importance. Nevertheless, the cement consumption of LWC with respect to that of the equivalent NWC may be reduced with 35 MPa compressive strength LWC, made with cement of grade 42.5 MPa (Figure 10c and Figure 11a). For LWC of class 1.8, the most positive average effect on CO2 emission is attained with flck = 35 MPa and CEM 42.5: an average reduction in CO2 emission by 2.1% out of an average of 1296 kg that corresponds to the NWC. Conversely, the worst average is attained with flck = 20 MPa and CEM 42.5: an average increase in CO2 emission by 6% out of an average of 962 kg.
It is worth mentioning that these results are very sensitive to the values of metric tons of CO2 emissions per ton of steel (1.85) and cement (0.66) considered, both of which are based on worldwide averages. Thus, the ratio steel-to-cement impact on CO2 is 1.85/0.66, i.e., 2.8 to 1. Table 10 provides the cement and steel consumptions in a wide range of situations with 25 MPa concretes made with CEM 42.5 (global ULS analysis with δ = 1). Three span lengths are considered—short (4.5 m), medium (5.5 m) and long (6.5 m)—for two cross-sectional sizes—small (b × h = 25 × 35 cm) and large (35 × 55 cm)—and two types of concrete—NWC and a LWC of class 1.8.
Focusing on smaller cross-sectional sizes for covering short span lengths and also on larger cross-sectional sizes for longer spans, the ratio of steel-to-cement consumption (by mass) seems to be around 1 to 16. It should be noted that this ratio is estimated for residential use (qlive = 2 kN/m2) and floor slabs with a tributary width of 4.5 m. Since the CO2 impact of both materials is around 3 to 1, the viability of concretes made with lightweight aggregates as a sustainable alternative would fundamentally depend on the cement consumption control.

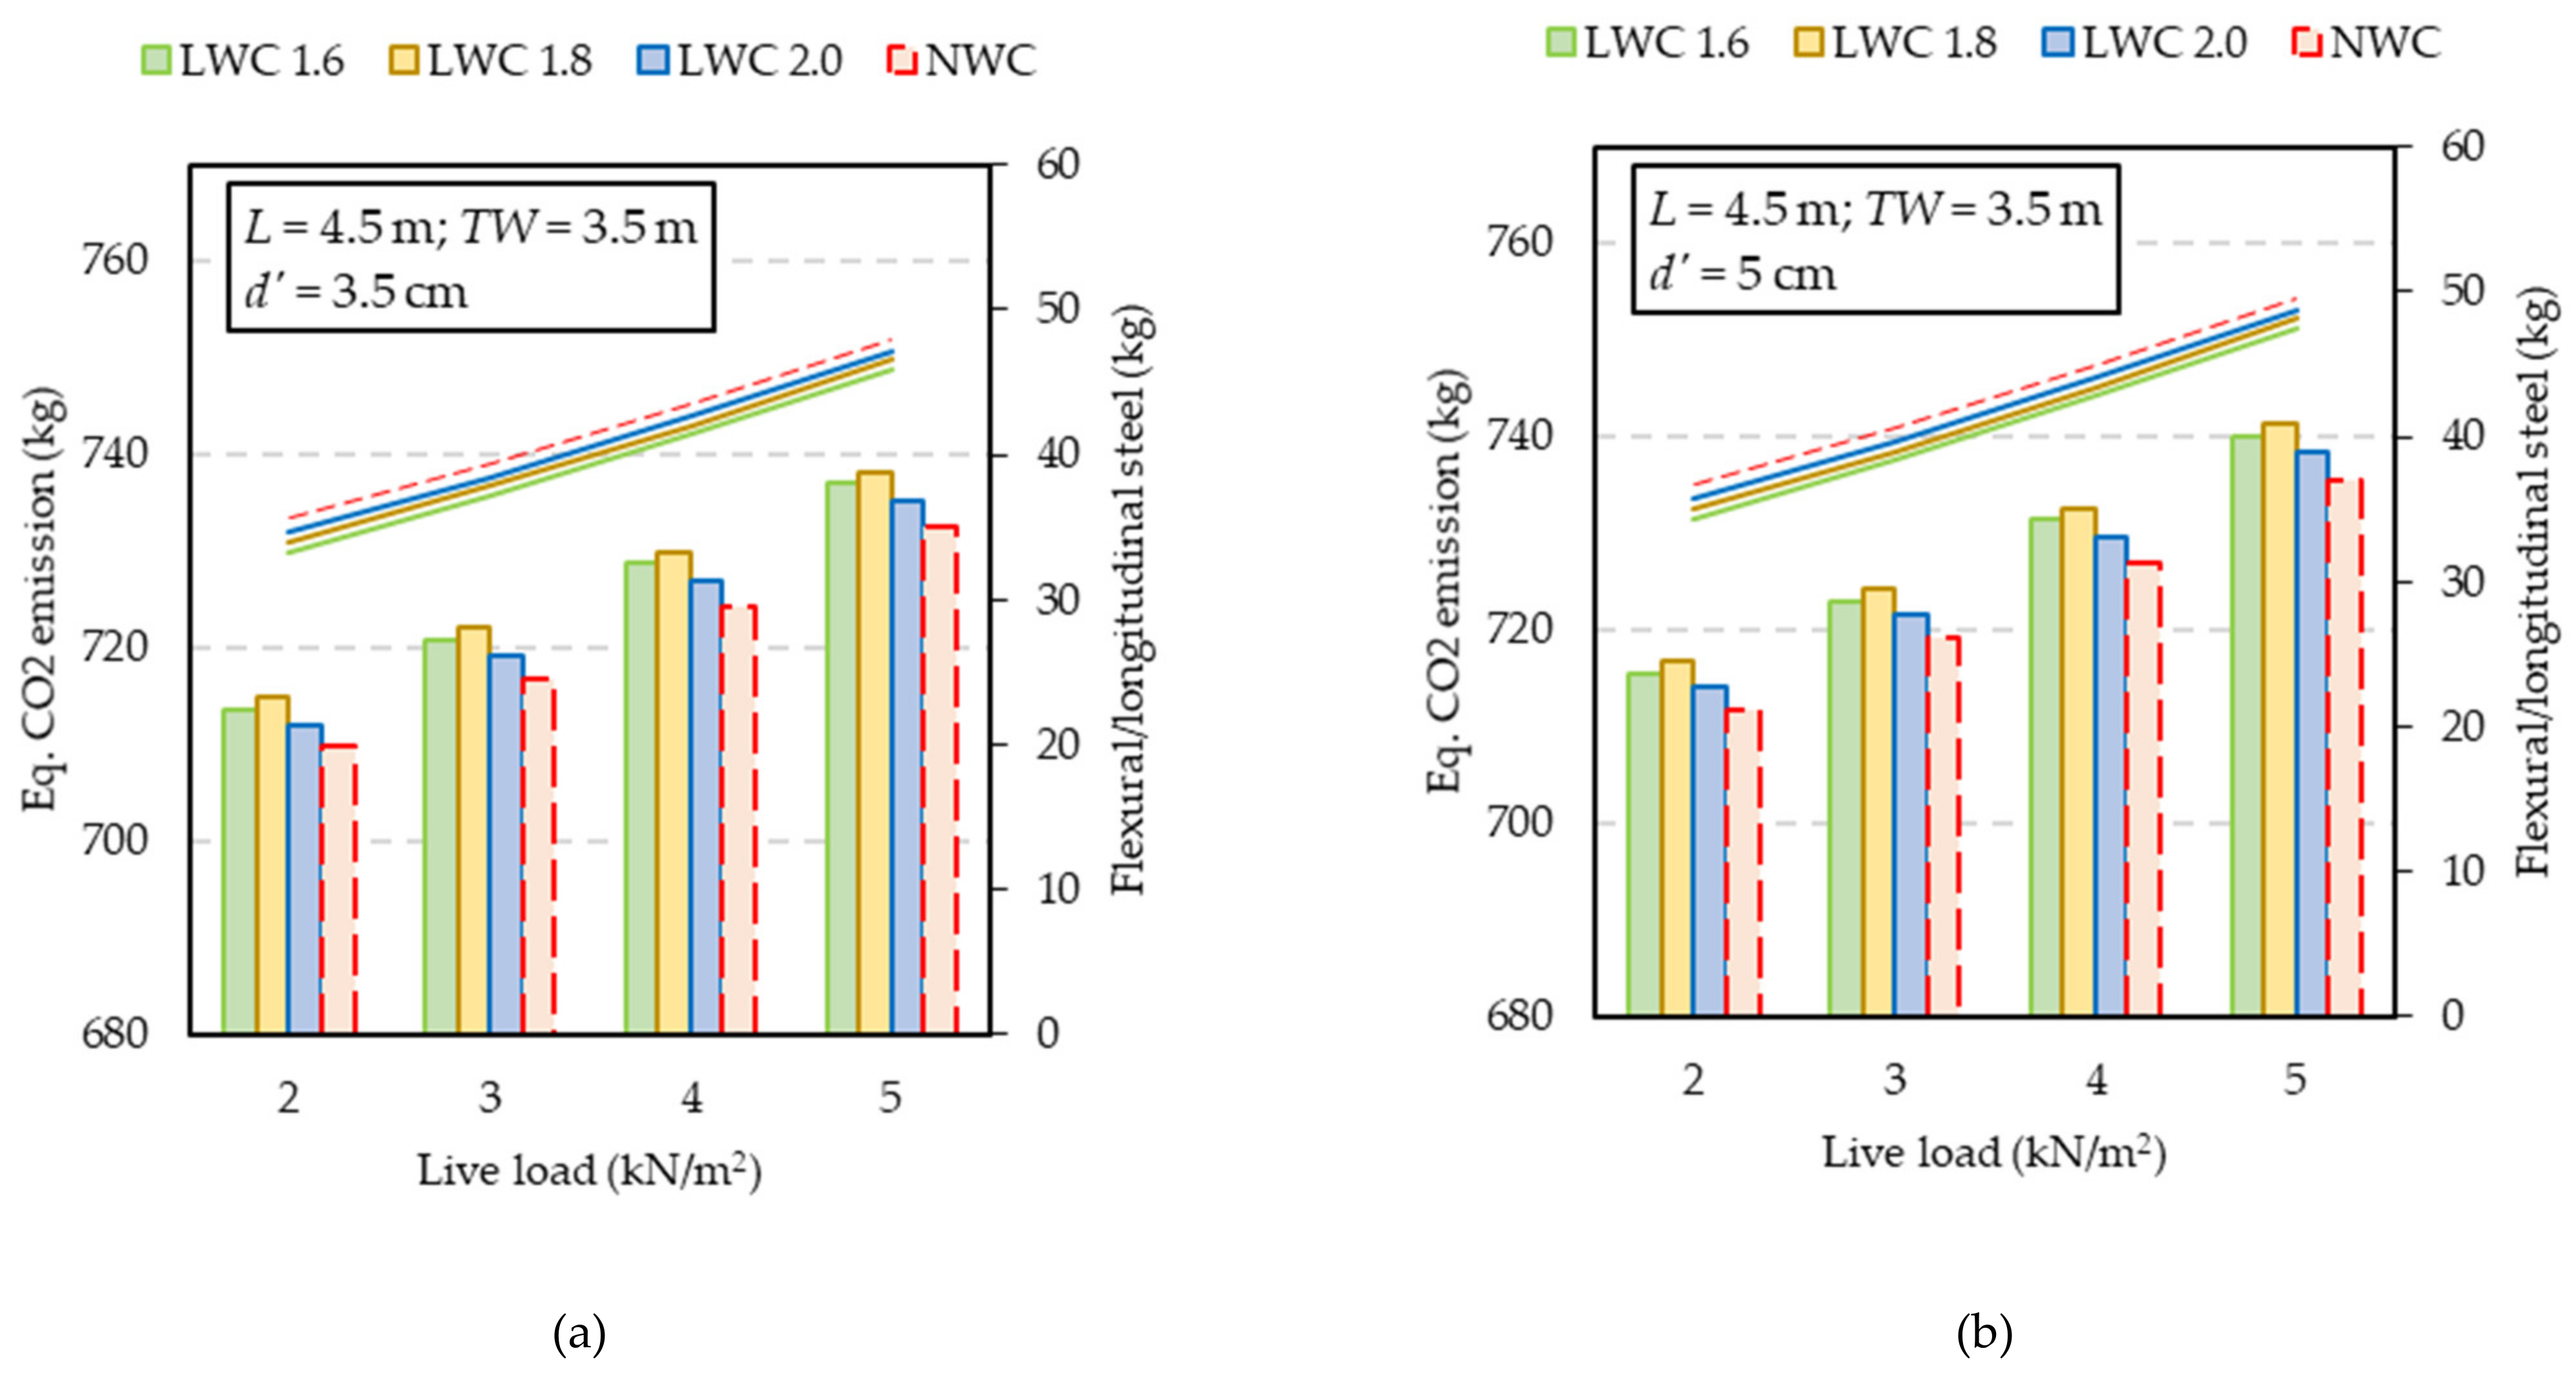
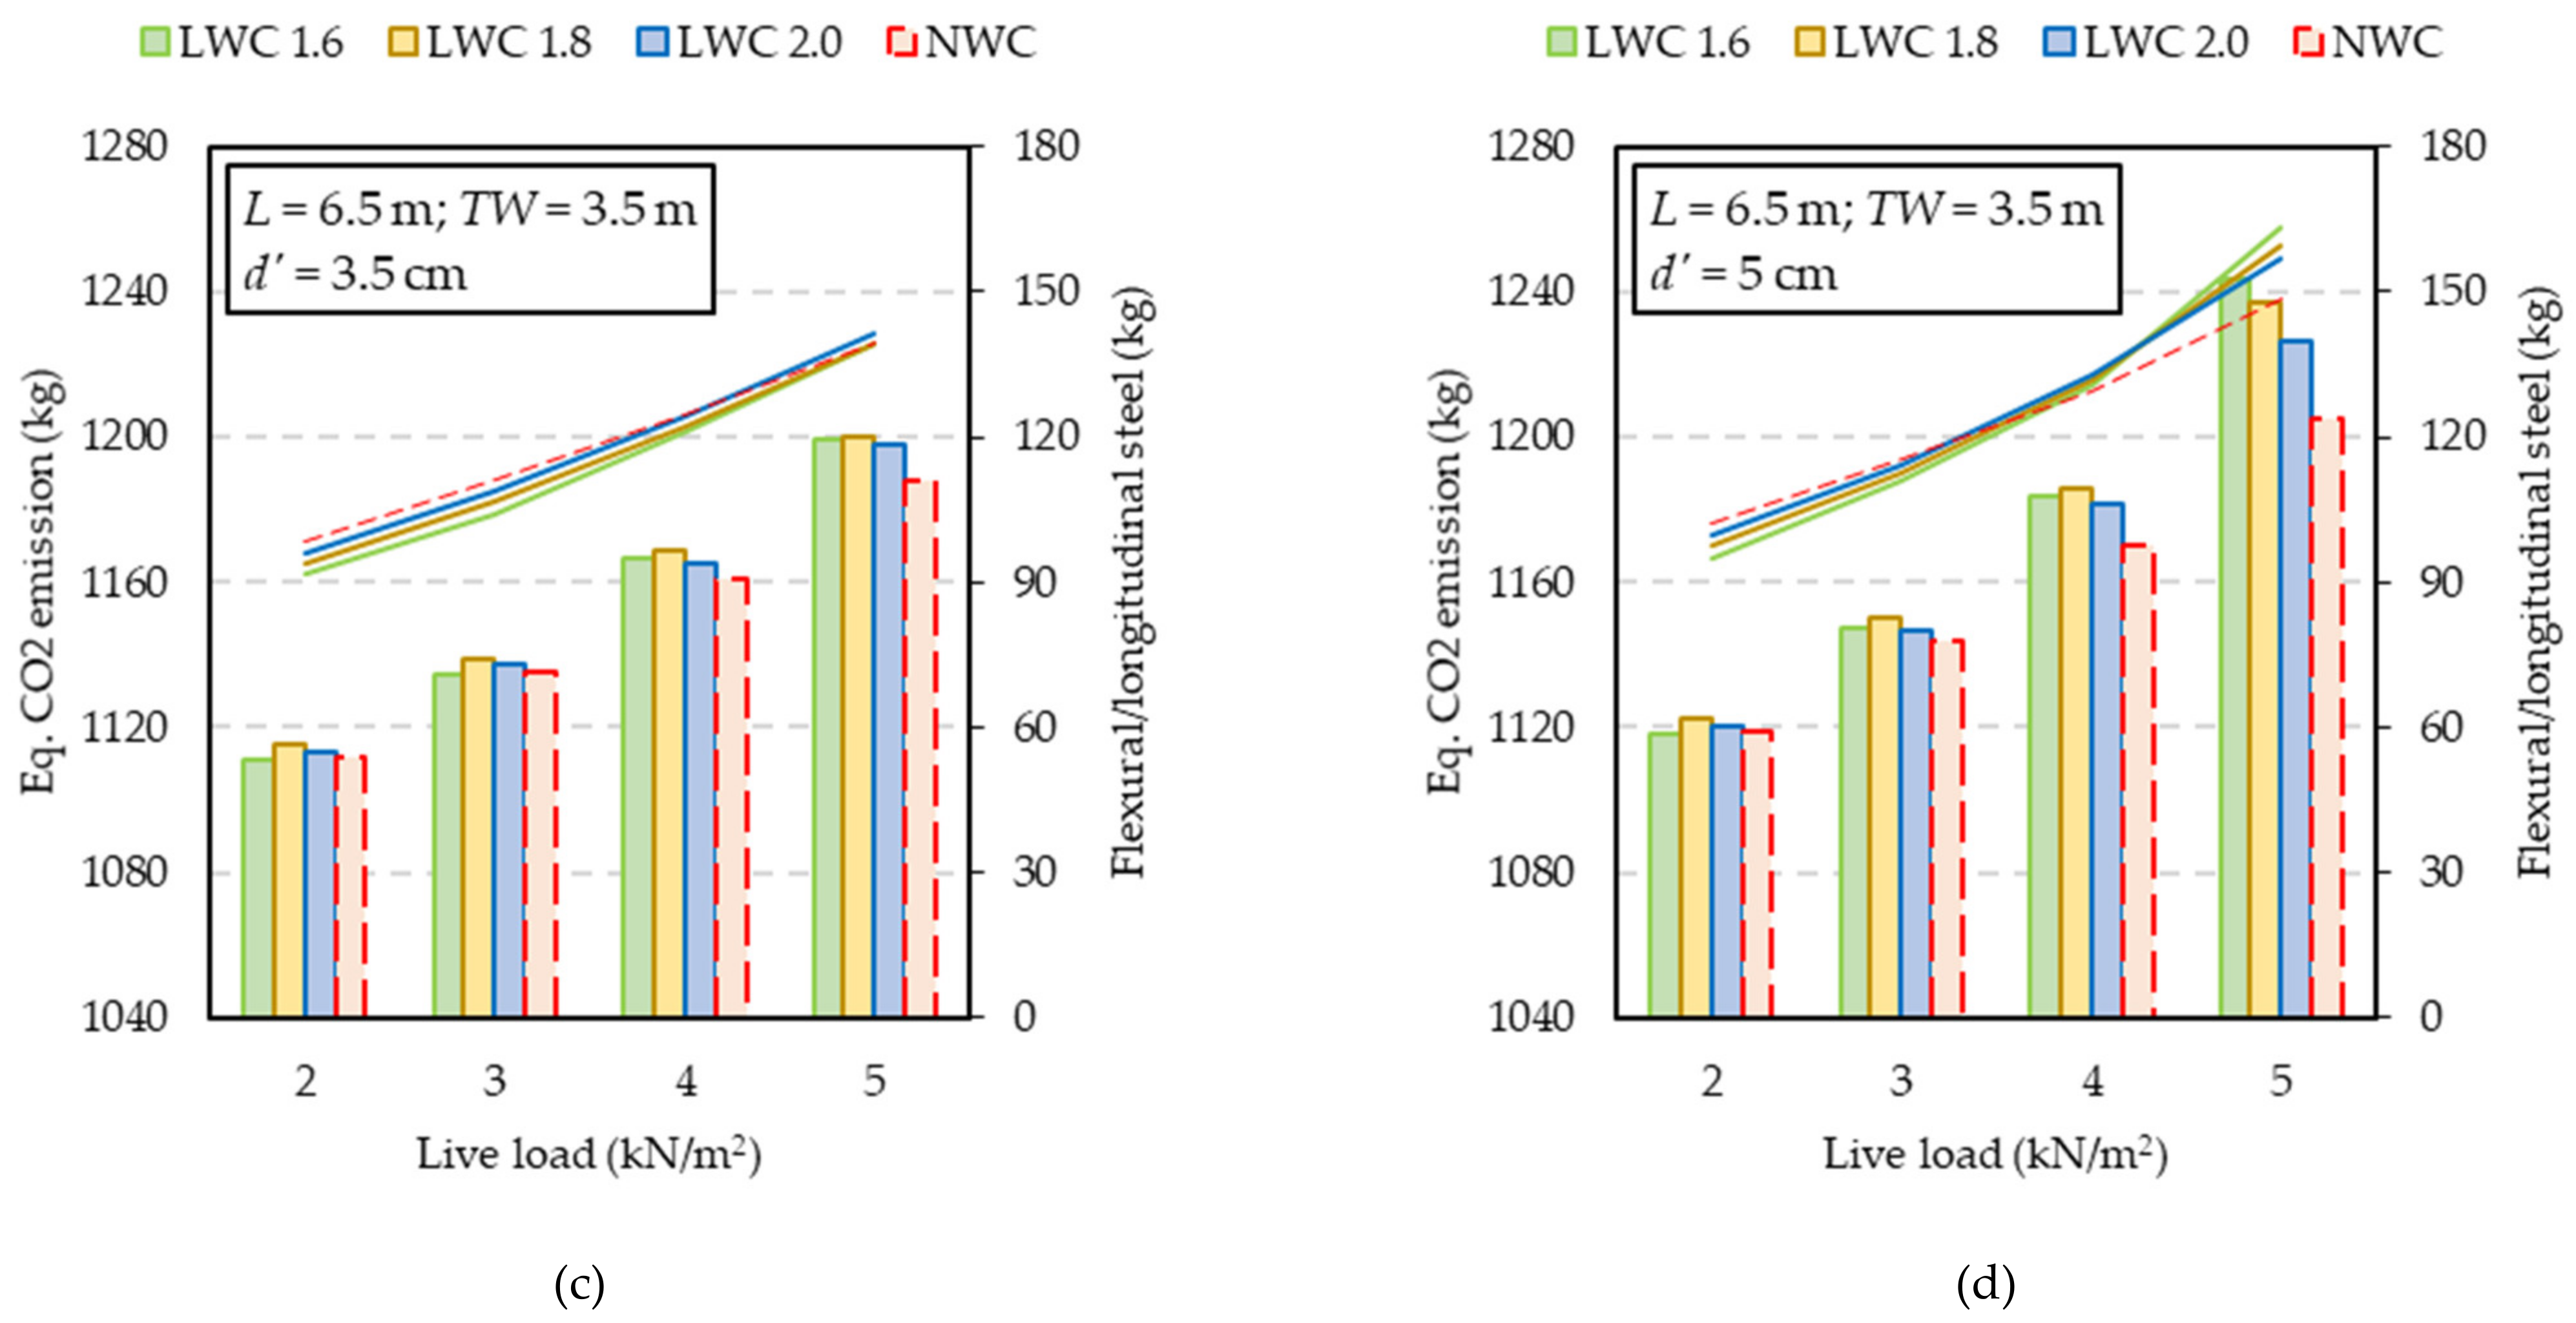
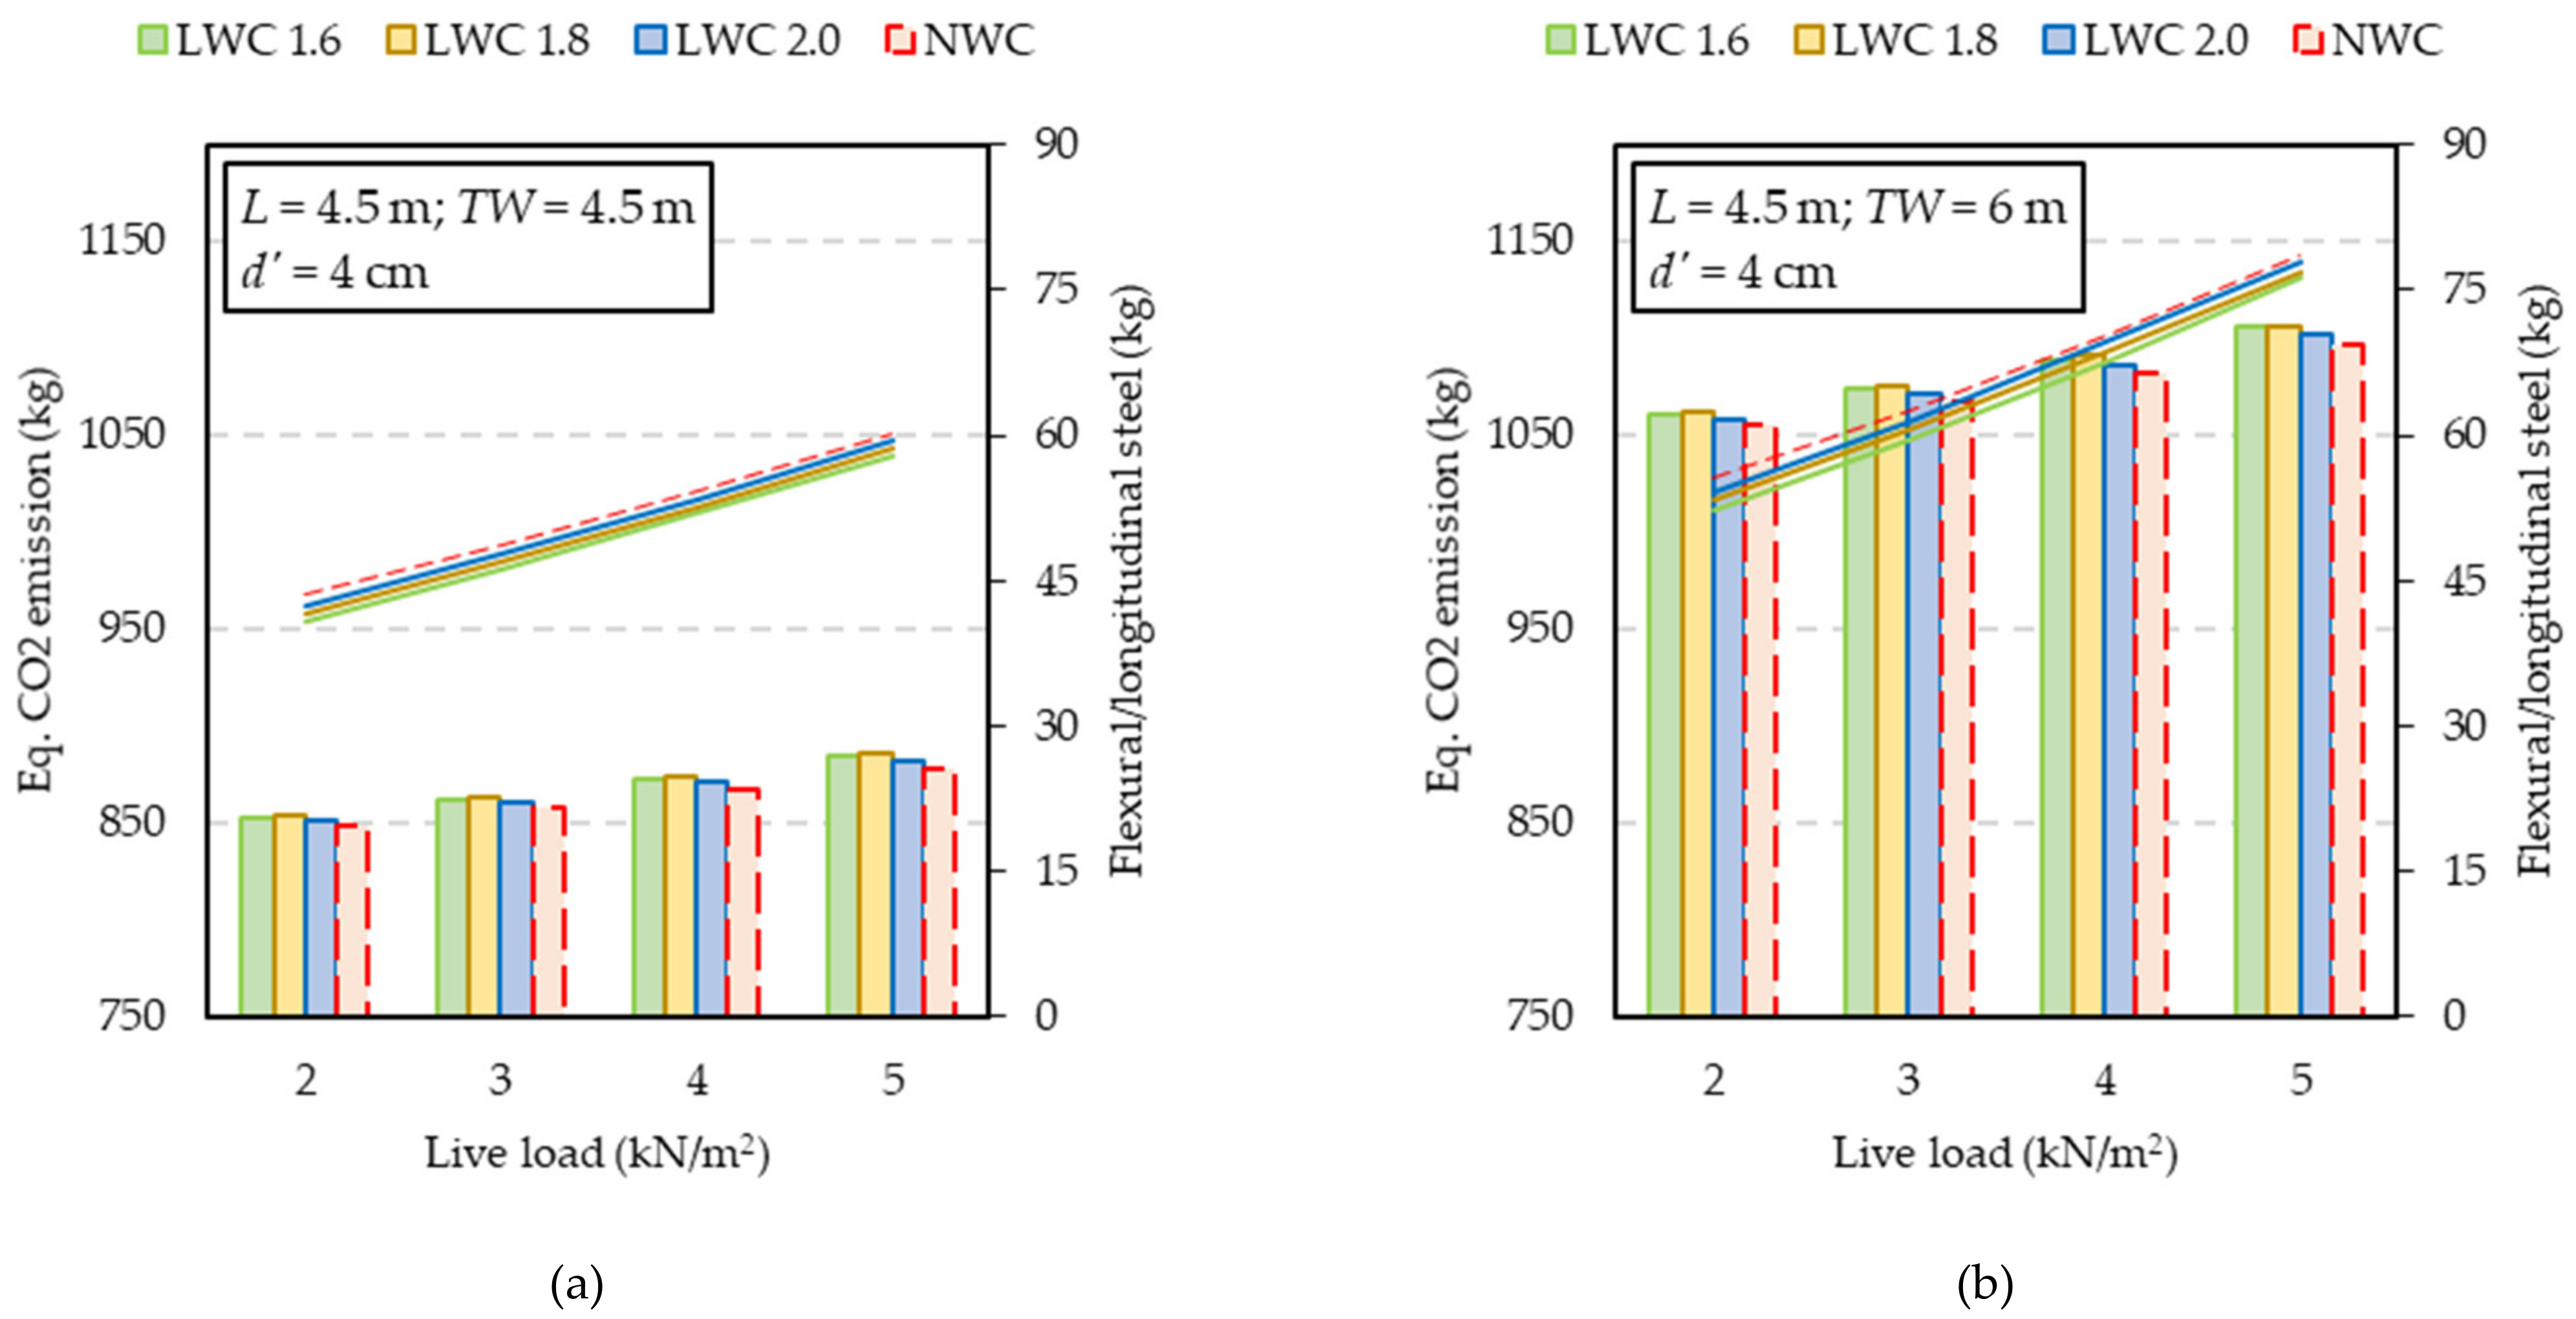
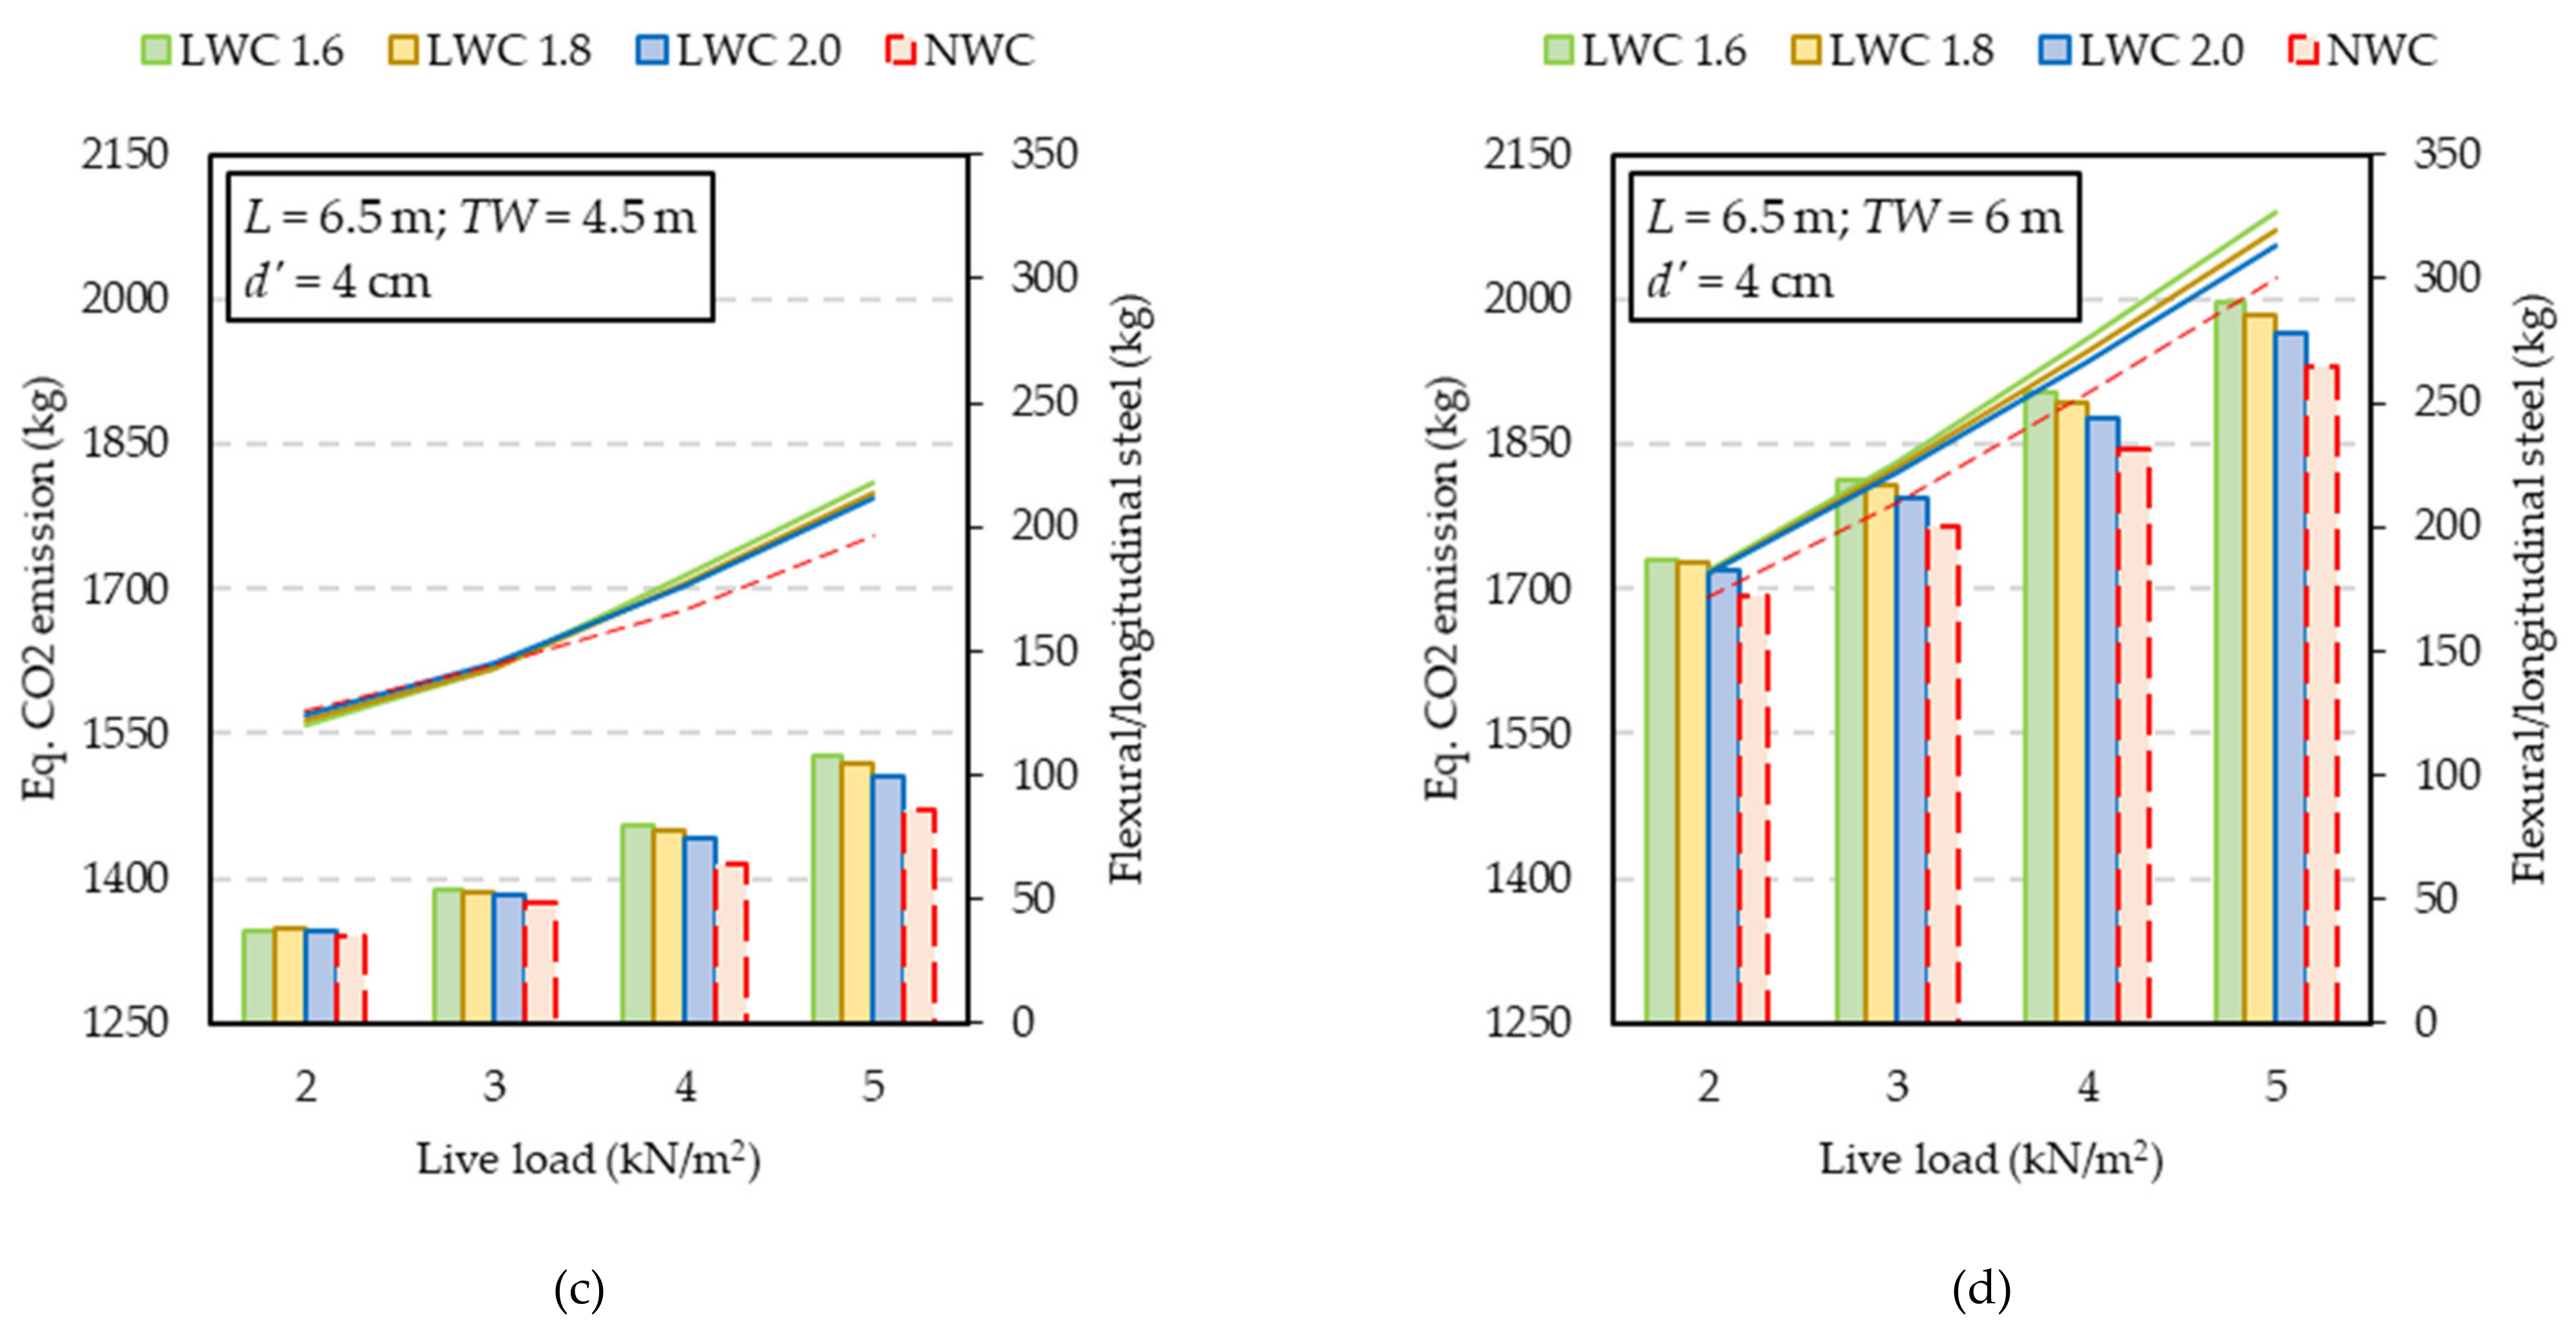
4.1.2. Live Load, Tributary Width and Concrete Cover

This sub-section deals with the impact of the live load (qlive), the floor slab’s tributary width (TW) and the concrete cover to the longitudinal rebar centre (d′).
In order to better illustrate the impact of each design parameter, the rest of the parameters have constant values. The characteristic concrete compressive strength (fck, flck) is 30 MPa, assumed to be made with CEM 42.5. The global ULS analysis is linear elastic with redistribution of bending moments defined by δ = 0.8 (the minimum regardless of the reinforcing steel ductility class). The cross-sectional dimensions are b × h = 30 × 45 cm.
Two different values of the span length of the continuous beam are considered: 4.5 or 6.5 m. Thus, the beams’ slenderness L/h would be between 10 and 14. Given the relative importance of the steel-to-cement consumption ratio annotated at the end of the previous section, Table 11, Table 12 and Table 13 give the inverse of the said ratio (i.e., cement-to-steel consumption) as a function of the live load and the tributary width (TW = 3.5 m in Table 11; TW = 5 m in Table 12; TW = 6 m in Table 13), and averaged without regard to the span length L.
The results shown in Table 11, Table 12 and Table 13 indicate that for low loads and narrower tributary widths, the lighter the LWC the higher the steel-to-cement consumption ratio. Conversely, for greater loads (commercial and public congregation areas [36]) and wider tributary sizes, a LWC with a density class of 2 would require slightly less steel than the NWC and the other two types of LWC analysed. This would justify a slight advantage of the LWC of class 2 because, as illustrated in the final discussion of the previous section, the viability of lightweight concretes as sustainable construction materials would partially depend on their capability to reduce the steel consumption.
The equivalent CO2 emissions and also the reinforcing steel requirements are plotted in Figure 12, which now illustrates the impact of small variations in the concrete cover. The vertical bars in Figure 12 correspond to the equivalent CO2 emissions on account of cement and steel. The data lines reflect the reinforcing steel required (in kg, with the secondary axis on the right of the graphs). The information on Figure 12a–c would confirm that LWC of class 2 is more feasible and sustainable than lighter LWC’s, because the equivalent CO2 estimation is closer to that of the NWC. The graphs of Figure 12a–c also show that LWC helps reducing the steel consumption. However, a small variation in the concrete cover by just 1.5 cm has a critical impact on the reinforcing steel requirements when the beam’s slenderness increases (from L/h = 10 in Figure 12b to L/h = 14 in Figure 12d): all LWC’s require more steel for live loads of 4 and 5 kN/m2, even though the tributary width is the narrowest considered (TW = 3.5 m).
The undesirable impact on steel consumption due to the use of LWC, high slenderness and heavy live load is also shown in Figure 13.
To sum up, a lightweight aggregate concrete of density class 2 would not have a negative impact on sustainability, provided that the beams’ slenderness remains at a moderate value (≈10). Furthermore, its potential positive effect would be more significant in floor slabs subjected to heavier live loads. Lighter LWC’s would require a global analysis of the whole structural frame, including its foundations, in order to ascertain their viability as sustainable concrete solutions.

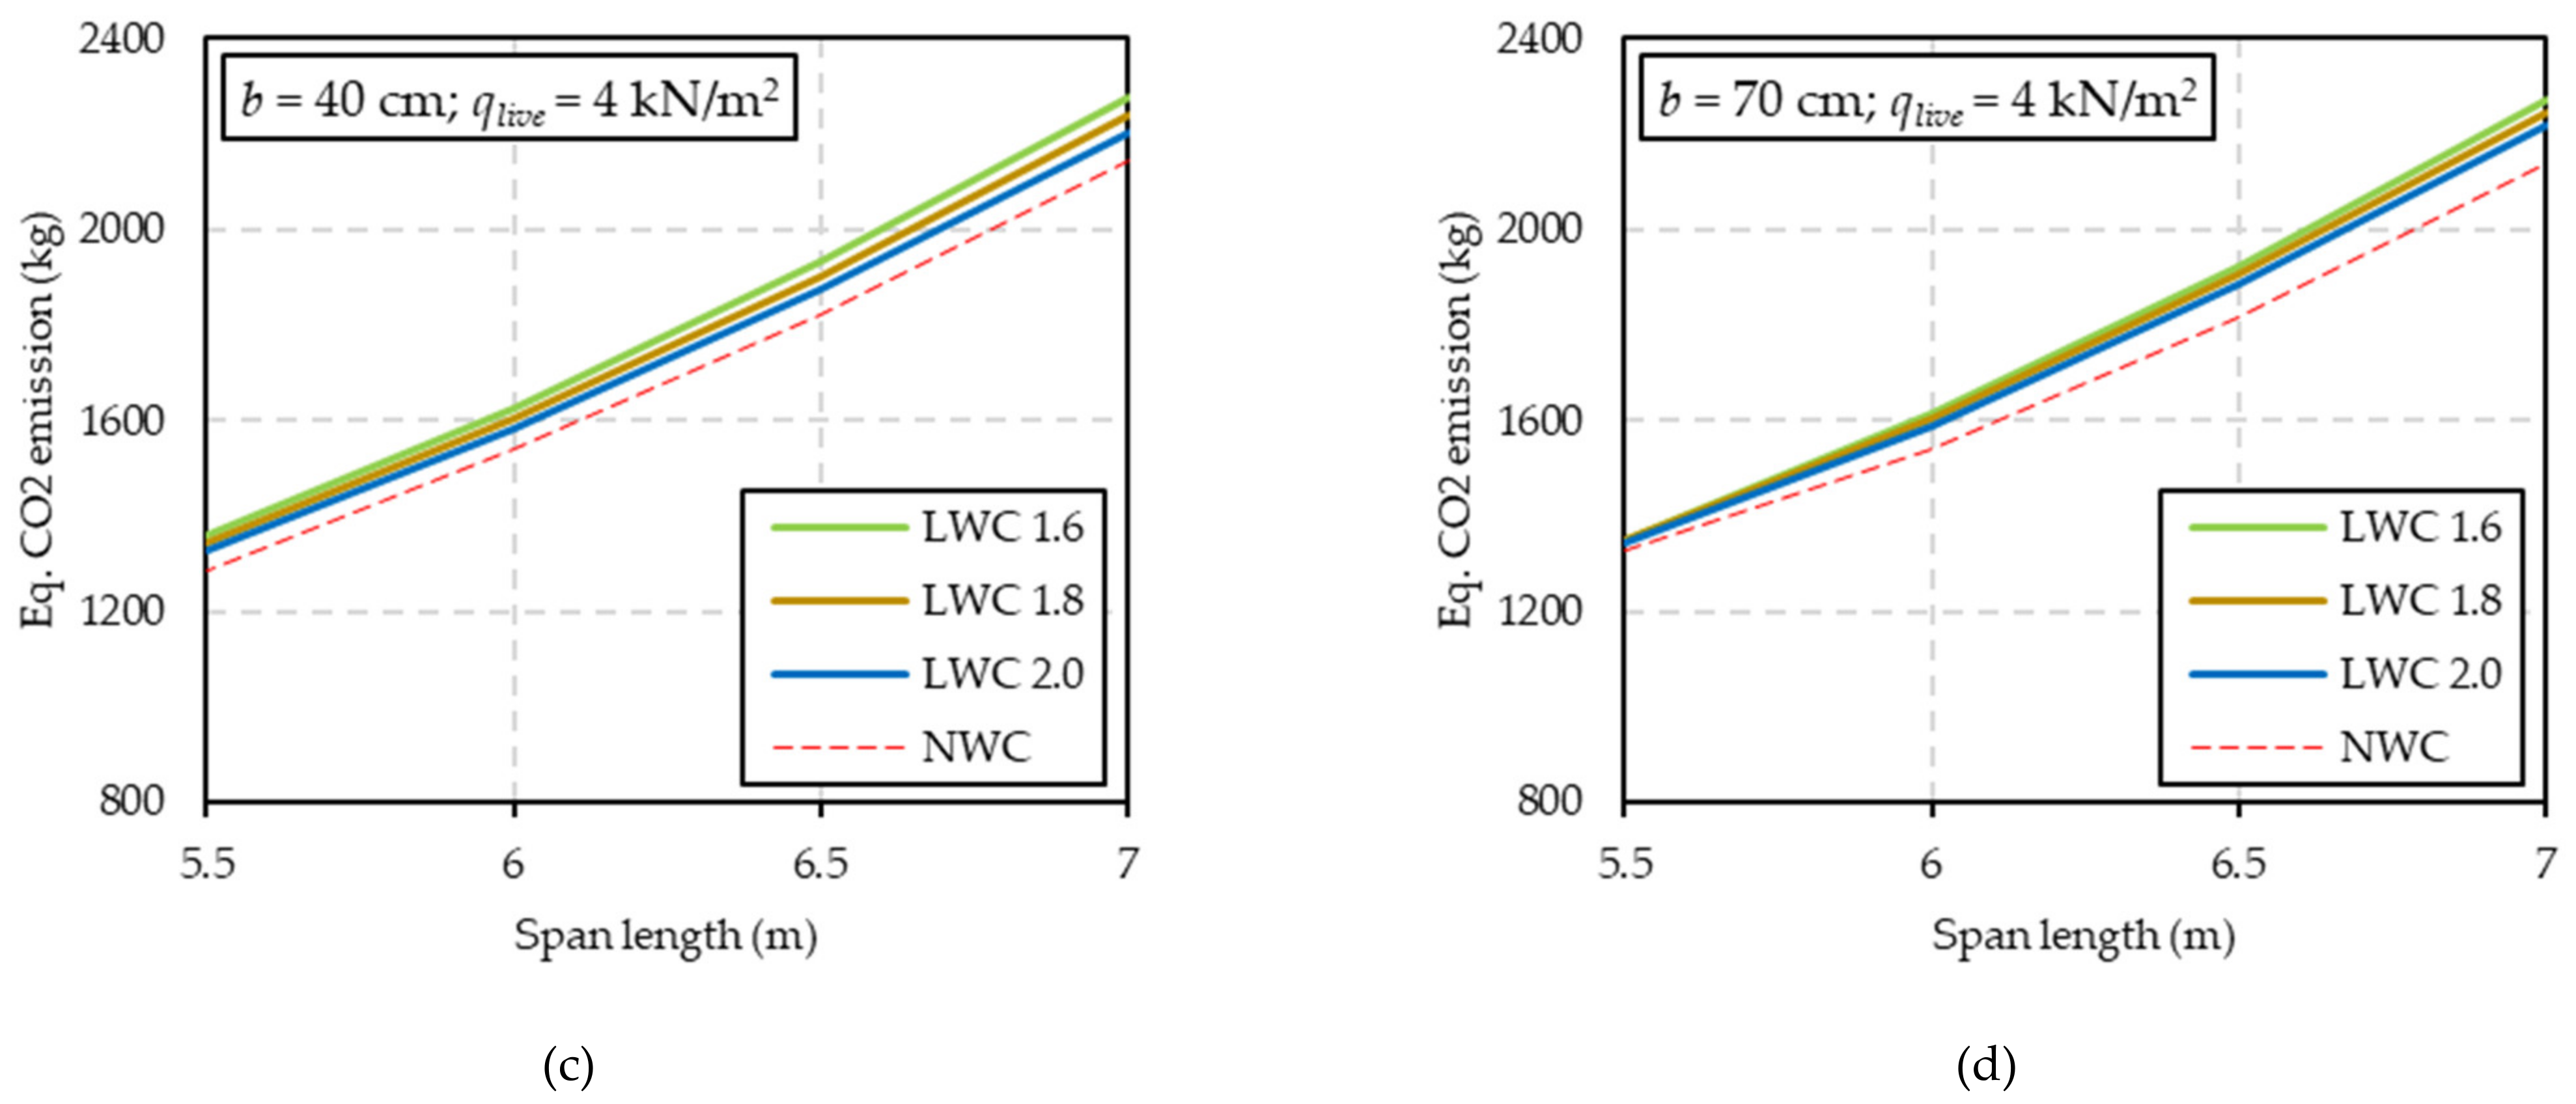
4.2. Flat Beams and Wide-Shallow Beams

This sub-section of the results discussion focuses on flat beams supporting the floor slab that has been considered in this structural parametric analysis. The floor slab (with a thickness of 27 cm) consists of a beam-and-block system in which the prefabricated hollow block has a depth of 22 cm and the thickness of the in situ concrete placed on top of it has a thickness of 5 cm. Thus, the total depth of the beams’ cross-section is h = 27 cm in all cases. Values of the cross-sectional width (b) between 40 cm and 70 cm have been analysed. Given that design parameters such as concrete compressive strength, cement type and tributary width have already been discussed above, this sub-section is focused mainly on the impact of cross-sectional width (b), concrete cover (d′), live load (qlive), span length (L), redistribution factor (δ) and density class. The results in this sub-section are limited to flat beams made with a normal-weight or lightweight concrete of 30 MPa (using a 42.5 MPa cement), supporting a tributary width of 4.5 m. First, the impact of the redistribution factor, the live load and the concrete cover is analysed through the graphs in Figure 14.
Flat beams typically possess a short lever arm, which can compromise the rotation capacity, thus requiring both tension and compression reinforcement. This was discussed when presenting Equations (15)–(17). Furthermore, if the concrete cover d′ were significant with respect to the effective depth d (see Equation (18)) the longitudinal compression reinforcement may not yield and would then exhibit stresses well below the design yield strength fyd. Or even worse, as shown in Table 2, there are some instances in which the longitudinal compression reinforcement is not really in compression. On top of that, the combined use of LWC—with a lower ultimate strain εlcu2 compared to NWC, see Equation (1)—and limited redistribution analysis—which requires a greater rotation capacity than linear elastic analysis—are the reasons explaining the trends shown in Figure 14a–c: lower values of the redistribution factor δ lead to designs that dramatically increase the total amount of longitudinal steel reinforcements, because of the inefficiency of the compression rebars. Moreover, Figure 14b–d illustrate how there would not even be a feasible structural solution when simultaneously using flat beams, thicker concrete covers (5 cm, in this case) and redistribution factors below 0.8–0.85.
Pertaining to the live load, and provided that the redistribution factor δ remains over 0.85, LWC would succeed in reducing the total mass of steel reinforcement with residential buildings (qlive = 2 kN/m2) with a beam slenderness L/h = 4.5/0.27 ≈ 17 (Figure 14a,b).
Finally, an estimation of the CO2 emissions is represented in Figure 15 (for a live load qlive = 2 kN/m2, residential use according to [36]) and Figure 16 (for a live load qlive = 4 kN/m2, commercial use according to [36]).
To allow for a better interpretation of the results, span lengths have been divided into two ranges:
  • Firstly, 4 to 5 m in Figure 15a,b and Figure 16a,b; this is equivalent to a beam slenderness L/h between 15 and 18.5.
  • Secondly, 5.5 to 7 m in Figure 15c,d and Figure 16c,d; the slenderness is now between 20 and 26.
The cross-sectional width lies between 40 cm (Figure 15a,c, Figure 16a,c) and 70 cm (Figure 15b,d, Figure 16b,d). There is no strict rule to determine the width of flat beams wide-shallow beams (WSBs). A ratio b/d > 2 is suggested in [42] but, depending on the country, b/h values can be as high as 4-to-5 [43]. Regarding shear performance, values of b/d ≤ 3 are suggested in [44,45]. In the present parametric analysis, the value b/d ranges approximately from 1.7 (b = 40 cm) to 3.2 (b = 70 cm).
As can be observed in Figure 15b,d and Figure 16d, the estimated CO2 emission is hardly affected when using LWC instead of NWC. This would mean that the eventual increase in cement consumption by lighter LWCs would be compensated by the savings in steel reinforcement, regardless of the applied load. This has a positive outcome, from the point of view of sustainable construction, because the structural self-weight is reduced with practically no impact on CO2 emissions and thus: (i) the rest of the building’s structure (supports and foundations) would require less concrete; (ii) the seismic loads would be reduced; and (iii) the LWC would additionally contribute to thermal and acoustic insulation. Nevertheless, notice that the parametric analysis yields these results for cross-sectional widths of 70 cm (i.e., b/d ≈ 3) and for beam slenderness L/h below 18.5 (or b/d below ≈22).
Eurocode 2 [2] includes a deem-to-satisfy approach for concrete elements subjected to bending, which would not require an exact calculation of vertical deflections (see next sub-section). The slenderness values b/d could range from 20 to 30, depending on different boundary conditions. That means that, for the longest span considered in this analysis, up to 7 m (b/d ≈ 30), the negligible impact of LWC on CO2 emissions would still be valid for residential use (qlive = 2 kN/m2, Figure 15d), provided that the b/d ratio is close to 3. With greater live loads and slender beams, LWC might not be a sustainable alternative to NWC, because of the aforementioned requirements of sufficient rotation capacity in the presence of limited moment redistribution analysis (δ = 0.85).
In flat beams or WSBs with narrower cross-sectional widths (Figure 15a,c, Figure 16a,c) the net estimation of CO2 emissions accounting for both cement consumption and reinforcing steel would not favour the use of lightweight aggregate concretes. Therefore, their viability as a sustainable alternative to normal-weight concrete would depend on different parameters from those considered in this parametric analysis, such as seismic performance, smaller foundations, etc.

4.3. Compliance with the Serviceability Limit States

This sub-section deals with the Serviceability Limit States of stress limitation, cracking and vertical deflection. As described in the presentation of the parametric analysis, the appropriate longitudinal moduli of elasticity—Ecm for NWC or Elcm for LWC—are used when obtaining the cross-sectional inertias. The latter are then used to determine the stresses of concrete in compression and steel reinforcement in tension. The steel stress is subsequently used to verify cracking and vertical deflection, following the methodologies defined by the Eurocode 2 that do so without direct calculation.
Although a LWC of class 1.6 would exhibit a modulus of elasticity around half of that of the equivalent strength grade of NWC, in accordance with Equation (19), no problems were detected with regard to the stress limitation and cracking. Nevertheless, in the case of the limiting span length to effective depth ratio to avoid explicit calculation of deflections, the effect of the use of lighter LWCs was found to demand slightly deeper cross-sections. This is because, in addition to the stress of the tension reinforcement, which depends on a lower value of the longitudinal modulus of LWC, the required effective depth is increased by η E 0.15 . Despite this, the density classes tested in this work generally complied with the SLS of vertical deflection as successfully as their NWC counterparts.
For instance, Table 14 shows the results corresponding to downstand beams made with a typical strength grade of 25 MPa.
The design scenario in Table 14 is that of the smallest downstand beam considered in the parametric analysis (b × h = 25 × 35 cm, with a concrete cover of 4 cm) forced to support the heaviest occupancy load (5 kN/m2, according to Eurocode 1 [36] for buildings). The values in Table 14 are the ratio between the minimum effective depth dmin (required by the Eurocode 2 criterion) and the effective depth d provided by the design. Therefore, this ratio ought to be equal or less than 1. Besides, the results in Table 14 correspond to beams whose longitudinal reinforcement was previously designed with linear elastic analysis (δ = 1) in ULS.
Reinforcement designs requiring compression reinforcements in excess of 2/3 of the longitudinal tension reinforcement have been filtered out because these situations are generally impractical [46]. This is the reason why no feasible solution is found with density classes of 1.8 and 1.6 for a span length of 6 m. For this particular cross-sectional size and a span length equal or longer than 6.5 m not even NWC would provide a satisfactory solution in terms of the SLS of vertical deflections.
These results are apparently paradoxical because the lower modulus of elasticity of LWC and its long-term creep behaviour do not seem to excessively penalize reinforced lightweight concrete beams. The reason might be found in the design stress–strain relationship used for ULS design (Figure 1 and Equation (4)) and the approach defined in Eurocode 2 to check the rotation capacity at the critical cross-sections (Equation (13)). The combination of these two factors, as earlier discussed in the case study and in previous sections of the parametric analysis, generally requires greater amounts of compression reinforcement in LWC than in NWC. This issue, along with the lighter service load when using LWC, helps reducing the stress of the tension reinforcement at SLS and attenuates the increment of the minimum effective depth to comply with the SLS of vertical deflection.
Finally, the impact that the moment redistribution factor δ (used exclusively in ULS) has on the SLS of vertical deflection (based on a linear elastic analysis without redistribution), is illustrated in Table 15, which corresponds to almost the same design considerations made for Table 14, but with a moderate cross-sectional size of b × h = 30 × 45 cm. Only the results for the longest span lengths are shown now.
The results in Table 15 are relevant because: (i) they seem to confirm that LWC beams of densities equal or over class 1.6 would not exhibit an excessively worse SLS behaviour with respect to the equivalent NWC; (ii) moderate values of the redistribution factor used for the global ULS design (e.g., δ = 0.85) would lead to slightly more robust reinforced concrete beams in SLS, because the ratios of the minimum required effective depth to the provided effective depth are somewhat smaller; (iii) the latter effect is moderately more significant in LWC than in NWC; and (iv) a longitudinal reinforcement design based on the maximum moment redistribution allowed for ULS is likely to compromise the subsequent compliance with the SLS of vertical deflections and this drawback is more severe in LWC than in NWC.

5. Conclusions

This work has presented a methodology for ascertaining whether concretes made with lightweight aggregates offer a sustainable alternative to conventional normal-weight concretes or not. First, the European standard’s prescriptions were analyzed and developed into compact design equations for structural elements subject to bending. A case study was then presented, using the said equations and leading to potential benefits of using lightweight concretes. The ensuing parametric analysis served the purpose of evaluating the impact of the lightweight concrete’s density and other major design parameters. The main findings are the following:
  • The methodology presented here has only been applied to reinforced concrete beams supporting the floor slabs. As has been shown in the discussion, the use of LWC seems to help reducing the longitudinal reinforcement requirements in the beams (with values between 4% and 5% with density class 1.8).
  • This trend would also likely be observed in the ULS design of the bending strength of the beam-and-block floor slabs. However, it has been neglected in the present work. Therefore, the reduction in the global CO2 emissions when using LWC in beams and floor slabs would be potentially more significant than the results presented here, which are thus conservative.
  • According to the available mix design methods, lightweight concretes with dry oven densities below 1600 kg/m3 were not deemed to be feasible while simultaneously trying to control the cement content. Moreover, this is in agreement with most experimental studies on LWC for structural purposes.
  • It has been demonstrated that lightweight concretes help saving the mass of reinforcing steel required by concrete beams in a number of situations, with both downstand beams and flat beams. Nevertheless, the cement consumption is of great concern. That said, lightweight aggregate concretes with a dry oven density of 2000 kg/m3 would not have a negative impact on sustainability in the most conventional design scenarios.
  • The overall self-weight of the horizontal levels in buildings could be reduced by 4% to 6% if lightweight concretes of density class 2 or 1.8 were used, with an immediate positive effect on the sizing of concrete columns and foundations.
  • LWC of class 1.6 or lighter would demand a greater cement consumption and even longitudinal steel reinforcement in some situations. Therefore, it is not clear whether they have a more negative impact on carbon dioxide emissions and sustainability without resorting to a global analysis of the whole structural frame, including its foundations and seismic performance.
  • In spite of the stricter requirements associated with the rotation capacity of reinforced lightweight concrete beams, as formulated by the European standard, the ductility of members subjected to bending was not compromised. The parametric analysis only detected some unfeasible or uttermost impossible design cases with flat beams or wide-shallow beams designed with a redistribution factor δ below 0.85. Furthermore, if the width-to-effective depth ratio of a wide-shallow beam lies within the recommended values and if the beam slenderness (span length-to-effective depth) remains below 22, lightweight concrete hardly affects the equivalent CO2 emissions on account of cement and steel, regardless of the occupancy category.
  • Overall, compliance with SLS was not affected. Material stresses and cracking did not show significant problems. The limit on beam slenderness, to comply with vertical deflection without explicit calculations was marginally stricter than with conventional concrete. Despite this, the parametric analysis determined that class 2.0 LWC would allow for slightly more robust beams to be obtained in SLS when moderate values of moment redistribution had been previously used for the ULS design of reinforcements.

Author Contributions

Conceptualization, I.V. and F.B.V.; methodology, I.V. and J.P.-B.; validation, F.B.V. and A.J.T.-A.; formal analysis, F.B.V. and A.J.T.-A.; investigation, I.V. and A.J.T.-A.; writing—original draft preparation, I.V. and J.P.-B.; writing—review and editing, F.B.V.; visualization, A.J.T.-A.; supervision, A.J.T.-A. All authors have read and agreed to the published version of the manuscript.

Funding

This research received no external funding.

Institutional Review Board Statement

Not applicable.

Informed Consent Statement

Not applicable.

Data Availability Statement

The data presented in this study are available in Varona, F.B.; Tenza-Abril, A.J.; Pereiro-Barceló, J.; Vives, Ismael (2021), “Parametric analysis of carbon dioxide emissions associated with RC beams made with lightweight concrete under different design scenarios”, Mendeley Data, V1, doi:10.17632/gsxbch7wc3.1.

Acknowledgments

Authors acknowledge the support given by Research Groups GRESMES and TECMATER, of the Civil Engineering Department of the University of Alicante.

Conflicts of Interest

The authors declare no conflict of interest.

References

  1. Chen, Y.X.; Wu, F.; Yu, Q.; Brouwers, H.J.H. Bio-Based Ultra-Lightweight Concrete Applying Miscanthus Fibers: Acoustic Absorption and Thermal Insulation. Cem. Concr. Compos. 2020, 114, 103829. [Google Scholar] [CrossRef]
  2. European Committee for Standarisation. Eurocode 2: Design of Concrete Structures - Part 1-1: General Rules and Rules for Buildings; European Union: Brussels, Belgium, 2010; p. 225. [Google Scholar]
  3. International Federation for Structural Concrete (fib). Fib Model Code for Concrete Structures 2010; Ernst & Sohn: Berlin, Germany, 2013; ISBN 978-3-433-03061-5. [Google Scholar]
  4. Kim, C.H.; Jang, H.S. Concrete Shear Strength of Normal and Lightweight Concrete Beams Reinforced with FRP Bars. J. Compos. Constr. 2014, 18, 04013038. [Google Scholar] [CrossRef]
  5. Charif, A.; Shannag, M.J.; Dghaither, S. Ductility of Reinforced Lightweight Concrete Beams and Columns. Lat. Am. J. Solids Struct. 2014, 11, 1251–1274. [Google Scholar] [CrossRef] [Green Version]
  6. Bernardo, L.F.A.; Nepomuceno, M.C.S.; Pinto, H.A.S. Flexural Ductility of Lightweight-Aggregate Concrete Beams. J. Civ. Eng. Manag. 2016, 22, 622–633. [Google Scholar] [CrossRef]
  7. Bogas, J.A.; Ferrer, B.; Pontes, J.; Real, S. Biphasic Compressive Behavior of Structural Lightweight Concrete. ACI Mater. J. 2017, 114, 49–56. [Google Scholar] [CrossRef]
  8. Ali, A.; Iqbal, S.; Holschemacher, K.; Bier, T.A. Comparison of Flexural Performance of Lightweight Fibre-Reinforced Concrete and Normalweight Fibre-Reinforced Concrete. Period. Polytech. Civ. Eng. 2017, 61, 498–504. [Google Scholar] [CrossRef] [Green Version]
  9. Mohammed, B.S.; Foo, W.L.; Abdullahi, M. Flexural Strength of Palm Oil Clinker Concrete Beams. Mater. Des. 2014, 53, 325–331. [Google Scholar] [CrossRef]
  10. Tang, C.-W. Effect of Presoaking Degree of Lightweight Aggregate on the Properties of Lightweight Aggregate Concrete. Comput. Concr. 2017, 19, 69–78. [Google Scholar] [CrossRef]
  11. Mastali, M.; Kinnunen, P.; Isomoisio, H.; Karhu, M.; Illikainen, M. Mechanical and Acoustic Properties of Fiber-Reinforced Alkali-Activated Slag Foam Concretes Containing Lightweight Structural Aggregates. Constr. Build. Mater. 2018, 187, 371–381. [Google Scholar] [CrossRef]
  12. Real, S.; Bogas, J.A.; Gomes, M.d.G.; Ferrer, B. Thermal Conductivity of Structural Lightweight Aggregate Concrete. Mag. Concr. Res. 2016, 68, 798–808. [Google Scholar] [CrossRef]
  13. Real, S.; Gomes, M.G.; Moret Rodrigues, A.; Bogas, J.A. Contribution of Structural Lightweight Aggregate Concrete to the Reduction of Thermal Bridging Effect in Buildings. Constr. Build. Mater. 2016, 121, 460–470. [Google Scholar] [CrossRef]
  14. Lee, Y.H.; Chua, N.; Amran, M.; Yong Lee, Y.; Hong Kueh, A.B.; Fediuk, R.; Vatin, N.; Vasilev, Y. Thermal Performance of Structural Lightweight Concrete Composites for Potential Energy Saving. Crystals 2021, 11, 461. [Google Scholar] [CrossRef]
  15. Makul, N.; Fediuk, R.; Amran, M.; Zeyad, A.M.; Murali, G.; Vatin, N.; Klyuev, S.; Ozbakkaloglu, T.; Vasilev, Y. Use of Recycled Concrete Aggregates in Production of Green Cement-Based Concrete Composites: A Review. Crystals 2021, 11, 232. [Google Scholar] [CrossRef]
  16. Al-Ani, I.A.; Hamidon, W.; Al-Ansari, N.; Mohtar, W.H. Development of Lightweight Concrete Using Industrial Waste Palm Oil Clinker. J. Civ. Eng. Archit. 2020, 14, 293–307. [Google Scholar] [CrossRef]
  17. Mo, K.H.; Visintin, P.; Alengaram, U.J.; Jumaat, M.Z. Prediction of the Structural Behaviour of Oil Palm Shell Lightweight Concrete Beams. Constr. Build. Mater. 2016, 102, 722–732. [Google Scholar] [CrossRef]
  18. Li, J.J.; Niu, J.G.; Wan, C.J.; Jin, B.; Yin, Y.L. Investigation on Mechanical Properties and Microstructure of High Performance Polypropylene Fiber Reinforced Lightweight Aggregate Concrete. Constr. Build. Mater. 2016, 118, 27–35. [Google Scholar] [CrossRef]
  19. Bashar, I.I.; Alengaram, U.J.; Jumaat, M.Z.; Islam, A.; Santhi, H.; Sharmin, A. Engineering Properties and Fracture Behaviour of High Volume Palm Oil Fuel Ash Based Fibre Reinforced Geopolymer Concrete. Constr. Build. Mater. 2016, 111, 286–297. [Google Scholar] [CrossRef]
  20. Agwa, I.S.; Omar, O.M.; Tayeh, B.A.; Abdelsalam, B.A. Effects of Using Rice Straw and Cotton Stalk Ashes on the Properties of Lightweight Self-Compacting Concrete. Constr. Build. Mater. 2020, 235, 117541. [Google Scholar] [CrossRef]
  21. Congqi, F.; Meiying, Y. Seismic Performance of a Reinforced Lightweight Aggregate Concrete Frame. Key Eng. Mater. 2007, 340–341, 1139–1144. [Google Scholar]
  22. Liu, X.; Wu, T.; Wei, H. Seismic Behavior of Lightweight Aggregate Concrete Frame. J. Vibroeng. 2017, 19, 4410–4422. [Google Scholar] [CrossRef]
  23. Chandra, S.; Berntsson, L. Fire Resistance of Lightweight Aggregate Concrete. In Lightweight Aggregate Concrete; Elsevier: Amsterdam, The Netherlands, 2002; pp. 291–319. [Google Scholar]
  24. Suntharalingam, T.; Gatheeshgar, P.; Upasiri, I.; Poologanathan, K.; Nagaratnam, B.; Rajanayagam, H.; Navaratnam, S. Numerical Study of Fire and Energy Performance of Innovative Light-Weight 3D Printed Concrete Wall Configurations in Modular Building System. Sustainability 2021, 13, 2314. [Google Scholar] [CrossRef]
  25. Kockal, N.U.; Ozturan, T. Strength and Elastic Properties of Structural Lightweight Concretes. Mater. Des. 2011, 32, 2396–2403. [Google Scholar] [CrossRef]
  26. Im, C.-R.; Yang, K.-H.; Kim, S.; Mun, J.-H. Flexural Performance of Lightweight Aggregate Concrete Columns. Eng. Struct. 2022, 251, 113545. [Google Scholar] [CrossRef]
  27. Hendrix, S.E.; Kowalsky, M.J. Seismic Shear Behavior of Lightweight Aggregate Concrete Square Columns. ACI Struct. J. 2010, 107, 680–688. [Google Scholar]
  28. Kowalsky, M.J.; Priestley, M.J.N.; Seible, F. Shear and Flexural Behavior of Lightweight Concrete Bridge Columns in Seismic Regions. ACI Struct. J. 1999, 96, 136–148. [Google Scholar]
  29. Wu, T.; Wei, H.; Zhang, Y.; Liu, X. Axial Compressive Behavior of Lightweight Aggregate Concrete Columns Confined with Transverse Steel Reinforcement. Adv. Mech. Eng. 2018, 10, 168781401876663. [Google Scholar] [CrossRef] [Green Version]
  30. Ahamad, S.H.; Xie, Y.; Yu, T. Shear Strength of Reinforced Lightweight Concrete Beams of Normal and High Strength Concrete. Mag. Concr. Res. 1994, 46, 57–66. [Google Scholar] [CrossRef]
  31. Deifalla, A.; Awad, A.; Seleem, H.; Abdelrahman, A. Investigating the Behavior of Lightweight Foamed Concrete T-Beams under Torsion, Shear, and Flexure. Eng. Struct. 2020, 219, 110741. [Google Scholar] [CrossRef]
  32. Walraven, J.; Belletti, B.; Esposito, R. Shear Capacity of Normal, Lightweight, and High-Strength Concrete Beams According to Model Code 2010. I: Experimental Results versus Analytical Model Results. J.Struct. Eng. 2013, 139, 1593–1599. [Google Scholar] [CrossRef]
  33. Zhang, Y.; Aslani, F. Compressive Strength Prediction Models of Lightweight Aggregate Concretes Using Ultrasonic Pulse Velocity. Constr. Build. Mater. 2021, 292, 123419. [Google Scholar] [CrossRef]
  34. Rashad, A.M. Lightweight Expanded Clay Aggregate as a Building Material – An Overview. Constr. Build. Mater. 2018, 170, 757–775. [Google Scholar] [CrossRef]
  35. Pelisser, F.; Barcelos, A.; Santos, D.; Peterson, M.; Bernardin, A.M. Lightweight Concrete Production with Low Portland Cement Consumption. J. Clean. Prod. 2012, 23, 68–74. [Google Scholar] [CrossRef]
  36. European Committee for Standarisation. Eurocode 1. Actions on Structures - Part 1-1: General Actions - Densities, Self Weight, Imposed Loads for Buildings; European Union: Brussels, Belgium, 2009; p. 44. [Google Scholar]
  37. Ministerio de Fomento, Gobierno de España. Instrucción de Hormigón Estructural (EHE-08); Centro de Publicadiones-Secretaria General Técnica-Ministerio de Fomento: Madrid, Spain, 2011; ISBN 8449808995.
  38. Ekdahl, A. Climate Change and the Production of Iron and Steel: An Industry View. Available online: https://www.worldsteel.org/en/dam/jcr:1b7492b1-15f5-401a-88f1-7ae488e0553f/SteelTalks%2520May%25202021_Asa%2520Ekdahl.pdf (accessed on 10 December 2021).
  39. Klee, H. Cement Industry Energy and CO2 Performance: Getting the Numbers Right. Available online: https://docs.wbcsd.org/2016/12/GNR.pdf (accessed on 10 December 2021).
  40. Bogas, J.A.; Gomes, A. A Simple Mix Design Method for Structural Lightweight Aggregate Concrete. Mater. Struct. 2013, 46, 1919–1932. [Google Scholar] [CrossRef]
  41. Fernández-Canovas, M. Hormigón, 10th ed.; Ibergarceta Publicaciones S.L.: Madrid, Spain, 2013. [Google Scholar]
  42. Conforti, A.; Minelli, F.; Plizzari, G.A. Wide-Shallow Beams with and without Steel Fibres: A Peculiar Behaviour in Shear and Flexure. Compos. Part B Eng. 2013, 51, 282–290. [Google Scholar] [CrossRef]
  43. Özbek, E.; Aykaç, B.; Bocek, M.; Yılmaz, M.C.; Mohammed, A.B.K.; Er, Ş.B.; Aykaç, S. Behavior and Strength of Hidden Rc Beams Embedded in Slabs. J. Build. Eng. 2020, 29, 101130. [Google Scholar] [CrossRef]
  44. Conforti, A.; Minelli, F.; Tinini, A.; Plizzari, G.A. Influence of Polypropylene Fibre Reinforcement and Width-to-Effective Depth Ratio in Wide-Shallow Beams. Eng. Struct. 2015, 88, 12–21. [Google Scholar] [CrossRef]
  45. Kim, M.S.; Kang, J.; Lee, Y.H. Improved Shear Strength Equation for Concrete Wide Beams. Appl. Sci. 2019, 9, 4513. [Google Scholar] [CrossRef] [Green Version]
  46. Beeby, A.W.; Narayanan, R.S. Designers’ Guide to EN1992-1-1 and EN1992-1-2. Eurocode 2: Design of Concrete Structures.; Thomas Telford Ltd.: London, UK, 2010; ISBN 978-0-7277-3105-0. [Google Scholar]
Figure 1. Parabola-rectangle diagram for normal strength lightweight aggregate concrete.
Sustainability 13 13893 g001
Figure 2. Rectangular reinforced lightweight aggregate concrete cross-section subjected to pure bending.
Sustainability 13 13893 g002
Figure 3. Bi-linear stress–strain distribution of reinforcing steel for ULS design: (a) without plastic hardening nor tensile strain limitation; (b) with plastic hardening and tensile strain limitation.
Sustainability 13 13893 g003
Figure 4. Two-span reinforced concrete beam.
Sustainability 13 13893 g004
Figure 5. Load combinations and bending moment diagrams in the LWC beam made with density class 1.8, with linear elastic analysis and δ = 1.
Sustainability 13 13893 g005
Figure 6. ULS envelopes of bending moments in the LWC beam made density class 1.8, when δ = 1 and when δ = 0.8.
Sustainability 13 13893 g006
Figure 7. Total ULS design load upon the three beam supports, with qlive = 2 kN/m2, TW = 4.5 m and d′ = 4 cm (regardless of concrete strength, cement type and redistribution factor δ): (a) downstand beam with dimensions b × h = 25 × 35 cm; (b) b × h = 35 × 55 cm.
Sustainability 13 13893 g007
Figure 8. Total mass of longitudinal steel reinforcements along the continuous beam, with qlive = 2 kN/m2, TW = 4.5 m, d′ = 4 cm and fck (flck) = 25 MPa (regardless of cement type): (ad) with δ = 1; (e,f) with δ = 0.8; (a) downstand beam with dimensions b × h = 25 × 35 cm; (b,c,e) b × h = 30 × 45 cm; (d,f) b × h = 35 × 55 cm.
Sustainability 13 13893 g008aSustainability 13 13893 g008b
Figure 9. Total mass of longitudinal steel reinforcements along the continuous beam, with qlive = 2 kN/m2, TW = 4.5 m, d′ = 4 cm and fck (flck) = 25 MPa (regardless of cement type): (a) beam with b × h = 25 × 35 cm and δ = 0.8; (b) b × h = 35 × 55 cm and δ = 0.7.
Sustainability 13 13893 g009
Figure 10. Estimation of CO2 emission on account of cement and steel consumption by 25 × 35 cm (b × h) beams with qlive = 2 kN/m2, TW = 4.5 m, d′ = 4 cm: (a,c) CEM 42.5; (b,d) CEM 52.5; (a,b) fck = flck = 20 MPa; (c,d) fck = flck = 35 MPa.
Sustainability 13 13893 g010
Figure 11. Estimation of CO2 emission on account of cement and steel consumption by 35 × 55 cm (b × h) beams with qlive = 2 kN/m2, TW = 4.5 m, d′ = 4 cm, fck = flck = 35 MPa: (a) 35 MPa concrete made with CEM 42.5; (b) 35 MPa concrete made with CEM 52.5.
Sustainability 13 13893 g011
Figure 12. Estimation of CO2 emission (cement + steel) and mass of reinforcing steel in 30 × 45 cm (b × h) beams made with f(l)ck = 30 MPa concrete (with CEM 42.5). Global analysis with δ = 0.8 and slab tributary width TW = 3.5 m: (a,b) span L = 4.5 m; (c,d) span L = 6.5 m; (a,c) concrete cover d′ = 3.5 cm; (b,d) concrete cover d′ = 5 cm.
Sustainability 13 13893 g012aSustainability 13 13893 g012b
Figure 13. Estimation of CO2 emission (cement + steel) and mass of reinforcing steel in 30 × 45 cm (b × h) beams made with f(l)ck = 30 MPa concrete (with CEM 42.5). Global analysis with δ = 0.8, Concrete cover d′ = 4 cm: (a,b) span L = 4.5 m; (c,d) span L = 6.5 m; (a,c) tributary width TW = 4.5 m; (b,d) tributary width TW = 6 m.
Sustainability 13 13893 g013aSustainability 13 13893 g013b
Figure 14. Reinforcing steel required by flat beams (b = 55 cm) made with f(l)ck = 30 MPa concrete (with CEM 42.5), supporting a TW = 4.5 m, with L = 4.5 m: (a,b) qlive = 2 kN/m2; (c,d) qlive = 4 kN/m2; (a,c) d′ = 3.5 cm; (b,d) d′ = 5 cm.
Sustainability 13 13893 g014aSustainability 13 13893 g014b
Figure 15. Estimated CO2 emissions by flat beams made with f(l)ck = 30 MPa concrete (with CEM 42.5), with d′ = 3.5 cm, supporting a live load qlive = 2 kN/m2 with TW = 4.5 m and designed with δ = 0.85: (a,b) span L = 4-to-5 m; (c,d) L = 5.5-to-7 m; (a,c) cross-sectional width b = 40 cm; (b,d) width b = 70 cm.
Sustainability 13 13893 g015
Figure 16. Estimated CO2 emissions by flat beams made with f(l)ck = 30 MPa concrete (with CEM 42.5), with d′ = 3.5 cm, supporting a live load qlive = 4 kN/m2 with TW = 4.5 m and designed with δ = 0.85: (a,b) span L = 4-to-5 m; (c,d) L = 5.5-to-7 m; (a,c) cross-sectional width b = 40 cm; (b,d) width b = 70 cm.
Sustainability 13 13893 g016aSustainability 13 13893 g016b
Table 1. Numerical integration of the parabola-rectangle diagram for various densities of lightweight aggregate concrete.
Density Class11.21.41.61.82.0
Oven dry density (kg/m3)801–10001001–12001201–14001401–16001601–18001801–2000
η10.670.730.780.840.890.95
εlcu2 (‰)2.352.552.742.933.123.31
λLWC, Equation (5)0.720.740.760.770.790.80
k, Equation (6)0.390.390.400.400.410.41
Table 2. Stress of the longitudinal compression reinforcement (in MPa) as a function of the density class, the redistribution factor and the ratio (d′/d). Tensile stresses have negative values.
Density Class1.01.21.41.61.82.0NWC
d′/d = 0.05δ = 1408435435435435435435
δ = 0.9394430435435435435435
δ = 0.8373407435435435435435
δ = 0.7336368401434435435435
d′/d = 0.1δ = 1345378411435435435435
δ = 0.9318350382414435435435
δ = 0.8276306336366396427435
δ = 0.7200228255282309336363
d′/d = 0.15δ = 1283313344374405435435
δ = 0.9242270299328357386415
δ = 0.8178204230257283309335
δ = 0.76587109130152174195
d′/d = 0.2δ = 1220248276304332360388
δ = 0.9165191217242268294320
δ = 0.880103125147169192214
δ = 0.7−70−54−38−22−51127
Table 3. Influence of the density class on the estimation of loads and reactions transmitted to the supports of the continuous beam under study.
Density ClassNWCClass 1.8Class 1.2
Specific weight of cast “in situ” concrete (kN/m3)2519.513.5
gbeam (kN/m)3.382.631.82
Total vertical ULS load (kN)286.6272.5252.4
Saving (%)N/A4.9%11.9%
Table 4. Longitudinal reinforcements for ULS at the critical sections without redistribution.
Density ClassNWCClass 1.8Class 1.2
MEd at B (m·kN) without redistribution−232.8−221.4−205.0
Mthr,δ=1 (m·kN)±250.2±198.6±173.6
Stress σs2 (MPa)N/A435382
As2,req (mm2)N/A141.6222.7
As1,req (mm2)1561.91487.31347.8
As,total,hogging (mm2)1675.31628.91570.5
MEd,max,sagging (m·kN) without redistribution143.1136.7127.5
As2,req (mm2)N/AN/AN/A
As1,req (mm2)885.0860.9802.5
As,total,sagging (mm2)998.4974.3915.9
Table 5. Longitudinal reinforcements for ULS at the critical sections with δ = 0.8.
Density ClassNWCClass 1.8Class 1.2
MEd at B (m·kN) with redistribution δ = 0.8−186.3−177.1−164.0
Mthr,δ=0.8 (m·kN)±173.4±137.3±118.8
Stress σs2 (MPa)435402311
As2,req (mm2)80.2267.8393.2
As1,req (mm2)1179.41112.71021.8
As,total,hogging (mm2)1292.81380.51415.0
MEd,max,sagging (m·kN) with redistribution δ = 0.8149.0141.7131.2
Stress σs2 (MPa)N/A402311
As2,req (mm2)N/A29.7107.8
As1,req (mm2)925.8892.5817.9
As,total,sagging (mm2)1039.21005.9931.3
Table 6. Longitudinal reinforcements for ULS at the critical sections with δ = 0.7.
Density ClassNWCClass 1.8Class 1.2
MEd at B (m·kN) with redistribution δ = 0.7−163.0−155.0−143.5
Mthr,δ=0.7 (m·kN)±129.7±102.5±88.5
Stress σs2 (MPa)372317234
As2,req (mm2)241.8447.3634.6
As1,req (mm2)1000.6950.7877.3
As,total,hogging (mm2)1242.31398.01511.9
MEd,max,sagging (m·kN) with redistr. δ = 0.7158.5150.7139.6
Stress σs2 (MPa)372317234
As2,req (mm2)209.0410.7588.8
As1,req (mm2)972.5924.0852.6
As,total,sagging (mm2)1181.51334.81441.4
Table 7. Estimation of the steel used as longitudinal reinforcement (in kg) in the 6.5 m span (values within brackets are reductions or increases with respect to the conventional NWC without redistribution).
Density ClassNWCClass 1.8Class 1.2
δ = 159.658.1 (−2.5%)55.1 (−7.5%)
δ = 0.856.356.1 (−5.8%)53.7 (−9.9%)
δ = 0.761.1 (+2.5%)68.9 (+15.7%)74.4 (+25%)
Table 8. Cement content for LWC calculated using the method by Bogas and Gomes [40].
NWC/LWC Strength fck/flck20 MPa25 MPa30 MPa35 MPa
NWCCEM 42.5255283312340
CEM 52.5234259283308
Density class 2.0CEM 42.5266290314337
CEM 52.5243266289313
Density class 1.8CEM 42.5277297316334
CEM 52.5251273295317
Density class 1.6CEM 42.5277297316334
CEM 52.5251273295317
Table 9. Mass of reinforcing steel required by 25 MPa strength NWC or LWC beams for qlive = 2 kN/m2 and TW = 4.5 m.
Span Length L = 4.5 mL = 6.5 m
Redistribution factor δ = 1δ = 0.8δ = 1δ = 0.8
b × h = 25 × 35 cmNWC58 kg56 kg220 kg240 kg
LWC 1.857 kg57 kg222 kg255 kg
b × h = 35 × 55 cmNWC42 kg41 kg113 kg108 kg
LWC 1.840 kg39 kg107 kg103 kg
Table 10. Steel-to-cement consumption in NWC and LWC beams made with f(l)ck = 25 MPa concrete and CEM 42.5 (linear elastic analysis, δ = 1), with qlive = 2 kN/m2, TW = 4.5 cm, d′ = 4 cm.
Span LengthL = 4.5 mL = 5.5 mL = 6.5 m
b × h = 25 × 35 cmNWC58 ÷ 945
(1 to ≈ 16)
117 ÷ 1155
(1 to ≈10)
220 ÷ 1365
(1 to ≈6)
LWC 1.857 ÷ 992
(1 to ≈ 17)
116 ÷ 1212
(1 to ≈10)
222 ÷ 1433
(1 to ≈6)
b × h = 35 × 55 cmNWC42 ÷ 1195
(1 to ≈28)
71 ÷ 1461
(1 to ≈21)
113 ÷ 1727
(1 to ≈15)
LWC 1.840 ÷ 1255
(1 to ≈28)
68 ÷ 1533
(1 to ≈23)
107 ÷ 1812
(1 to ≈17)
Table 11. Cement-to-steel consumption (by mass) in 30 × 45 cm NWC and LWC beams (with d′ = 4 cm) made with f(l)ck = 30 MPa concrete and CEM 42.5 for floor slabs with 3.5 m of tributary width. Global analysis with redistribution factor δ = 0.8.
qlive (kN/m2)2345
NWC20.618.516.615
LWC 2.021.31916.915
LWC 1.821.919.517.215.3
LWC 1.622.319.817.515.4
Table 12. Cement-to-steel consumption (by mass) in 30 × 45 cm NWC and LWC beams (with d′ = 4 cm) made with f(l)ck = 30 MPa concrete and CEM 42.5 for floor slabs with 5 m of tributary width. Global analysis with redistribution factor δ = 0.8.
qlive (kN/m2)2345
NWC19.617.315.213.3
LWC 2.02017.31513.2
LWC 1.820.517.615.213.4
LWC 1.620.817.815.313.4
Table 13. Cement-to-steel consumption (by mass) in 30 × 45 cm NWC and LWC beams (with d′ = 4 cm) made with f(l)ck = 30 MPa concrete and CEM 42.5 for floor slabs with 6 m of tributary width. Global analysis with redistribution factor δ = 0.8.
qlive (kN/m2)2345
NWC18.916.314.312.5
LWC 2.01916.414.212.5
LWC 1.819.416.614.412.6
LWC 1.619.616.814.512.6
Table 14. SLS of vertical deflections with 25 × 35 cm NWC and LWC beams (with d′ = 4 cm) made with f(l)ck = 25 MPa concrete, for floor slabs with 4.5 m of tributary width and occupancy load qlive = 5 kN/m2. Previous ULS design made with redistribution factor δ = 1. Values over 1 correspond to non-compliant designs.
Span Length L (m)44.555.566.57
NWC0.600.700.770.850.931.01-
LWC 2.00.610.690.770.850.93--
LWC 1.80.630.710.800.88---
LWC 1.60.660.740.820.89---
Table 15. SLS of vertical deflections with 30 × 45 cm NWC and LWC beams (with d′ = 4 cm) made with f(l)ck = 25 MPa concrete, for floor slabs with 4.5 m of tributary width and occupancy load qlive = 5 kN/m2. Factor δ is only used for ULS design. Values over 1 correspond to non-compliant designs.
Factor δ = 1Factor δ = 0.85Factor δ = 0.7
Span Length L (m)6.576.576.57
NWC0.760.820.740.800.6-
LWC 2.00.750.820.720.78--
LWC 1.80.780.850.740.80--
LWC 1.60.810.880.760.81--
Publisher’s Note: MDPI stays neutral with regard to jurisdictional claims in published maps and institutional affiliations.

