1. Introduction
DC appliances are receiving increasing attention due to their energy efficiency [
1,
2]. However, DC appliances are connected to the AC supply through power electronic converters and these convertors introduce numerous nonlinearity and conversion losses into the system. On the other hand, microgrid technology is developed to efficiently manage the power supply from renewable energy sources and energy storage systems [
3,
4]. Current research is focused on the optimization of distributed generation systems connected to microgrids to meet the load demand with reduced electricity costs [
5]. Microgrid technology has been deployed to perform demand-side management to reduce the Peak-to-Average Ratio and increase financial savings to satisfy consumers [
6]. In spite of its several advantageous features, the microgrids consist of several power electronic converters; the conversion losses become a crucial drawback. In [
7], a new controller for the string stability of the microgrid inverter has been proposed to improve its performance. The authors of one study [
8] proposed a solid-state DC transformer to reduce the number of switching devices on the DC link; consequently, device losses have reduced. The interoperability and extensibility features of distributed energy sources are enhanced by incorporating advanced Smart Microgrid energy management techniques [
9]. However, a serious issue arises when topologies are constructed with converters working at low efficiency during power conversion [
10,
11].
Microgrid technology used for distributed generation systems often performs power conversion at low efficiency and suffers huge conversion losses cumulatively [
12,
13]. These losses cannot be quantified because the efficiency of the converters is highly nonlinear [
14] and their efficiency fluctuates with the variation in load as well as operating temperature. The power conversion between AC and DC buses is efficient only if the power available for transfer is equivalent to its rating. However, in real time, the power available for conversion is not always concordant with the power rating and at under-loaded conditions; inefficient conversion occurs, which results in increased power loss across the converters. Similarly, when the DC bus requires less power, invoking a converter to draw power from the AC bus might be inefficient [
15]. Ignoring this power conversion results in an inefficient process. Although individual power convertor loss is less, when considered on a large scale, cumulative losses reach a prodigious value. In this proposed study, the phenomenon of inefficient power conversion due to the underperformance of convertors at under-loaded conditions is referred to as inefficient power. Generally, research has not focused on the elimination of inefficient power conversion processes. The authors of this study have already carried out extensive research in this domain and accomplished various research objectives, such as the mitigation of power conversion loss, as in [
16], and cost minimization, as in [
17]. In this study, an exclusive conversion loss reduction and cost minimization strategy is explored and designed based on a novel control algorithm, named Inefficient Power Conversion Elimination Algorithm (IPCEA), using a battery energy storage system (BESS).
The study proposes the design of a novel switching strategy to incorporate a hybrid microgrid in the distribution system effectively. It comprises the following conventional electrical installation, with an intelligent microgrid distribution system:
- i.
To implement a renewable-based IPCEA considering the availability of Net Transferable Power (NTP) at DC bus and the rate of converter loss to minimize low-efficiency power conversion.
- ii.
To effectively manage battery energy within the DC side of the microgrid to minimize the charge cycle and improve its performance.
- iii.
To decrease the stress on the utility grid by reducing the rate of power exchange.
2. An Overview of the Conversion Losses in Various Distribution System Components
The advancement in semiconductor technology underpins the invention of a variety of energy-efficient equipment. Although these devices are energy-efficient, they distort the current profile and exhibit conversion loss in the system to which they are connected. Consequently, the increased usage of battery backup, consisting of different varieties of converters, further questions the current characteristics as well as power quality standards. Globally, several countries promote energy storage systems through subsidies to help increase storage potential. Consequently, the converter used for the battery backup system also causes several issues, among which conversion loss is one of the major concerns that requires significant focus.
2.1. Influence of Transformer Performance
The efficiency of a transformer is greater than 90% and remains constant when it is loaded to more than 20% of its rating [
18]. The transformer exhibits poor efficiency during under-loaded conditions because of constant iron loss, and the efficiency is reduced due to an increase in the copper loss at overload conditions [
19,
20]. Further, the reactive current is drawn under light load conditions and leads to a reactive power increase. The efficiency expression of the distribution transformer is furnished below.
where
2.2. Impact of Inverter Losses
An inverter used in a domestic distribution system operates at a maximum efficiency of approximately 85% when it is loaded above 75% of its rating. The system features low efficiency in under-loaded conditions and it can even decrease to 50% when it is lightly loaded [
21,
22]. In addition, frequent conversion at under-loaded conditions results in sizeable power losses. The inverter loss accounts for switching and conduction losses. The inverter losses are calculated using the following expressions:
The IGBT comprises an IGBT switch with anti-parallel diode. Hence, the total loss in the switch is expressed as
where
The loss in the IGBT switch is due to conduction loss and switching loss and it is expressed as
where
The conduction loss is derived from the voltage across the collector and emitter terminals of the IGBT switch and current between its terminals. It is expressed as
where
The switching loss occurs when the switch is turned ON and OFF. It increases in line with increases in the switching frequency. It is expressed as
where
To understand the actual losses, the efficiency characteristics of a real-time inverter were obtained through experiments. The specification of the inverter is summarized in
Appendix A. The performance characteristics of the inverter are depicted in
Figure 1. The performance of the inverter was obtained from the characteristic curve in this study. The inverter shows an efficiency of 85% during full load condition and it drops drastically to 50% when it is under-loaded. Similar work has been discussed in [
23].
2.3. Influence of BESS
The battery efficiency is generally 85%, and the 15% shortfall is due to the losses in the charging and discharging process [
24,
25]. The efficiency further drops if the charges are stored for a long duration, where the self-discharge occurs due to internal resistance.
where
Rint—Internal resistance
VNL—No load Voltage
VFL—Full load voltage
RL—Load resistance
The actual discharge time is given as
where
Energy Efficiency is given as
where
When the battery is charged from the utility, the power flows through the transformer, converters, and respective filters. As a result, the performance of all the equipment connected to the power supply line exerts an influence on the performance of the battery storage system. Hence, the capacity of the battery deteriorates. The battery capacity can be expressed as
where
CB—Required capacity of the battery bank
LD—Load demand
A—Autonomy days
PD—Depth of discharge of the selected battery
ηtrs—Transformer efficiency
ηinv—Efficiency of the inverter
ηcc—Efficiency of the charge controller
ED—Estimated Energy demand
3. Inefficient Power Conversion Scenario Prevailing in the Distribution System
Theoretically, the maximum efficiency of the battery is claimed as 85% in previous research, but in the actual battery, the charging efficiency is determined by the power supply strategy. In many scenarios, a greater amount of power is lost in the conversion processes than expected. In this context, inefficient power conversion is one of the strategies in which the discharge of battery energy occurs in the most inefficient way. Various power distribution schemes and associated conversion losses are discussed in the following subsection.
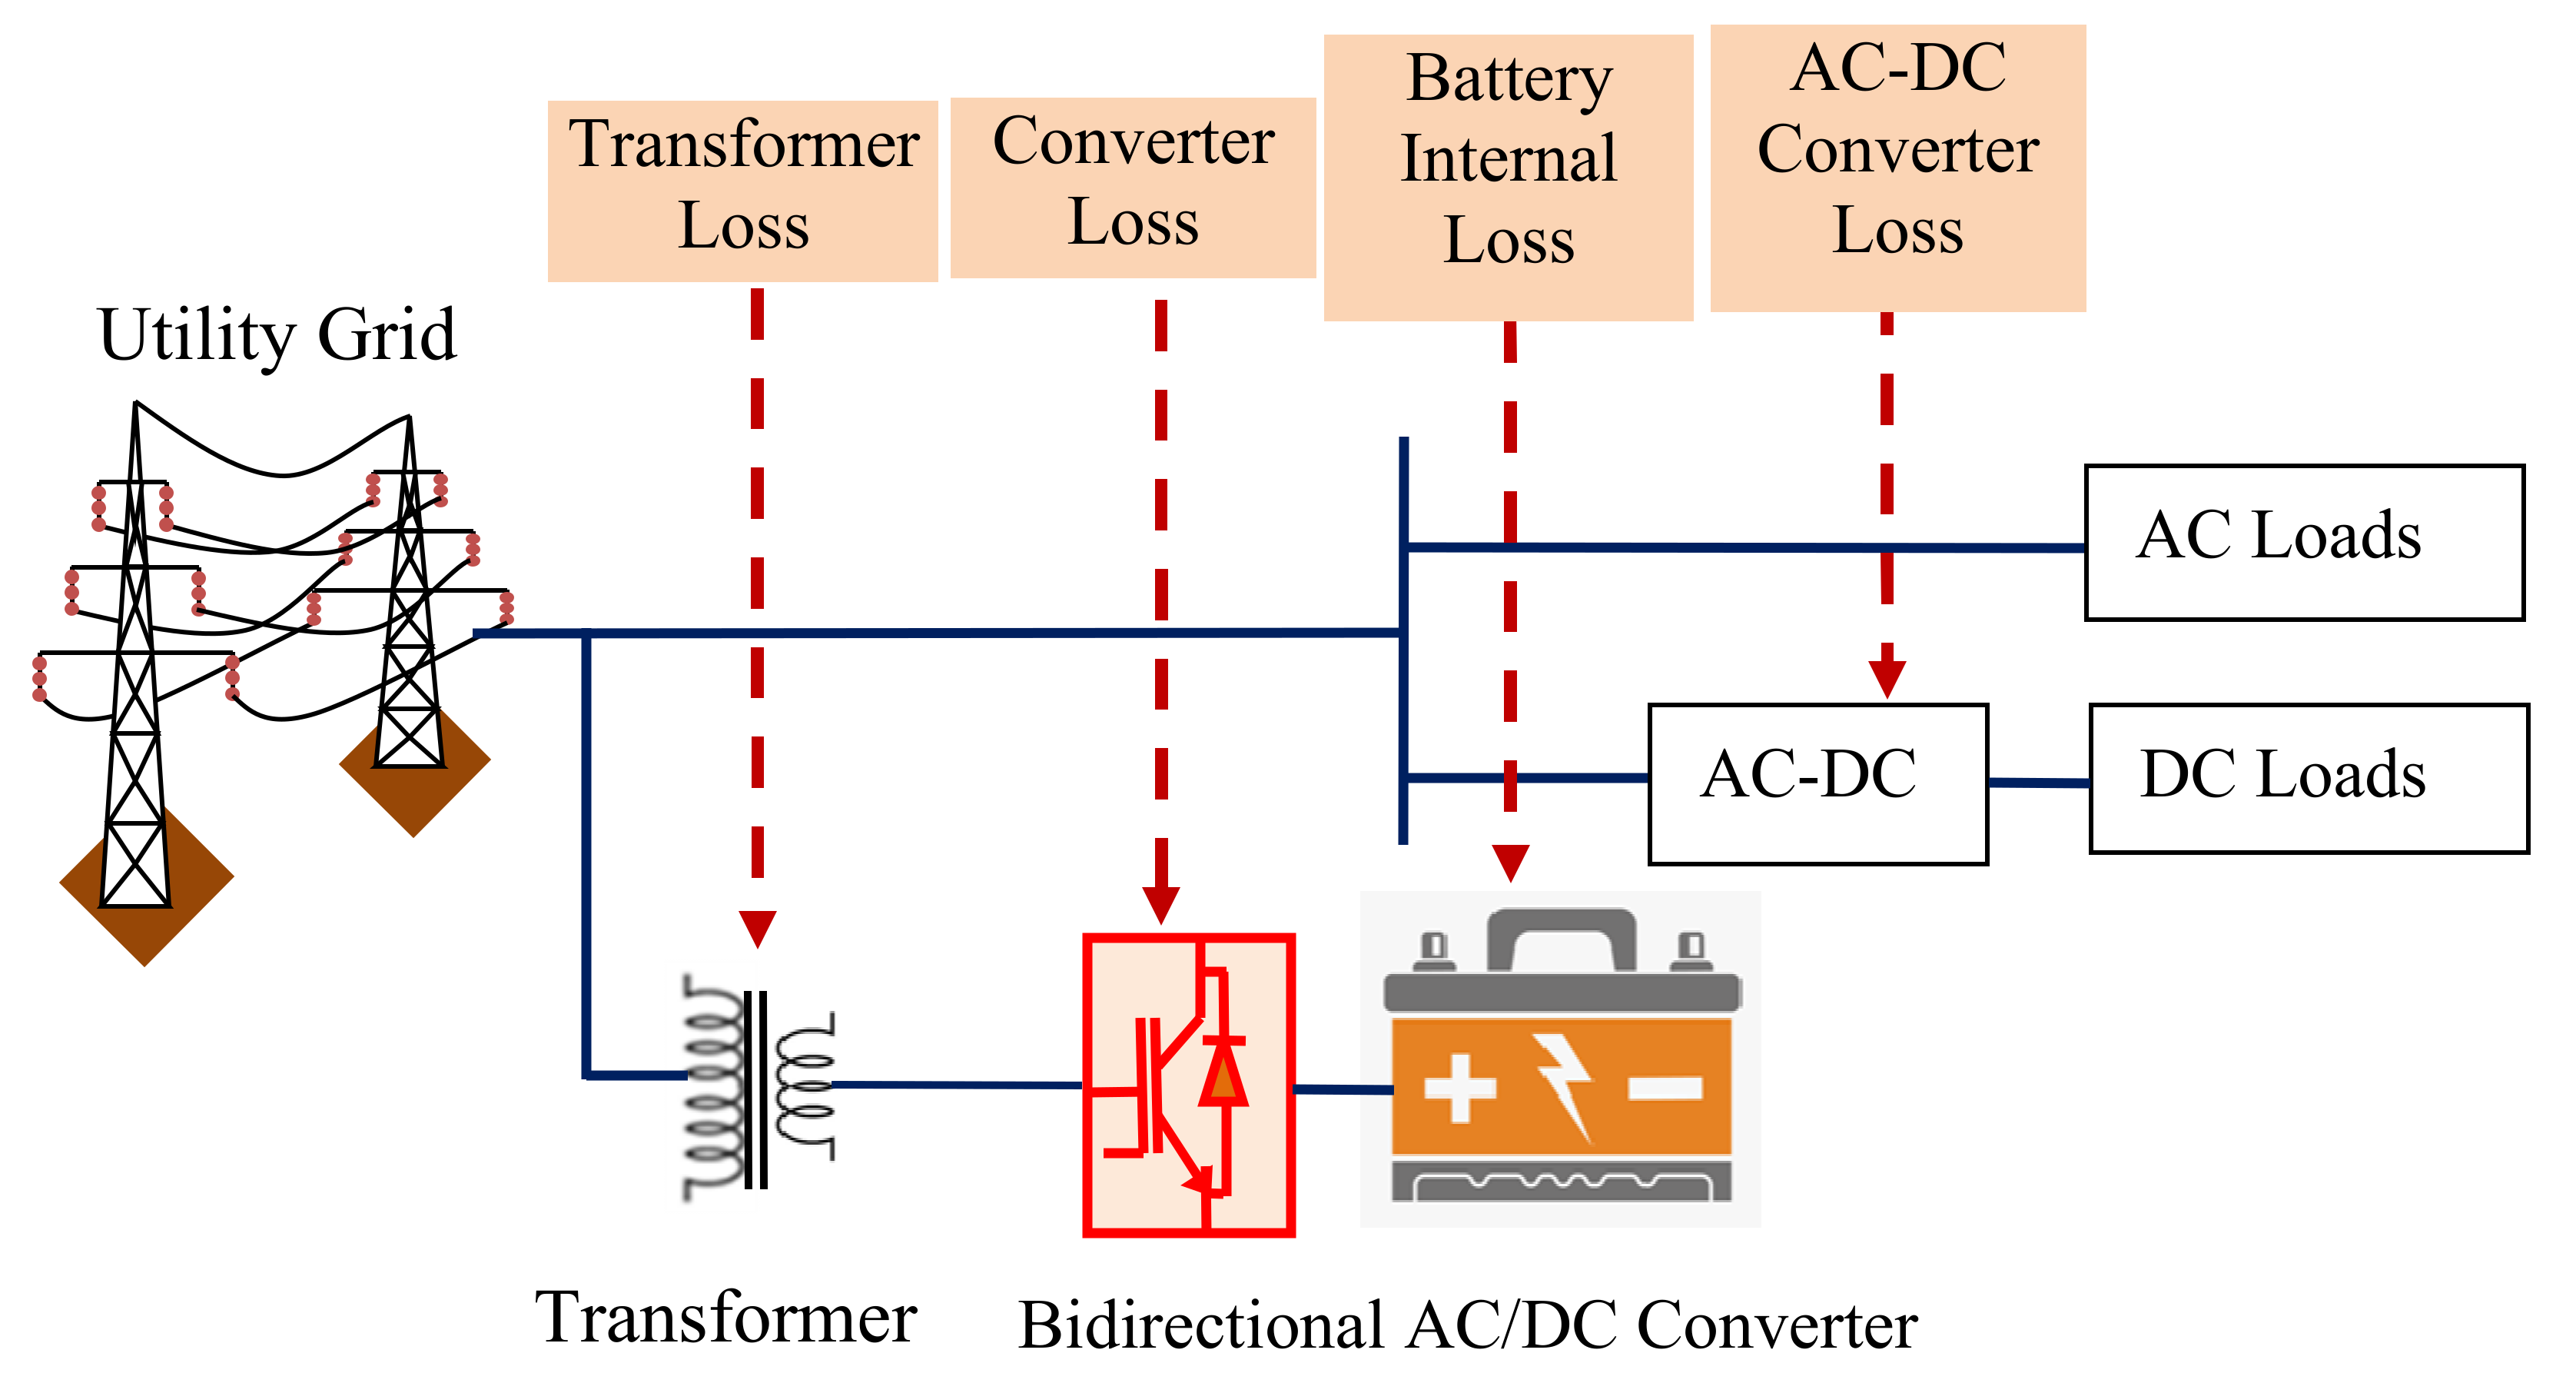
3.1. Scheme 1: Battery Storage Systems Used as a Backup
Generally, batteries are used as a power backup component in residential premises, as shown in
Figure 2. The system comprises a bidirectional converter, a transformer, and a battery, whose power rating depends on the backup duration and load requirement. This set of equipment exhibits considerable losses. These losses are higher if the system is under-loaded.
The transformer loss is expressed as
where
Pi = Core loss
Pc = Copper loss
The losses across the inverter are expressed as
where
Pinv,loss = Inverter loss
PAC.PT = Power transferred to AC loads through inverter
ηinv = Inverter efficiency
The battery internal loss is expressed as
where
The rectifier loss is expressed as
where
PRec,loss = Rectifier loss
PDC.PT = Power transferred through rectifier
ηrec = Rectifier efficiency
The DC loads in conventional distribution systems are connected to AC terminals. The power is stepped down using transformers embedded in the appliances and converted into DC by the rectifier. Hence, feeding DC loads include the transformer loss and rectifier loss. This is expressed as follows.
where
PRec,loss = Inverter loss
PApp.trs,loss = Appliances transformer loss
The battery power is utilized by converting to AC using an inverter; hence, the battery undergoes several loss functions before being utilized. This is expressed as
To utilize the battery backup during a power outage, the inverter loss and battery internal loss need to be met before feeding the AC. Further, to meet the DC demand, the rectifier loss should also be fed.
3.2. Scheme 2: Grid-Tied Solar PV Scheme
Figure 3 presents a grid-tied rooftop PV system. The battery backup for such a system is shown separately, with a particular inverter setup. In this scheme, two converters are used, one for solar integration and the other for battery setup. Hence, the conversion losses are also doubled in this scheme.
In this scheme, the PV power is inverted and stepped up to a voltage to match the utility grid voltage. Hence, the PV power needs to meet both the inverter loss and the transformer loss before integrating with the grid. The power injected into the grid in this direct grid-tied rooftop Solar PV scheme feed is expressed as follows.
3.3. Scheme 3: Solar PV Off-Grid Mode
In this scheme, the solar power is stored in the battery using a Maximum Power Point charge controller and then it is supplied to the AC busbar, where the loads are connected, using an inverter and a transformer; the schematic representation of the system is shown in
Figure 4. The conversion losses, in this case, are lower when compared to the direct grid-tied scheme. Besides, during lower load requirements or under no-load conditions, the solar power, which is generated in abundance, cannot be accommodated and is wasted.
In this conventional off-grid mode, the solar PV power suffers inverter and transformer loss while feeding AC loads. Further, it undergoes rectifier loss to meet the DC load demand. The solar PV power utilization is expressed as follows.
3.4. Scheme 4: Conventional Microgrid Scheme
Figure 5 represents a microgrid system that is used for managing the AC and DC power efficiently. Still, on several occasions, the power conversion process and the losses are overcome at a greater ratio than the conventional techniques. Mainly, when storage devices such as batteries are operated in a microgrid environment, the losses increase drastically compared with conventional schemes.
The power loss in battery storage occurs at various stages, and can be expressed as in the following equations,
where
PB.chg,loss—Charging loss
PB.dis,loss—Battery discharging loss
PB.int,loss—Battery internal loss
Pinv,loss—Inverter loss
Pdc conv,loss—DC-DC converter loss
Prect,Loss—Rectifier loss
Ptrs,loss—Transformer loss
Pfilt,loss—Filter loss
Whenever the battery is fully charged, it consumes a low current to maintain its charge level. Hence, the transformer and the inverter are under-loaded most of the time, and on several occasions, they are lightly loaded by the users. In this case, these converters and transformers drain enormous amounts of power and result in significant power loss, but this phenomenon remains unnoticed. The elimination of power conversion below 20% of the rated power is defined as an inefficient power conversion elimination strategy in this study.
4. Hybrid Microgrid System Description
A renewable energy-based hybrid microgrid configuration for the realization of the proposed IPCEA is shown in
Figure 6. The AC loads are connected to the AC bus and are fed by an AC source (utility power). The DC bus of the microgrid comprises Solar PV, batteries, and DC loads. The power generated from solar PV is managed at MPP and stored using a dedicated battery when necessary. The battery bank is connected for load management and to feed the DC load during the absence of solar and utility power. Consequently, if the battery’s state of charge reaches less than 50%, then the power is driven from the utility. The expression for SoC of the battery is as below.
where
The incorporation of renewable energy sources, such as solar PV, plays a vital role in conversion loss reduction. Primarily, the conversion loss while feeding the DC load demand is greatly reduced. It can be expressed as follows.
From Equation (23), it can be inferred that the loss across the rectifier and the loss due to the appliance transformer can be eliminated by including solar PV power.
Similarly, when the battery is charged using solar power, the majority of the loss-causing factors can be avoided. This is expressed as
Equation (24) indicates that battery charging includes only internal loss and DC converter loss, since it is charged directly from Solar PV DC power. The rectifier loss, transformer loss, and appliance transformer loss are eliminated.
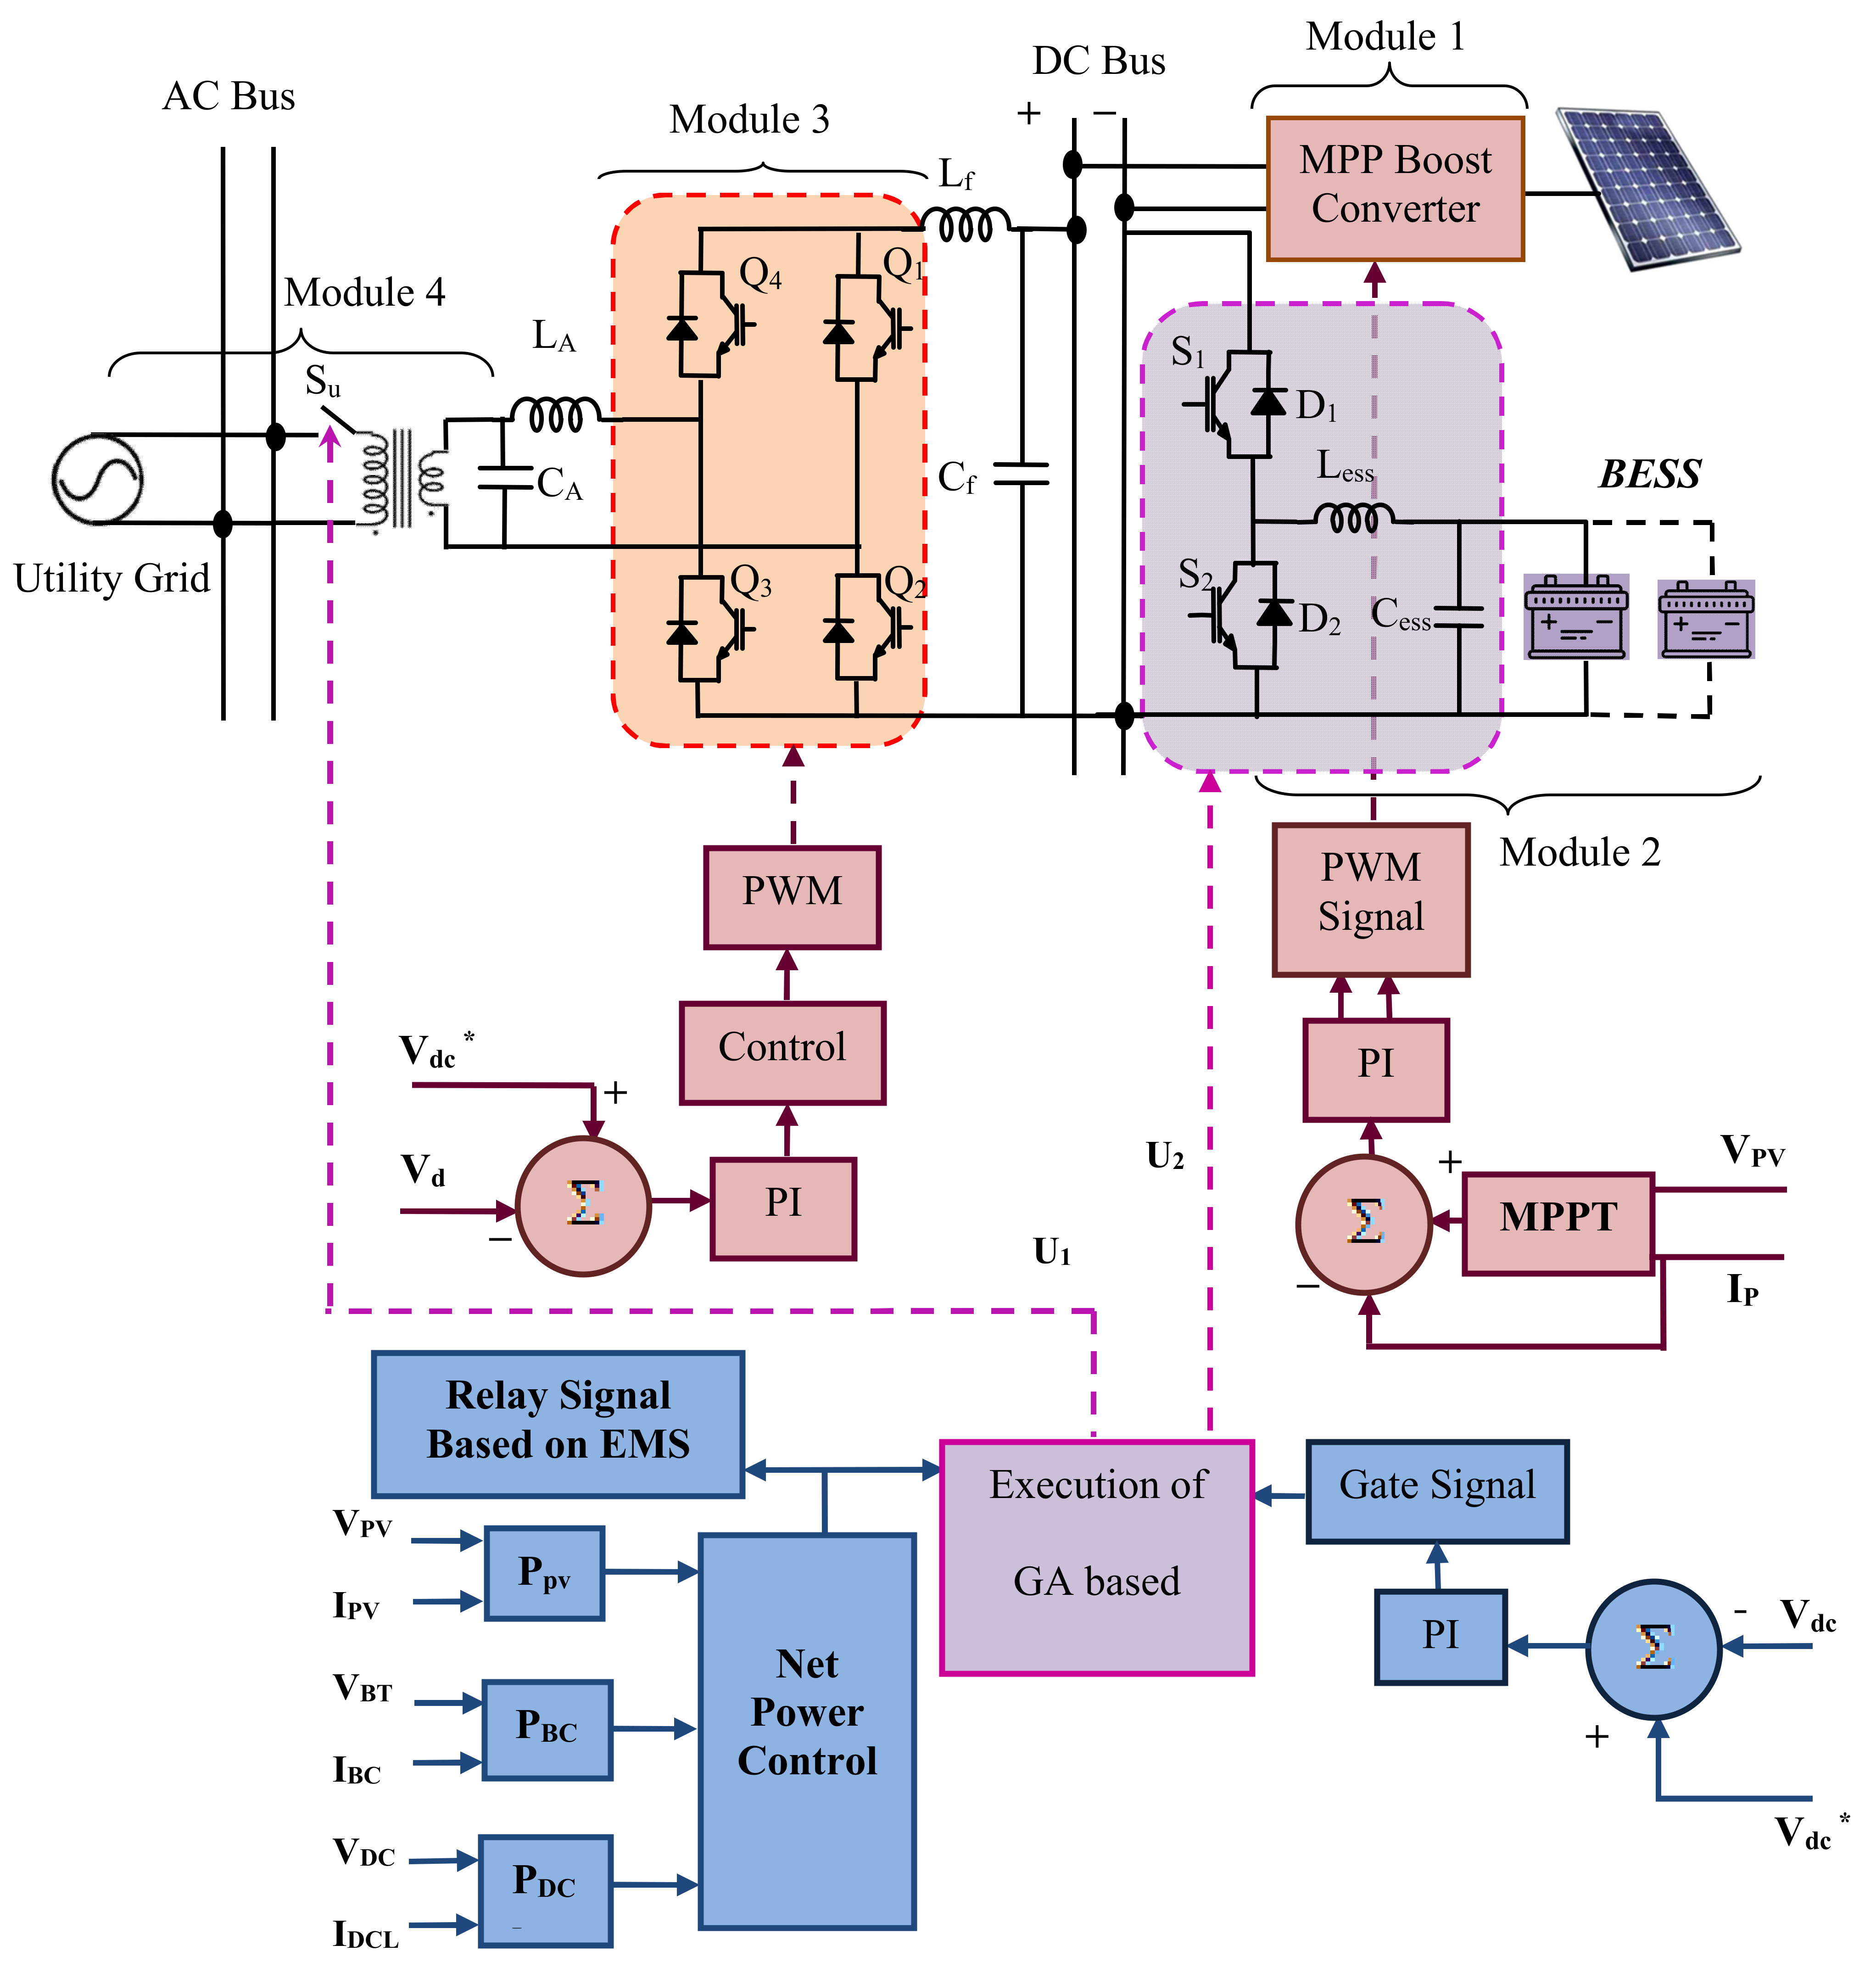
4.1. Proposed Microgrid Controller Configuration
Intelligent energy management of the microgrid-based residential distribution system is done performed using a microgrid controller. The schematic of the controller is depicted in
Figure 7.
Q1, Q2, Q3, Q4—Bidirectional interlinking converter IGBT switches
S1, S2,—Bidirectional DC converter IGBT switches
D1, D2,—Bidirectional DC converter diodes
VPV—Solar PV voltage
IPV—Solar PV current
PPV—Solar PV power
VBT—Battery voltage
IBC—Battery current
PBC—Battery power
Idcl—DC load current
Pdcl—DC load power
Vdc—DC link voltage
Vdc*—Reference DC link voltage
Su—Utility grid voltage
LA—AC side filter inductor
CA—AC side filter capacitor
Lf—DC link filter inductor
Cf—DC link filter capacitor
Less—Battery side filter inductor
Cess—Battery side filter capacitor
BESS—Battery energy storage system
The controller comprises four modules, as follows:
Module 1: A controller for MPP boost converter control. The Perturb and Observe algorithm is used for MPP of the solar PV system. The solar panel current IPV and voltage VPV values are fed into the controller and switching gate pulses are generated to operate the DC–DC boost converter.
Module 2: Comprises the controller for managing the auxiliary battery charges. The control signal is generated by comparing the reference DC bus voltage with the actual bus voltage. The bidirectional battery side converter is switched on and off depending on the optimal time of use required by the genetic algorithm.
During battery charging mode, the converter acts as a buck converter. The S
1 and D
2 conduct until the battery charges to its specified voltage. The duty cycle of the switch S
1 is obtained using the following expression.
where
During discharging mode, S
2 and D
1 conduct and the duty cycle of the switch S
2 is obtained using the expression
Module 3: Consists of a controller for bidirectional interlinking converter control. It is operated with the power available at the DC side voltage profile, based on the requirement of the interlinking converter operated either as a rectifier or as an inverter. The inverter is committed to functioning based on the utility side switch SU operation.
The bidirectional converter output voltage is controlled using the modulation index and it is expressed as follows.
where
The converter output is injected into the utility grid at an appropriate angle, which is obtained using the expression
where
ϕ = Angle at which voltage is injected into utility grid
LA = AC side smoothing inductor
VAC = AC voltage at inverter terminal
The power injected to the utility grid is expressed as
where:
Module 4: The utility side switch Su is operated with an intelligent control. The interlinking converter works only if the utility switch SU is on. The switching pattern is obtained using the genetic algorithm.
4.2. Design Procedure of the IPCEA Based Microgrid EMS
The IPCEA algorithm is based on a lower threshold limit for power transfer to avoid inefficient power transfer. The limit is set as 20% of the converter rating since the transformer connected in the circuit exhibit low efficiency when supplied less than 20% of its rating [
18,
19,
20]. The converter performance is reduced by up to 52.3% when it is loaded below than this threshold. It attains a considerable level only when it is loaded more than 20% (tested experimentally and inferred in
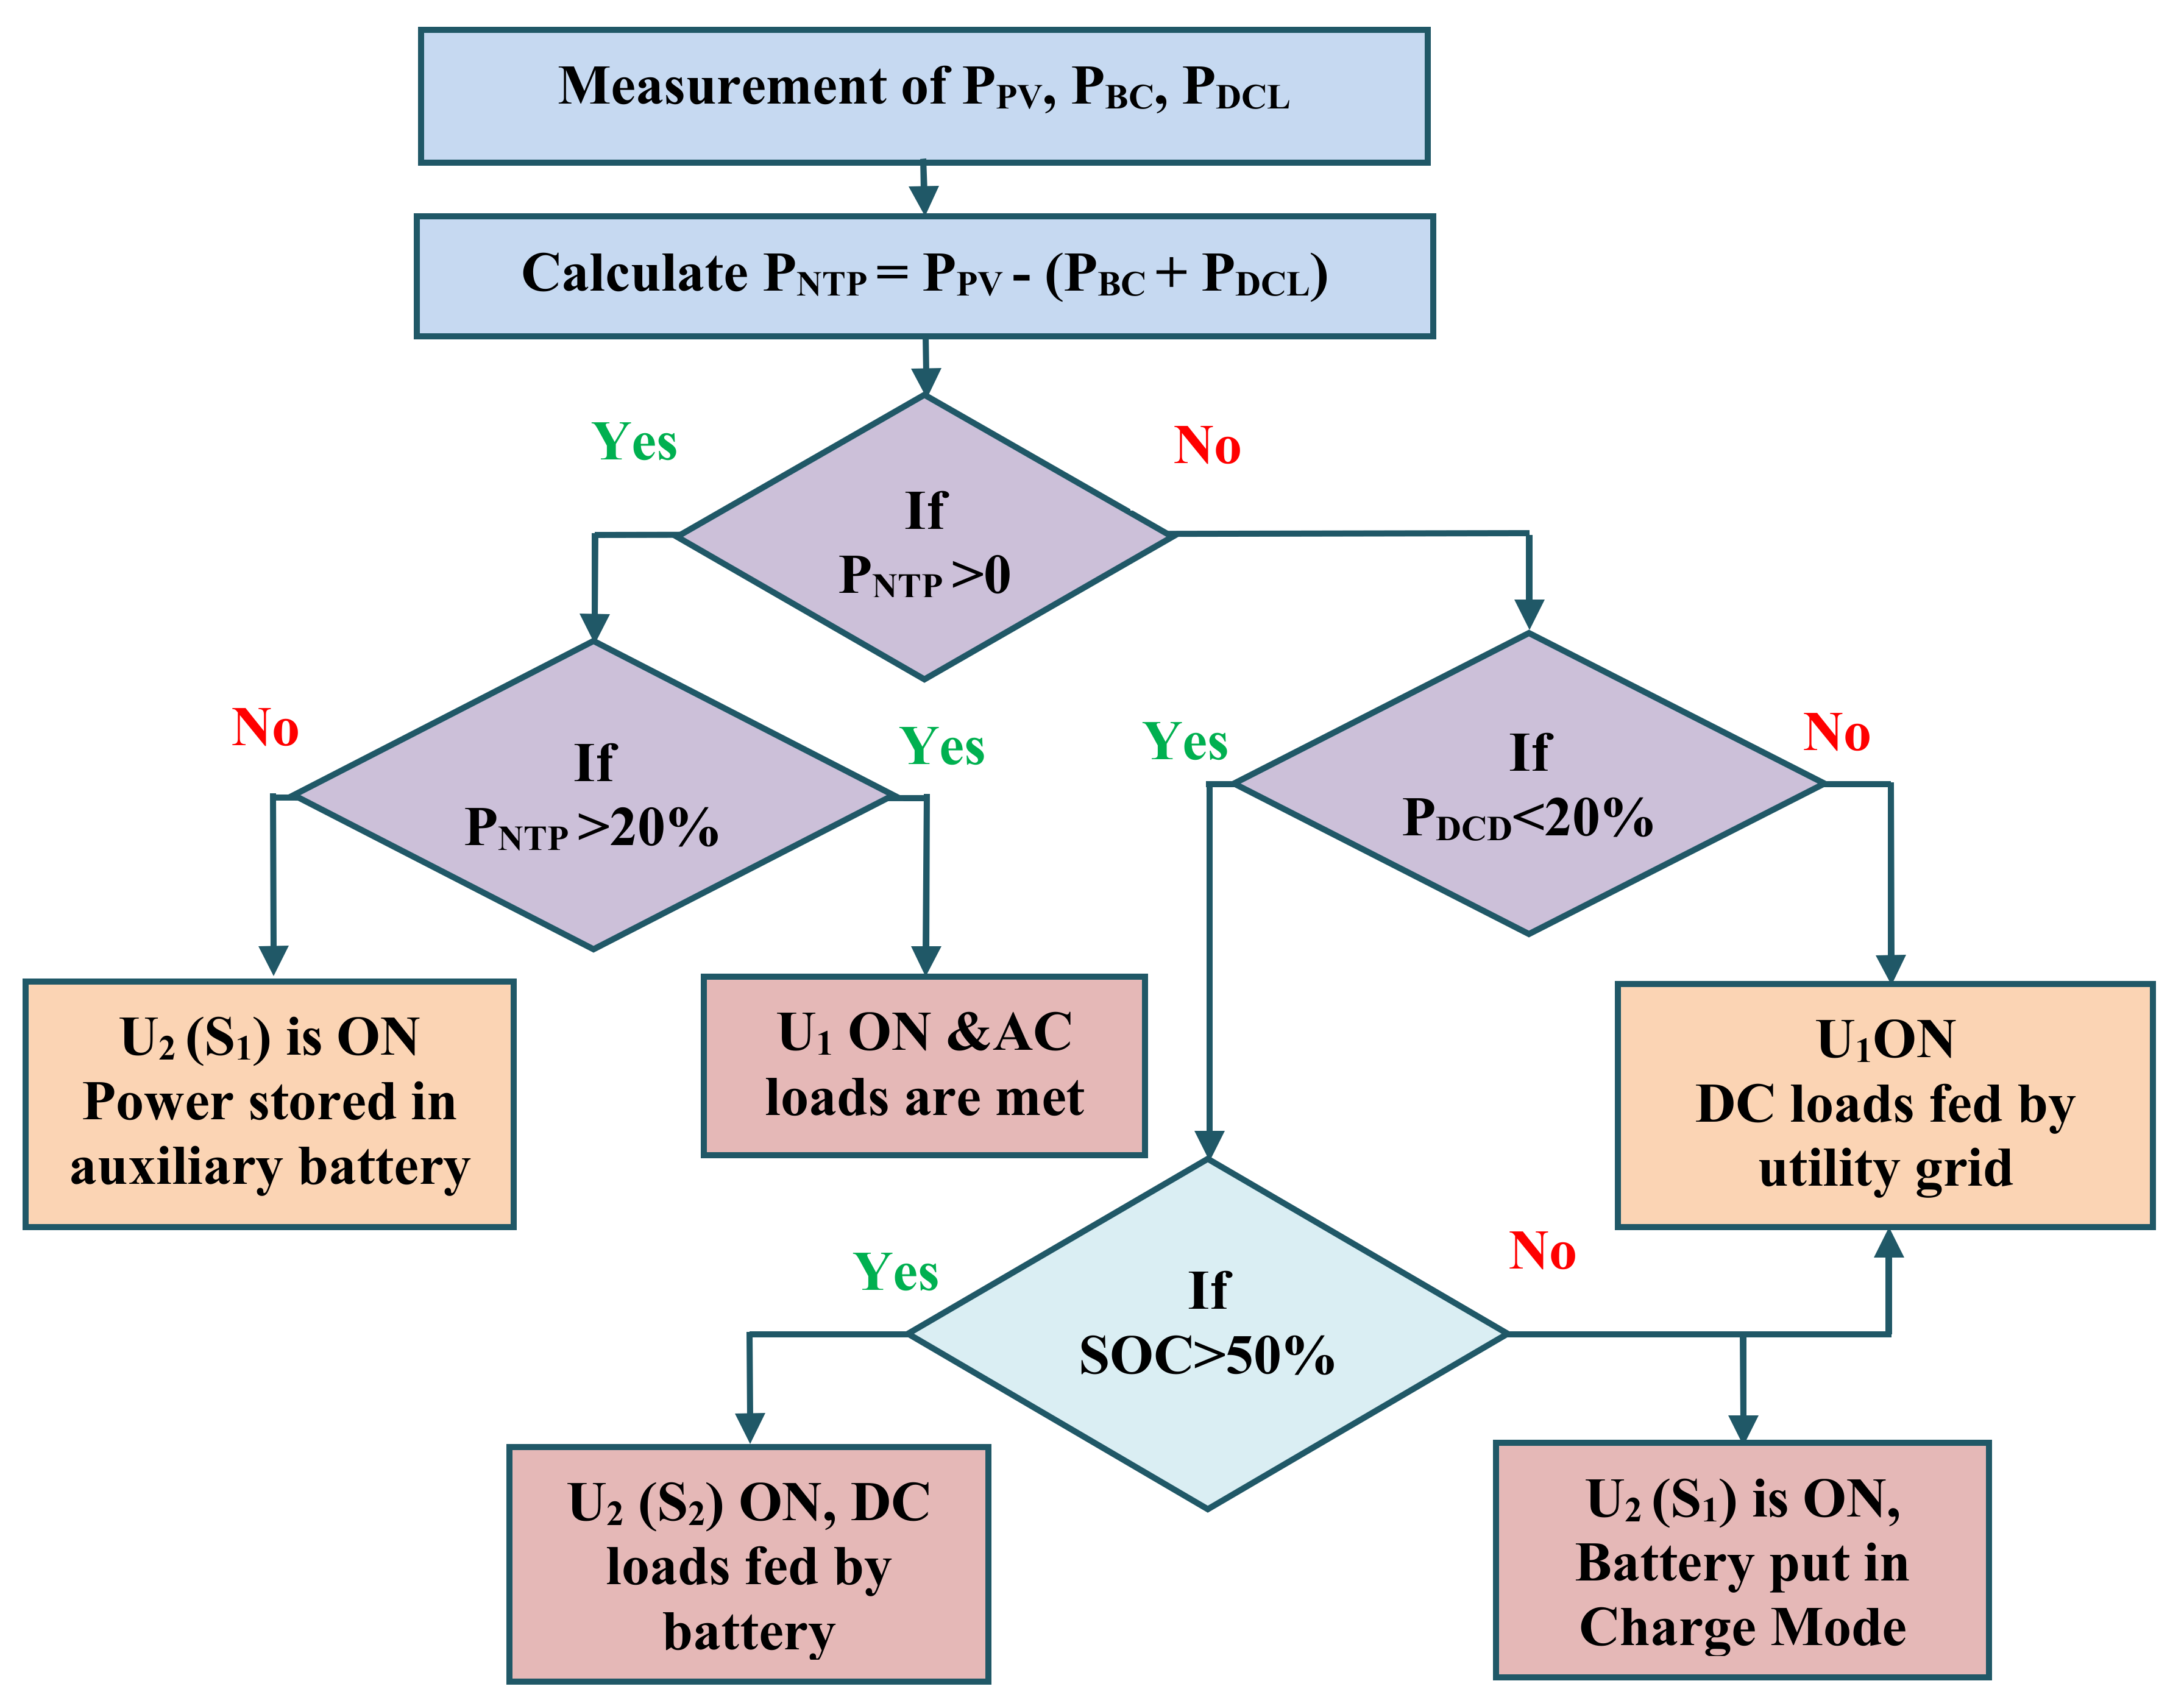
Section 2). A logical block diagram representation of the IPCEA algorithm is shown in
Figure 8.
The solar PV power generation, load demand, and battery SoC are given as the input. The P
NTP, Net Transferable Power (NTP) at DC bus after feeding DC loads, and the BESS demand are obtained, and the expression is shown below.
where
PNTP—Net transferable power at DC side
PPV—Power from PV array
PBC—Battery Charging Power
PDCL—DC power load demand
If
PNTP is positive and greater than 20%, then the U
1 is switched ON and the solar power from the DC side is fed into the AC bus to meet the AC load demand. The import or export of power within the utility grid is performed based on the load requirement and
PNTP availability. If
PNTP is not sufficient, then U
2 (T
1) is turned ON. Here, the Power (known to be inefficient) is fed into an auxiliary battery for storage.
PNTP is checked if is less than zero; if this is valid, we check whether the power required by the DC side is less than 20% of the converter rating (meager requirement). If this is the case, then the DC loads are fed from the battery storage if the SoC is above 50%. A level of 50% SoC is considered safe enough to avoid deep discharge [
26,
27]. Hence, if the SoC is found to be less than 50%, then the utility power is drawn to meet the DC-side load demand. If the DC side demands more than 50%, power is driven from the utility grid by switching ON the switch U
1. In this case, the converter works as a rectifier in this operation mode.
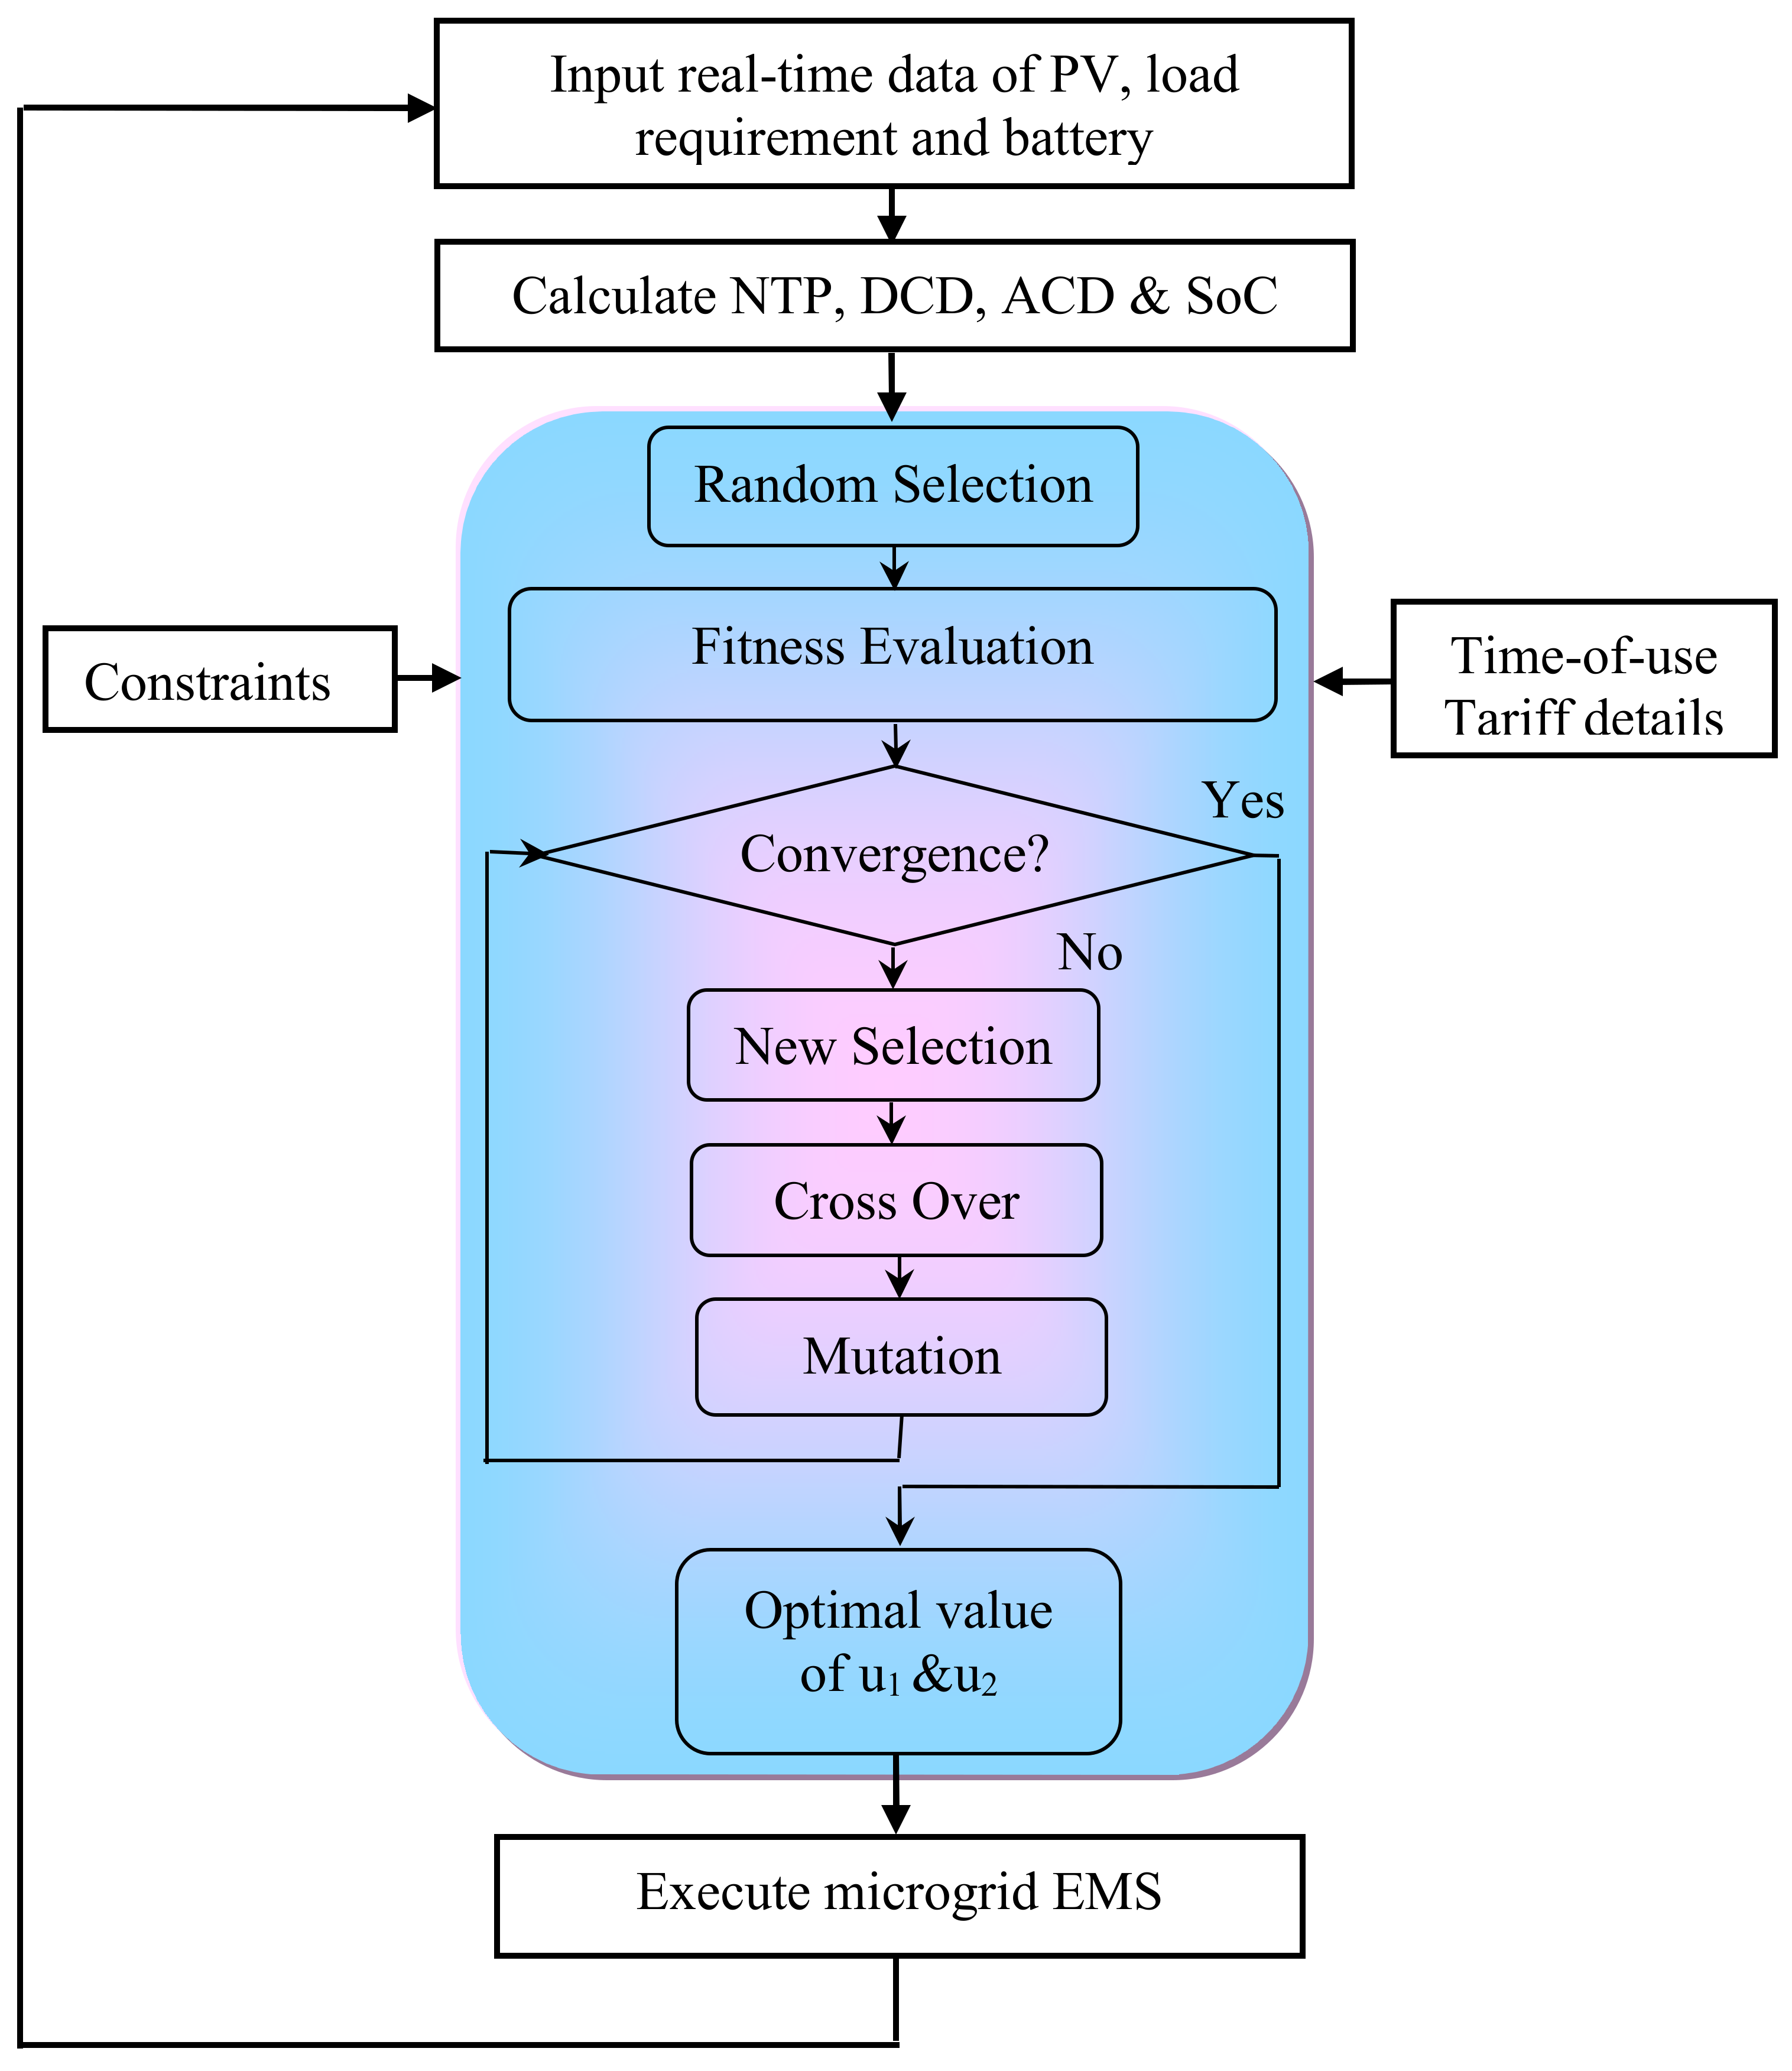
4.3. Genetic Algorithm for Cost Minimization
The IPCEA can minimize the conversion losses effectively, but to reduce energy costs in the region with a time-of-use tariff system requires the optimization of energy distribution. In this study, a Genetic Algorithm (GA)-based optimization technique was used for cost reduction. This was achieved in four steps.
Step 1: The input parameters include instantaneous solar PV power, AC- and DC-side load demand, and the battery’s state of charge.
Step 2: Calculation of NTP using Equation (10) and load demands using real-time data.
Step 3: Execution of the genetic algorithm.
The objective function of the system for cost minimization is defined as
where
PGS—Grid-side power
CGS—Cost of the grid power
PACD—AC-side power demand
PConv—Power loss across converter
PDCD—DC-side power demand
PBL—Power loss across battery
PPV—Power from PV array
where u
1 is the switching command to operate the switch S
U to connect the AC and DC buses for power transfer. Its value is
u
2 is the switching command to connect the battery with the DC bus, which takes the value
The modes are operated in the following format:
Charging Mode: The battery is placed in charging operation mode where S1 and D2 conducts; the battery charges to the required level.
Float Mode: In this mode, the battery does not exchange power with the network. It merely stays connected in the line. Further, it receives a minimum current to maintain the charge in its state.
Discharging Mode: In this mode, S2 and D1 conduct and the battery power is utilized to meet the load demand. The S2 modes are enabled concerning the SoC of the battery.
The constraints used for achieving cost minimization and inefficient power conversion reductions are as follows:
SOC limits:
Power transfer switch u1 enabled if
When and , switch u2 is enabled to access the battery power.
The flow diagram of the genetic algorithm used for the realization of IPCEA is shown in
Figure 9. GA is used to optimize the power distribution in the microgrid such that the electricity cost is minimized.
The GA execution is as follows:
Selection of population (random, size = 50).
Fitness evaluation (Individual).
Check for criterion satisfaction.
If the condition is not satisfied, another new population set is selected (roulette wheel selection).
Go for cross-over (single cross-over).
The mutation rate is fixed as 0.2.
Check for convergence.
The developed control algorithm generates a reference signal based on the threshold limits and the actual power availability for microgrid energy management. It produces control signals to actuate the converter operation during power transfer. Further, it delivers power transfer with the utility grid.
5. Comparative Investigation
This discussion considers a comparative investigation of the conventional direct grid-tied solar PV scheme and a conventional microgrid system. In this paper, a detailed comparative analysis was performed to exhibit the effectiveness of the proposed hybrid microgrid system as well as the significance of the IPCEA algorithm. The investigation includes real-time data of solar PV. The location-based solar PV data were obtained from NREL [
28], and the domestic load data was extracted on an hourly basis from the web [
29]. The average residential DC load demand was approximately 40%. It comprised electronic gadgets, lighting, and fan loads. The AC load demand was considered to be 60%, as inferred from [
30,
31]. The detailed data set used in this study is outlined in
Table 1. The power consumption pattern of the conventional domestic distribution scheme, which uses a direct grid-tied solar PV system, is shown in
Table 2. The generated solar power is fully transferred to the grid using a direct grid-tied converter in the conventional scheme and the power required for domestic loads is drawn from the utility grid.
The limitation considered in this scheme is the fact that the generated DC power from the solar PV is inverted every time before feeding to the grid. If the power available at the solar PV terminal is inefficient i.e., less than 20% of the converter rating, the power transfer leads to enormous conversion losses. Hence, to overcome the limitations of the conventional solar PV scheme, the microgrid-based power distribution possess certain advantages. The power consumption pattern of the conventional microgrid-based power distribution scheme with solar PV is depicted in
Table 3. The DC and AC distribution buses can be built to feed the loads separately. The DC power generated from the solar PV can be fed directly to DC loads without much conversion. The solar power is only active for six hours a day, and the remaining part of the AC power must be converted to feed DC loads.
Similarly, solar power is inverted to feed AC loads when it is abundant. Hence, the system undergoes redundant conversion, which leads to high conversion losses. Further, inefficient power conversion was encountered in the microgrid power distribution system. The portion of this inefficient power conversion period is shown below, using color shading.
5.1. Realization of the GA for Cost Minimization
GA-based optimization was used to minimize the conversion loss and cost. It was mainly used in the time-of-use tariff system. The time-of-use tariff detail is depicted in
Table 4.
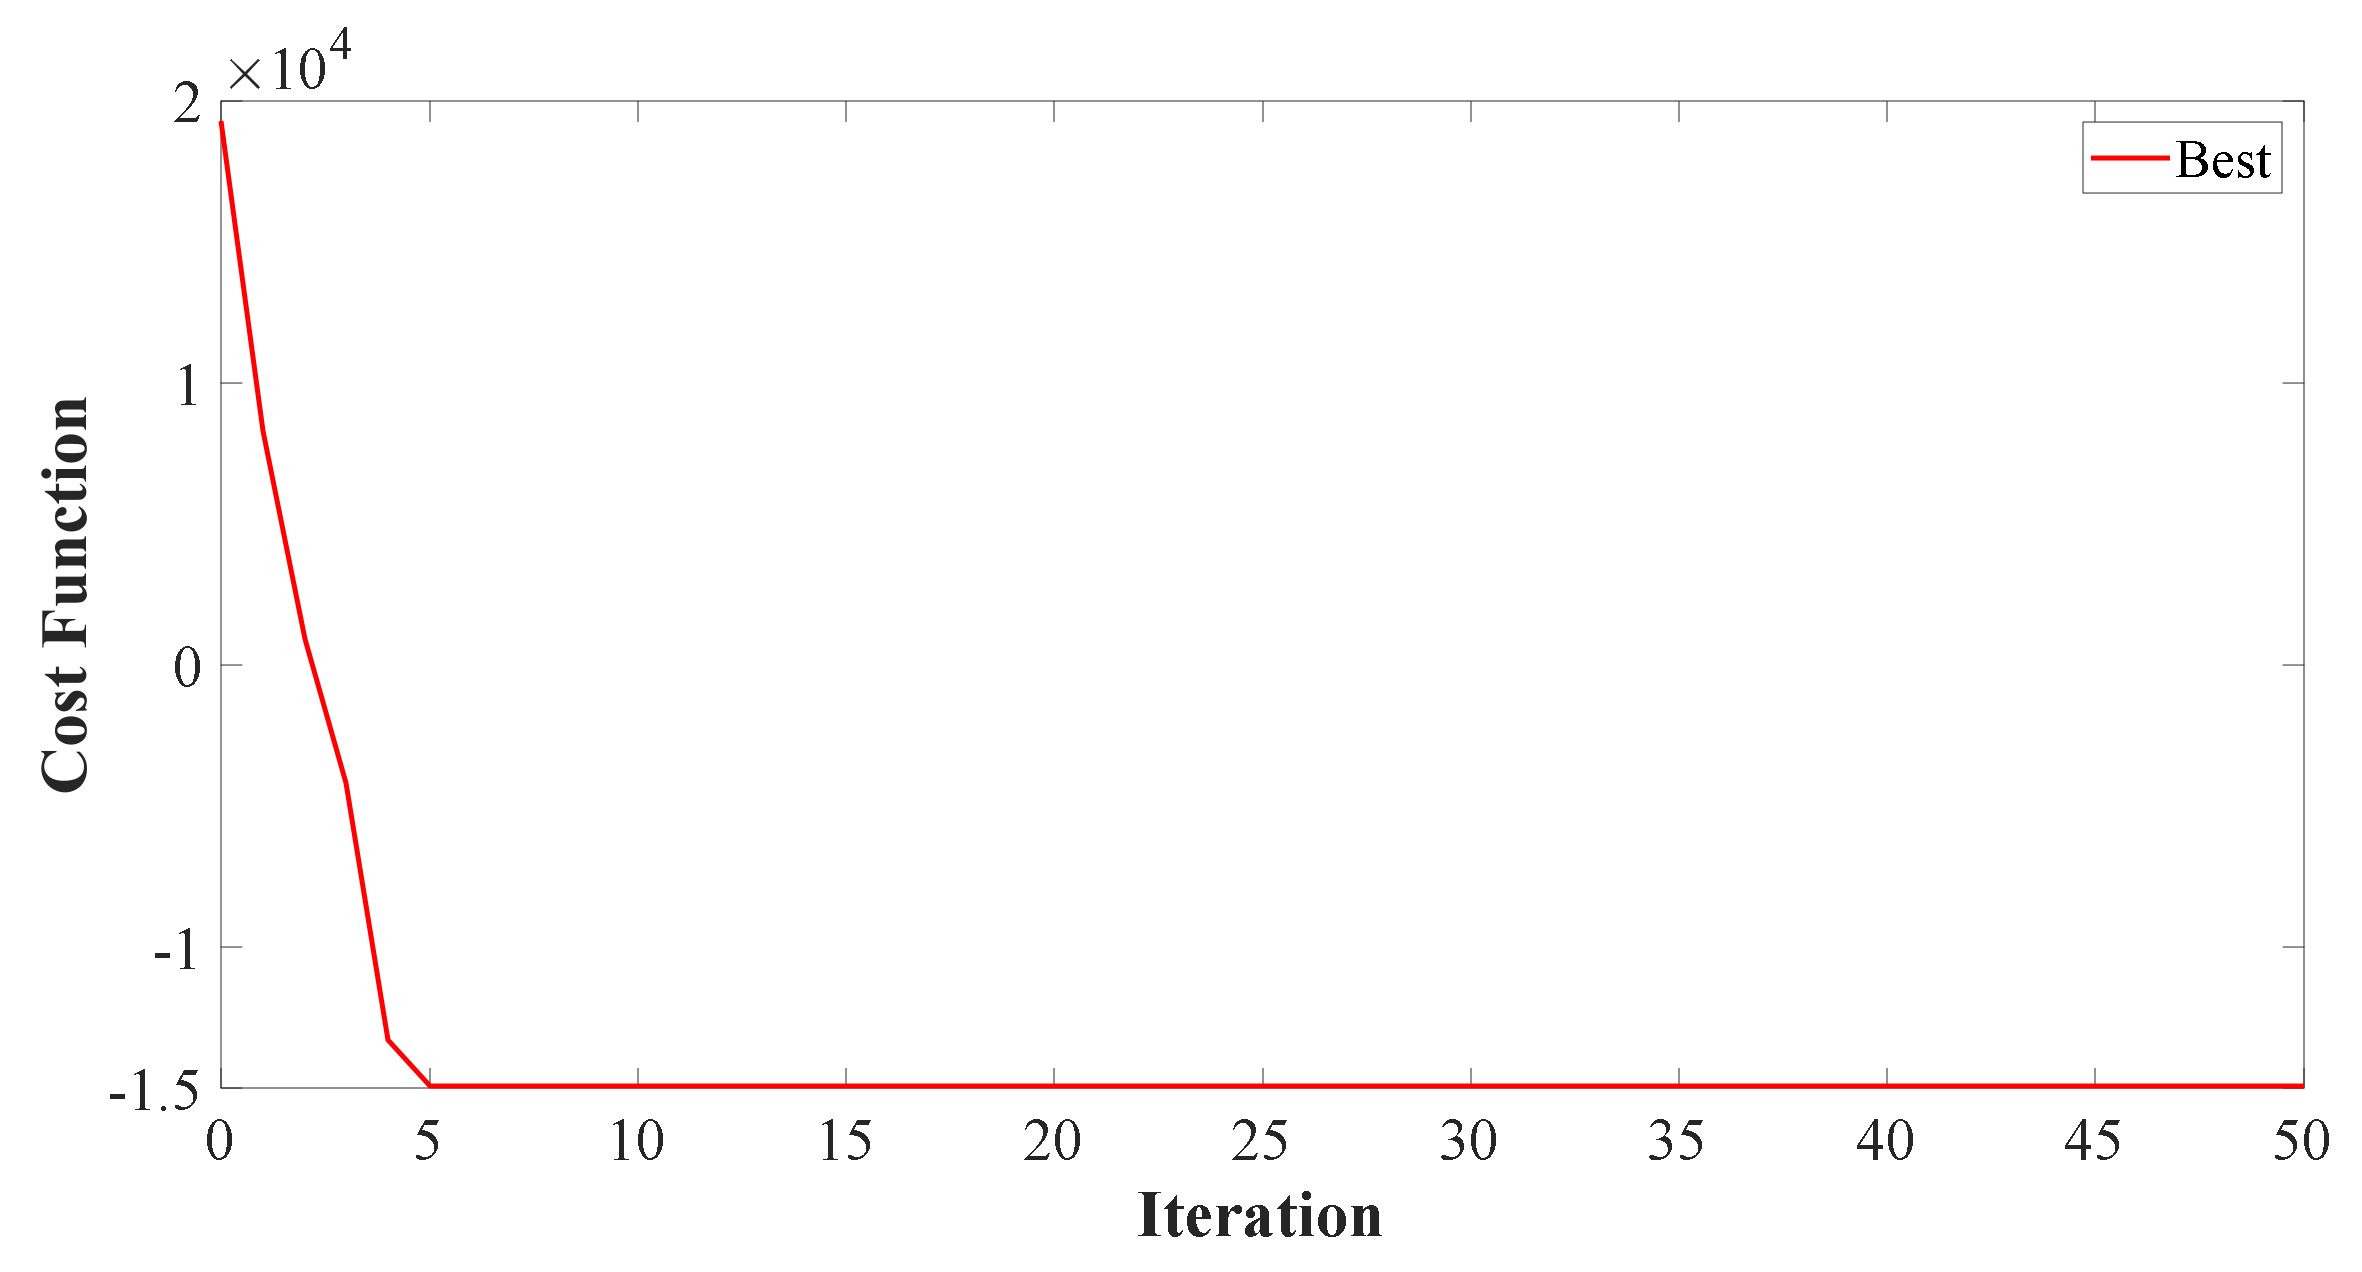
Advisory Control Output
A genetic algorithm was executed, resulting in the cost function’s convergence; it is shown in
Figure 10. The switching pattern was obtained using GA optimization and the values of
u1 and
u2 are depicted as follows:
To initiate power transfer across the interlinking converter, the pattern u
1 has been used; pattern
u2 has been used to manage the battery energy for obtaining the optimal energy cost. This can be observed in
Figure 11.
5.2. Conversion Loss Reduction Strategy of the Proposed Scheme
A unique solution was obtained using the proposed IPCEA-based energy management strategy. The solar PV was connected to the DC bus of the microgrid and met the DC load demand. The batteries were used to handle the DC loads in the absence of solar power. The battery capacities were selected based on the DC load requirement. The batteries were charged using solar PV power when the solar power generation was active, and the backup was used during its absence.
Further, as per the proposed algorithm, inefficient power was utilized for maximally charging the battery. This scheme of power distribution reduced the conversion process significantly, and inefficient conversion was eliminated. The proposed IPCEA-based microgrid-supported power distribution scheme is summarized in
Table 5. The conversion efficiency can be observed in
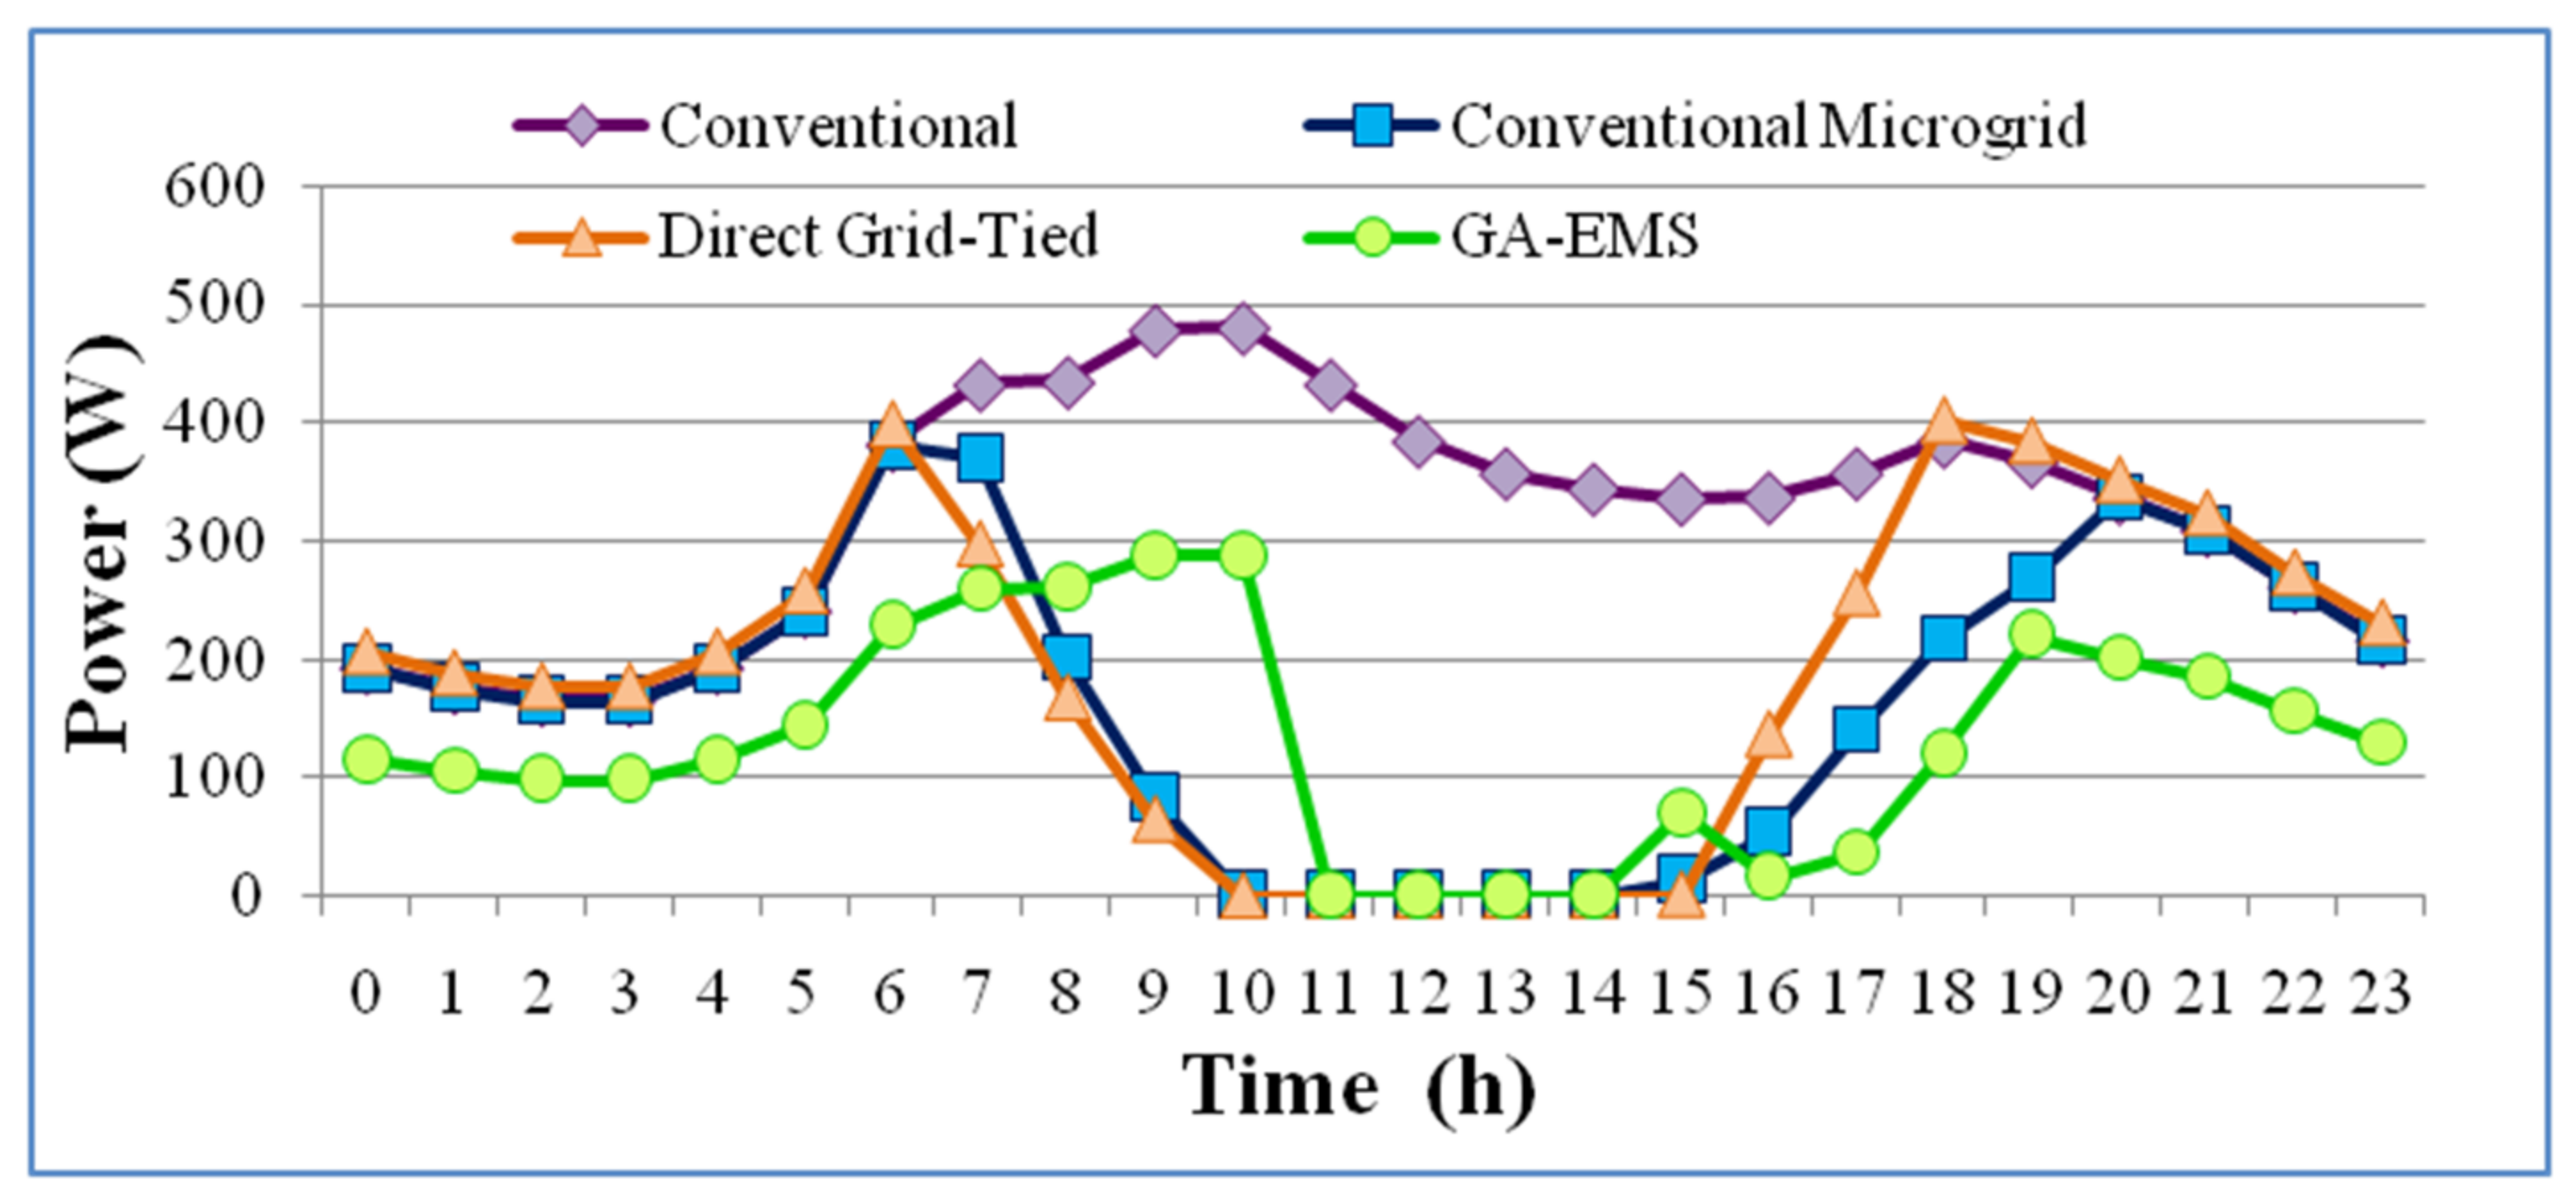
Figure 1. The power driven from utility throughout the day for all the schemes is represented in
Figure 12.
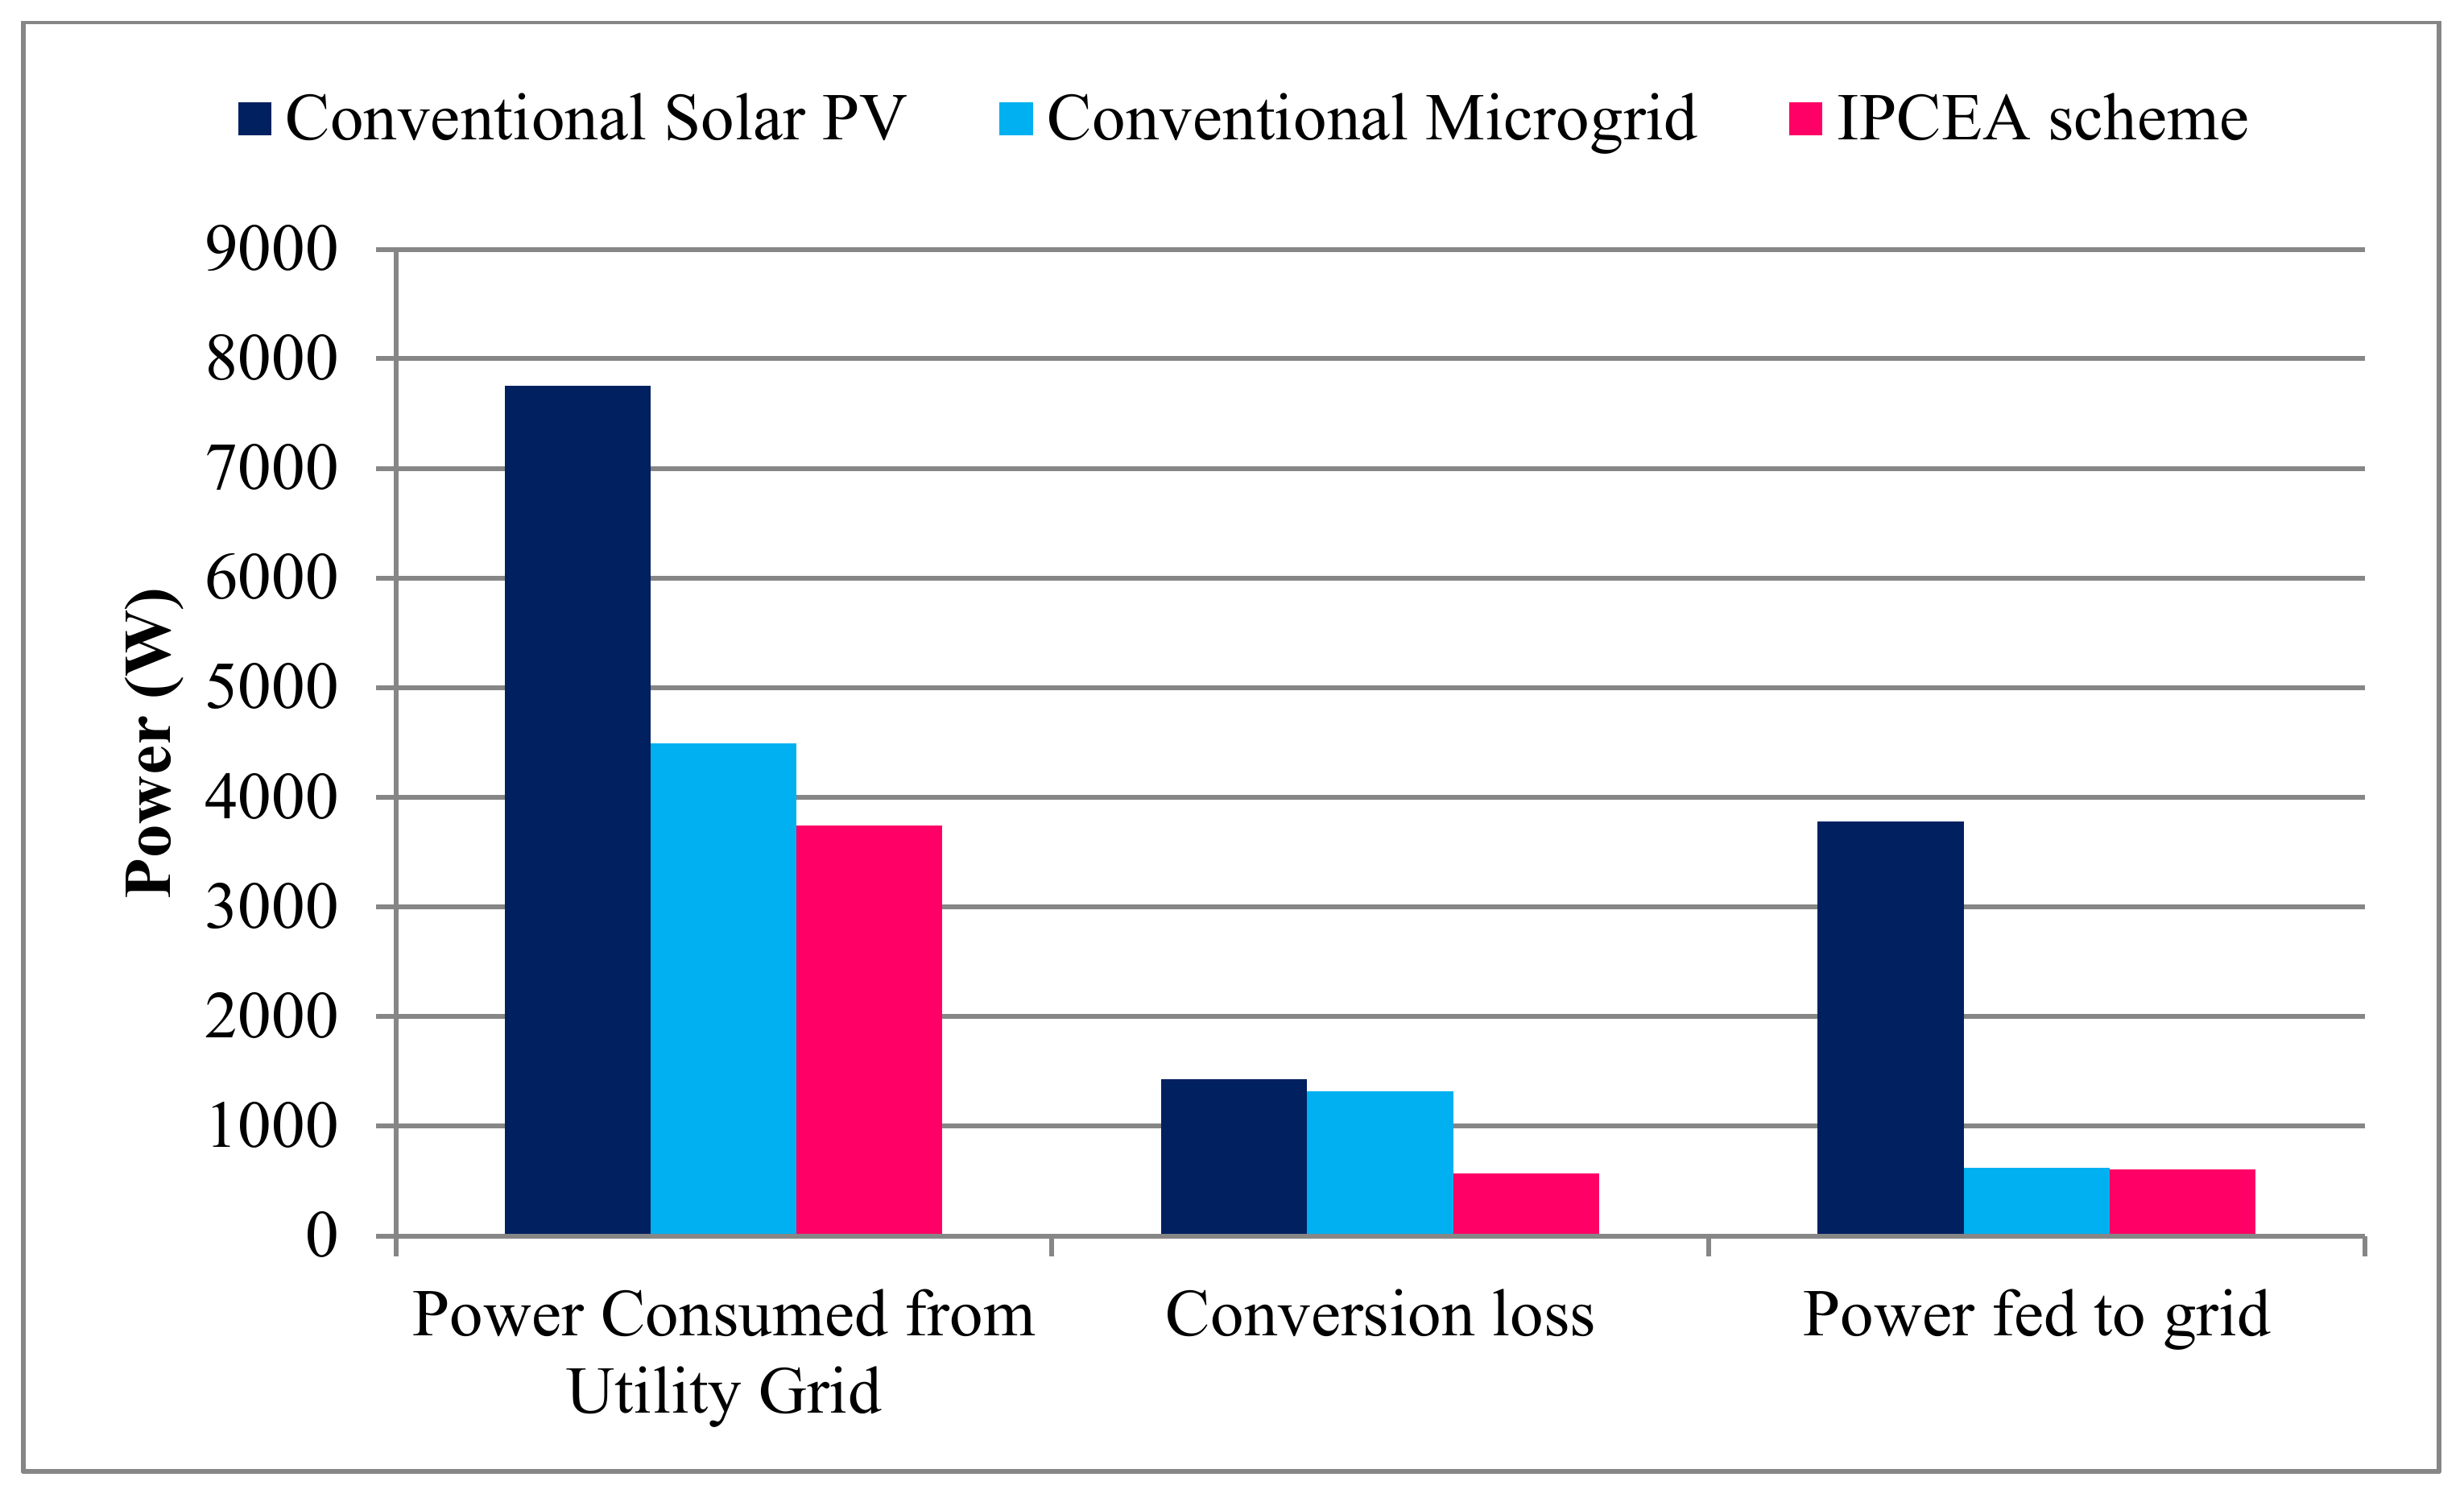
Figure 13 highlights the importance of the proposed algorithm for reducing conversion losses.
The hourly energy cost of each scheme was set using the time-of-use tariff rate. The monthly electricity cost was evaluated for various schemes considered for this investigation, and the comparison details are recapitulated in
Table 6. Further elaboration of the cumulative energy savings and cost reduction per month for the various schemes is presented in
Table 7.
6. Discussion and Conclusions
From the results presented in
Table 7, it can be observed that when applied in the energy management of distribution system, the proposed IPCEA strategy results in the reduction of power conversion loss and paves an optimum approach to energy conservation. The conventional rooftop solar PV scheme provided a 48.7% reduction in electricity consumption from the utility grid, whereas the proposed scheme provided a 59.54% decrease in power consumption. Further, the conventional solar PV scheme and the GA-based energy management approach decreased the electricity cost by 50.23% and 59.23%, respectively.
The extensive experimental analyses and literature survey evidently proved that the conversion loss is tremendous in a conventional distribution system and in conventional solar PV deployment schemes. Moreover, the existing microgrid scheme also suffered conversion losses on several occasions. Inefficient power conversion took place more frequently in the microgrid scheme than in the conventional scheme.
The proposed IPCEA-based hybrid microgrid energy management system significantly reduced conversion losses as well as minimizing energy costs. The approach also enhanced the energy economy of the domestic power distribution system. Inefficient power conversion was eliminated, which resulted in significant power savings. The battery’s energy storage and distribution were managed within the DC bus, and multiple conversion processes were curtailed. Further, the proposed energy management system reduced solar PV grid interaction issues by avoiding ineffective grid exchanges.
Author Contributions
Conceptualization, methodology, writing of original draft, and formal analysis M.R.; supervision and visualization, S.G.; data curation, validation, and investigation, R.M.E.; writing—review and editing, L.M.-P. All authors have read and agreed to the published version of the manuscript.
Funding
The APC was funded by Oestfold University College, Norway.
Institutional Review Board Statement
Not applicable.
Informed Consent Statement
Not applicable.
Data Availability Statement
Not applicable.
Acknowledgments
The authors express their gratitude to their respective institutions for support in carrying out this research. In addition, the financial support from Oestfold University College, Norway, is gratefully acknowledged.
Conflicts of Interest
The authors declare no conflict of interest.
Appendix A
| Particulars | Specification |
| Model | UPSEB 900 VA (12) |
| Rated Capacity | 800 VA |
| Output Power | 672 Watts |
| Input Voltage | 100–300 V |
| Efficiency | 84% |
| Charging Current | 10 Amps |
| Product Dimensions | 38.1 cm × 35.6 cm × 20.3 cm |
| Weight | 10 kg |
References
- Rodriguez-Otero, M.A.; O’Neill-Carrillo, E. Efficient home appliances for a future DC residence. In Proceedings of the 2008 Energy 2030 Conference, Atlanta, GA, USA, 17–18 November 2008; pp. 17–18. [Google Scholar]
- Foster Porter, S.; Denkenberger, D.; Mercier, S.; May-Ostendorp, P. Reviving the War of Currents: Opportunities to Save Energy with DC Distribution in Commercial Buildings. Proc. ACEEE Summer Study Energy Effic. Build. 2014, 85, 3. [Google Scholar]
- Mahmoud, M.S. Microgrid Advanced Control Methods and Renewable Energy System Integration; Hayton, J., Ed.; Elsevier: Cambridge, MA, USA, 2017; pp. 1–42. [Google Scholar]
- Hirsch, A.; Parag, Y.; Guerrero, J. Microgrids: A review of technologies, key drivers, and outstanding issues. Renew. Sustain. Energy Rev. 2018, 90, 402–411. [Google Scholar] [CrossRef]
- Ramli, M.A.M.; Bouchekara, H.R.E.H.; Alghamdi, A.S. Efficient Energy Management in a Microgrid with Intermittent Renewable Energy and Storage Sources. Sustainability 2019, 11, 3839. [Google Scholar] [CrossRef] [Green Version]
- Longe, O.M.; Ouahada, K.; Rimer, S.; Ferreira, H.C.; Han Vinck, A.J. Distributed Optimisation Algorithm for Demand Side Management in a Grid-Connected Smart Microgrid. Sustainability 2017, 9, 1088. [Google Scholar] [CrossRef] [Green Version]
- Silva, G.F.; Donaire, A.; Seron, M.M.; Aaron McFadyen, A.; FordString, J. Stability in Microgrids Using Frequency Controlled Inverter Chains. IEEE Control Syst. Lett. 2021, 6, 1484–1489. [Google Scholar] [CrossRef]
- Zheng, L.; Kandula, R.P.; Divan, D. Current-Source Solid-State DC Transformer Integrating LVDC Microgrid, Energy Storage, and Renewable Energy into MVDC Grid. IEEE Trans. Power Electron. 2021, 37, 1044–1058. [Google Scholar] [CrossRef]
- Lee, E.-K.; Shi, W.; Gadh, R.; Kim, W. Design and Implementation of a Microgrid Energy Management System. Sustainability 2016, 8, 1143. [Google Scholar] [CrossRef] [Green Version]
- Takahashi, M.; Nishijima, K.; Nagao, M.; Sato, T.; Nabeshima, T. A Hybrid Converter for Improving Light Load Efficiency. IEEJ Trans. Ind. Appl. 2011, 13, 1007–1012. [Google Scholar] [CrossRef]
- Jens, F.; Leon, F. Efficiency Optimization for Partial Load Operation of Interleaved Converters. In Proceedings of the 23rd International Conference on Electrical Machines and Systems (ICEMS), Hamamatsu, Japan, 24–27 November 2020. [Google Scholar]
- Li, C.; Jia, X.; Zhou, Y.; Li, X. A microgrids energy management model based on multi-agent system using adaptive weight and chaotic search particle swarm optimization considering demand response. J. Clean. Prod. 2020, 262, 121247. [Google Scholar] [CrossRef]
- Iqbal, S.; Nasir, M.; Zia, M.F.; Riaz, K.; Sajjad, H.; Khan, H.A. A novel approach for system loss minimization in a peer-to-peer energy sharing community DC microgrid. Int. J. Electr. Power Energy Syst. 2021, 129, 106775. [Google Scholar] [CrossRef]
- Lenhart, S.; Araujo, K. Microgrid decision-making by public power utilities in the United States: A critical assessment of adoption and technological profiles. Renew. Sustain. Energy Rev. 2021, 139, 110692. [Google Scholar] [CrossRef]
- Yanine, F.; Sanchez-Squella, A.; Barrueto, A.; Parejo, A.; Cordova, F.; Rother, H. Grid-tied distributed generation systems to sustain the smart grid transformation: Tariff analysis and generation sharing. Energies 2020, 13, 1187. [Google Scholar] [CrossRef] [Green Version]
- Gangatharan, S.; Rengasamy, M.; Elavarasan, R.M.; Das, N.; Hossain, E.; Sundaram, V.M. A Novel Battery supported Energy Management System for the effective handling of Feeble power in Hybrid Microgrid Environment. IEEE Access 2020, 8, 217391–217415. [Google Scholar] [CrossRef]
- Mageswaran, R.; Sivasankar, G.; Rajvikram, M.E.; Mihet-Popa, L. The Motivation for Incorporation of Microgrid Technology in Rooftop Solar Photovoltaic Deployment to Enhance Energy Economics. Sustainability 2020, 12, 10365. [Google Scholar] [CrossRef]
- How to Determine Transformer Efficiency? Electrical Engineering. Available online: https://www.engineeringenotes.com/electrical-engineering/transformer/how-to-determine-transformer-efficiency-electrical-engineering/27945 (accessed on 23 March 2021).
- What Is the Effect of under Load Transformer for Energy Losses? Electrical Engineering. Available online: https://www.researchgate.net/post/what_is_the_effect_of_underload_transformer_for_energy_losses (accessed on 16 June 2021).
- Suresh, K.; Devishree, J. Evaluation of transformer loading and energy loss for increasing energy efficiency in distribution system. In Proceedings of the 12th International Conference on Electrical Engineering/Electronics, Computer, Telecommunications and Information Technology (ECTI-CON), Hua Hin, Thailand, 24–27 June 2015. [Google Scholar]
- Notton, G. Hybrid wind-photovoltaic energy systems. In Stand-Alone and Hybrid Wind Energy Systems Technology, Energy Storage and Applications; Woodhead Publishing Series in Energy; Elsevier: Amsterdam, The Netherlands, 2010; pp. 216–253. [Google Scholar] [CrossRef]
- Hakans, A.; Ugur, S.S. Hybrid switch use for light load efficiency improvement of a power inverter for stand-alone residential renewable energy system. In Proceedings of the 15th European Conference on Power Electronics and Applications (EPE), Lille, France, 2–6 September 2013. [Google Scholar]
- Hina, F.; Prabaharan, N.; Palanisamy, K.; Akhtar, K.; Saad, M.; Jackson, J.J. Hybrid-Renewable Energy Systems in Microgrids; Woodhead Publishing: Chicago, IL, USA, 2018; pp. 23–37. [Google Scholar]
- Charging and Discharging Lead Acid Batteries. Available online: https://www.solar-facts.com/batteries/battery-charging.php (accessed on 24 March 2021).
- Characteristics of Lead Acid Batterie. Available online: https://www.pveducation.org/pvcdrom/lead-acid-batteries/characteristics-of-lead-acid-batteries (accessed on 24 March 2021).
- Zeh, A.; Müller, M.; Naumann, M.; Hesse, H.; Jossen, A.; Witzmann, R. Fundamentals of Using Battery Energy Storage Systems to Provide Primary Control Reserves in Germany. Batteries 2016, 2, 29. [Google Scholar] [CrossRef] [Green Version]
- Hesse, H.C.; Schimpe, M.; Kucevic, D.; Jossen, A. Lithium-Ion Battery Storage for the Grid—A Review of Stationary Battery Storage System Design Tailored for Applications in Modern Power Grids. Energies 2017, 10, 2107. [Google Scholar] [CrossRef] [Green Version]
- NREL (National Renewable Energy Laboratory). PVWatts ® Calculator. Available online: https://pvwatts.nrel.gov (accessed on 6 April 2021).
- State Load Dispatch Centre, Delhi. Available online: https://www.delhisldc.org/Loadcurve.aspx (accessed on 6 April 2021).
- Glasgo, B.; Azevedo, I.L.; Hendrickson, C. How much electricity can we save by using direct current circuits in homes? Understanding the potential for electricity savings and assessing feasibility of a transition towards DC powered buildings. Appl. Energy 2016, 180, 66–75. [Google Scholar] [CrossRef] [Green Version]
- Garbesi, K.; Vossos, V.; Shen, H. Catalog of DC Appliances and Power Systems; Lawrence Berkeley National Laboratory: Berkeley, CA, USA, 2010.
Figure 1.
Performance characteristics of the inverter.
Figure 1.
Performance characteristics of the inverter.
Figure 2.
The battery storage system used in conventional system.
Figure 2.
The battery storage system used in conventional system.
Figure 3.
Direct grid-tied rooftop Solar PV with battery backup system.
Figure 3.
Direct grid-tied rooftop Solar PV with battery backup system.
Figure 4.
Solar PV off-grid system.
Figure 4.
Solar PV off-grid system.
Figure 5.
The losses in a microgrid with bi-directional interlinking converter configuration.
Figure 5.
The losses in a microgrid with bi-directional interlinking converter configuration.
Figure 6.
Hybrid microgrid system configuration.
Figure 6.
Hybrid microgrid system configuration.
Figure 7.
Schematic diagram of the hybrid microgrid controller.Parameters used in
Figure 7.
Figure 7.
Schematic diagram of the hybrid microgrid controller.Parameters used in
Figure 7.
Figure 8.
Logical block diagram representation of the IPCEA algorithm.
Figure 8.
Logical block diagram representation of the IPCEA algorithm.
Figure 9.
Flow chart of the GA-based microgrid energy management system.
Figure 9.
Flow chart of the GA-based microgrid energy management system.
Figure 10.
Convergence of cost function by iteration.
Figure 10.
Convergence of cost function by iteration.
Figure 11.
Switching patterns u1 and u2.
Figure 11.
Switching patterns u1 and u2.
Figure 12.
Power driven from the utility.
Figure 12.
Power driven from the utility.
Figure 13.
Power exchange and conversion loss comparison chart.
Figure 13.
Power exchange and conversion loss comparison chart.
Table 1.
Hourly solar PV power generation and averaged domestic load consumption details.
Table 1.
Hourly solar PV power generation and averaged domestic load consumption details.
| Time (h) | Ambient Temperature (°C) | Irradiance (W/m2) | DC Array Output (W) | Hourly Load Consumption at Conventional Distribution System (W) | Loads Categorized under
Microgrid System |
|---|
| DC side Load Consumption (W) | AC side Load Consumption (W) |
|---|
| (NREL’s PV Watts Calculator) [23] | (State Load
Dispatch Centre) [24] | Considered 40% DC Loads and 60% AC Loads [25,26] |
|---|
| 0 | 22.244 | - | - | 192.085 | 76.834 | 115.251 |
| 1 | 21.765 | - | - | 175.315 | 70.126 | 105.189 |
| 2 | 21.331 | - | - | 164.895 | 65.958 | 98.937 |
| 3 | 20.965 | - | - | 164.895 | 65.958 | 98.937 |
| 4 | 20.625 | - | - | 192.085 | 76.834 | 115.251 |
| 5 | 20.326 | - | - | 240.105 | 96.042 | 144.063 |
| 6 | 22.105 | - | - | 381.04 | 152.416 | 228.624 |
| 7 | 25.699 | 176.492 | 140.983 | 432.19 | 172.876 | 259.314 |
| 8 | 28.928 | 462.707 | 360.468 | 434.375 | 173.75 | 260.625 |
| 9 | 31.457 | 749.333 | 538.987 | 478.125 | 191.25 | 286.875 |
| 10 | 33.336 | 918.126 | 632.724 | 480.21 | 192.084 | 288.126 |
| 11 | 34.627 | 1015.382 | 706.22 | 432.19 | 172.876 | 259.314 |
| 12 | 35.253 | 1037.075 | 715.193 | 384.165 | 153.666 | 230.499 |
| 13 | 35.293 | 975.038 | 677.895 | 356.98 | 142.792 | 214.188 |
| 14 | 34.83 | 830.184 | 590.165 | 343.75 | 137.5 | 206.25 |
| 15 | 33.729 | 624.961 | 456.195 | 335.415 | 134.166 | 201.249 |
| 16 | 32.034 | 381.406 | 279.857 | 336.46 | 134.584 | 201.876 |
| 17 | 29.391 | 144.65 | 107.653 | 356.98 | 142.792 | 214.188 |
| 18 | 27.59 | - | - | 384.165 | 153.666 | 230.499 |
| 19 | 26.339 | - | - | 367.395 | 146.958 | 220.437 |
| 20 | 25.211 | - | - | 336.145 | 134.458 | 201.687 |
| 21 | 24.232 | - | - | 308.96 | 123.584 | 185.376 |
| 22 | 23.496 | - | - | 260.94 | 104.376 | 156.564 |
| 23 | 22.892 | - | - | 215.21 | 86.084 | 129.126 |
Table 2.
Power consumption pattern of direct grid-tied solar PV-based commonly used conventional domestic distribution scheme.
Table 2.
Power consumption pattern of direct grid-tied solar PV-based commonly used conventional domestic distribution scheme.
| Time (h) | Hourly Load Consumption (W) | Solar Power Output (W) | Solar Power Delivered to the Grid after Conversion (W) | Power Loss across Converter (W) |
|---|
| 0 | 192.085 | - | - | - |
| 1 | 175.315 | - | - | - |
| 2 | 164.895 | - | - | - |
| 3 | 164.895 | - | - | - |
| 4 | 192.085 | - | - | - |
| 5 | 240.105 | - | - | - |
| 6 | 381.04 | - | - | - |
| 7 | 432.19 | 140.983 | 62.850 | 78.133 |
| 8 | 434.375 | 360.468 | 233.475 | 126.993 |
| 9 | 478.125 | 538.987 | 395.670 | 143.317 |
| 10 | 480.21 | 632.724 | 482.262 | 150.462 |
| 11 | 432.19 | 706.22 | 549.934 | 156.287 |
| 12 | 384.165 | 715.193 | 558.137 | 157.056 |
| 13 | 356.98 | 677.895 | 523.877 | 154.018 |
| 14 | 343.75 | 590.165 | 442.978 | 147.187 |
| 15 | 335.415 | 456.195 | 319.519 | 136.676 |
| 16 | 336.46 | 279.857 | 164.751 | 115.105 |
| 17 | 356.98 | 107.653 | 43.277 | 64.377 |
| 18 | 384.165 | - | - | - |
| 19 | 367.395 | - | - | - |
| 20 | 336.145 | - | - | - |
| 21 | 308.96 | - | - | - |
| 22 | 260.94 | - | - | - |
| 23 | 215.21 | - | - | - |
| Total | 7754.075 | 5206.34 | 3776.730 | 1429.610 |
Table 3.
Power consumption pattern of solar PV-equipped conventional microgrid-based power distribution scheme.
Table 3.
Power consumption pattern of solar PV-equipped conventional microgrid-based power distribution scheme.
| Time (h) | DC load Demand(W) | AC Load Demand (W) | Solar Power Availability (W) | Solar Power Available at DC Bus after Feeding DC Loads (W) | Solar Power Available at AC Side after Conversion (W) | Power Required to Supply DC Loads Including Conversion loss (W) | Total Power-Driven from the Utility Grid (W) | Power Exported to the Grid (W) | Power Loss across Converter (W) |
|---|
| 0 | 76.83 | 115.25 | - | - | - | 90.39 | 205.64 | - | 13.56 |
| 1 | 70.13 | 105.19 | - | - | - | 82.50 | 187.69 | - | 12.38 |
| 2 | 65.96 | 98.94 | - | - | - | 77.6 | 176.54 | - | 11.64 |
| 3 | 65.96 | 98.94 | - | - | - | 77.6 | 176.54 | - | 11.64 |
| 4 | 76.83 | 115.25 | - | - | - | 90.39 | 205.64 | - | 13.56 |
| 5 | 96.04 | 144.06 | - | - | - | 112.99 | 257.05 | - | 16.95 |
| 6 | 152.42 | 228.62 | - | - | - | 169.35 | 397.98 | - | 16.94 |
| 7 | 172.88 | 259.31 | 140.98 | - | - | 37.52 | 296.84 | - | 5.63 |
| 8 | 173.75 | 260.63 | 360.47 | 186.72 | 93.27 | - | 167.4 | - | 93.45 |
| 9 | 191.25 | 286.88 | 538.99 | 347.74 | 222.34 | - | 64.53 | - | 125.4 |
| 10 | 192.08 | 288.13 | 632.72 | 440.64 | 305.36 | - | 0 | 17.24 | 135.28 |
| 11 | 172.88 | 259.31 | 706.22 | 533.34 | 390.46 | - | 0 | 131.15 | 142.88 |
| 12 | 153.67 | 230.5 | 715.19 | 561.53 | 416.49 | - | 0 | 185.99 | 145.04 |
| 13 | 142.79 | 214.19 | 677.9 | 535.10 | 392.07 | - | 0 | 177.88 | 143.03 |
| 14 | 137.5 | 206.25 | 590.17 | 452.67 | 316.32 | - | 0 | 110.07 | 136.34 |
| 15 | 134.17 | 201.25 | 456.2 | 322.03 | 200.11 | - | 1.140 | - | 121.92 |
| 16 | 134.58 | 201.88 | 279.86 | 145.27 | 65.53 | - | 136.34 | - | 79.740 |
| 17 | 142.79 | 214.19 | 107.65 | - | - | 41.34 | 255.53 | - | 6.20 |
| 18 | 153.67 | 230.5 | - | - | - | 170.74 | 401.24 | - | 17.07 |
| 19 | 146.96 | 220.44 | - | - | - | 163.29 | 383.72 | - | 16.33 |
| 20 | 134.46 | 201.69 | - | - | - | 149.4 | 351.09 | - | 14.94 |
| 21 | 123.58 | 185.38 | - | - | - | 137.32 | 322.69 | - | 13.73 |
| 22 | 104.38 | 156.56 | - | - | - | 115.98 | 272.54 | - | 11.6 |
| 23 | 86.08 | 129.13 | - | - | - | 101.28 | 230.40 | - | 15.19 |
| | | | | | Total | 4490.49 | 622.33 | 1320.43 |
Table 4.
Time-of-use tariff detail.
Table 4.
Time-of-use tariff detail.
| Time | Tariff (Rs) |
|---|
| 0–6 | 4 |
| 7–10 | 6 |
| 11–16 | 5 |
| 17–22 | 6 |
| 23–24 | 4 |
Table 5.
Power consumption pattern of proposed IPCEA-based microgrid-supported power distribution scheme.
Table 5.
Power consumption pattern of proposed IPCEA-based microgrid-supported power distribution scheme.
| Time Period (h) | DC Load Consumption (W) | AC Load Consumption (W) | Solar Power Available at DC Bus after Feeding DC Loads (W) | Solar Power Fed to Battery for Charging (W) | Solar Power Transferred to AC Terminals after Conversion (W) | DC Power Required at DC Terminals Fed by Battery (W) | Net Power-Driven from the Utility Grid (W) | Power Exported to the Grid (W) | Power Loss across Converter (W) |
|---|
| 0 | 76.83 | 115.25 | - | - | - | 76.834 | 115.251 | - | - |
| 1 | 70.13 | 105.19 | - | - | - | 70.126 | 105.189 | - | - |
| 2 | 65.96 | 98.94 | - | - | - | 65.958 | 98.937 | - | - |
| 3 | 65.96 | 98.94 | - | - | - | 65.958 | 98.937 | - | - |
| 4 | 76.83 | 115.25 | - | - | - | 76.834 | 115.251 | - | - |
| 5 | 96.04 | 144.06 | - | - | - | 96.042 | 144.063 | - | - |
| 6 | 152.42 | 228.62 | - | - | - | 152.42 | 228.624 | - | - |
| 7 | 172.88 | 259.31 | - | - | - | 31.893 | 259.314 | - | - |
| 8 | 173.75 | 260.63 | 186.72 | 186.72 | - | - | 260.63 | - | - |
| 9 | 191.25 | 286.88 | 347.74 | 347.74 | - | - | 286.875 | - | - |
| 10 | 192.08 | 288.13 | 440.64 | 440.64 | - | - | 288.126 | - | - |
| 11 | 172.88 | 259.31 | 533.34 | - | 390.464 | - | - | 131.15 | 142.883 |
| 12 | 153.67 | 230.5 | 561.53 | - | 416.485 | - | - | 185.99 | 145.04 |
| 13 | 142.79 | 214.19 | 535.10 | - | 392.07 | - | - | 177.88 | 143.03 |
| 14 | 137.5 | 206.25 | 452.67 | - | 316.32 | - | - | 110.07 | 136.34 |
| 15 | 134.17 | 201.25 | 322.03 | 322.03 | - | - | 201.25 | - | - |
| 16 | 134.58 | 201.88 | 145.27 | 145.27 | - | - | 201.88 | - | - |
| 17 | 142.8 | 214.19 | - | - | - | 35.14 | 214.19 | - | - |
| 18 | 153.67 | 230.5 | - | - | - | 153.67 | 230.5 | - | - |
| 19 | 146.96 | 220.44 | - | - | - | 146.96 | 220.44 | - | - |
| 20 | 134.46 | 201.69 | - | - | - | 134.46 | 201.69 | - | - |
| 21 | 123.58 | 185.38 | - | - | - | 123.58 | 185.38 | - | - |
| 22 | 104.38 | 156.56 | - | - | - | 104.38 | 156.56 | - | - |
| 23 | 86.08 | 129.13 | - | - | - | 86.084 | 129.13 | - | - |
| | | | Total | 3742.2 | 605.09 | 567.3 |
Table 6.
Cost of electricity drawn by various schemes.
Table 6.
Cost of electricity drawn by various schemes.
| Time Period (h) | Conventional
Scheme | Conventional Solar PV Scheme | Conventional Microgrid EMS Scheme | Proposed GA Based EMS Scheme |
|---|
| Hourly Load Consumption (W) | Cost of Electricity (Rs) | Hourly Load Consumption (W) | Cost of Electricity (Rs) | Total Power Driven from Utility Grid (W) | Cost of Electricity (Rs) | Net Power Driven from Utility Grid (W) | Cost of Electricity (Rs) |
|---|
| 0 | 192.09 | 0.77 | 192.09 | 0.77 | 205.64 | 0.82 | 115.25 | 0.46 |
| 1 | 175.32 | 0.70 | 175.32 | 0.70 | 187.69 | 0.75 | 105.19 | 0.42 |
| 2 | 164.90 | 0.66 | 164.90 | 0.66 | 176.54 | 0.71 | 98.94 | 0.40 |
| 3 | 164.90 | 0.66 | 164.90 | 0.66 | 176.54 | 0.71 | 98.94 | 0.40 |
| 4 | 192.09 | 0.77 | 192.09 | 0.77 | 205.64 | 0.82 | 115.25 | 0.46 |
| 5 | 240.11 | 0.96 | 240.11 | 0.96 | 257.05 | 1.03 | 144.06 | 0.58 |
| 6 | 381.04 | 1.52 | 381.04 | 1.52 | 397.98 | 1.59 | 228.62 | 0.91 |
| 7 | 432.19 | 2.59 | 369.34 | 2.22 | 296.84 | 1.78 | 259.31 | 1.56 |
| 8 | 434.38 | 2.61 | 200.90 | 1.21 | 167.36 | 1.00 | 260.63 | 1.56 |
| 9 | 478.13 | 2.87 | 82.46 | 0.49 | 64.53 | 0.39 | 286.88 | 1.72 |
| 10 | 480.21 | 2.88 | 0.00 | 0.00 | 0.00 | 0.00 | 288.13 | 1.73 |
| 11 | 432.19 | 2.16 | 0.00 | 0.00 | 0.00 | 0.00 | 0.00 | 0.00 |
| 12 | 384.17 | 1.92 | 0.00 | 0.00 | 0.00 | 0.00 | 0.00 | 0.00 |
| 13 | 356.98 | 1.78 | 0.00 | 0.00 | 0.00 | 0.00 | 0.00 | 0.00 |
| 14 | 343.75 | 1.72 | 0.00 | 0.00 | 0.00 | 0.00 | 0.00 | 0.00 |
| 15 | 335.42 | 1.68 | 13.84 | 0.07 | 1.14 | 0.01 | 70.10 | 0.35 |
| 16 | 336.46 | 1.68 | 53.97 | 0.27 | 136.34 | 0.68 | 15.89 | 0.08 |
| 17 | 356.98 | 2.14 | 139.73 | 0.84 | 255.53 | 1.53 | 36.31 | 0.22 |
| 18 | 384.17 | 2.30 | 217.27 | 1.30 | 401.24 | 2.41 | 120.43 | 0.72 |
| 19 | 367.40 | 2.20 | 268.17 | 1.61 | 383.72 | 2.30 | 220.44 | 1.32 |
| 20 | 336.15 | 2.02 | 336.15 | 2.02 | 351.09 | 2.11 | 201.69 | 1.21 |
| 21 | 308.96 | 1.85 | 308.96 | 1.85 | 322.69 | 1.94 | 185.38 | 1.11 |
| 22 | 260.94 | 1.57 | 260.94 | 1.57 | 272.54 | 1.64 | 156.56 | 0.94 |
| 23 | 215.21 | 0.86 | 215.21 | 0.86 | 230.40 | 0.92 | 129.13 | 0.52 |
| Total | 7754.08 | 40.88 | 3977.35 | 20.35 | 4490.49 | 23.13 | 3137.11 | 16.67 |
Table 7.
Comparison of beneficial features of the proposed scheme.
Table 7.
Comparison of beneficial features of the proposed scheme.
| Schemes | Net Power Consumed from Utility Grid/Month | Energy Savings due to Solar PV/Month | Electricity Charges/Month |
|---|
| Conventional scheme | 232,622.3 | - | 1226.527 |
| Direct Grid-Tied Solar PV scheme | 119,320.4 | 130,306.8 | 610.35 |
| Conventional Microgrid EMS scheme | 134,714.8 | 154,842.6 | 693.9154 |
| Proposed GA based scheme | 94,113.21 | 153,023.7 | 499.9768 |
| Publisher’s Note: MDPI stays neutral with regard to jurisdictional claims in published maps and institutional affiliations. |
© 2021 by the authors. Licensee MDPI, Basel, Switzerland. This article is an open access article distributed under the terms and conditions of the Creative Commons Attribution (CC BY) license (https://creativecommons.org/licenses/by/4.0/).


 ,
, 


