
Urban Soundscape Assessment by Visually Impaired People: First Methodological Approach in Granada (Spain)

 ,
,  ,
,  ,
,  , ,
, ,  and
and 
Abstract
:1. Introduction
1.1. Urban Design and Sound Perception in Context
1.2. Inclusive Soundscape Assessments: The Case of Visually Impaired People
1.3. A First Methodological Approach
2. Methodological Protocol Revision
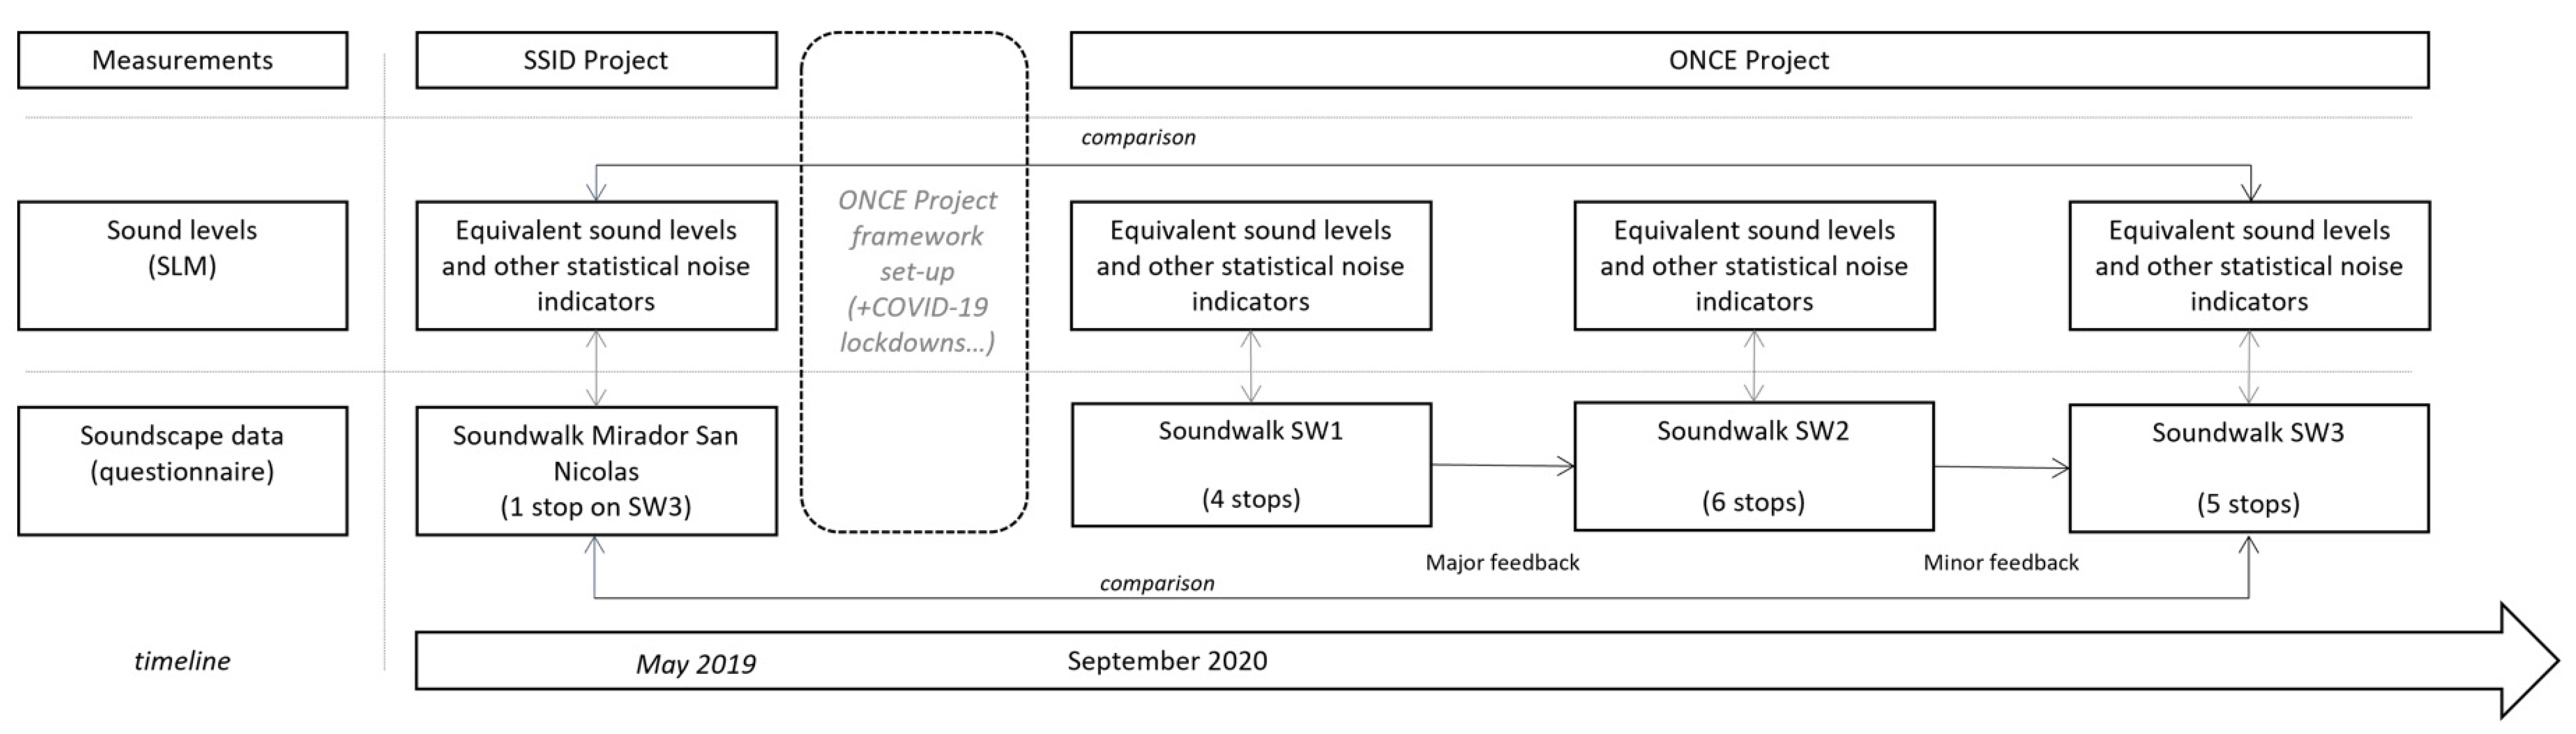
2.1. Agreement with ONCE and Project Outline
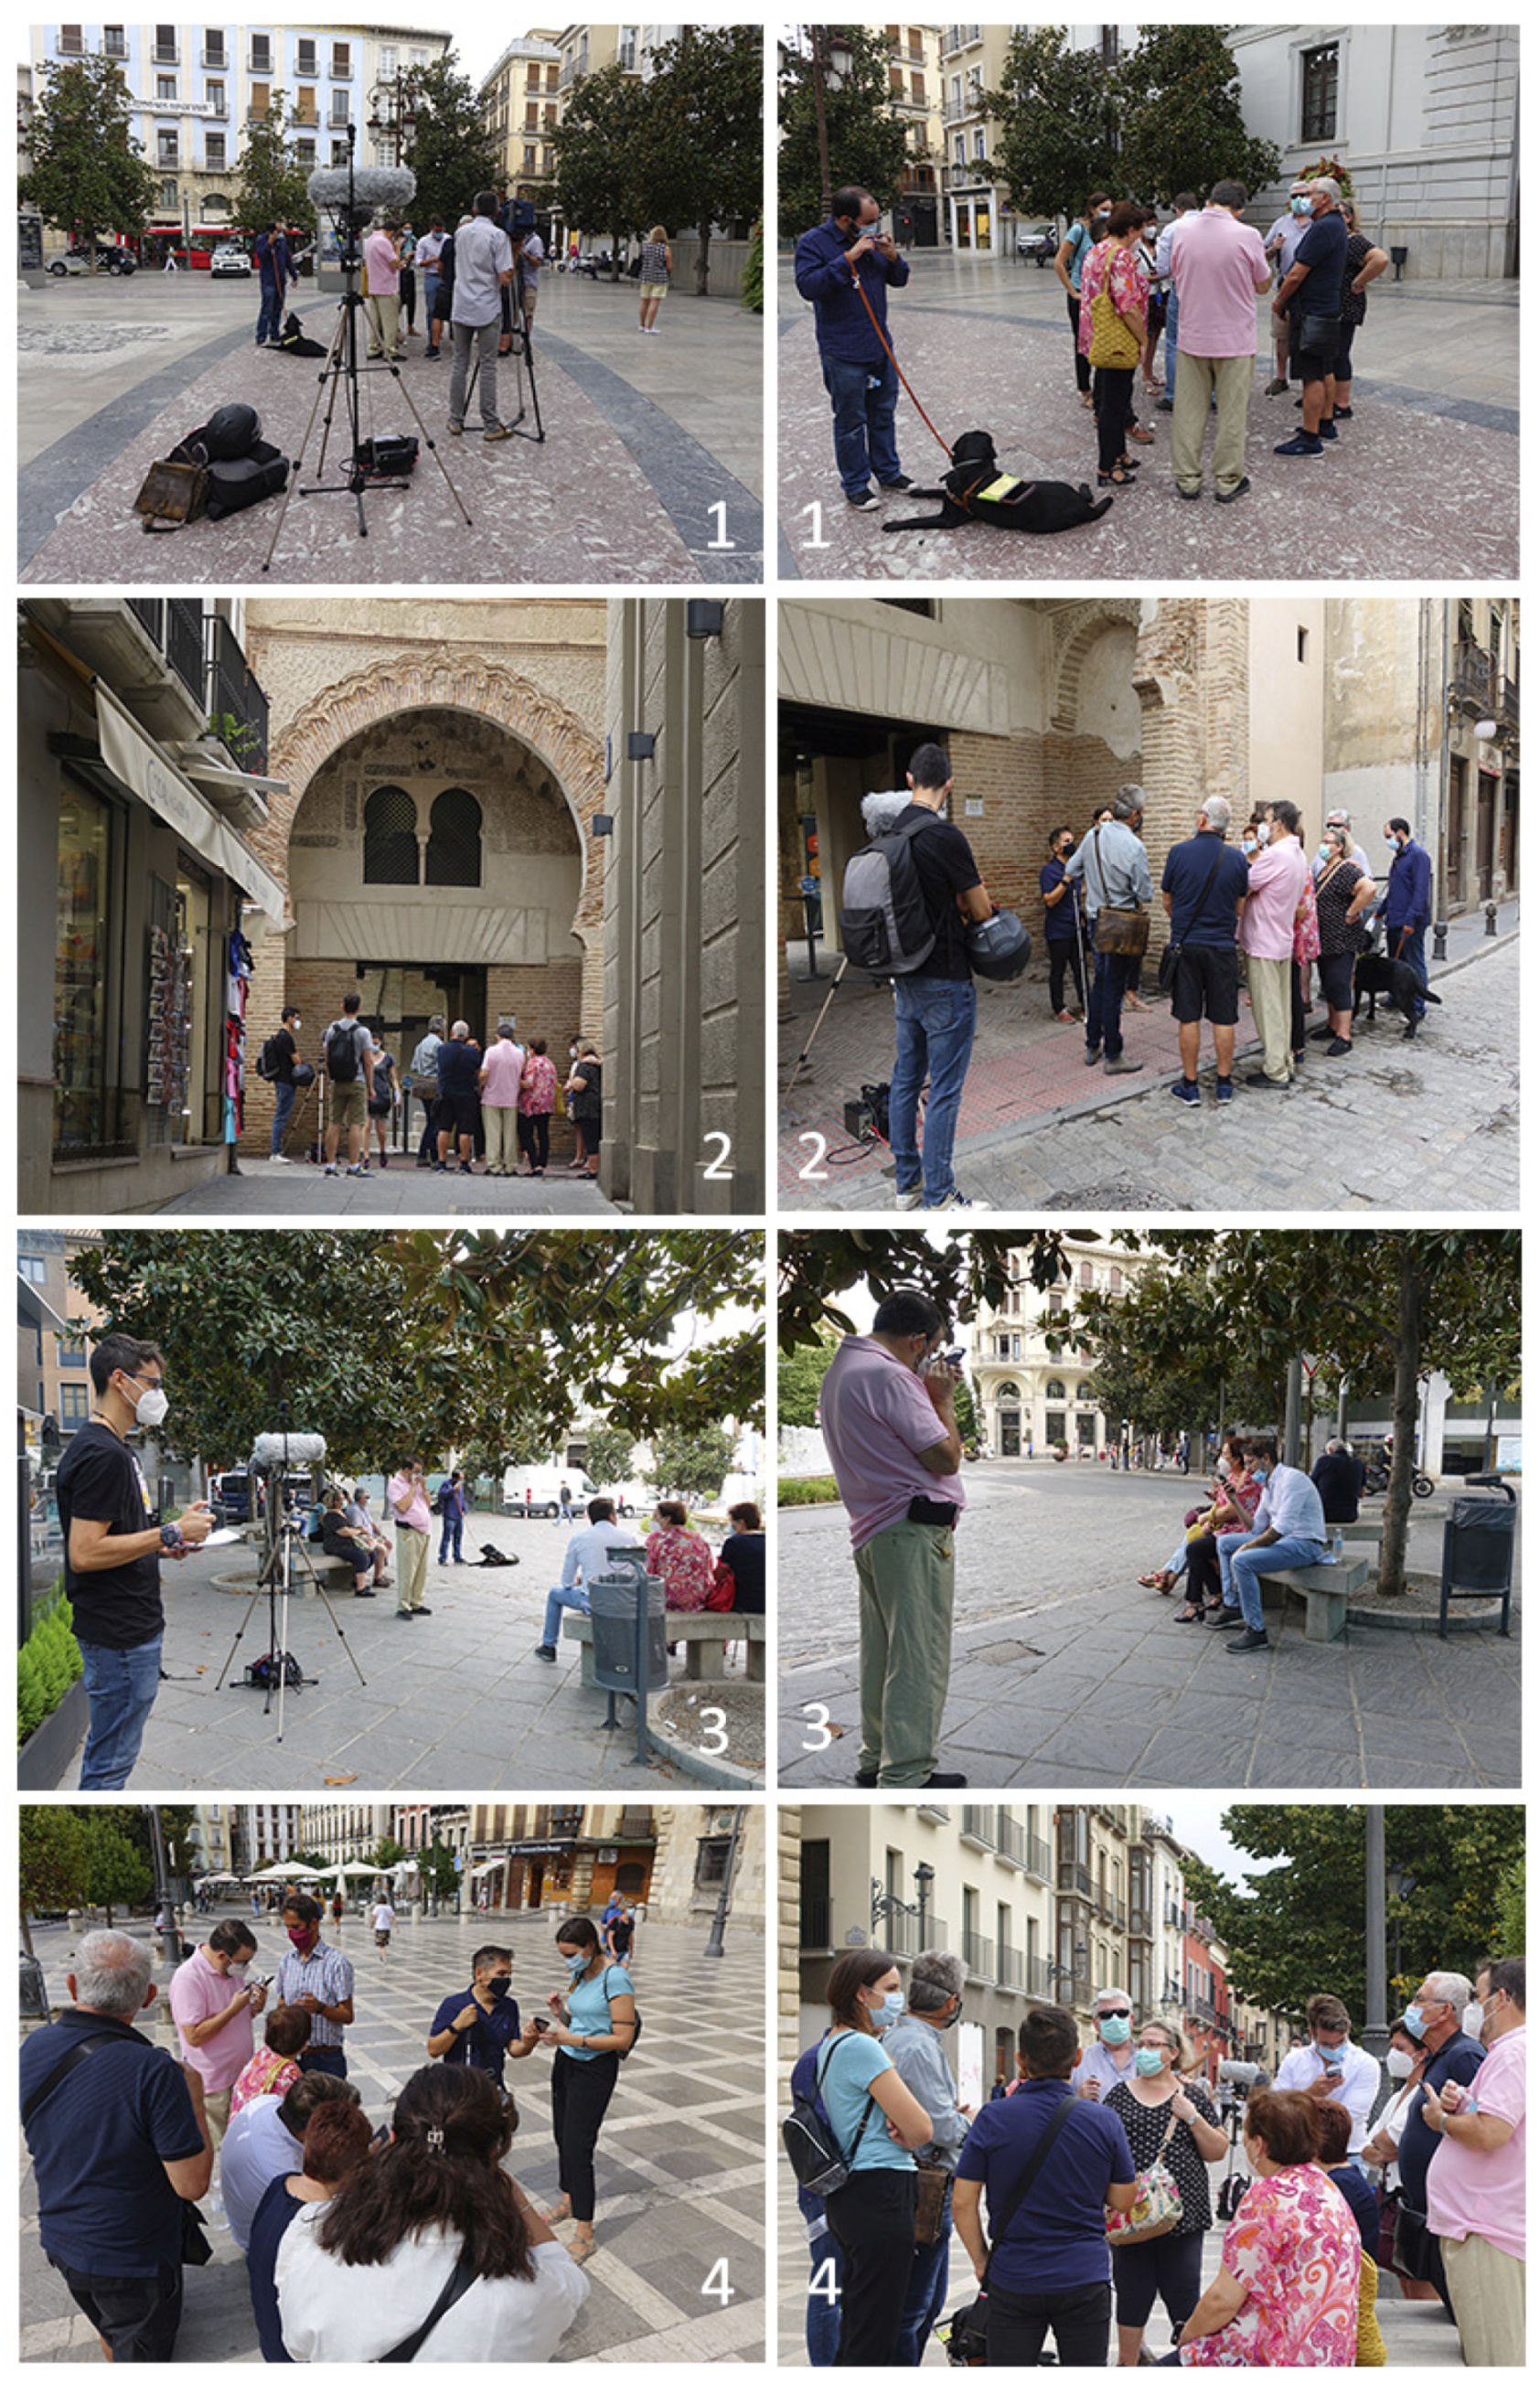
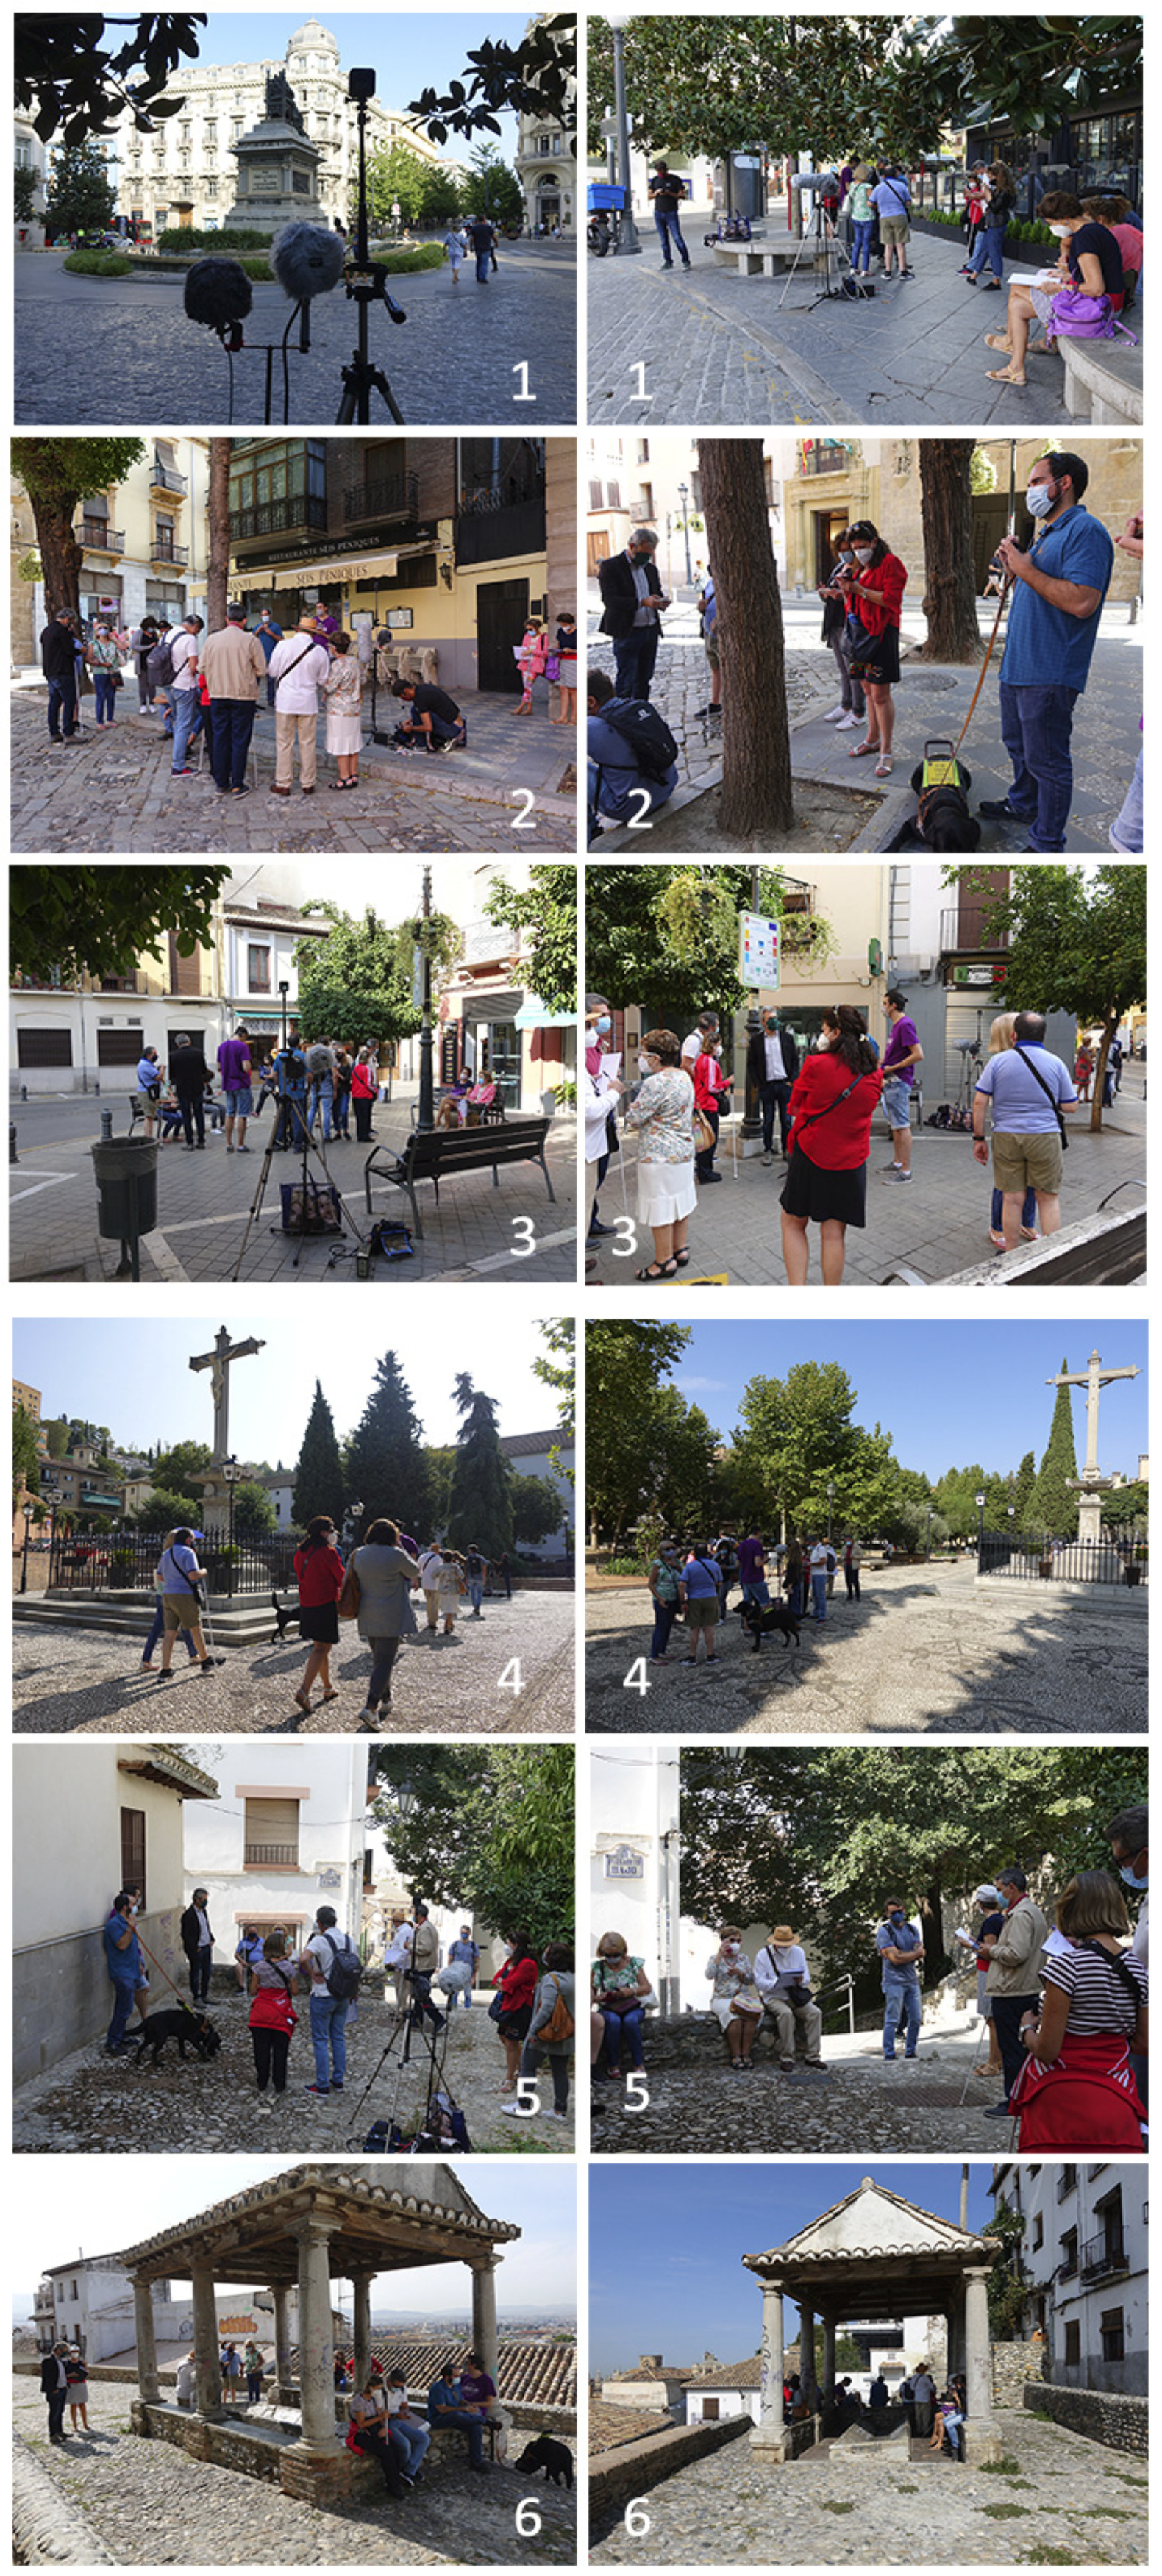
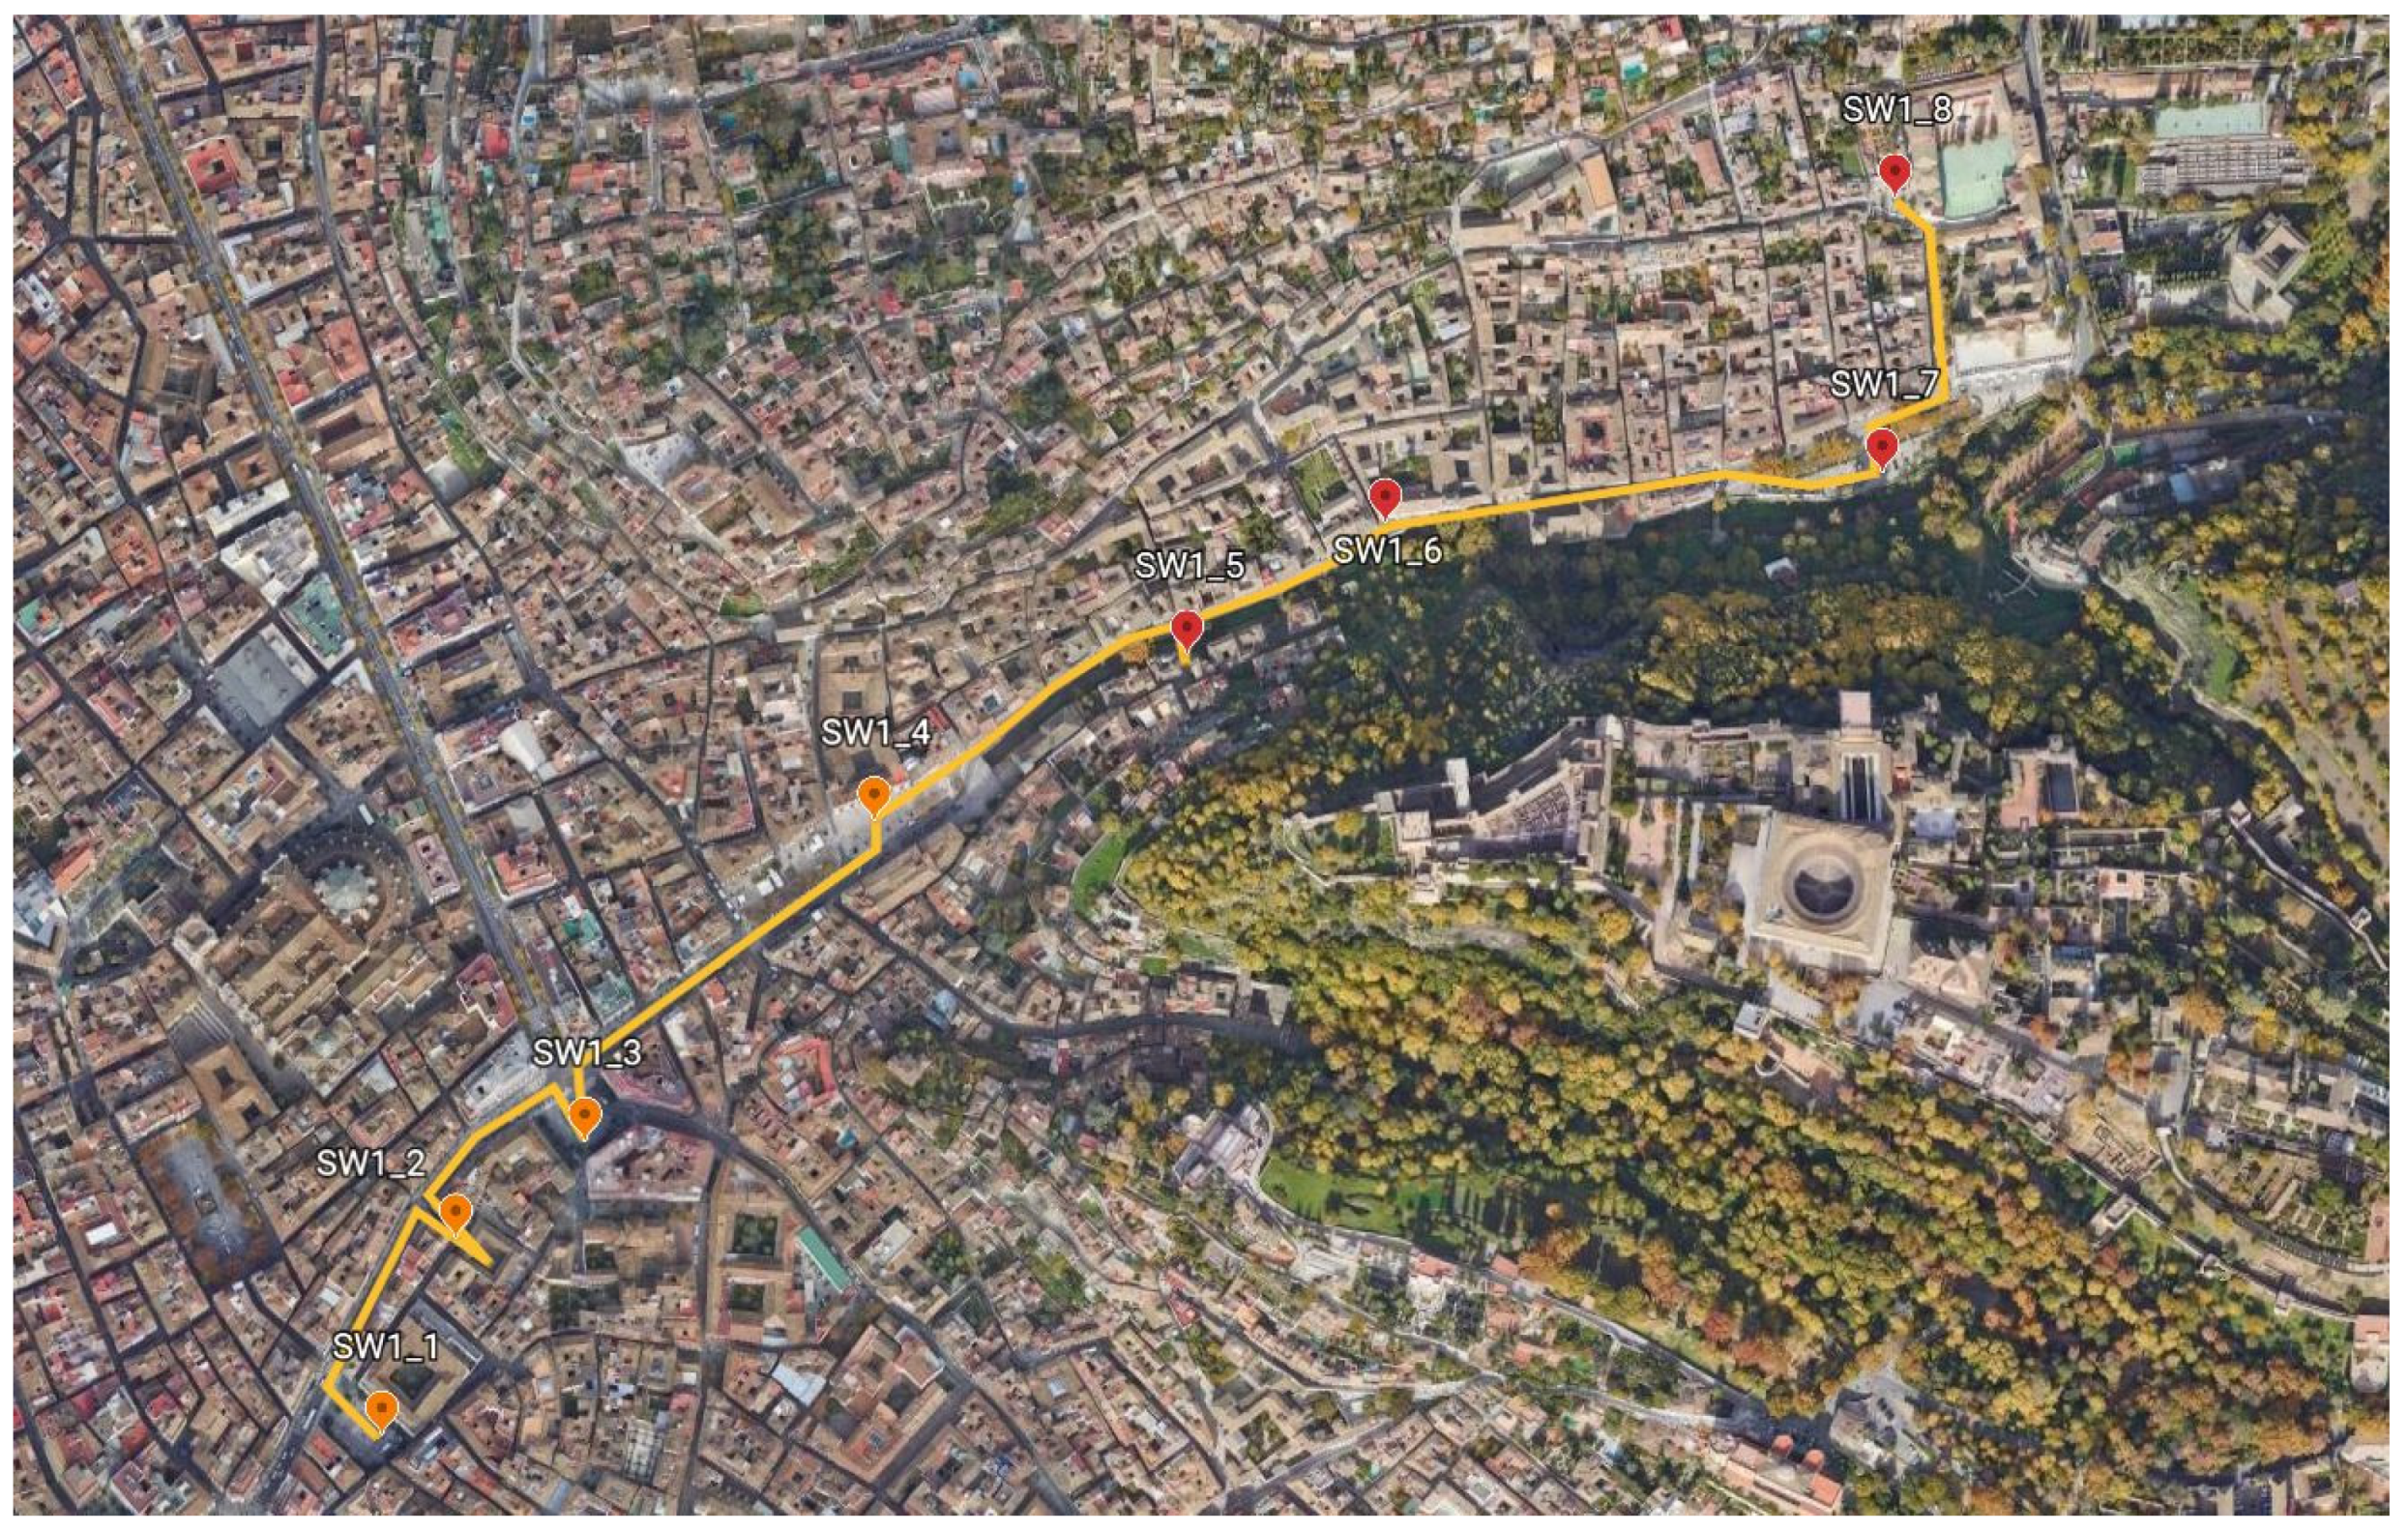
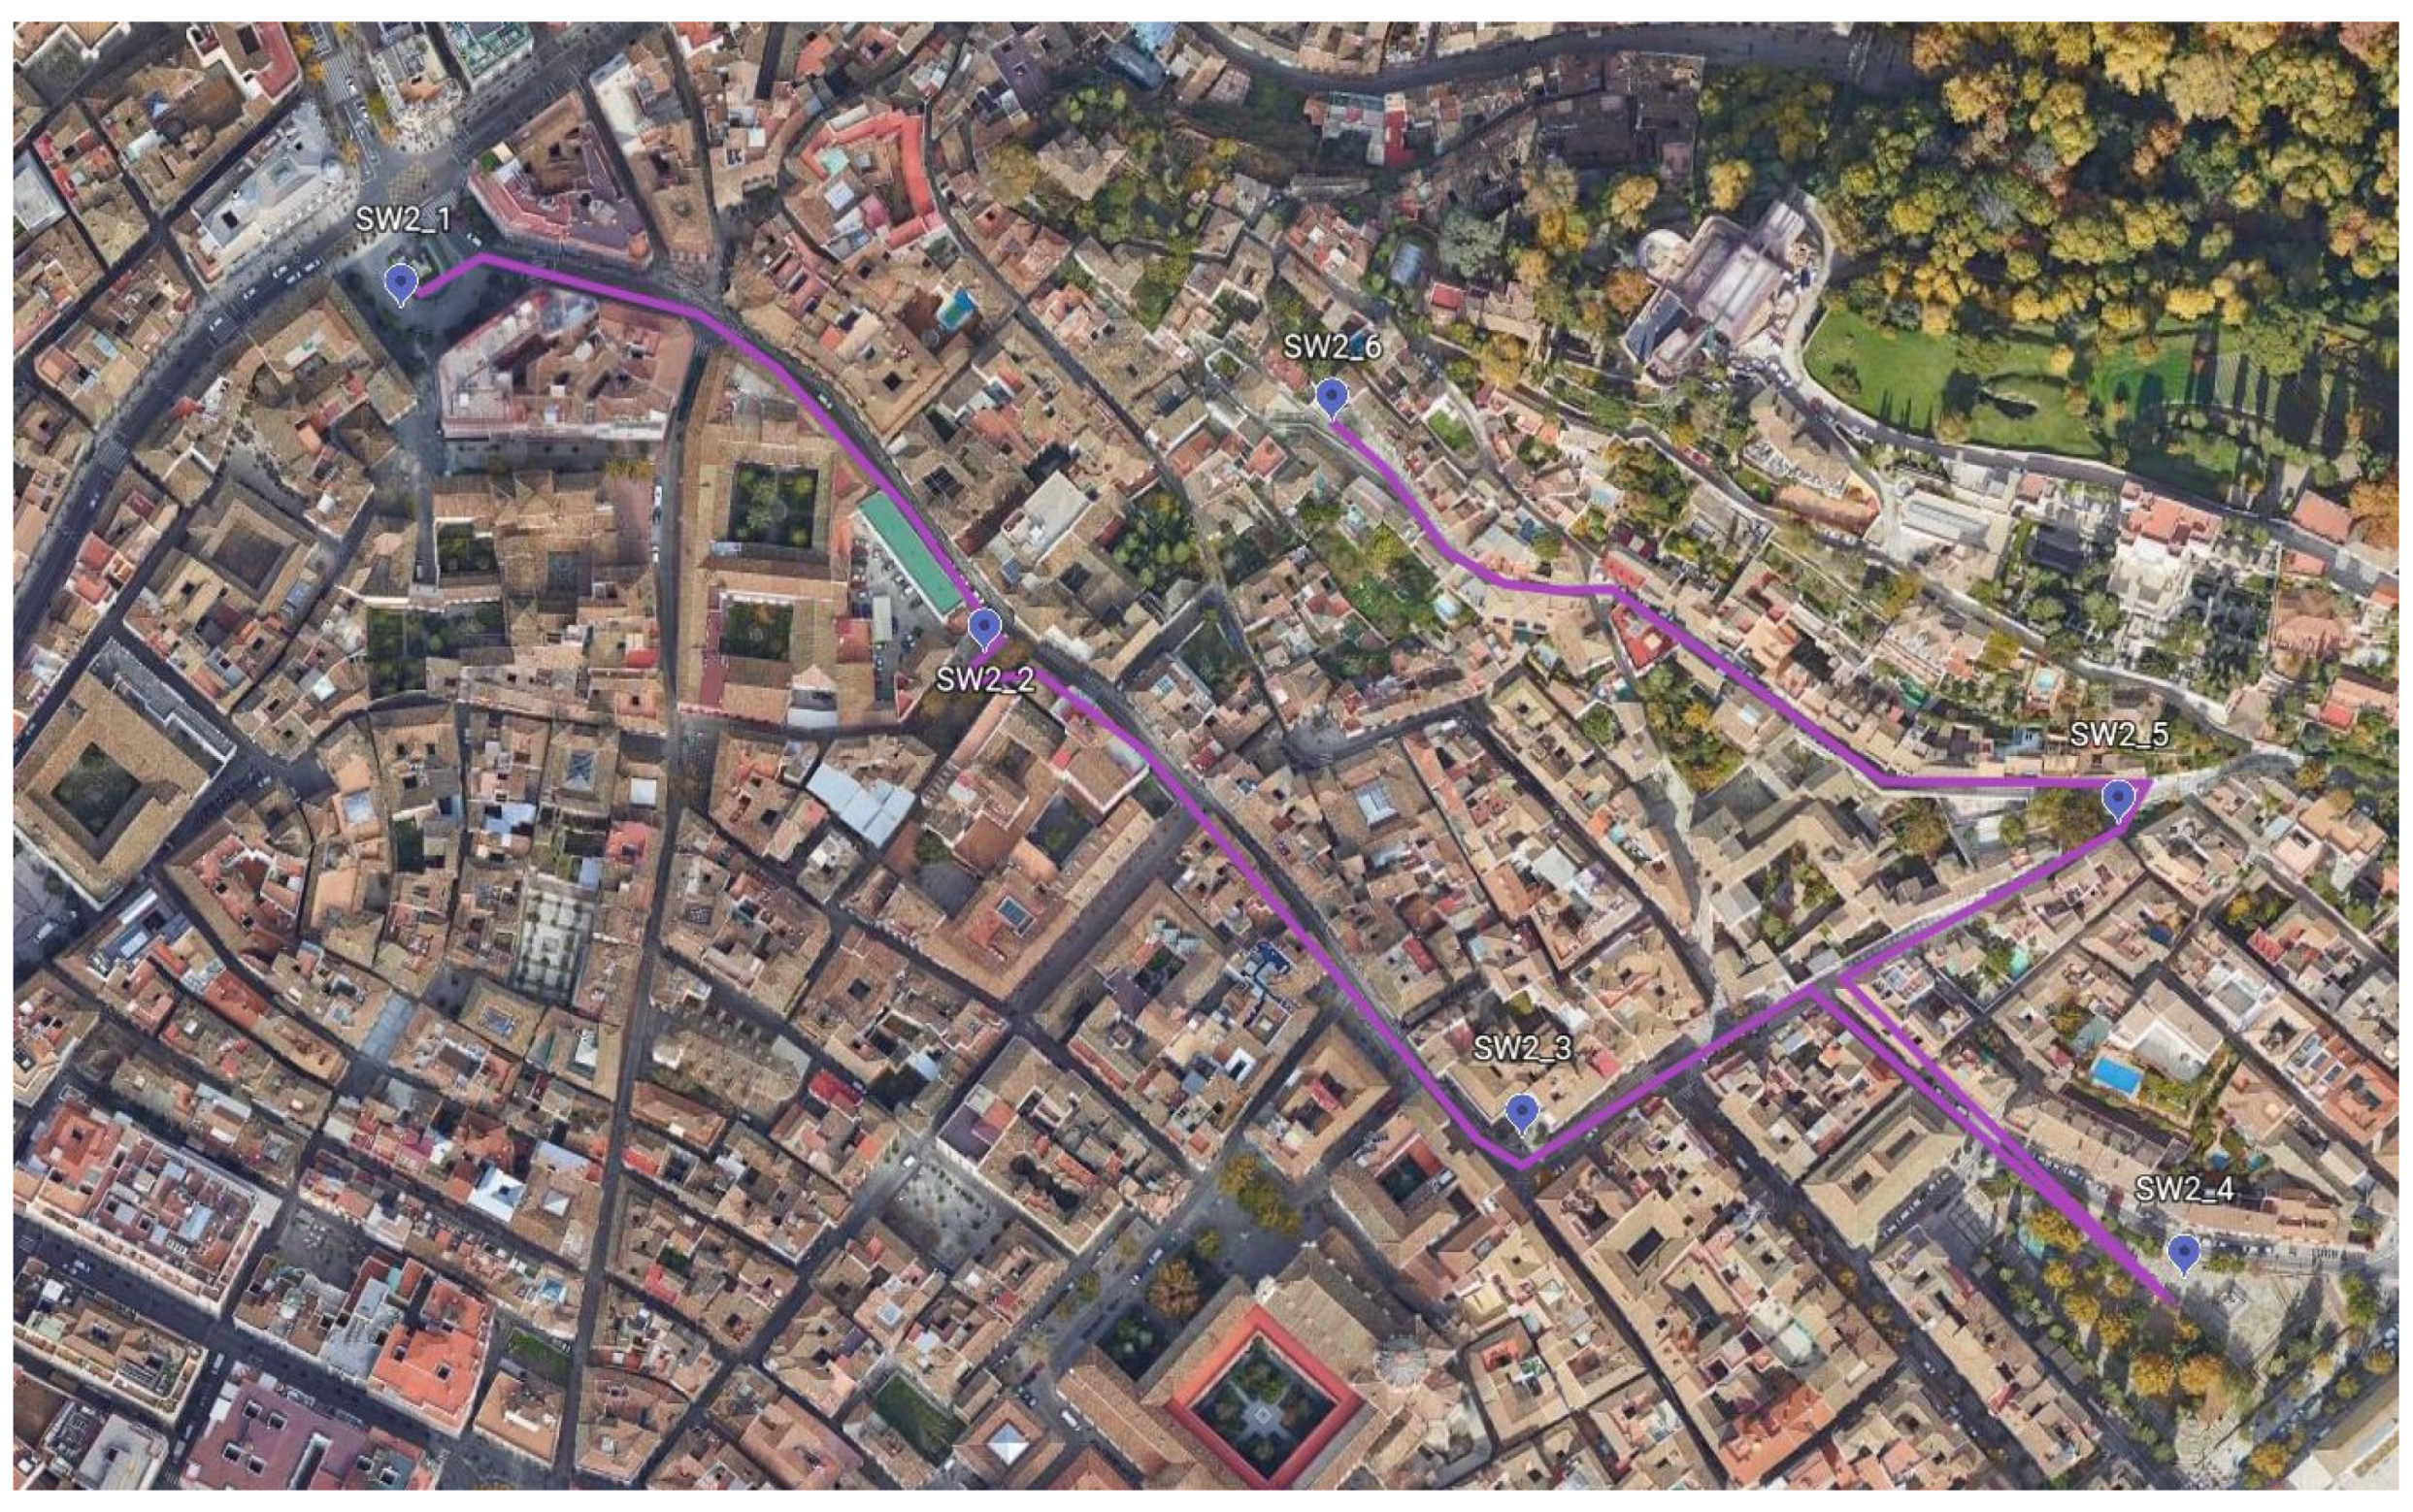
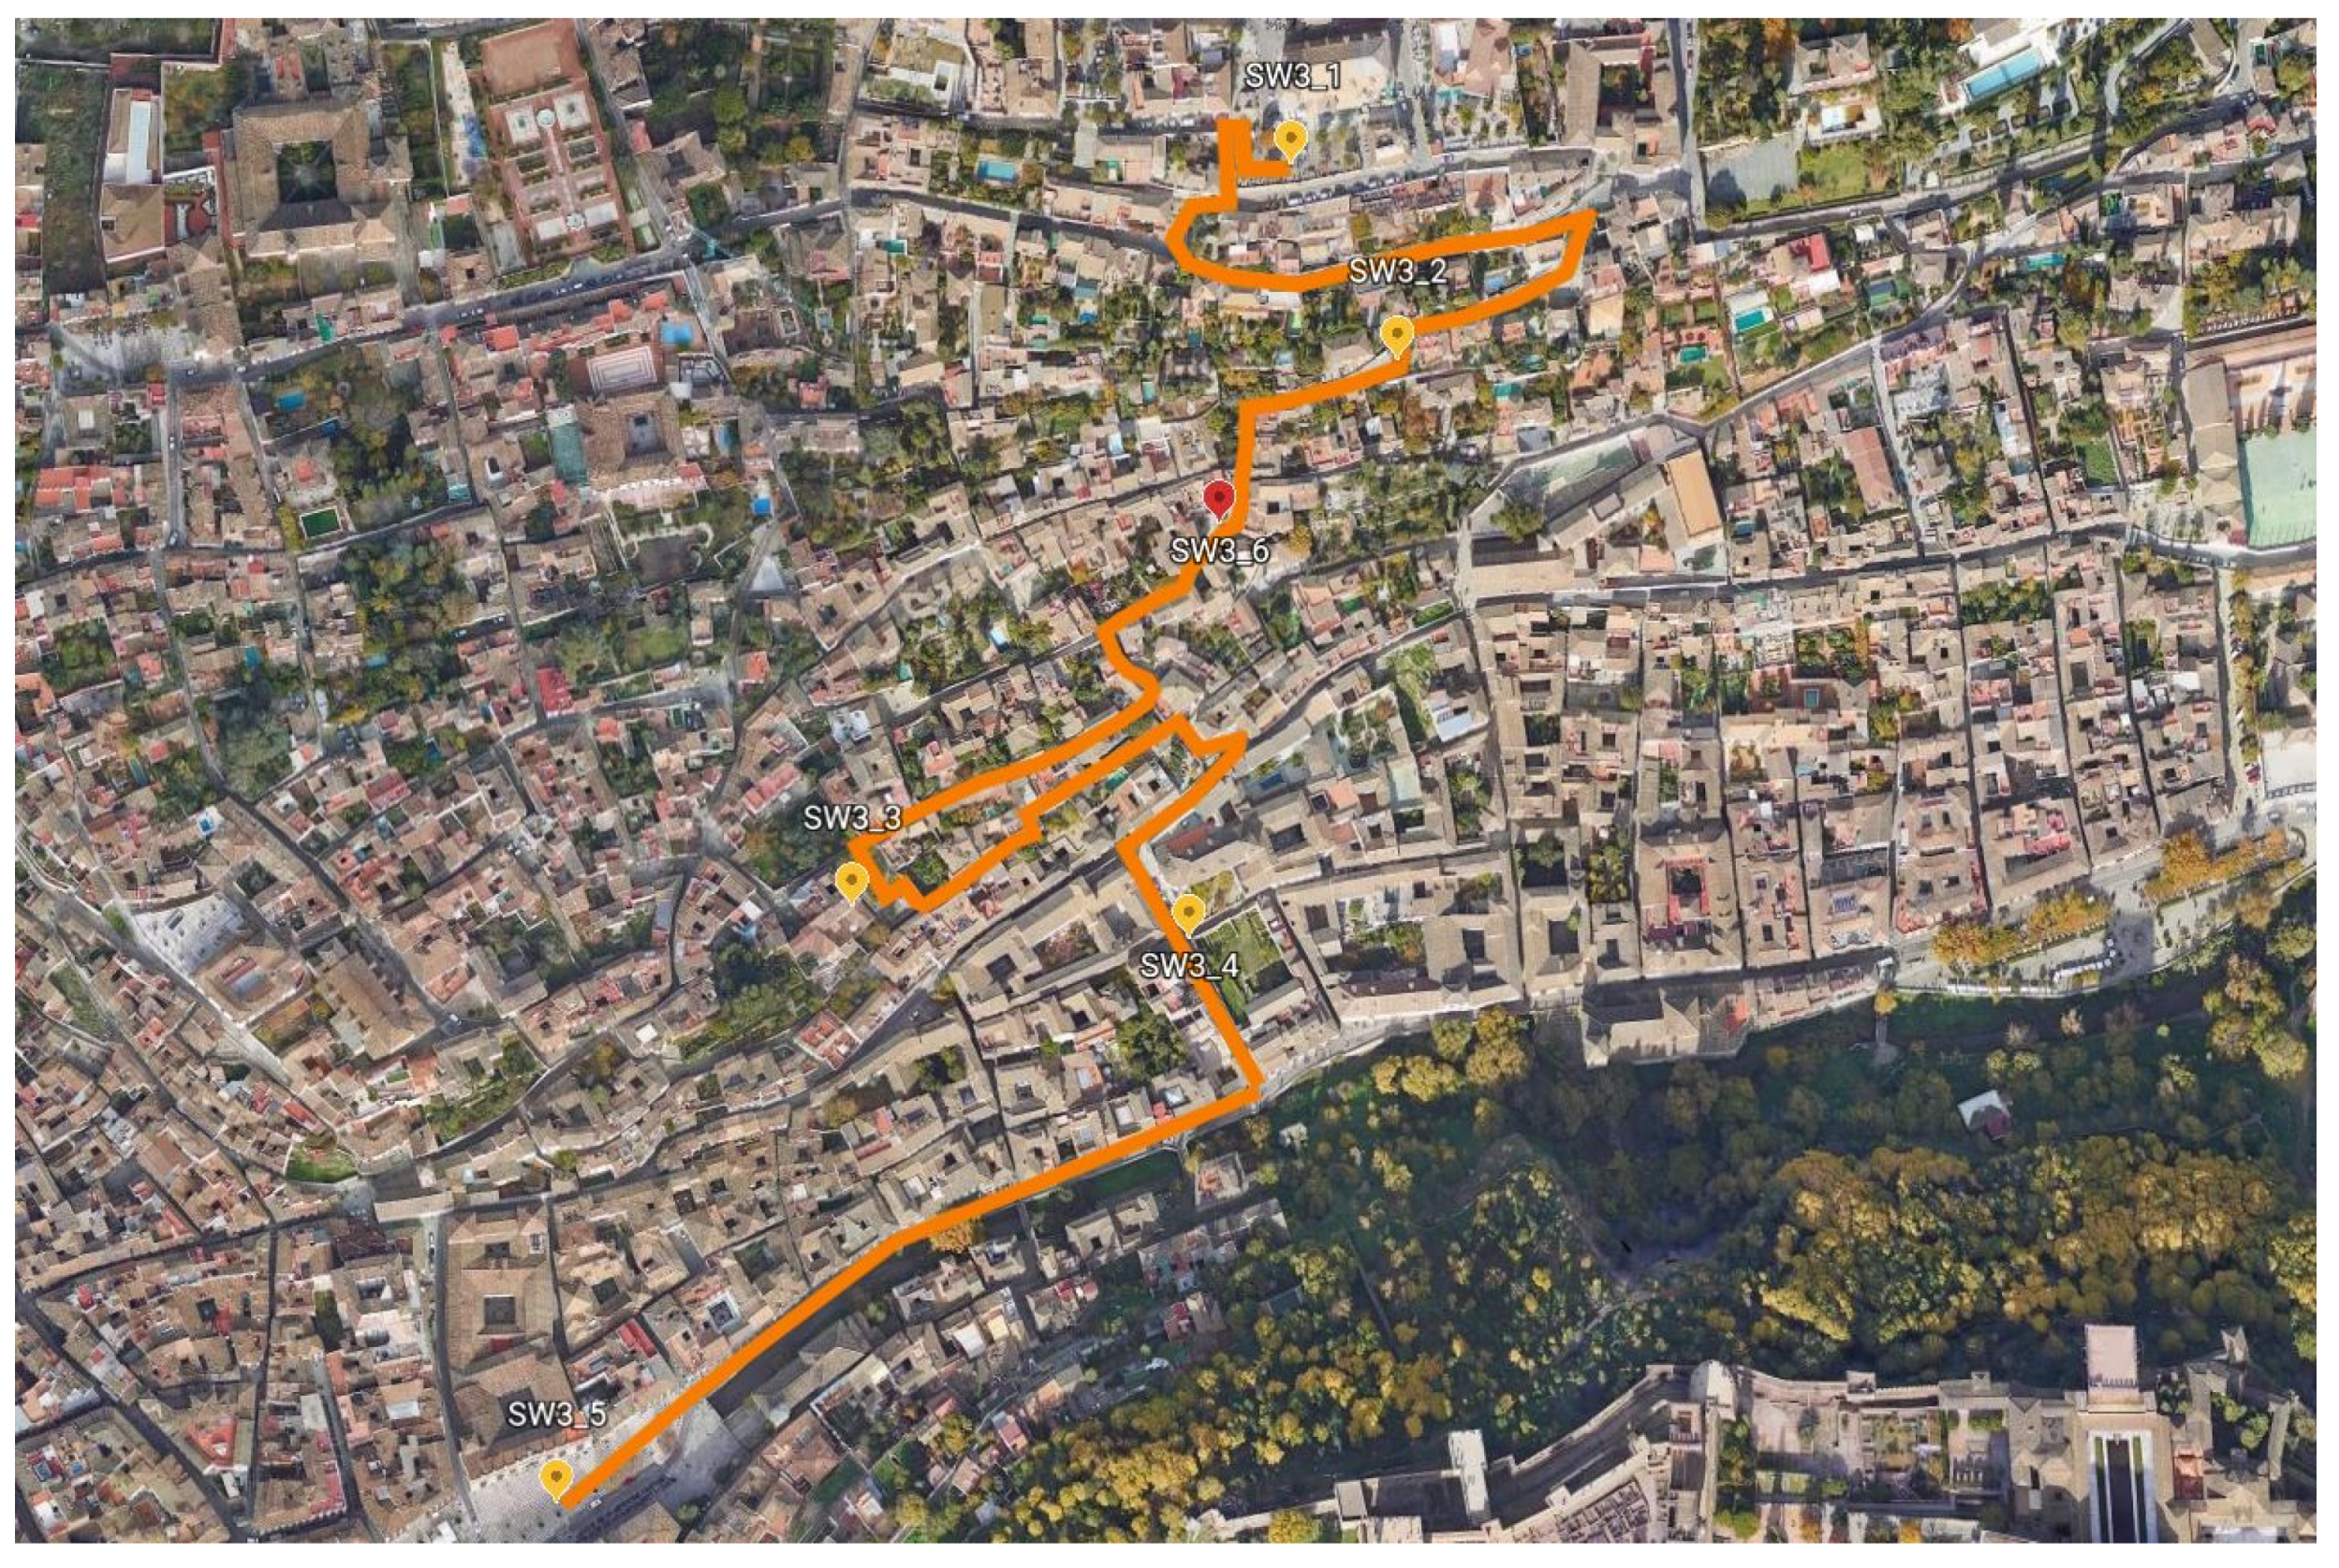
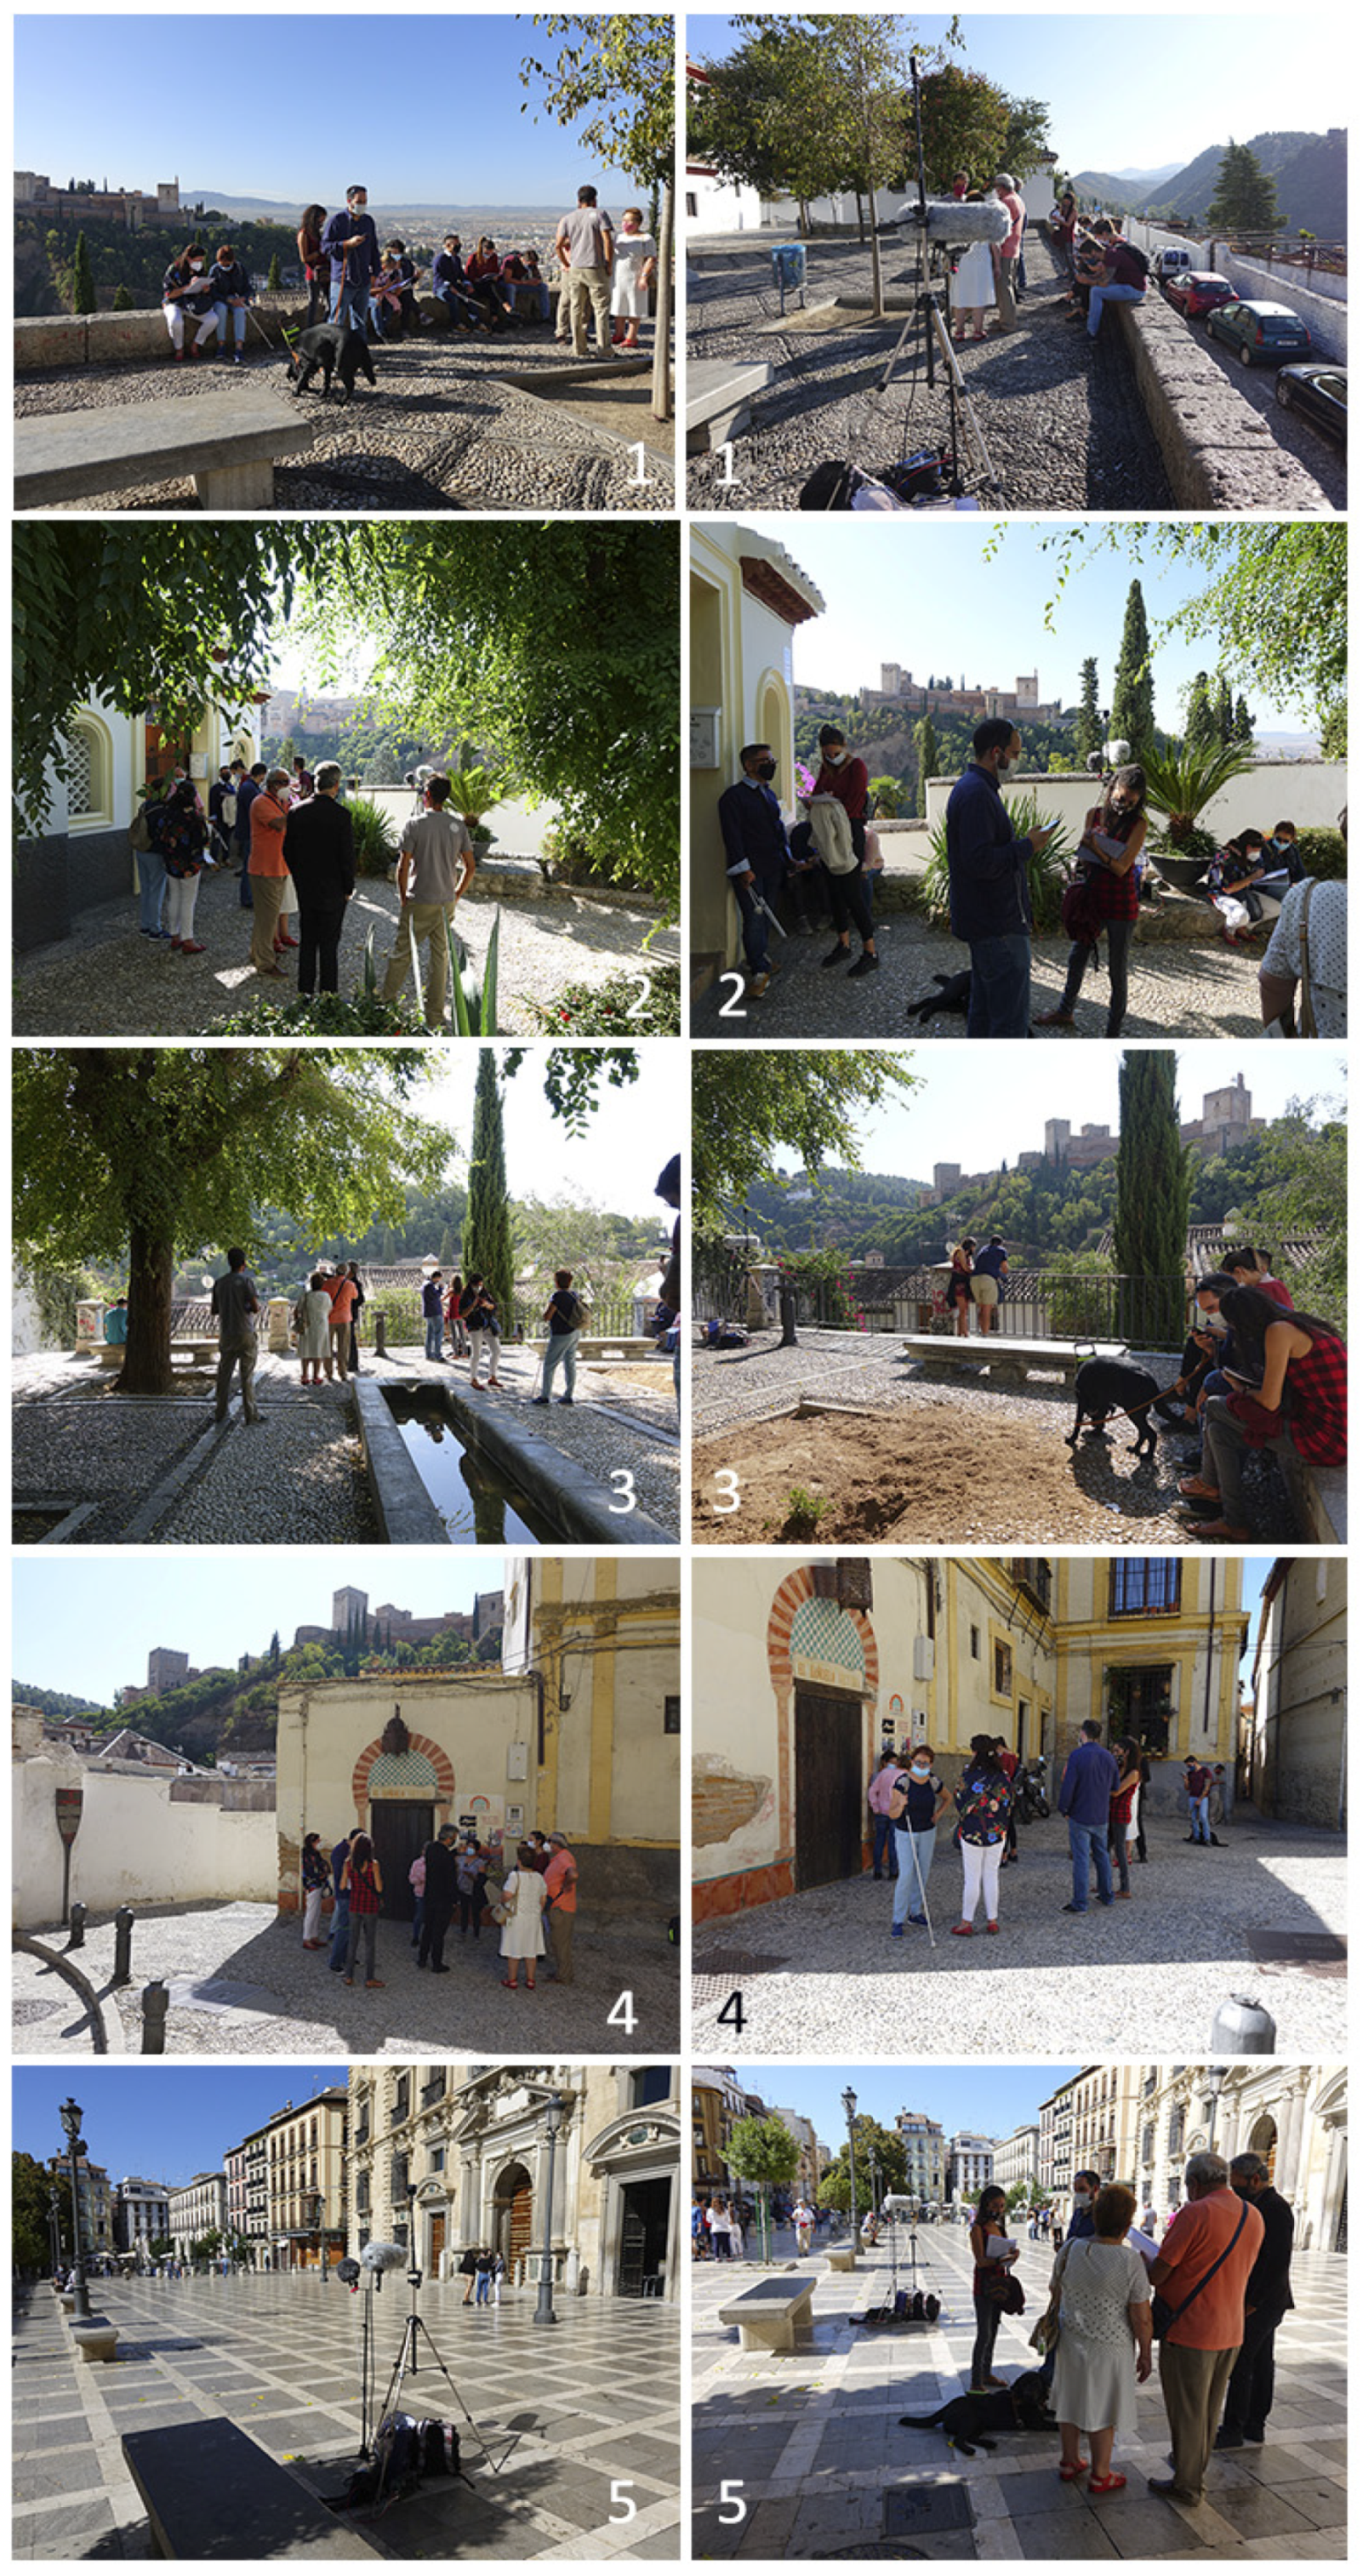
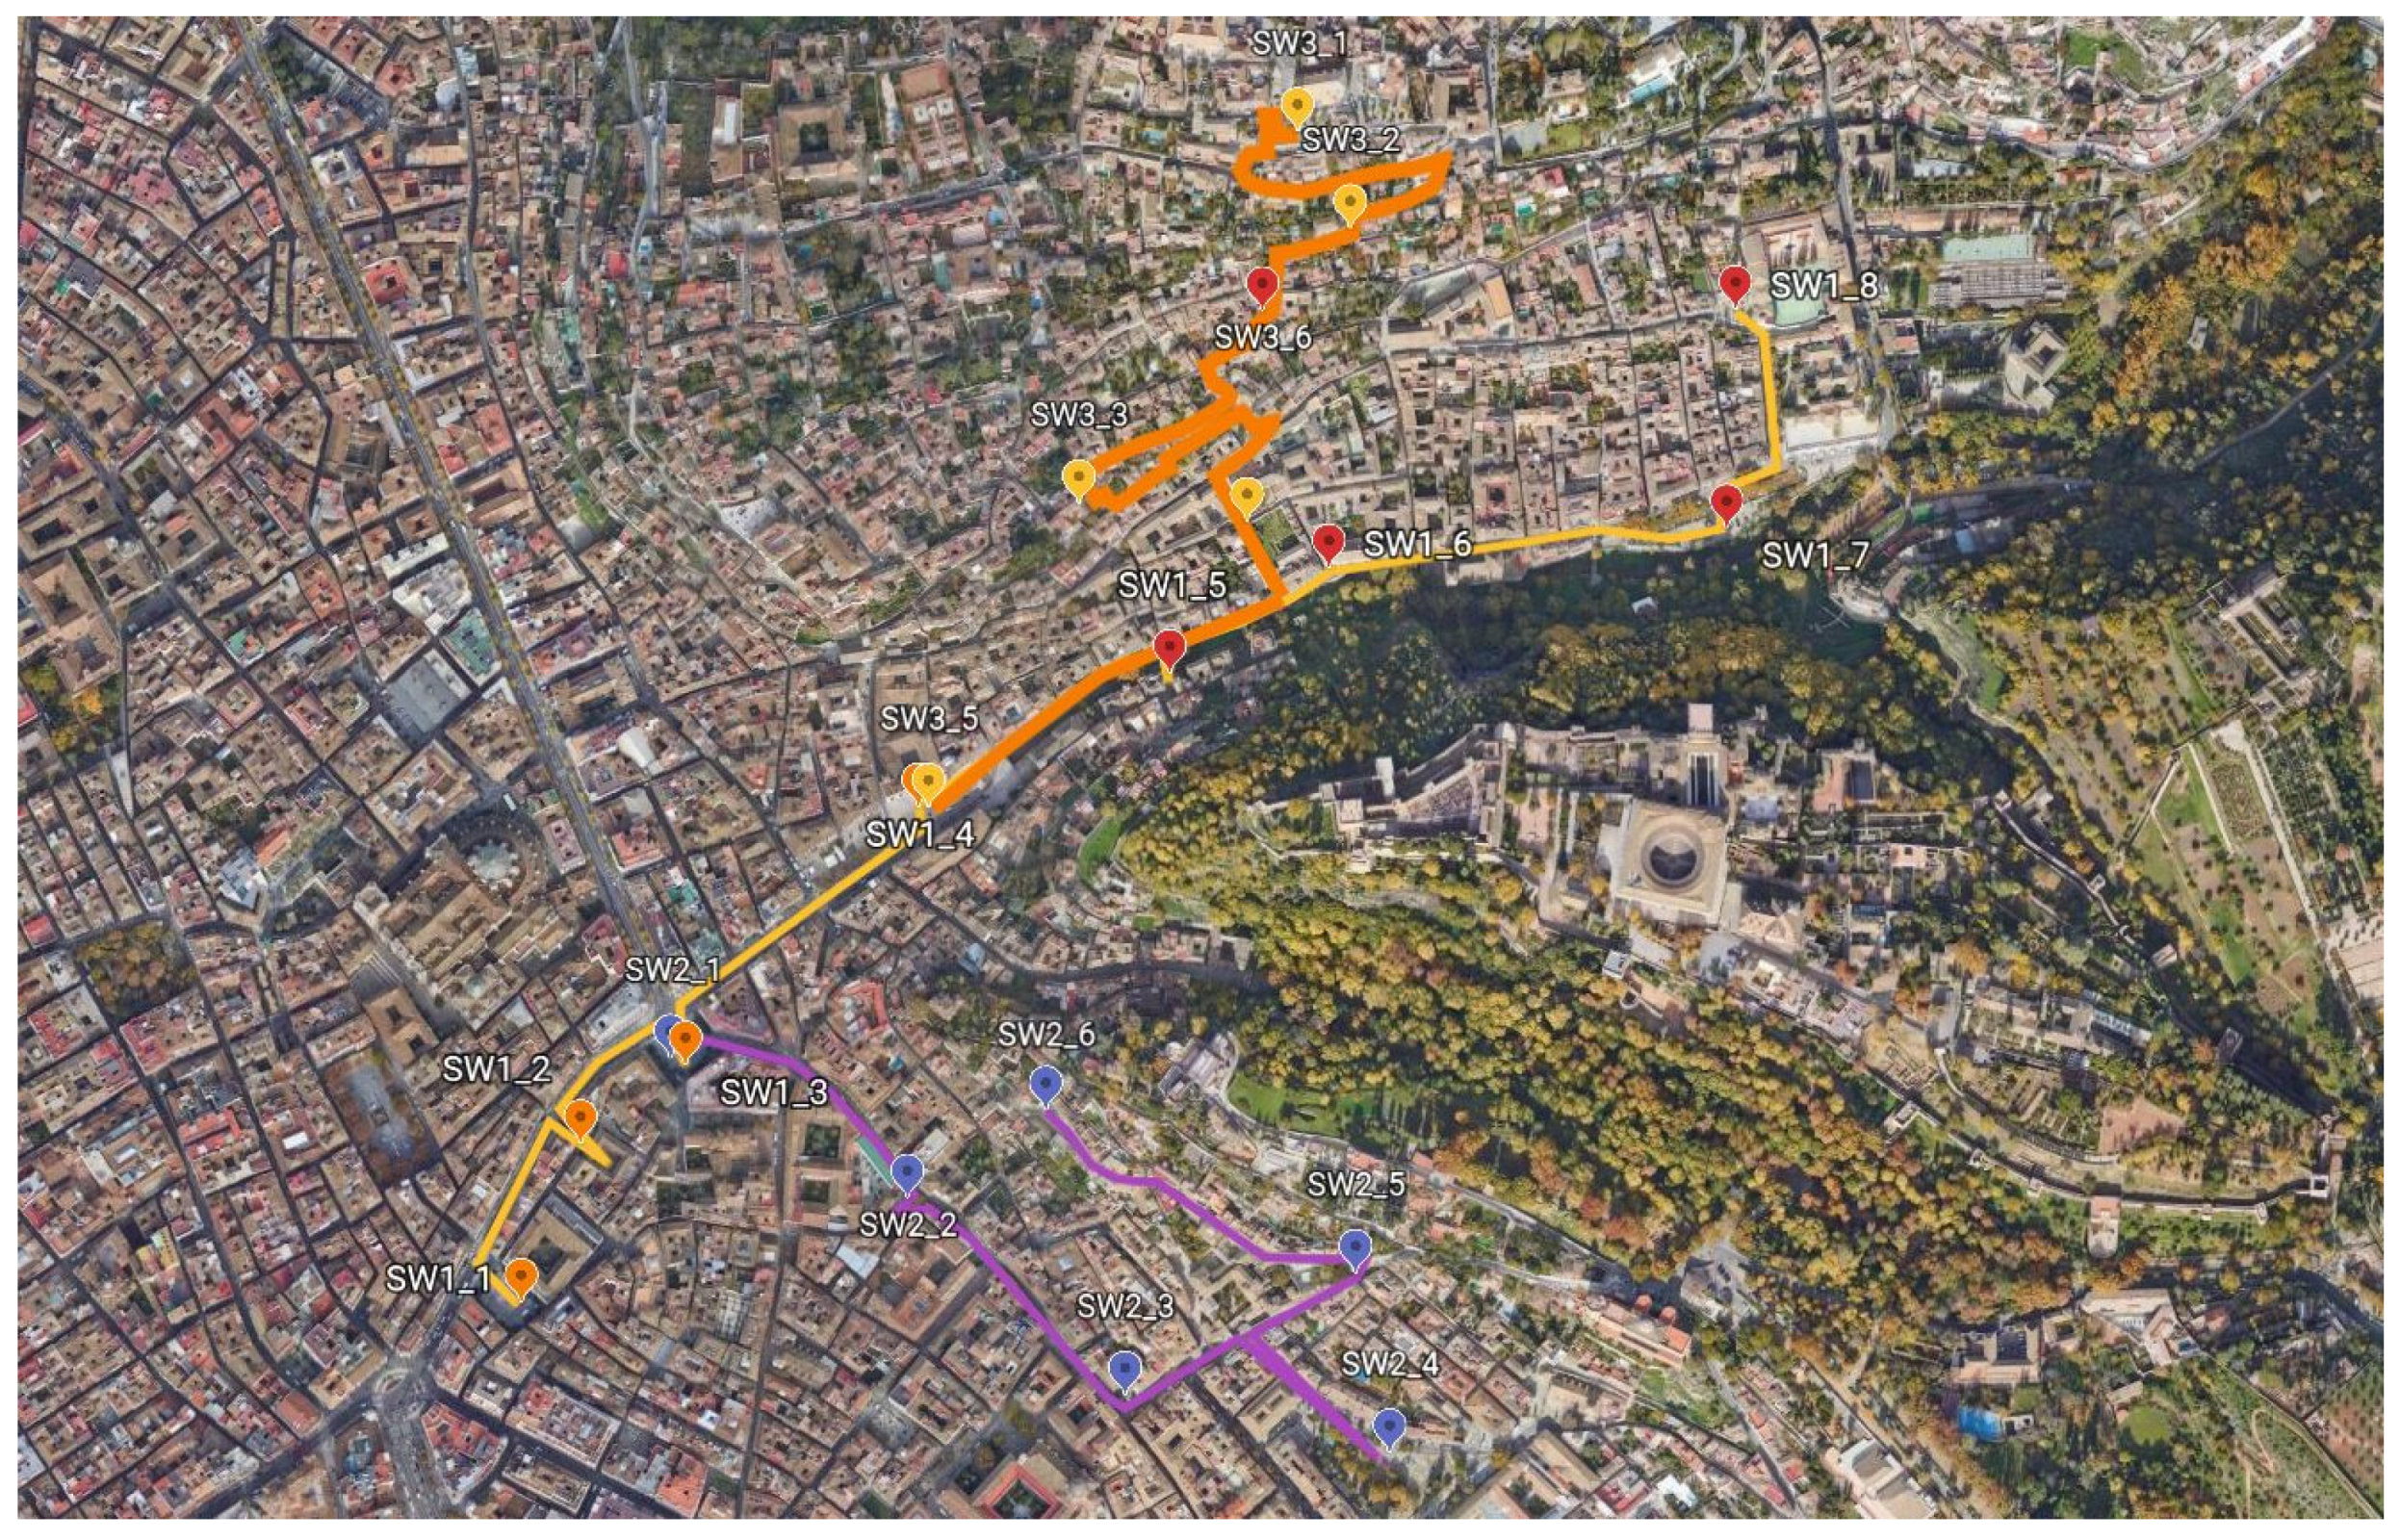
2.2. Description of Soundwalk Paths
2.3. Soundwalks Procedure
2.4. Soundwalk Questionnaires: Online and Paper Versions
2.5. Description of Soundwalk Questionnaire
- A welcome message and information on what it is all about;
- Informed consent to go ahead and fill out the survey;
- Evaluation site (stop number) selection;
- 12 specific questions for soundscape evaluation.
3. Results
3.1. Soundwalk Results in 2020 with Visually Impaired Participants
3.1.1. Dataset Description
3.1.2. Acoustic Environment Description
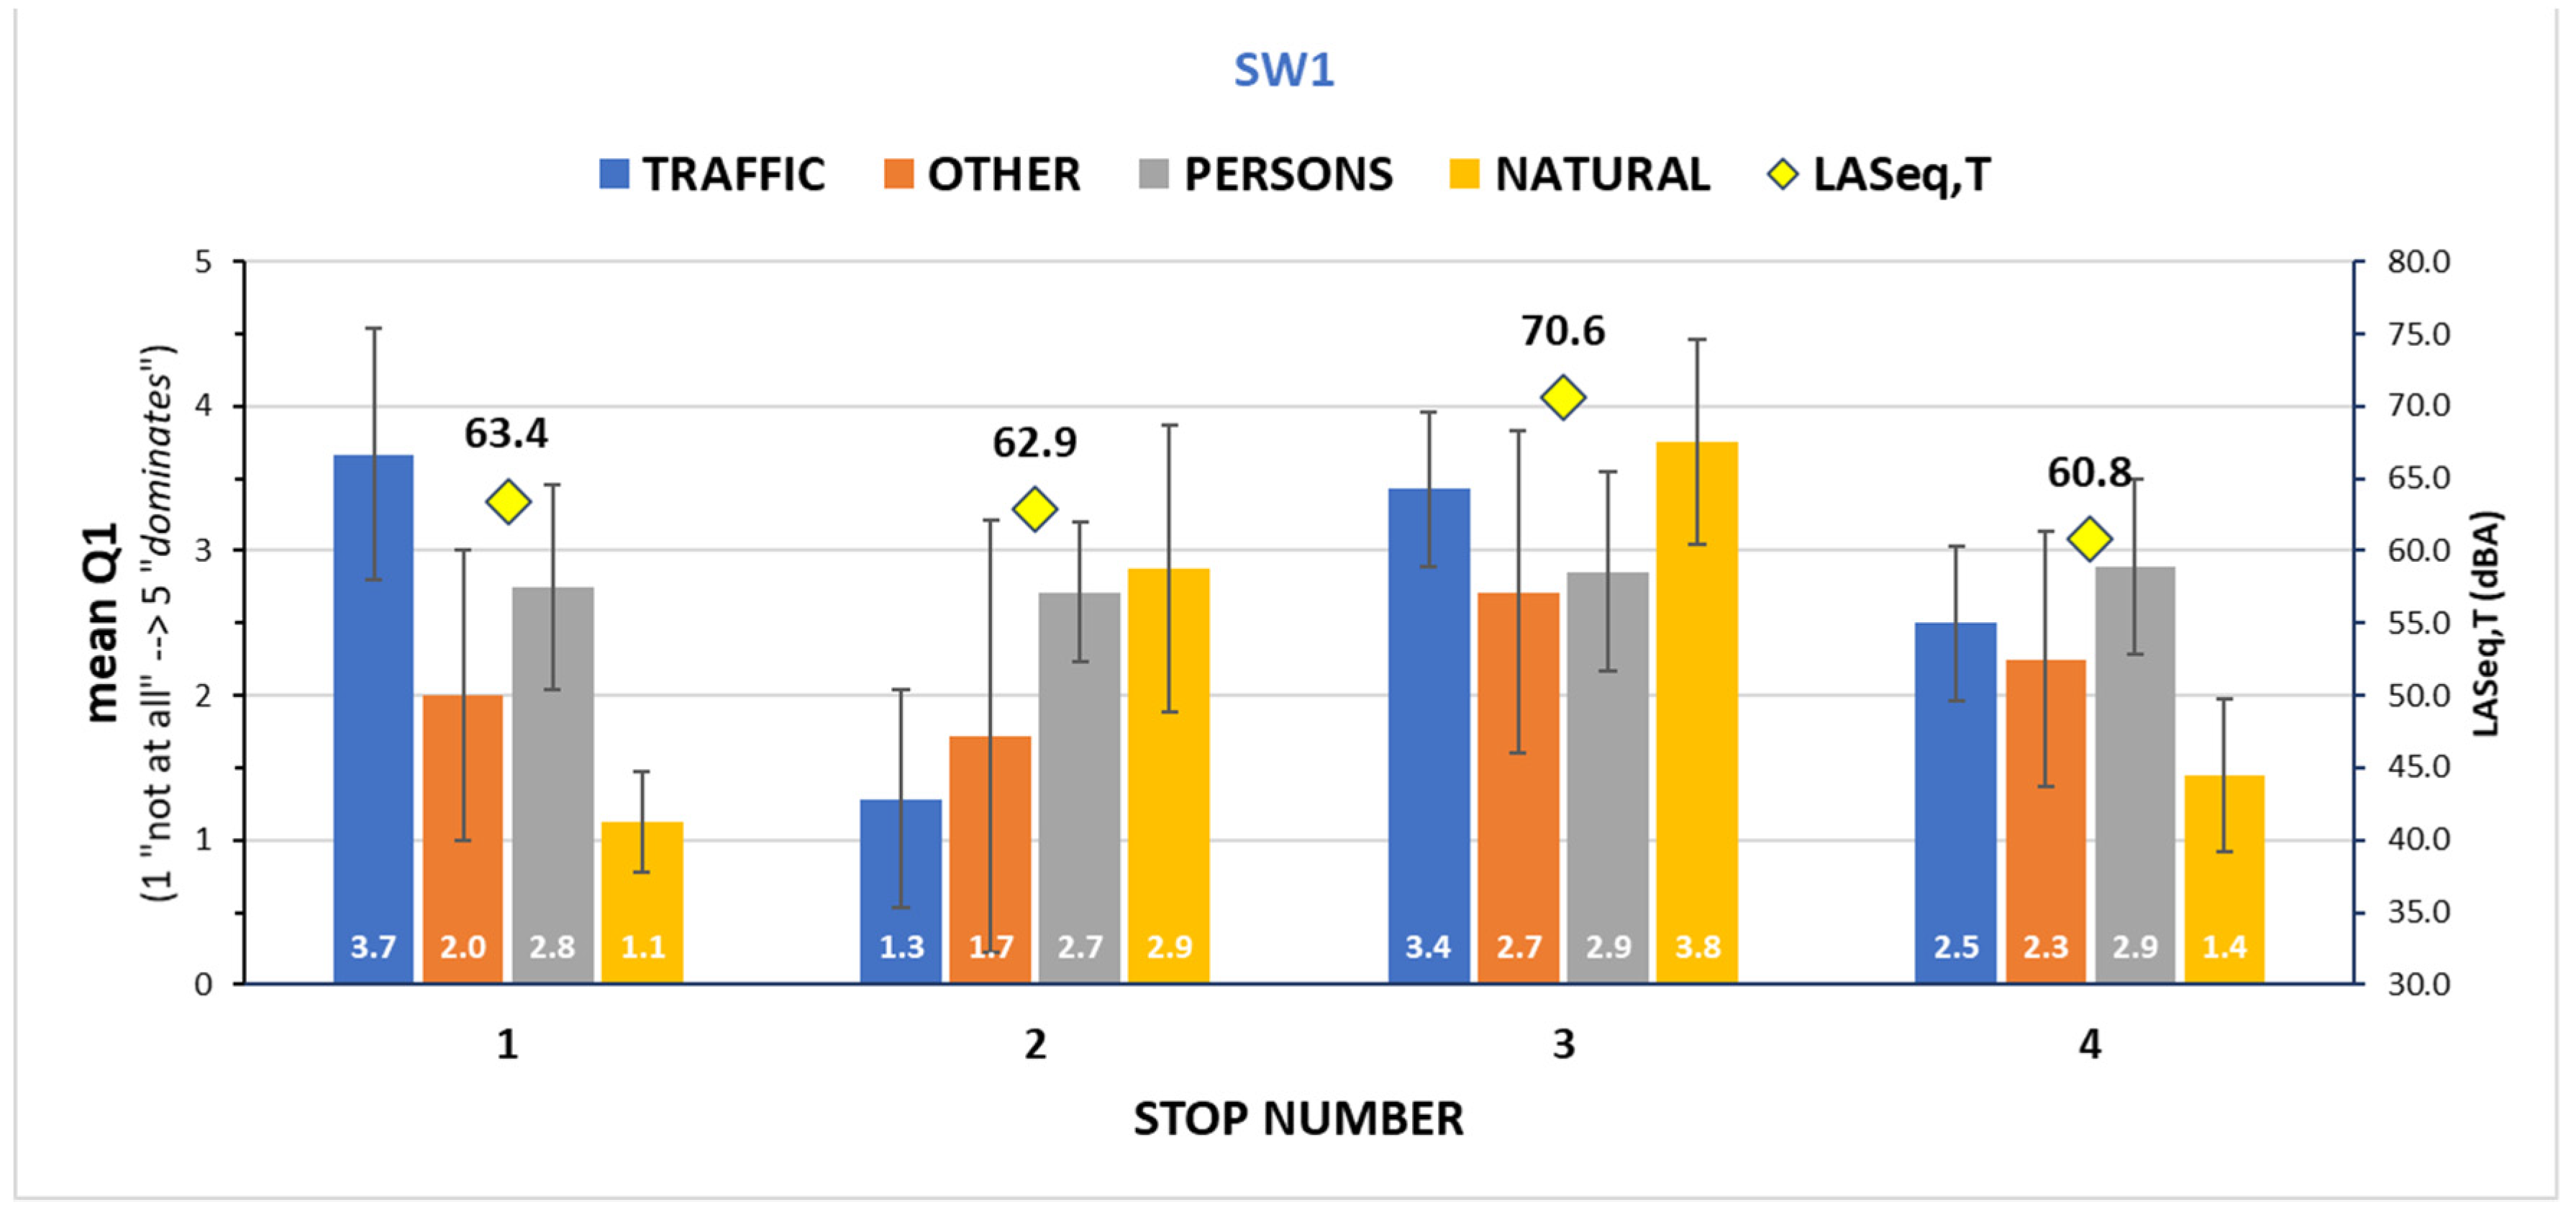
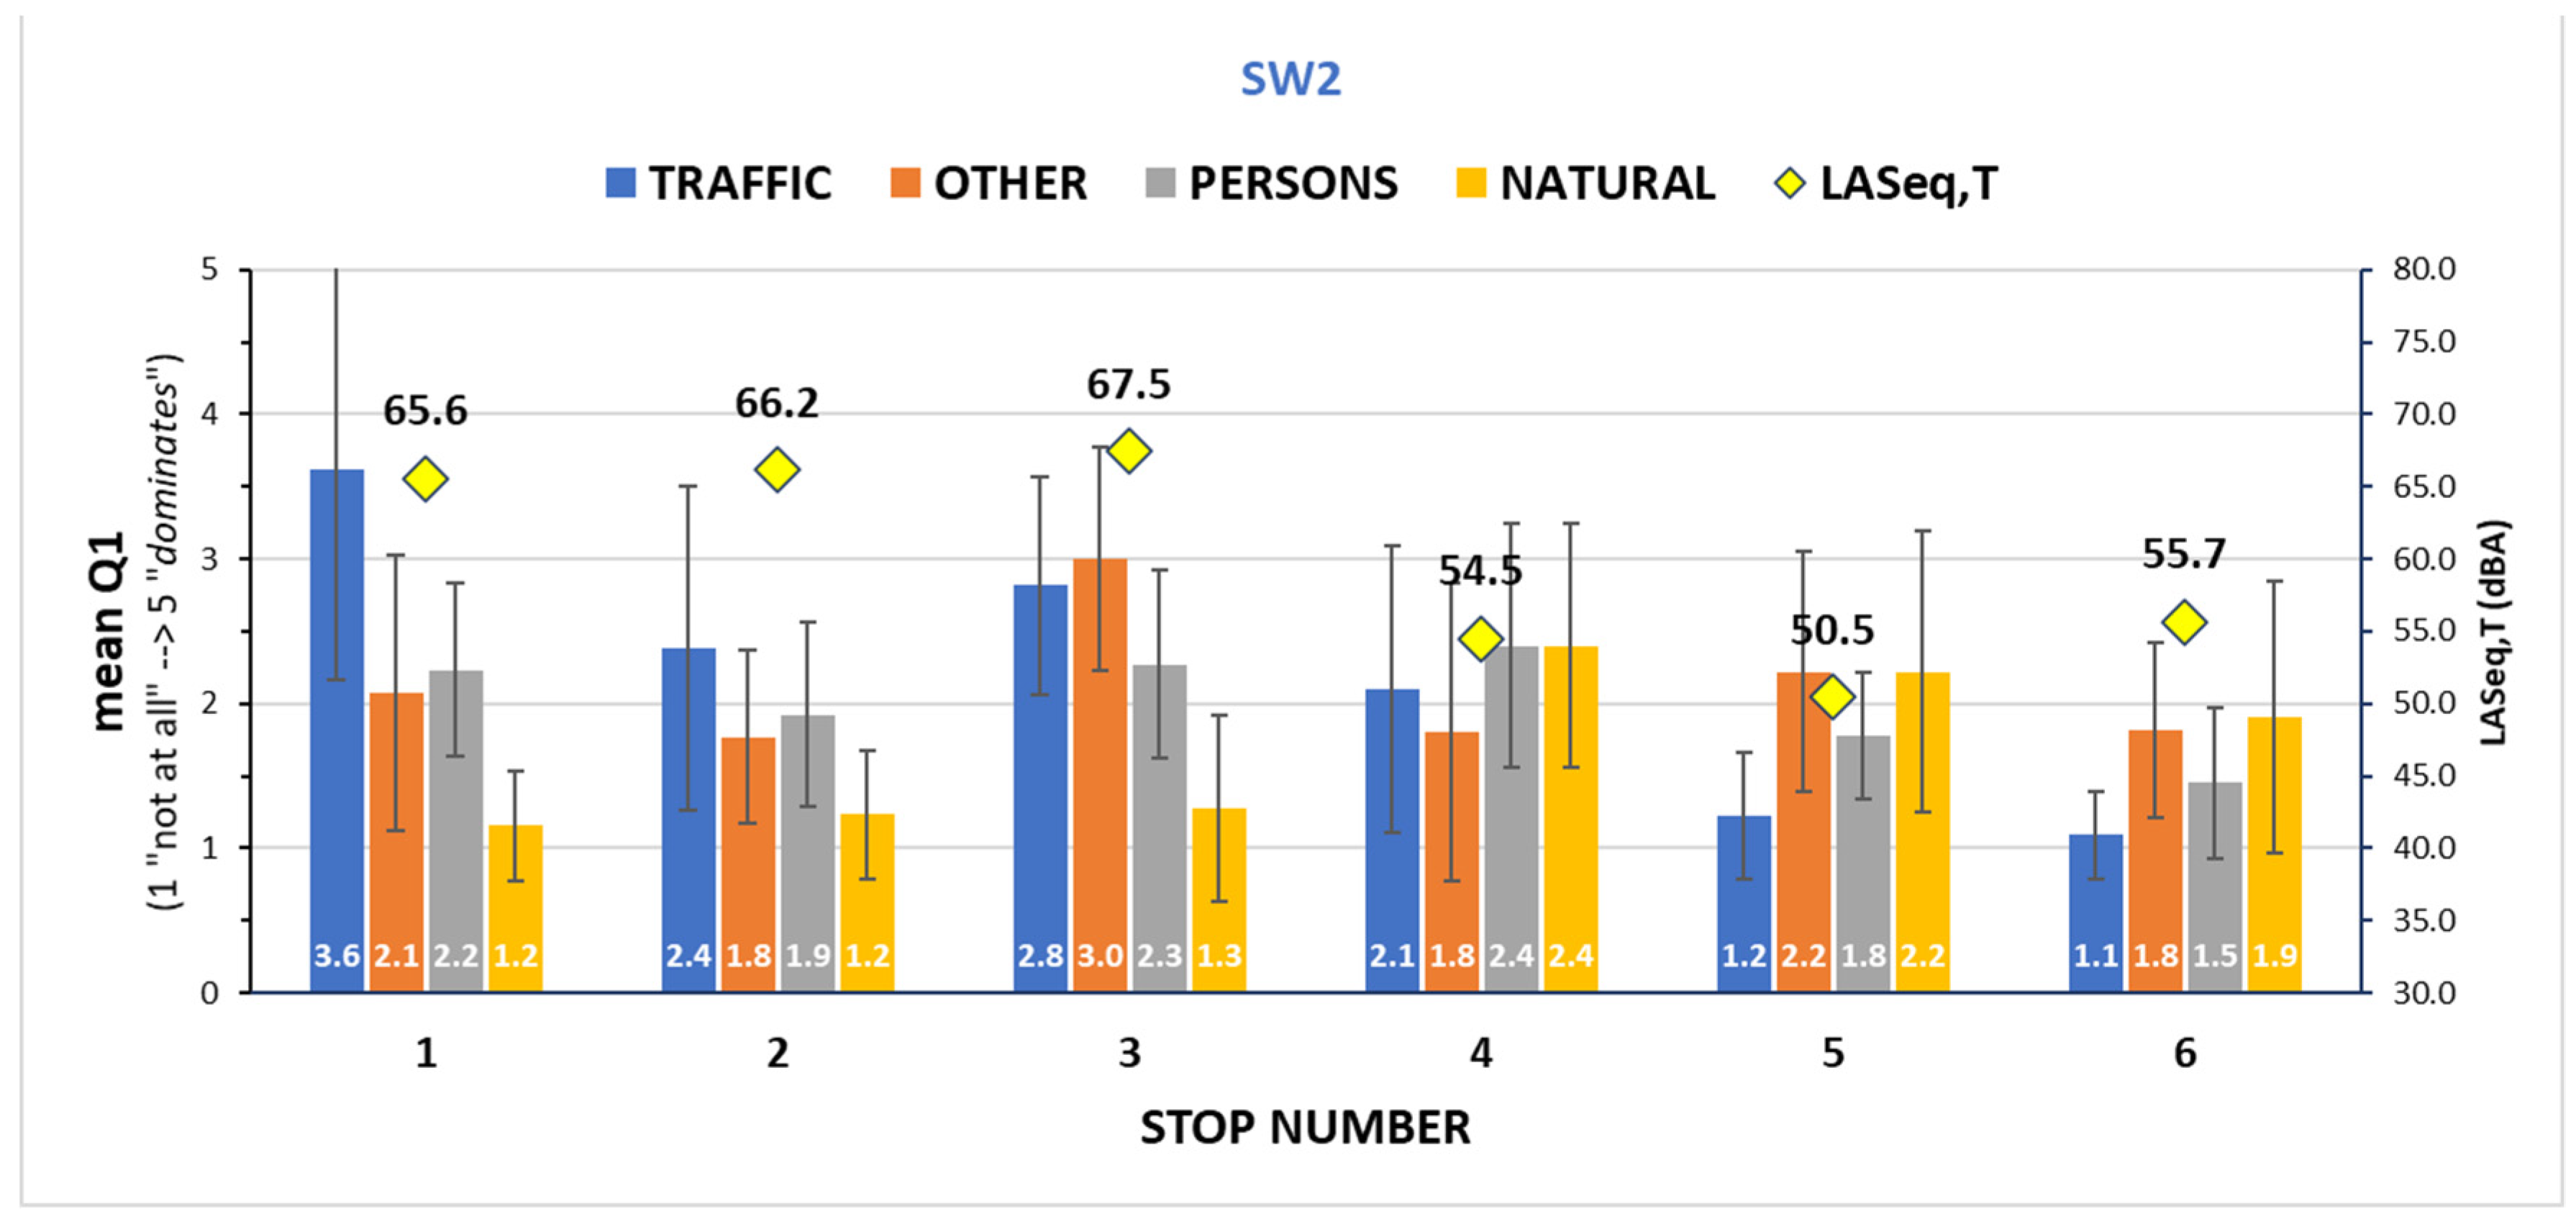
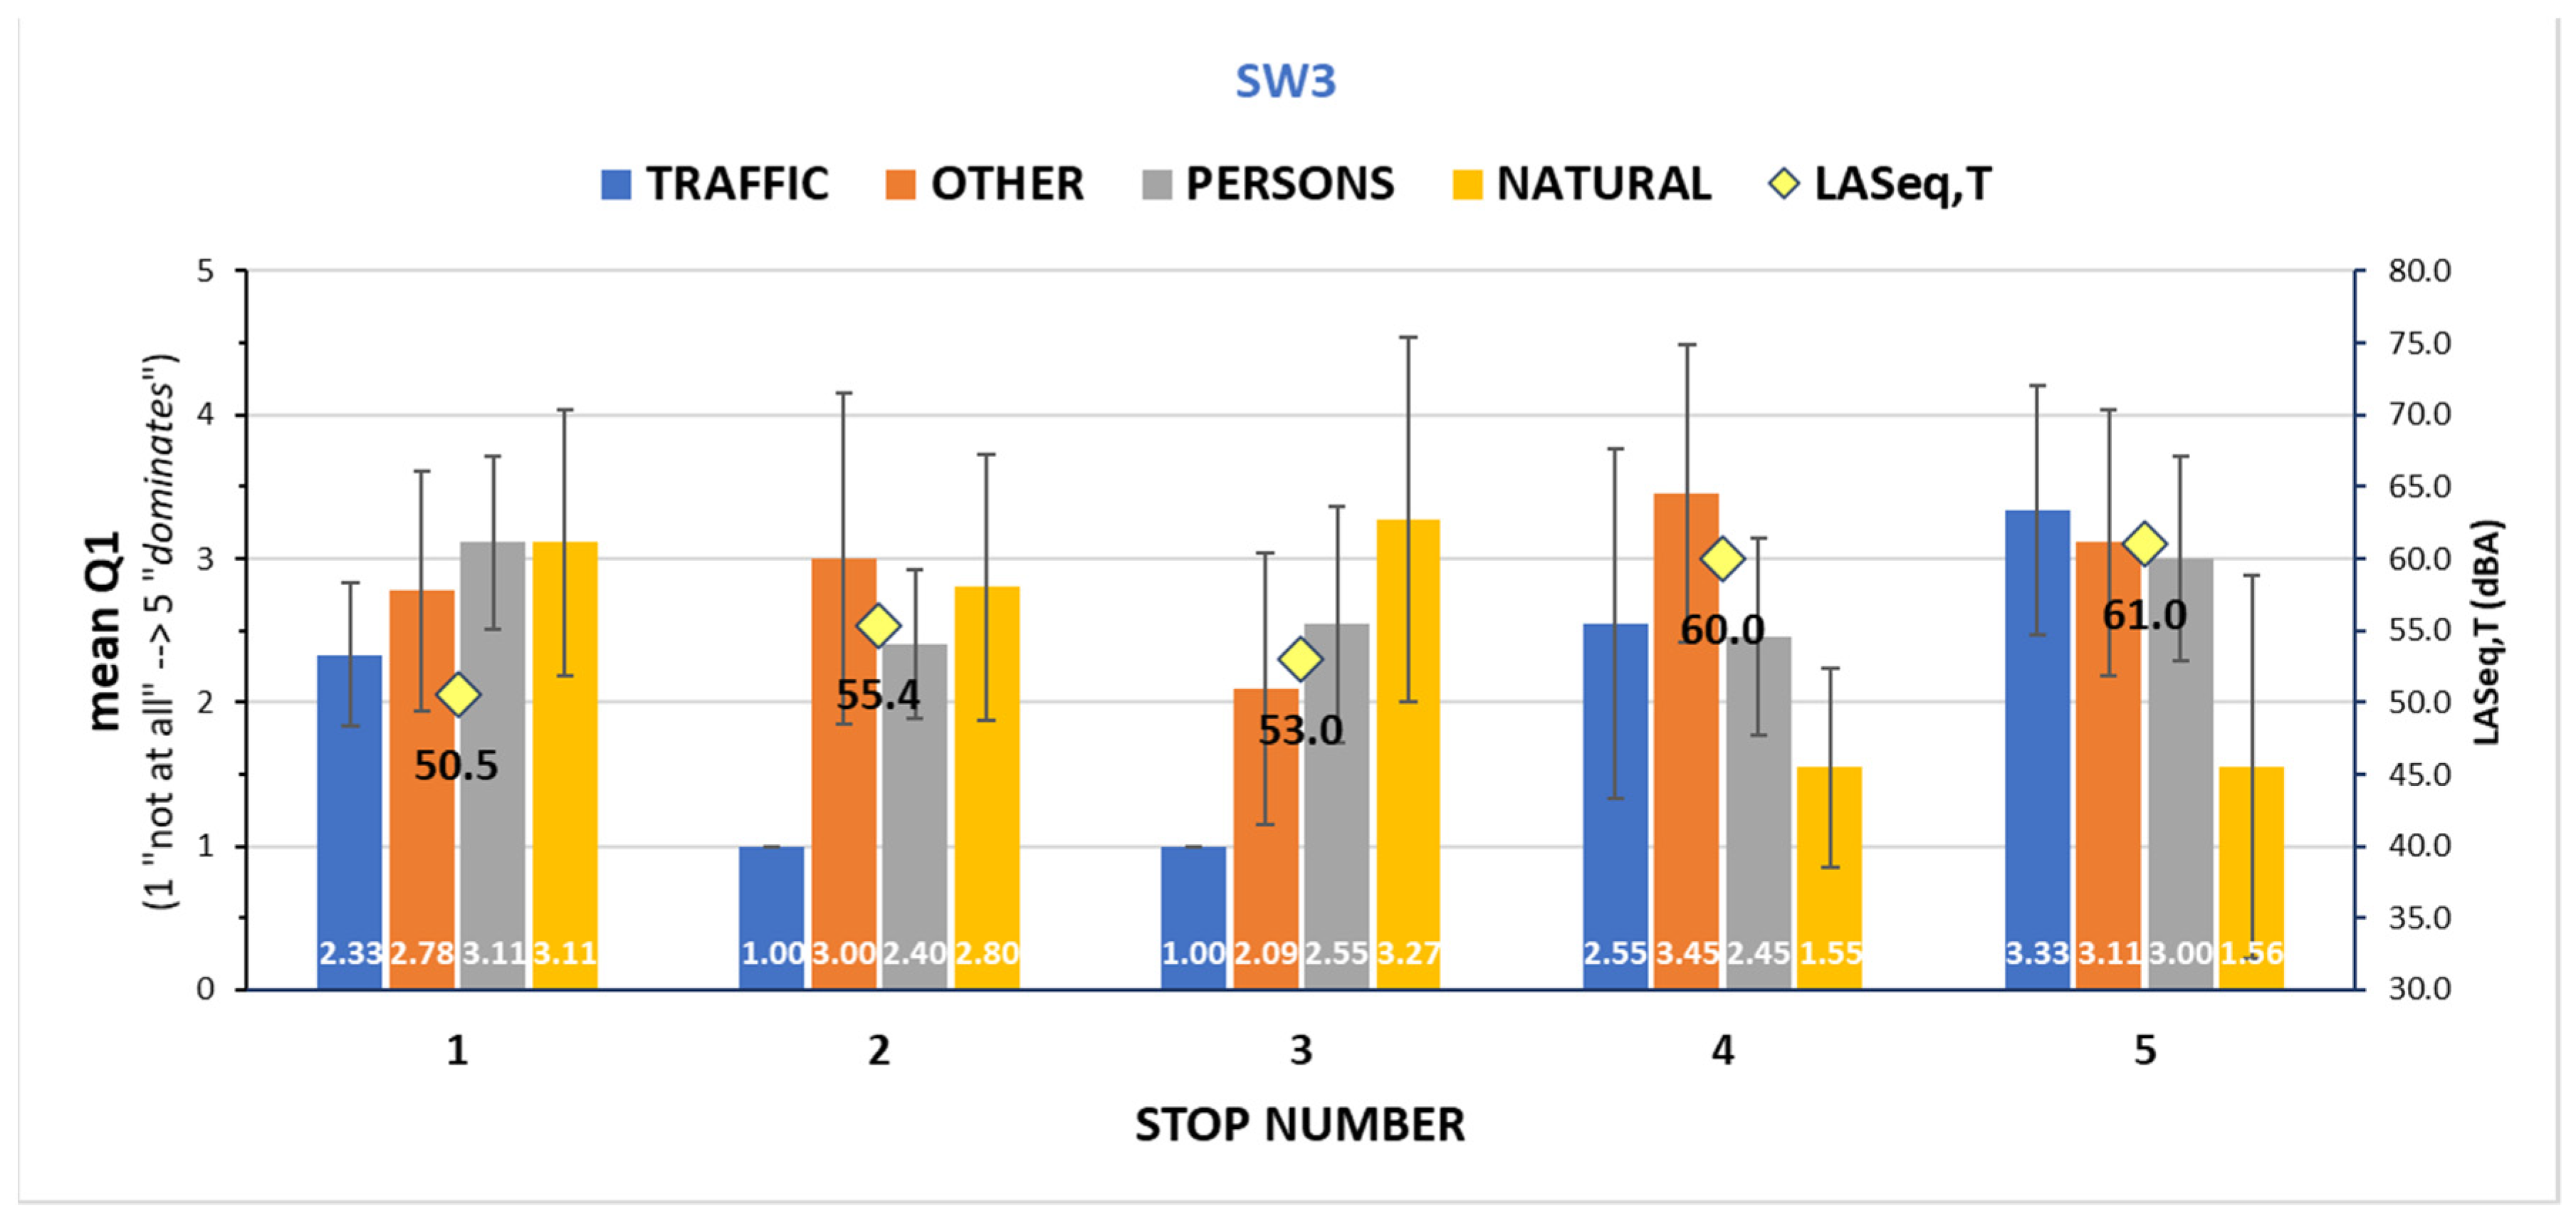
3.1.3. Sound Source Identification
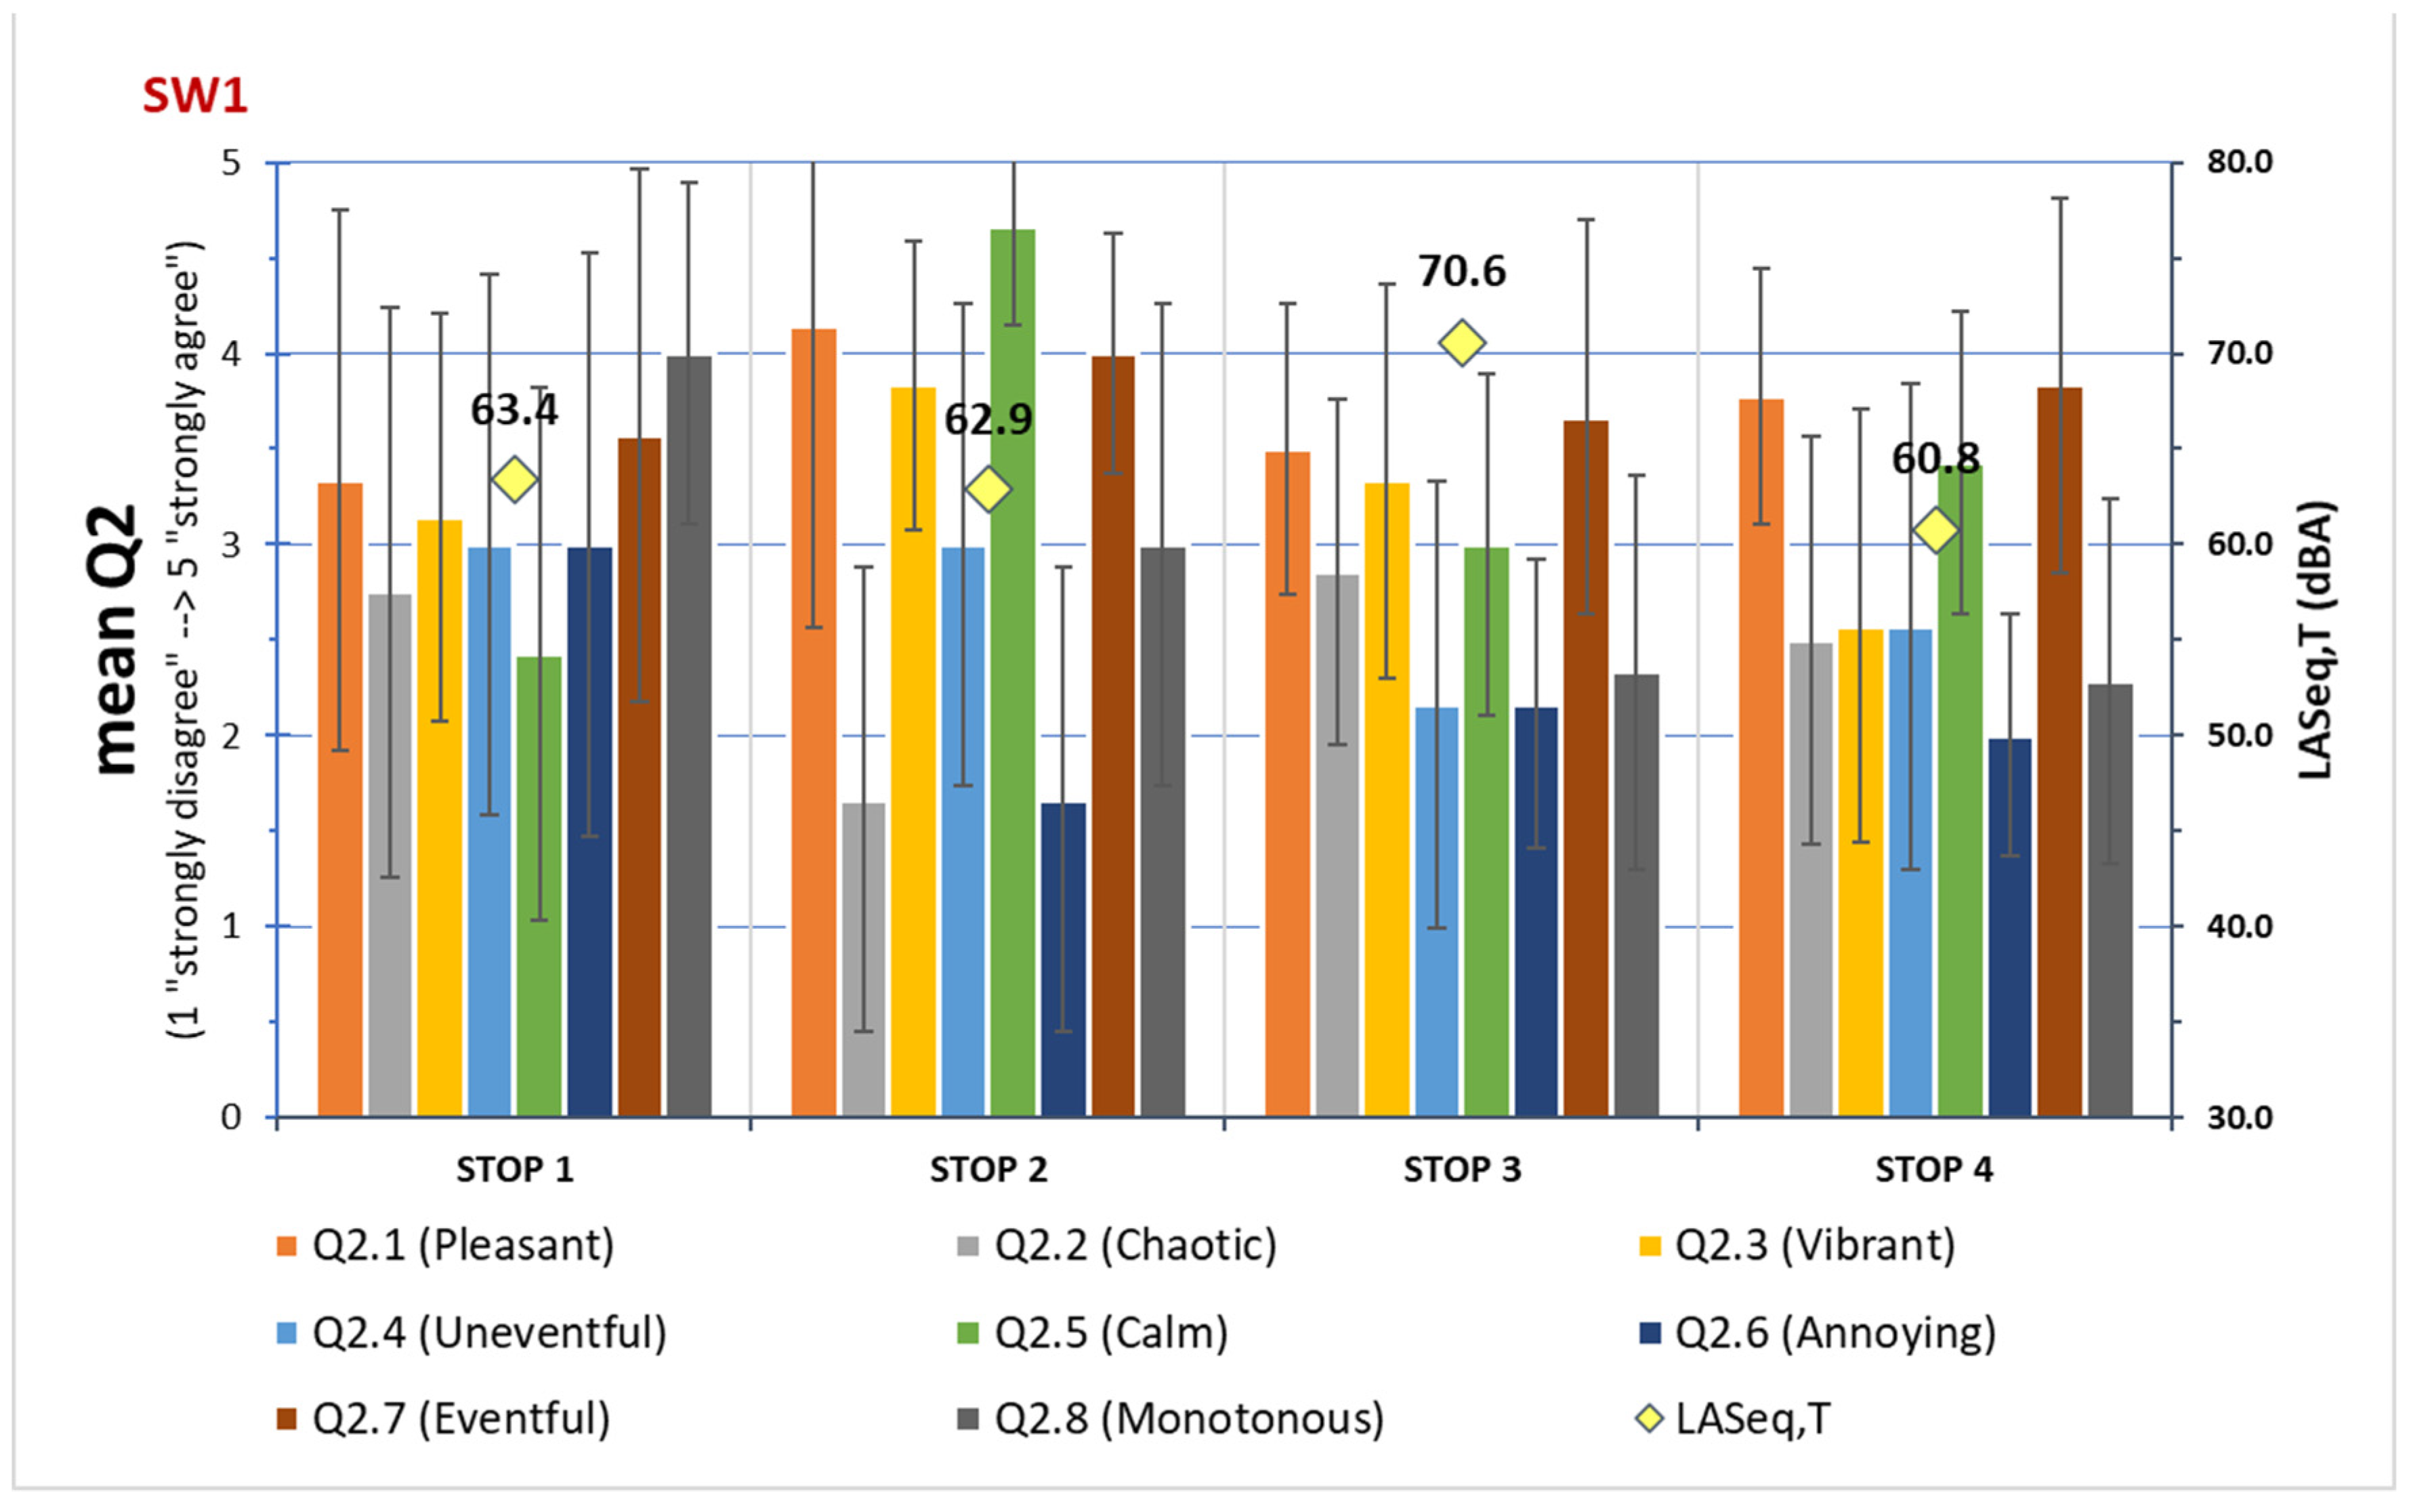
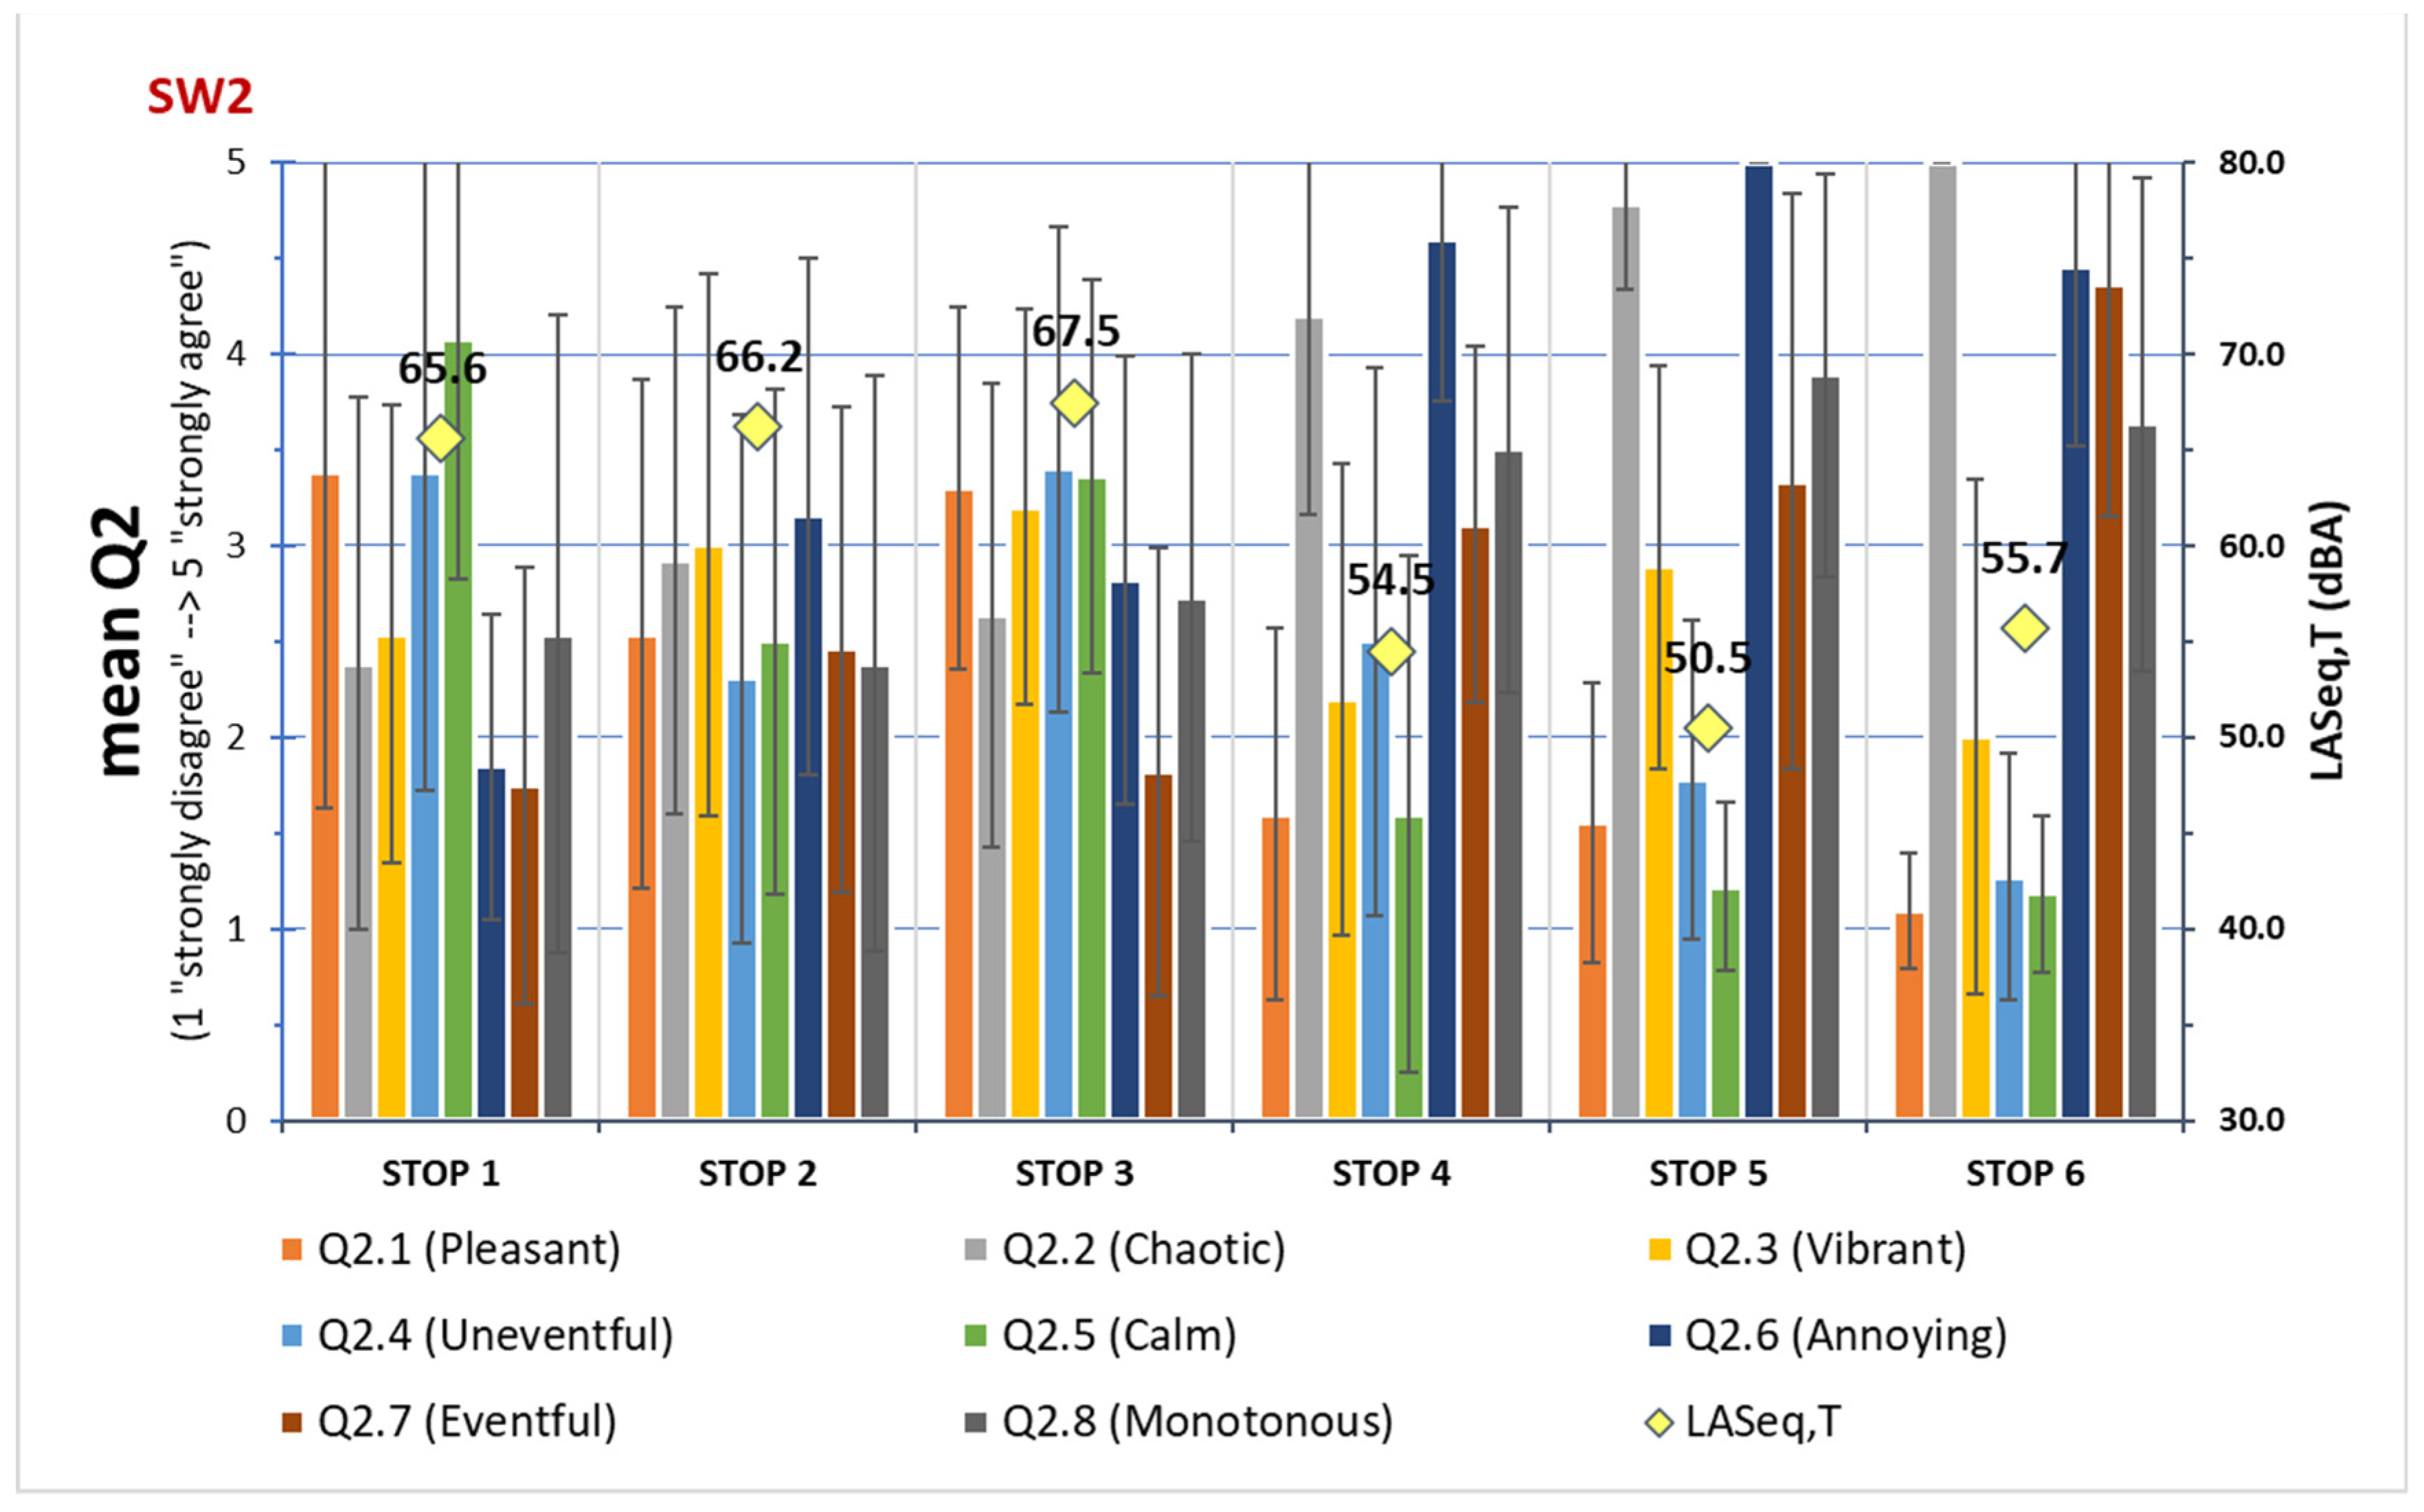
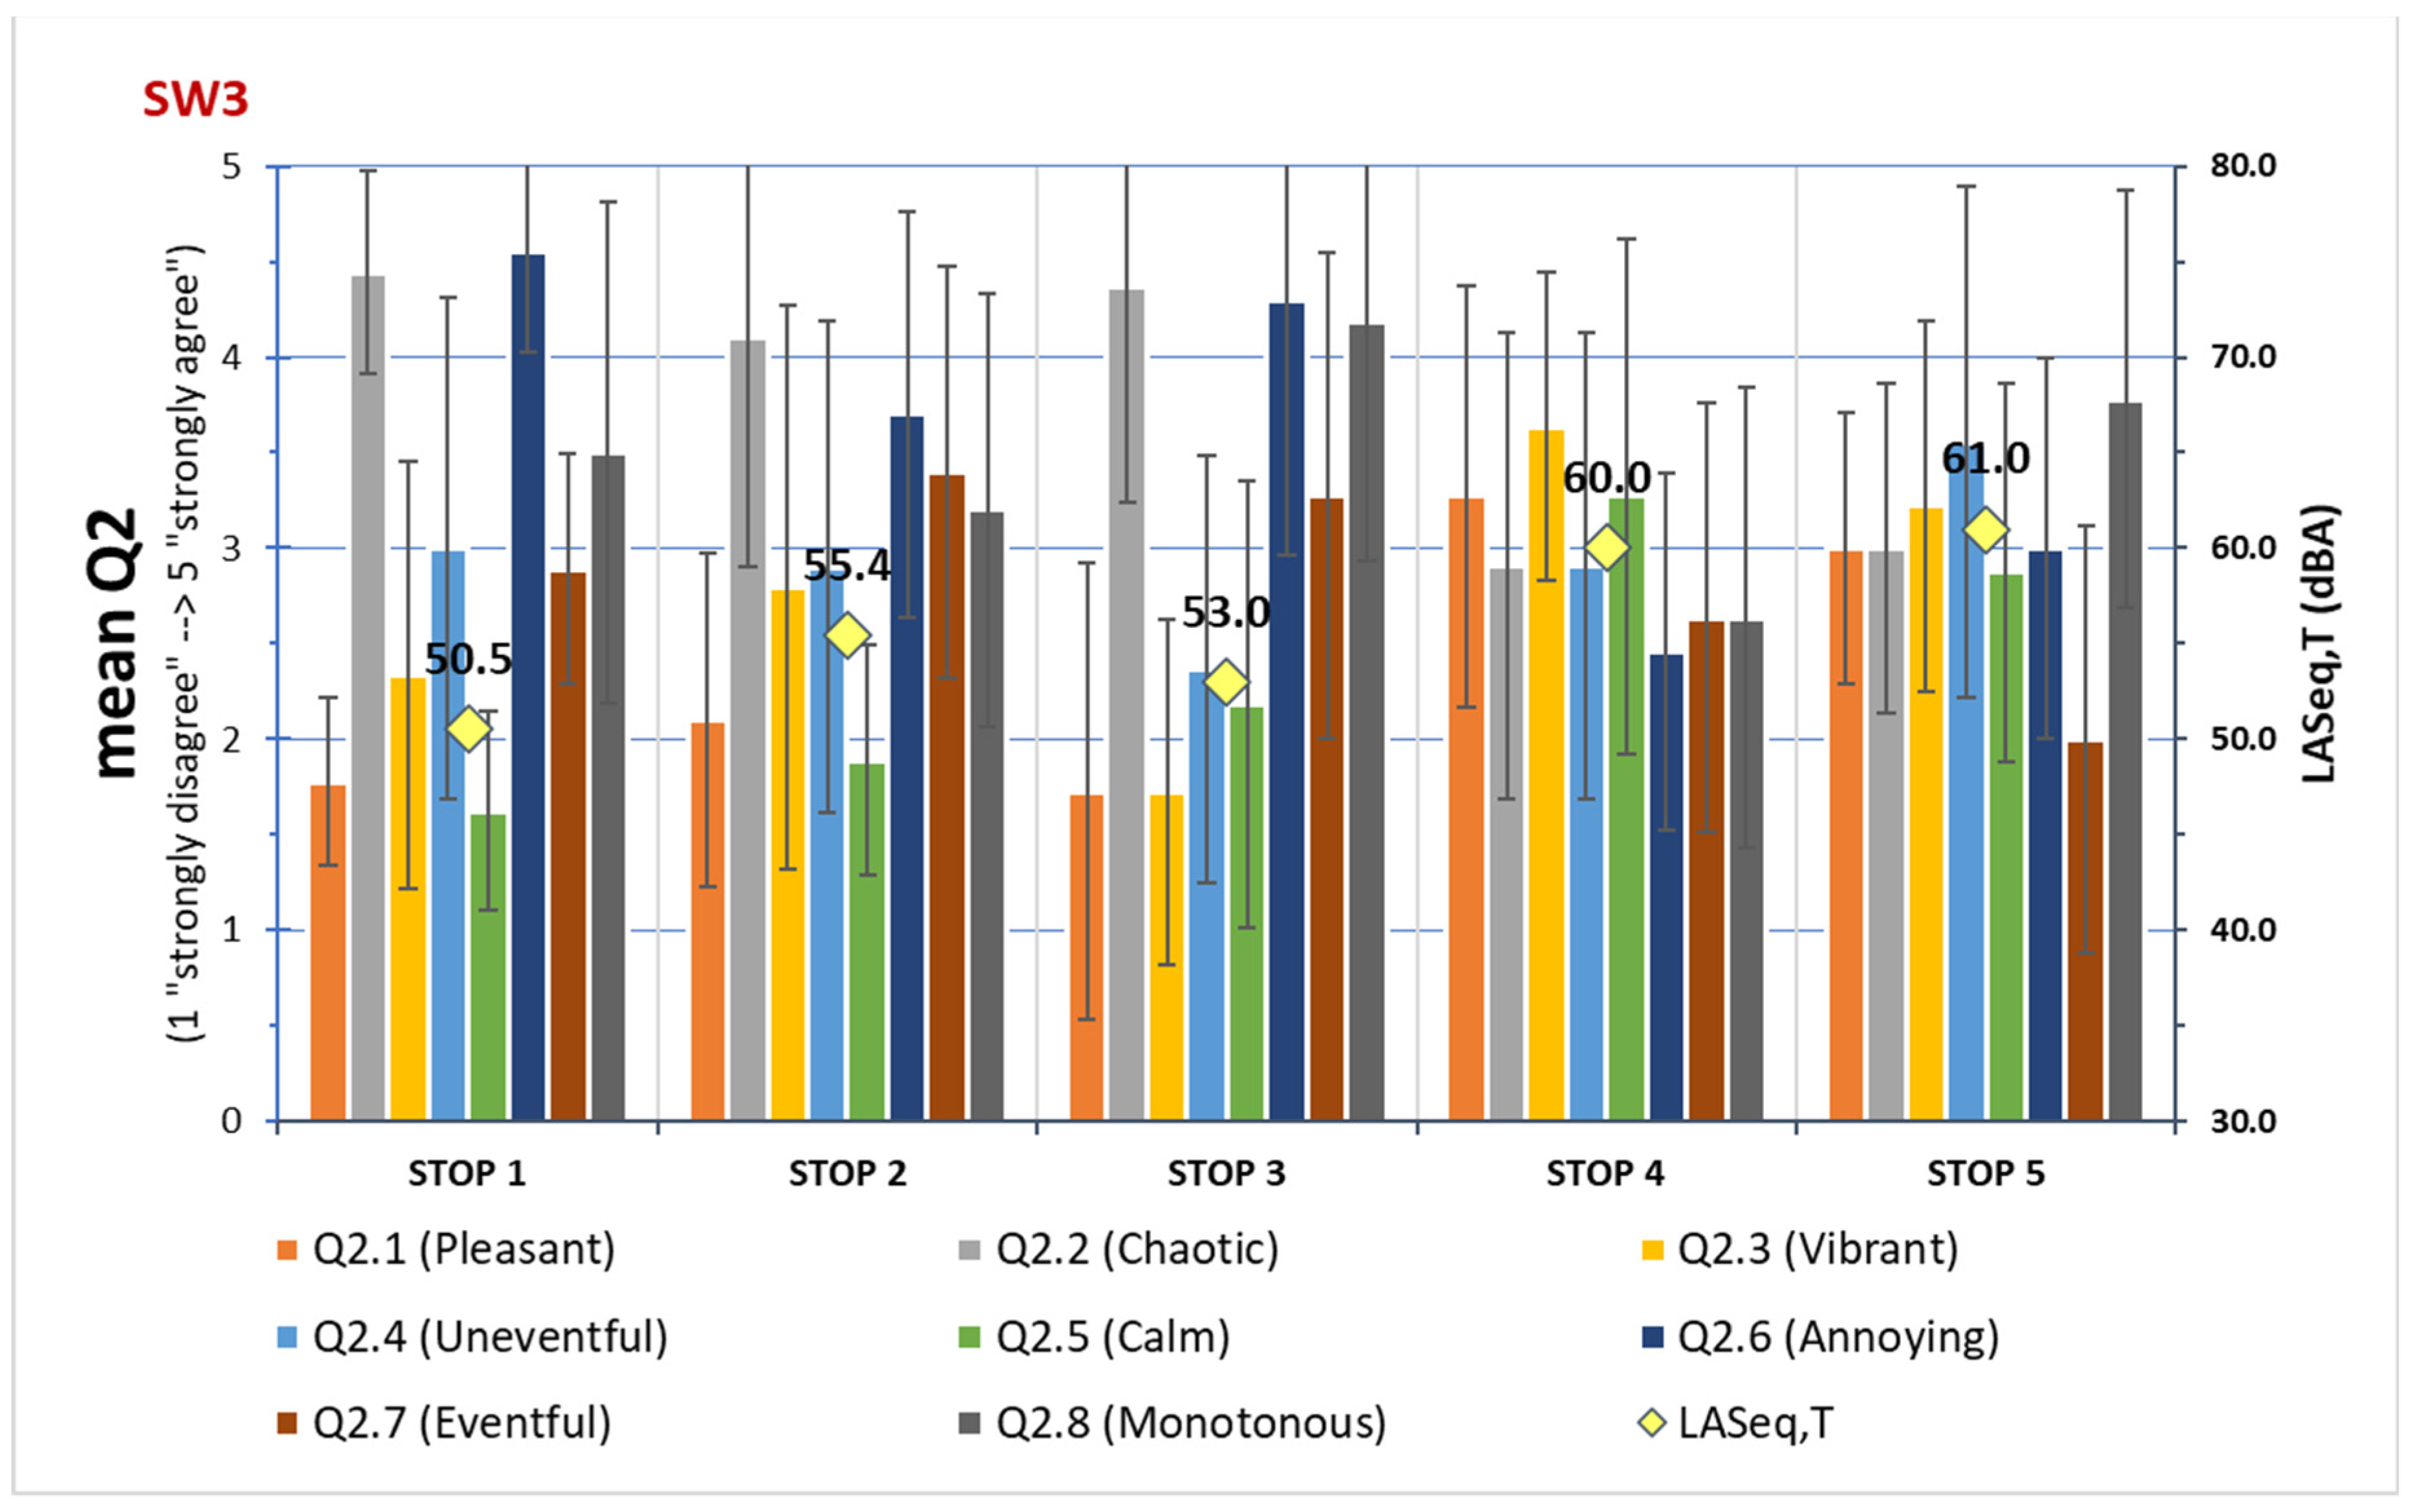
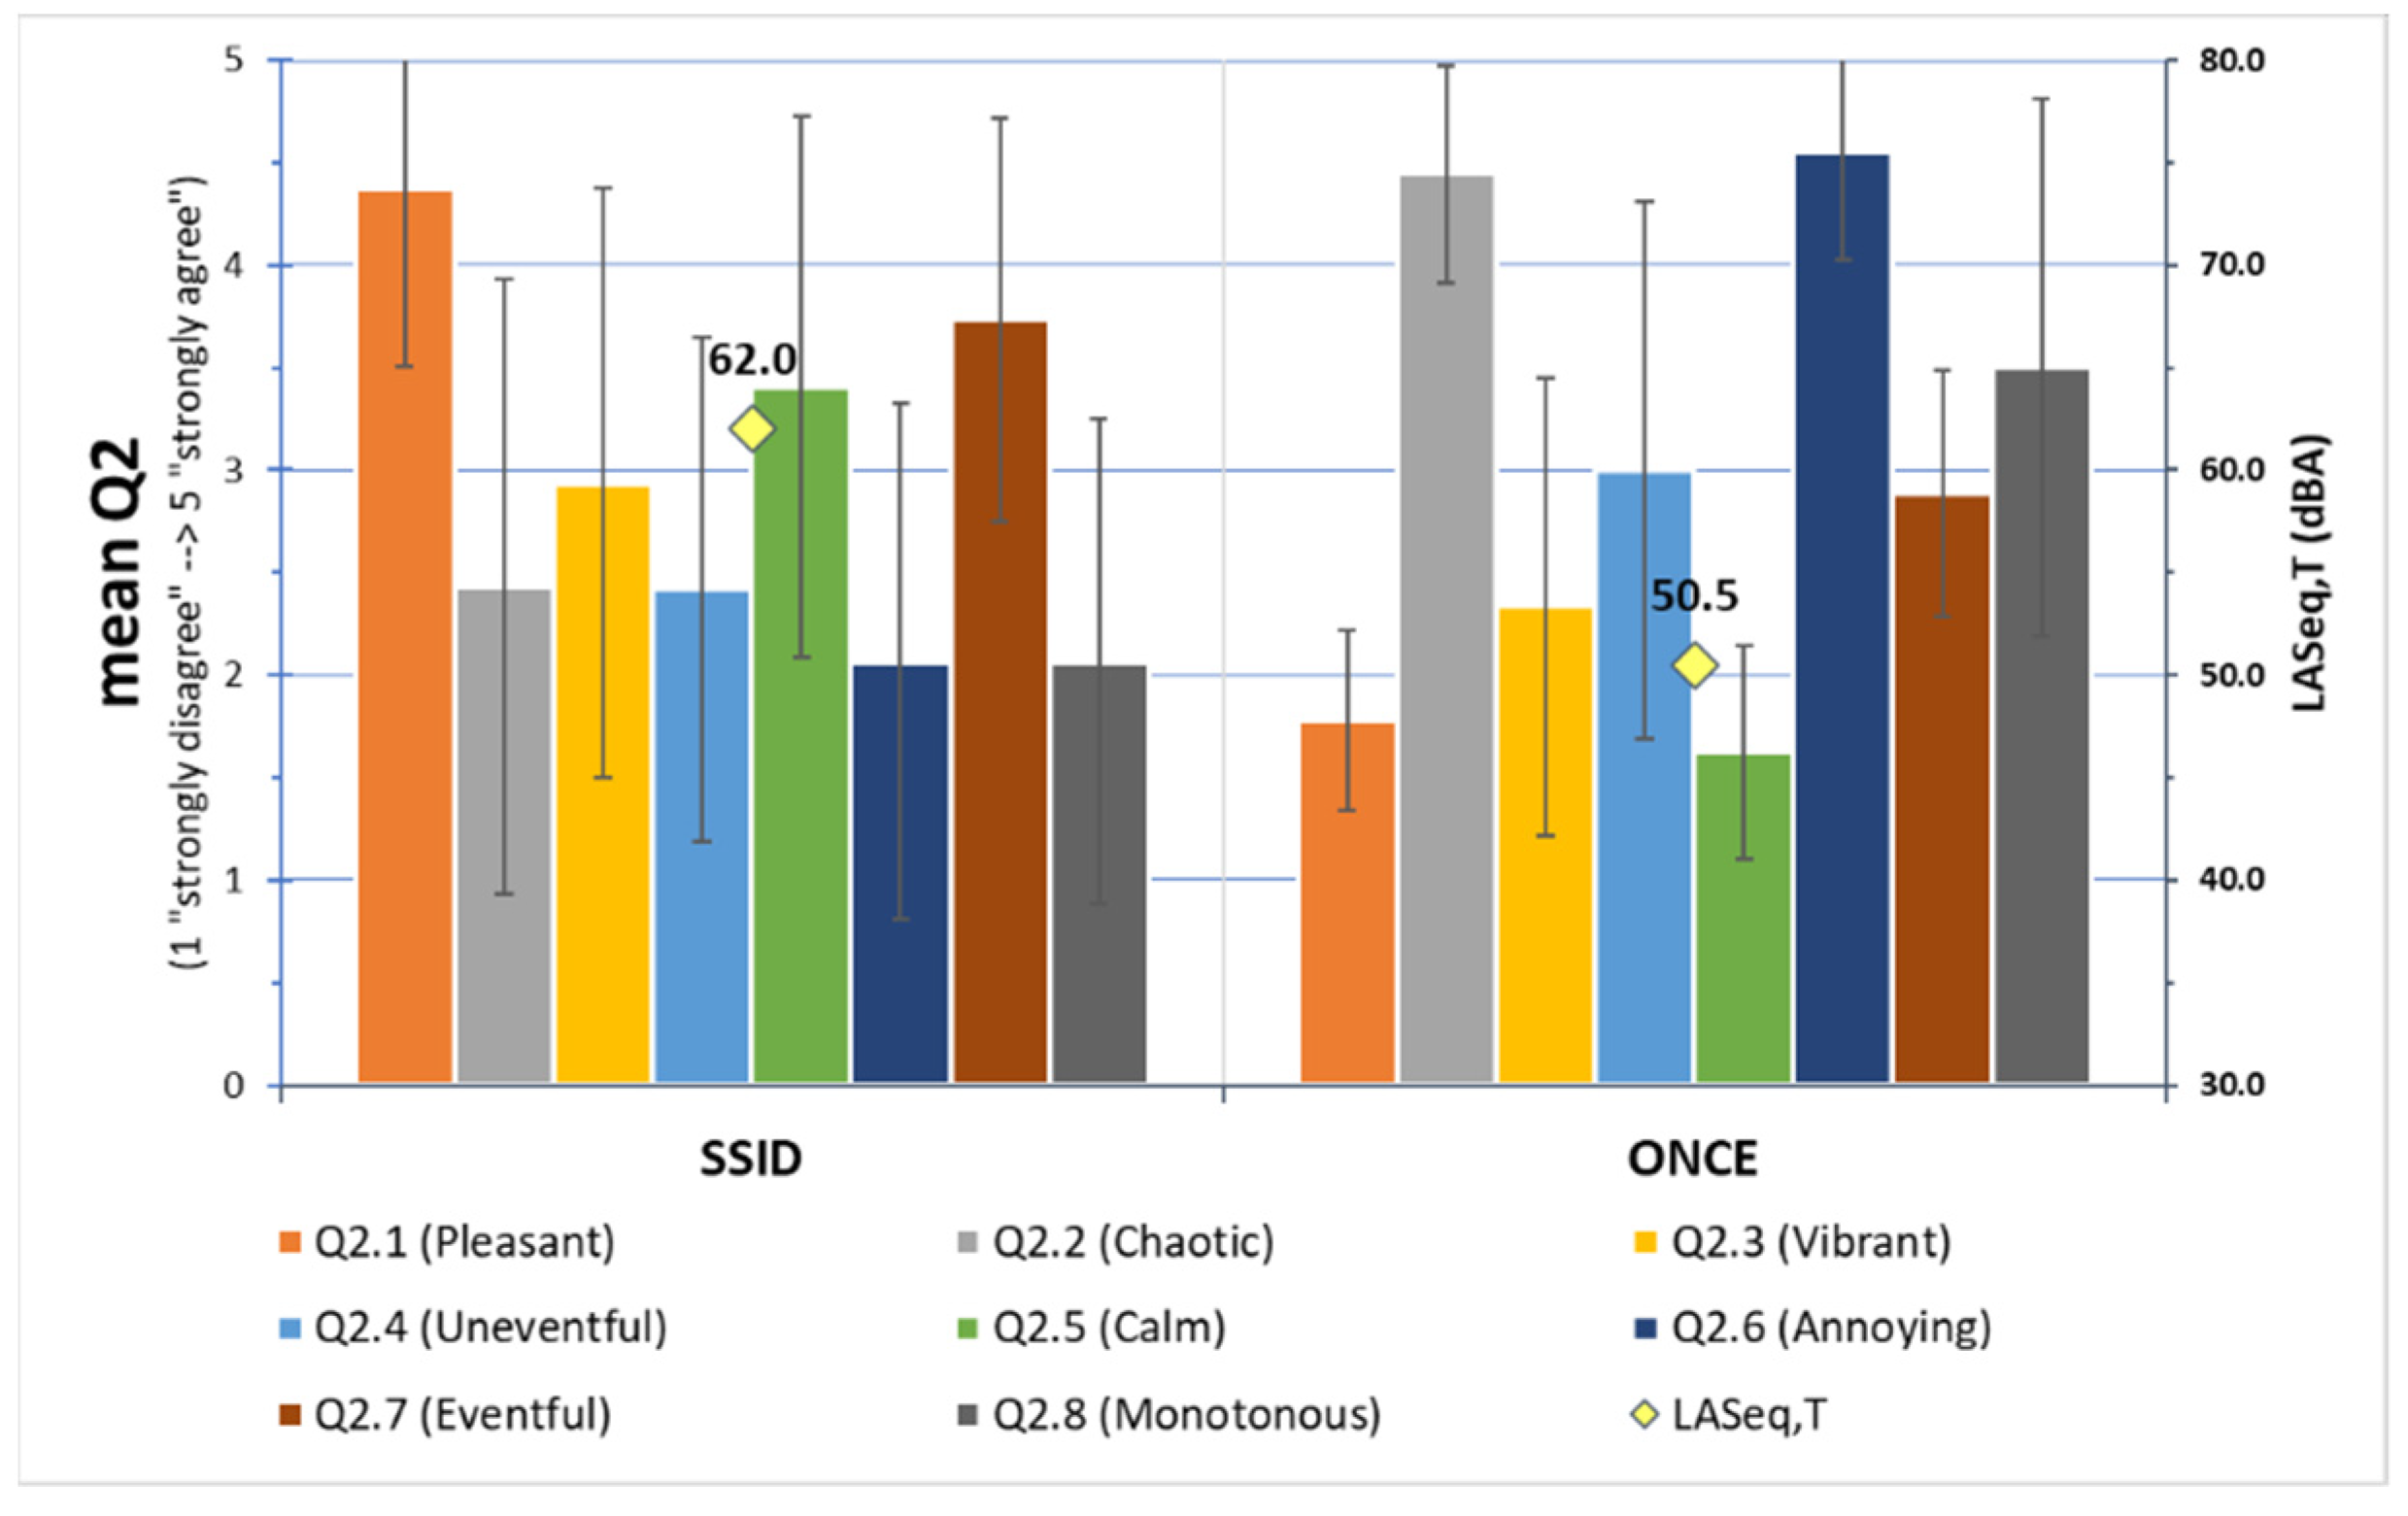
3.1.4. Perceived Affective Quality (Q2)
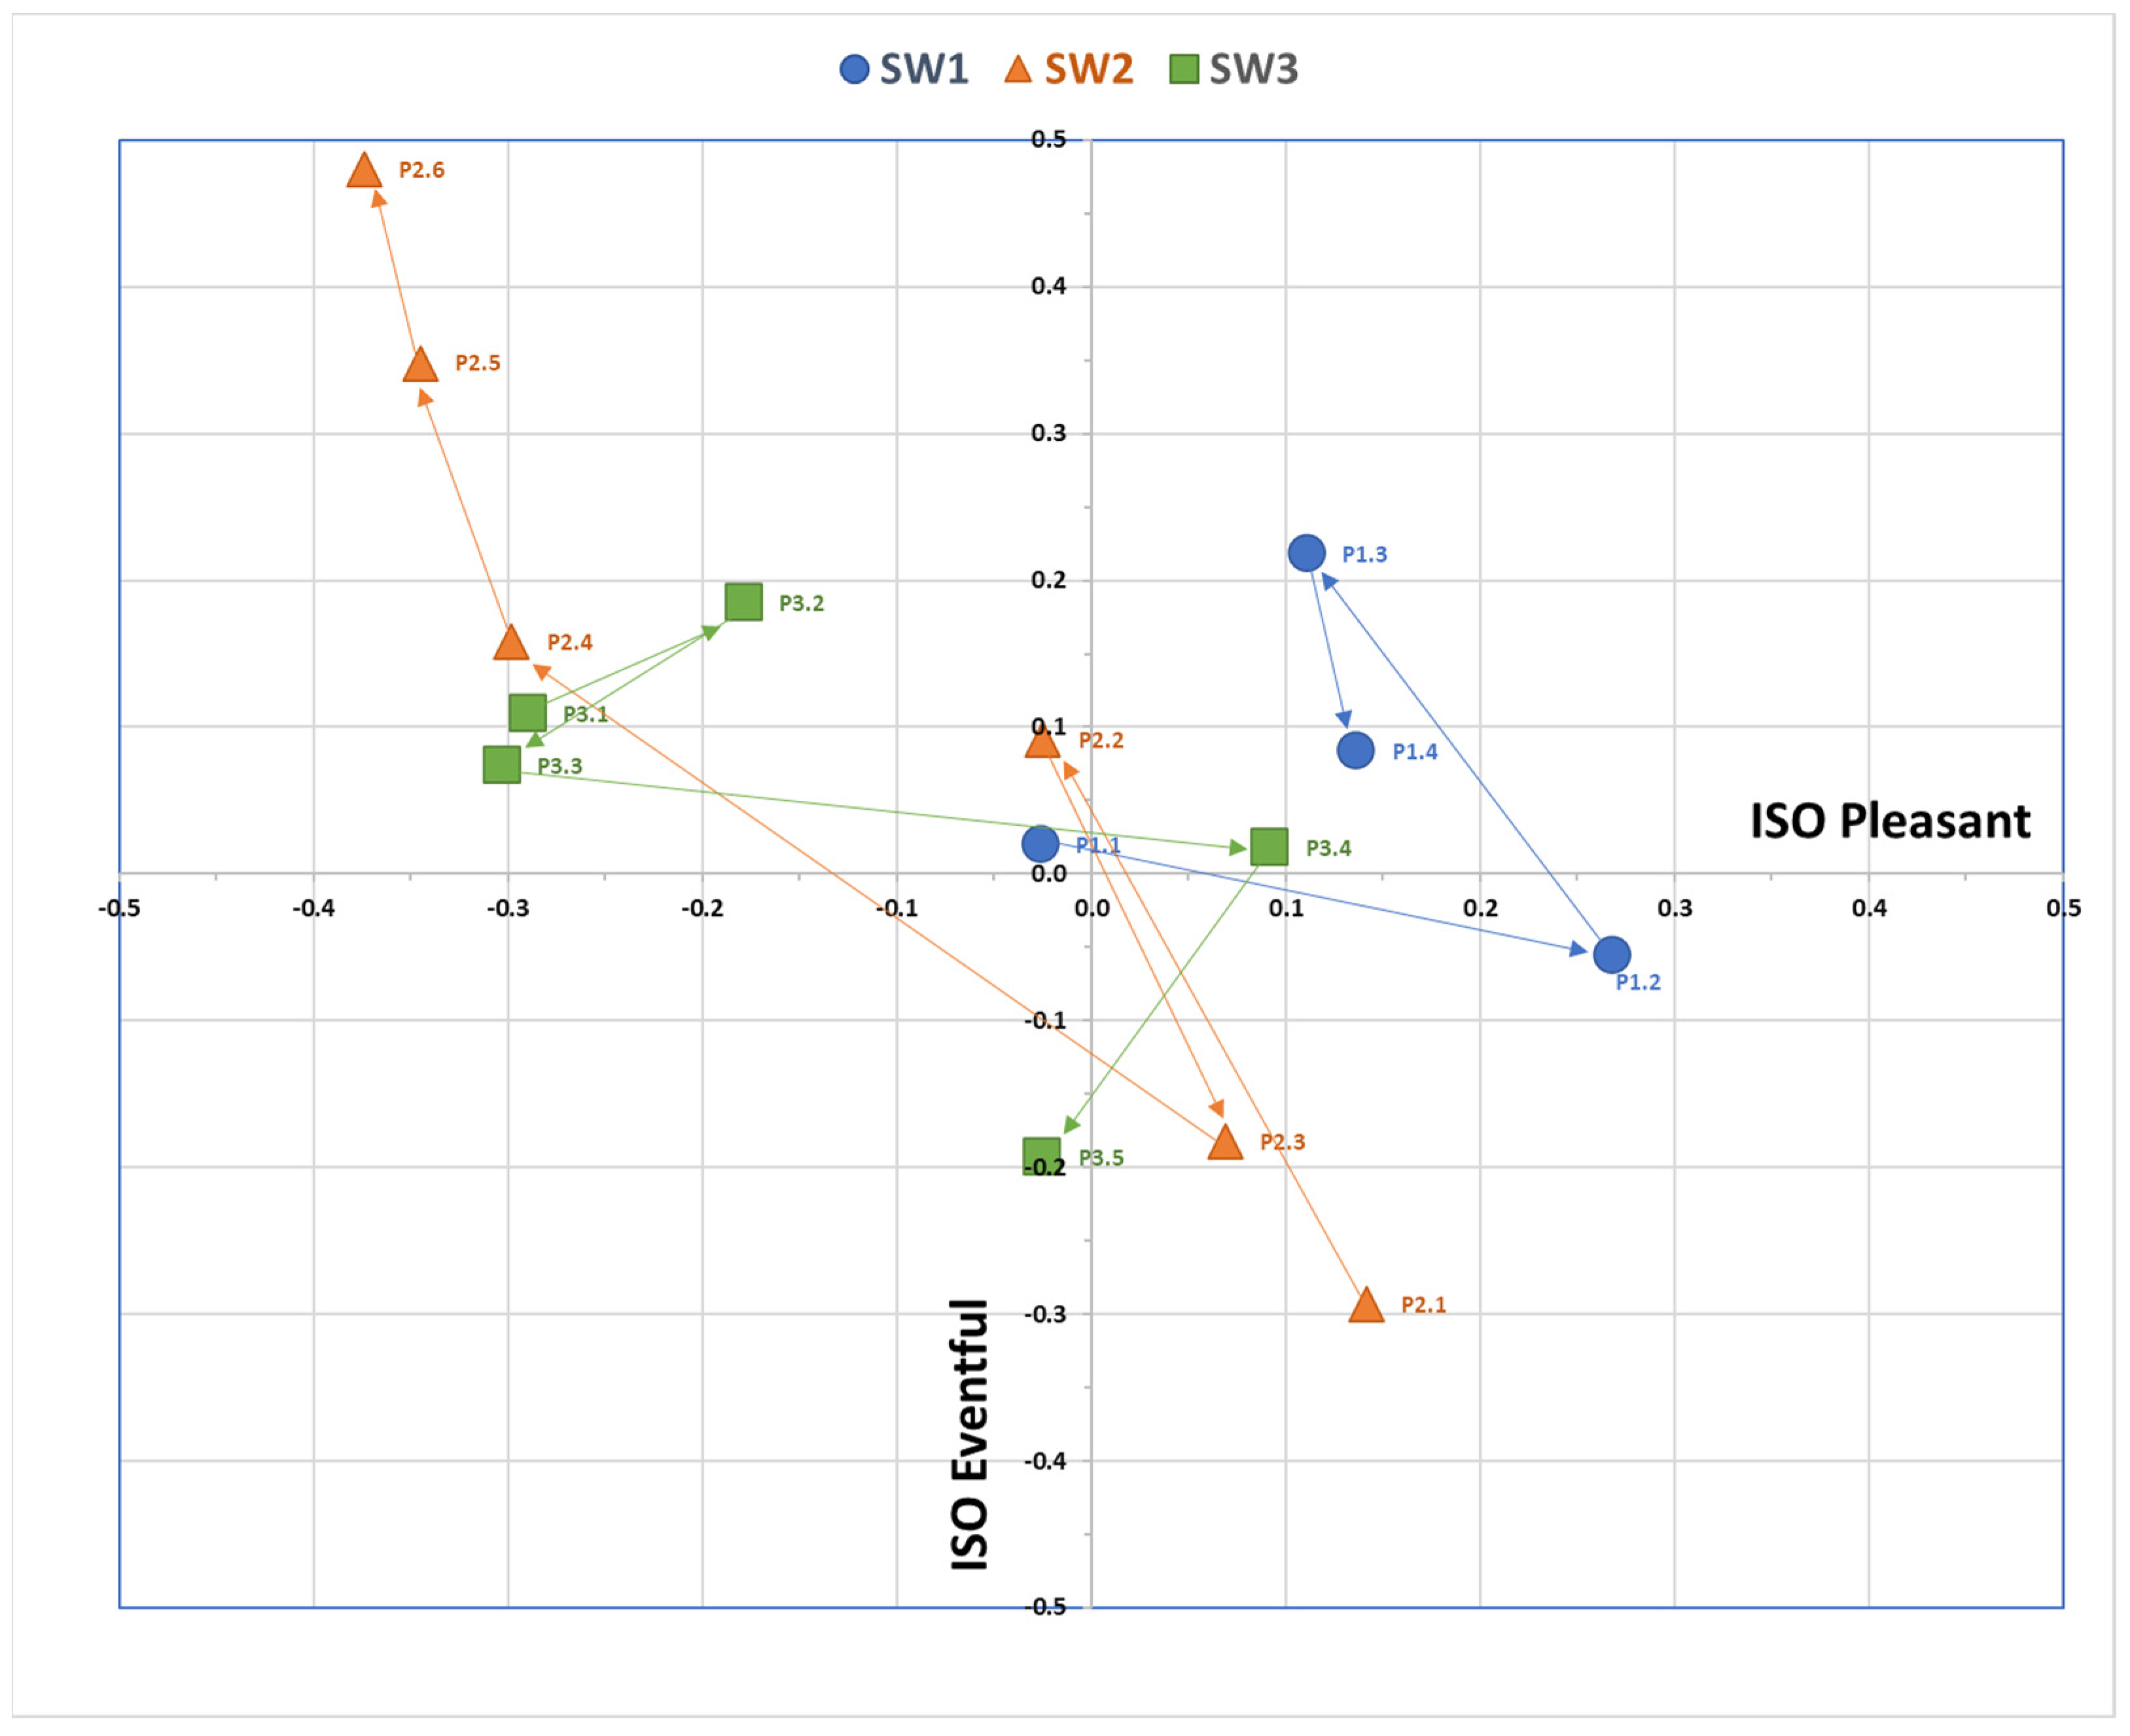
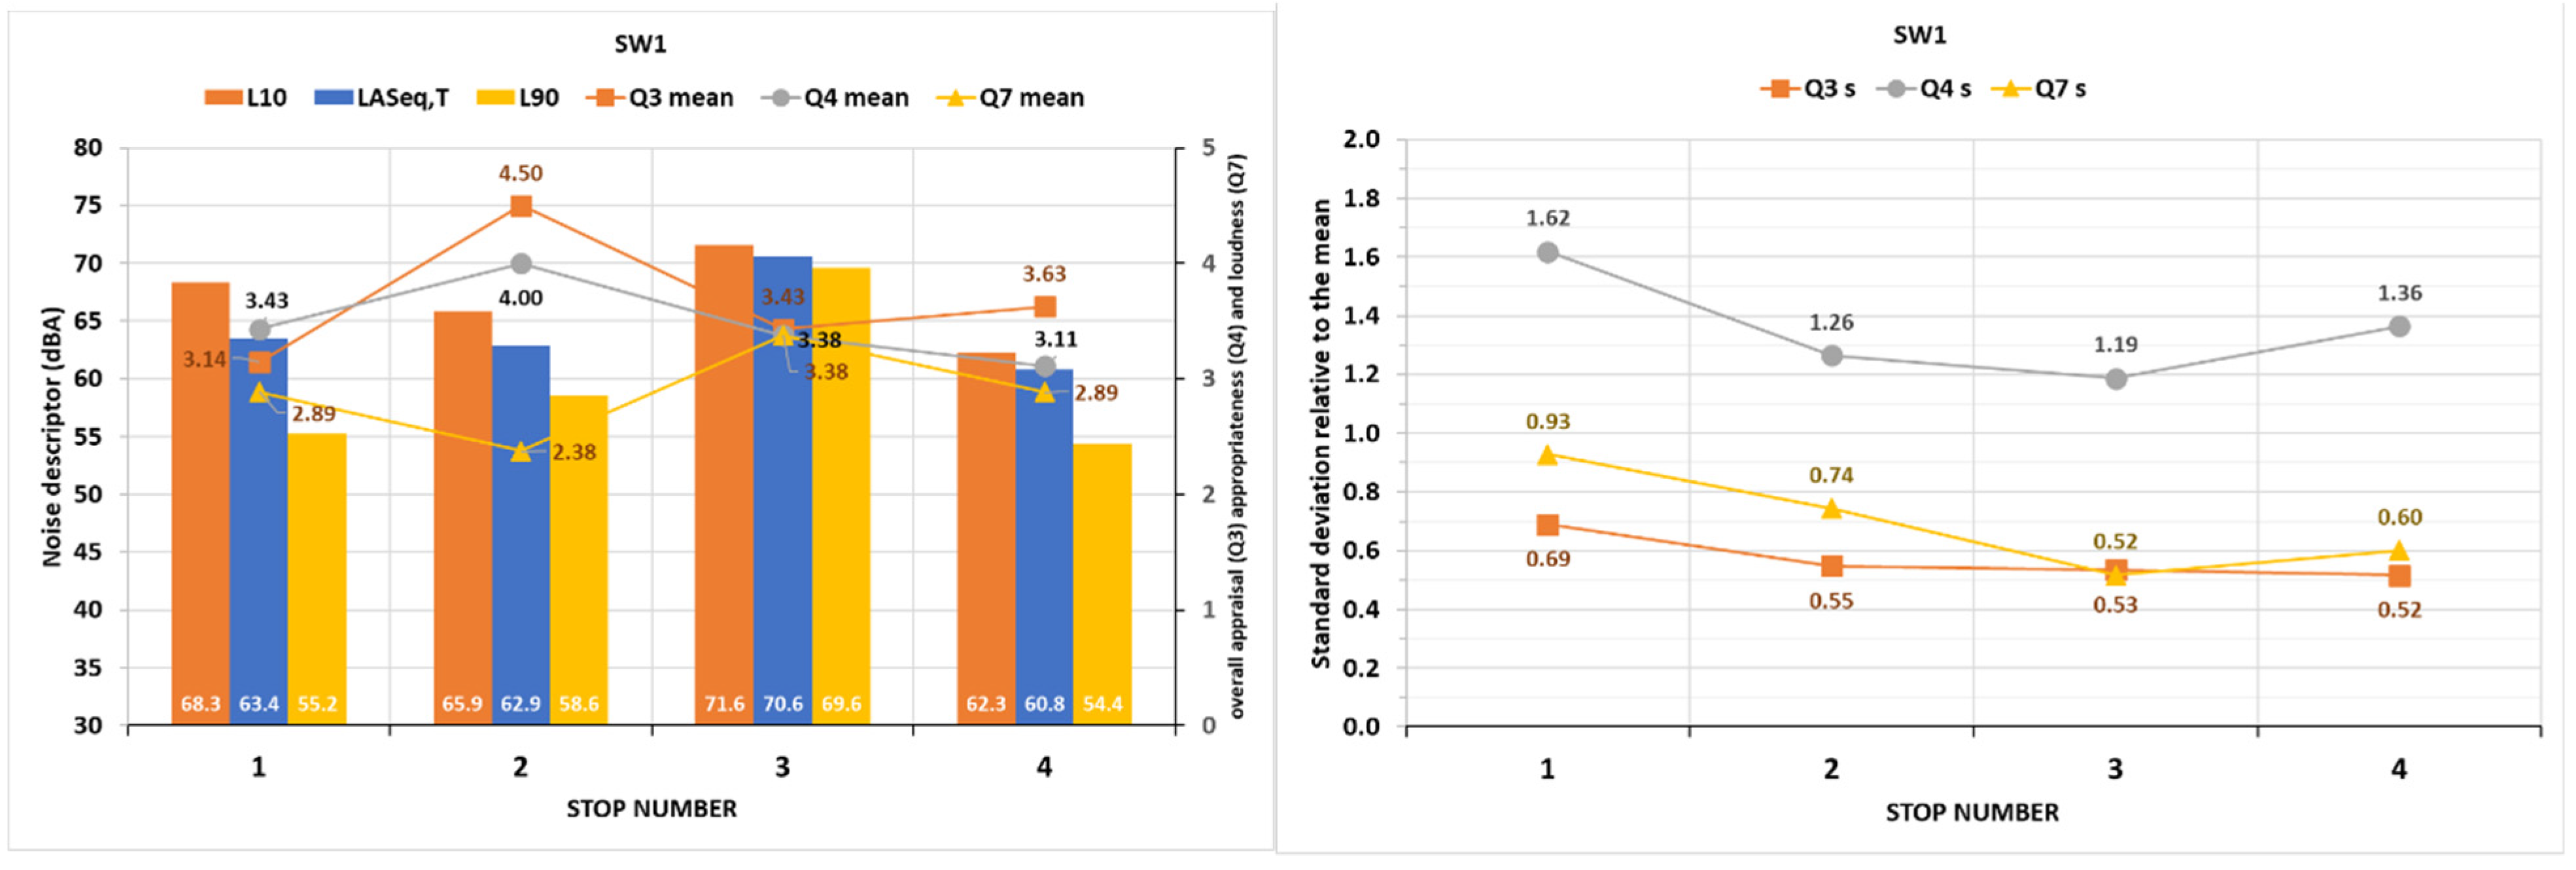
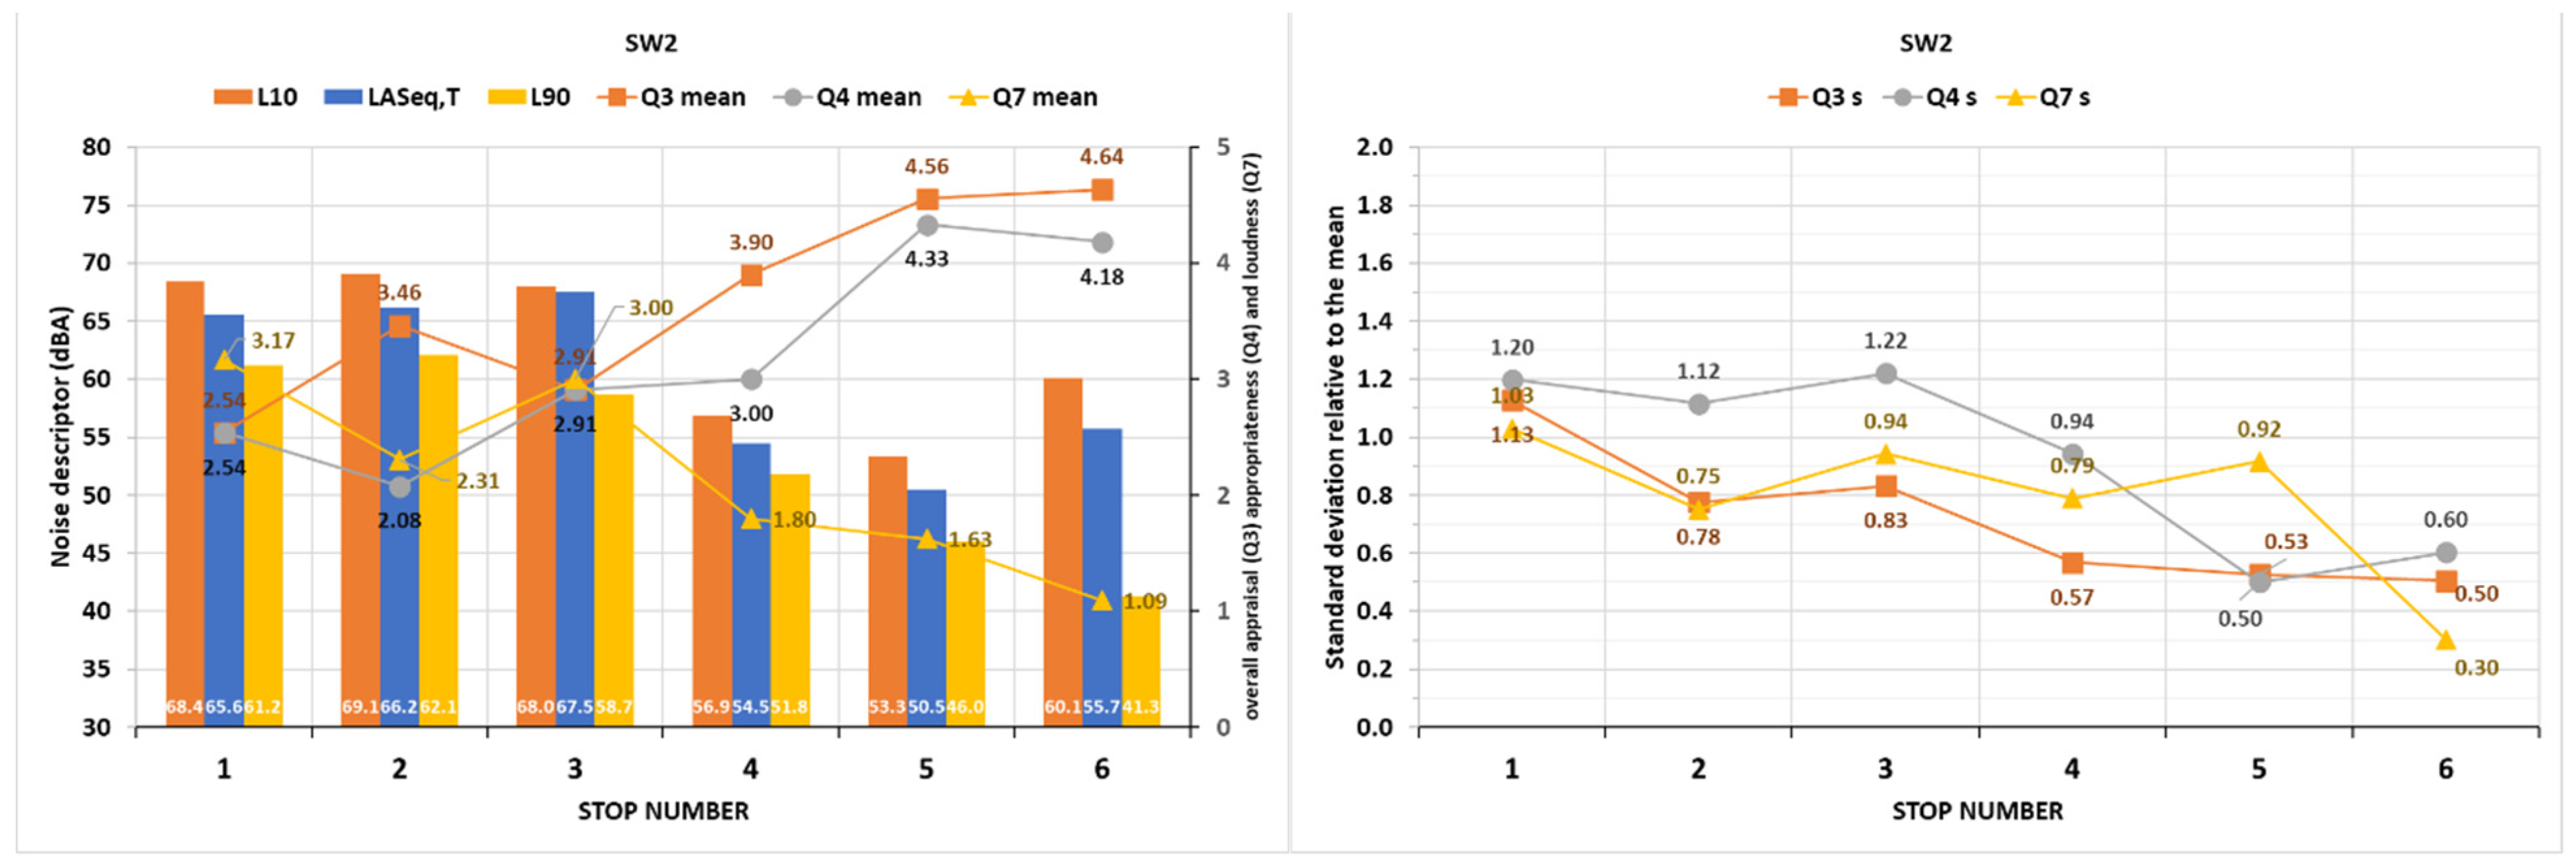
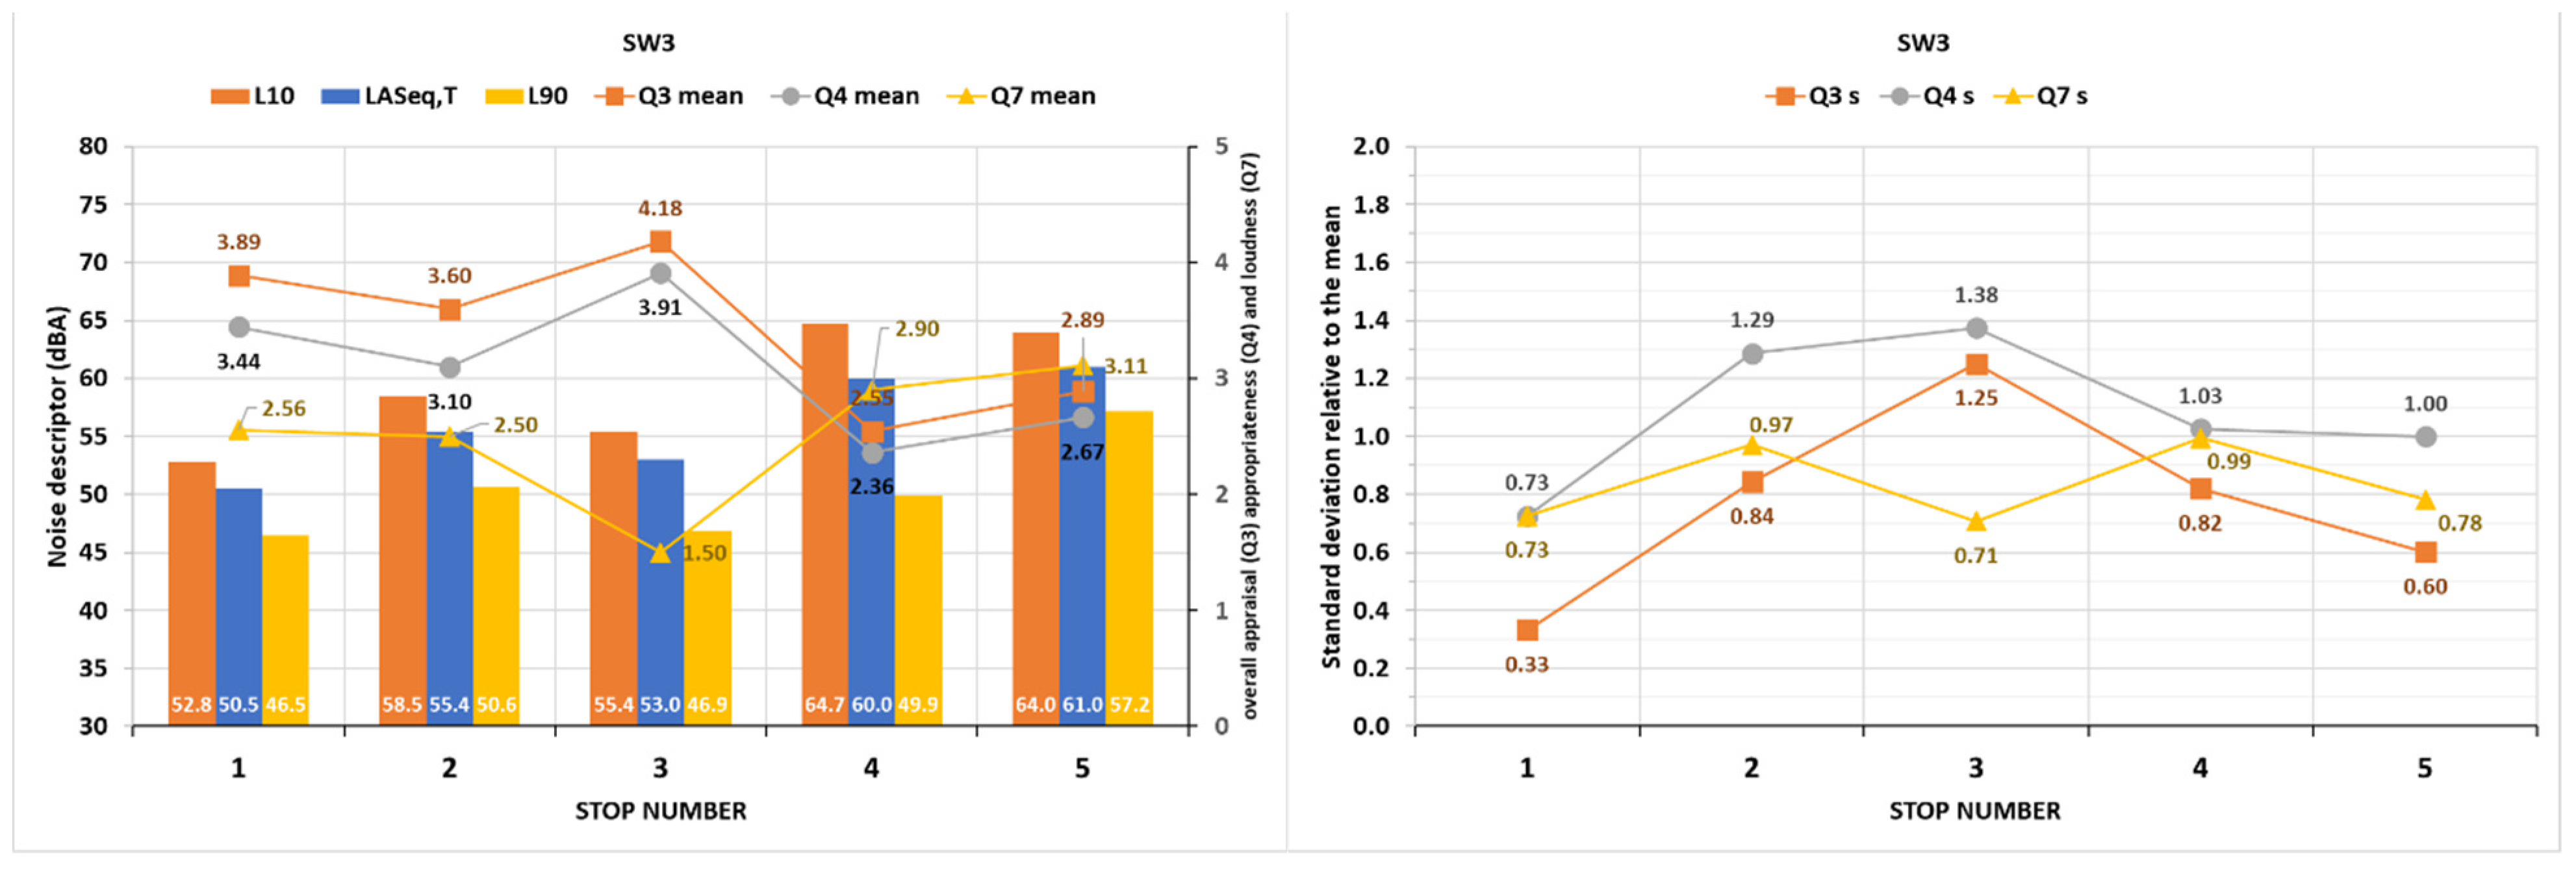
3.1.5. Assessment of the Surrounding Sound Environment
3.2. Comparison between Visually Impaired Sample and Nonvisually Impaired Samples
4. Discussion
4.1. Methodological Issues and Protocol Revision
4.2. Soundscape Evaluations of Visually Impaired People
4.3. Differences in Perceptual Outcomes between Visually Impaired and Nonvisually Impaired People
5. Conclusions
Supplementary Materials
Author Contributions
Funding
Institutional Review Board Statement
Informed Consent Statement
Data Availability Statement
Acknowledgments
Conflicts of Interest
References
- Welsh Government. Noise and Soundscape Action Plan 2018–2023; Ministry of Environment: Cardiff, UK, 2018.
- Kang, J.; Aletta, F.; Gjestland, T.T.; Brown, L.A.; Botteldooren, D.; Schulte-Fortkamp, B.; Lercher, P.; van Kamp, I.; Genuit, K.; Fiebig, A.; et al. Ten questions on the soundscapes of the built environment. Build. Environ. 2016, 108, 284–294. [Google Scholar] [CrossRef] [Green Version]
- European Environment Agency. Environmental Noise in Europe—2020; Publications Office of the European Union: Luxembourg, 2020. [Google Scholar] [CrossRef]
- Radicchi, A.; Yelmi, P.C.; Chung, A.; Jordan, P.; Stewart, S.; Tsaligopoulos, A.; McCunn, L.; Grant, M. Sound and the healthy city. Cities Health 2021, 5, 1–13. [Google Scholar] [CrossRef]
- Margaritis, E.; Kang, J.; Aletta, F.; Axelsson, Ö. On the relationship between land use and sound sources in the urban environment. J. Urban Des. 2020, 25, 629–645. [Google Scholar] [CrossRef]
- Aletta, F.; De Coensel, B.; Lindborg, P. Editorial: Human Perception of Environmental Sounds. Front. Psychol. 2021, 12, 714591. [Google Scholar] [CrossRef] [PubMed]
- Almagro Pastor, J.A.; Vida Manzano, J.; García Quesada, R. Soundscape approach for noise management of conflict urban areas. The PTS case in Granada (Spain). In Proceedings of the Internoise 2019 Conference, Madrid, Spain, 16–19 June 2019; Institute of Noise Control Engineering: Madrid, Spain, 2019. [Google Scholar]
- Vida, J.; Pastor, J.A.A.; Quesada, R.G. The importance of changing urban scenery in the assessment of citizens’ soundscape perception. On the need for different time-related points of view. Noise Mapp. 2021, 8, 138–161. [Google Scholar] [CrossRef]
- Vida, J.; Pastor, J.A.A.; Quesada, R.G.; Aletta, F.; Oberman, T.; Mitchell, A.; Kang, J. The “sound of silence” in Granada during the COVID-19 lockdown. Noise Mapp. 2021, 8, 16–31. [Google Scholar] [CrossRef]
- Radicchi, A.; Vida Manzano, J. Soundscape evaluation of urban social spaces. A comparative study: Berlin-Granada. J. Acoust. Soc. 2018, 144, 1660. [Google Scholar] [CrossRef]
- Mitchell, A.; Oberman, T.; Aletta, F.; Erfanian, M.; Kachlicka, M.; Lionello, M.; Kang, J. The Soundscape Indices (SSID) Protocol: A Method for Urban Soundscape Surveys—Questionnaires with Acoustical and Contextual Information. Appl. Sci. 2020, 10, 2397. [Google Scholar] [CrossRef] [Green Version]
- Mediastika, C.E.; Sudarsono, A.S.; Kristanto, L.; Tanuwidjaja, G.; Sunaryo, R.G.; Damayanti, R. Appraising the sonic environment of urban parks using the soundscape dimension of visually impaired people. Int. J. Urban Sci. 2020, 24, 216–241. [Google Scholar] [CrossRef]
- International Organization for Standardization. ISO/TS 12913-2:2018 Acoustics—Soundscape—Part 2: Data Collection and Reporting Requirements; ISO: Geneva, Switzerland, 2018. [Google Scholar]
- Mediastika, C.E.; Sudarsono, A.S.; Kristanto, L. Indonesian shopping malls: A soundscape appraisal by sighted and visually impaired people. Arch. Eng. Des. Manag. 2020, 1–20. [Google Scholar] [CrossRef]
- International Organization for Standardization. ISO 12913-1:2014 Acoustics—Soundscape—Part 1: Definition and Conceptual Framework; ISO: Geneva, Switzerland, 2014. [Google Scholar]
- Ayuntamiento de Granada. Noticias Destacada. Retrieved 27 October 2021. 2020. Available online: https://www.granada.org/inet/wprensa.nsf/a9bdd07842ba9975c125784d002ecdc5/dfd785008ff1ad7bc12585dc004362da!OpenDocument (accessed on 10 December 2021).
- Aletta, F.; Oberman, T.; Axelsson, Ö.; Xie, H.; Zhang, Y.; Lau, S.K.; Tang, S.K.; Jambrošić, K.; De Coensel, B.; van den Bosch, K.; et al. Soundscape assessment: Towards a validated translation of perceptual attributes in different languages. In Proceedings of the Internoise 2020 Conference, Seoul, Korea, 5–8 August 2020. [Google Scholar]
- Axelsson, Ö.; Nilsson, M.; Berglund, B. A principal components model of soundscape perception. J. Acoust. Soc. Am. 2010, 128, 2836–2846. [Google Scholar] [CrossRef] [PubMed]
- International Organization for Standardization. ISO/TS 12913-3:2019 Acoustics—Soundscape—Part 3: Data Analysis; ISO: Geneva, Switzerland, 2019. [Google Scholar]
- van den Bosch, K.A. Safe and Sound: Soundscape Research in Special Needs Care; University of Groningen: Groningen, The Netherlands, 2015. [Google Scholar]
- Sayin, E.; Krishna, A.; Ardelet, C.; Decré, G.B.; Goudey, A. “Sound and safe”: The effect of ambient sound on the perceived safety of public spaces. Int. J. Res. Mark. 2015, 32, 343–353. [Google Scholar] [CrossRef] [Green Version]
- Rychatáriková, M.; Herssens, J.; Heylighen, A. Towards more inclusive approaches in soundscape research. In Proceedings of the International Congress and Exposition on Noise Control Engineering, New York, NY, USA, 19–22 August 2012. [Google Scholar]
- Aural Diversity Network. Home. Retrieved 27 October 2021, from Aural DIversity Project. 2021. Available online: https://auraldiversity.org/index.html (accessed on 10 December 2021).
- Erfanian, M.; Mitchell, A.; Aletta, F.; Kang, J. Psychological well-being and demographic factors can mediate soundscape pleasantness and eventfulness: A large sample study. J. Environ. Psychol. 2021, 77, 101660. [Google Scholar] [CrossRef]


| Soundwalk | Urban Typology | Code | Length (km) | Stops | Date |
|---|---|---|---|---|---|
| SW1 | City centre | URB_1 | 1.4 | 8 (*) | 17 September 2020 |
| SW2 | City centre | URB_2 | 1.1 | 6 | 22 September 2020 |
| SW3 | Albaicín Moorish district | ALB_1 | 0.8 | 6 (*) | 25 September 2020 |
| Soundwalk | Version | Online Hosting | Number of Questions |
|---|---|---|---|
| SW1 | Online | Qualtrix | 12 |
| SW2 | Online and paper booklet | 15 | |
| SW3 | Online and paper booklet | 16 |
| Question | Content | SSID | ISO 12913-2:2018 | |
|---|---|---|---|---|
| Q1 | Sound source dominance | Yes | Yes | Method A |
| Q2 | Soundscape perceptual attributes | Yes | Yes | Method A |
| Q3 | Overall assessment of sound environment | Yes | Yes | Method A |
| Q4 | Appropriateness of sound environment | Yes | Yes | Method A |
| Q5 | How calm is it here? | No | No | |
| Q6 | How pleasant is it here? | No | No | (Opposite question is in Method B) |
| Q7 | How loud is it here? (volume, not quality) | Yes | Yes | Method B |
| Q8 | How often do you visit this place? | Yes | No | (Similar question is found in Method B) |
| Q9 | Gender | Yes | No | |
| Q10 | Occupational status | Yes | No | (Similar question is found in Method C) |
| Q11 | Level of education | Yes | No | |
| Q12 | WHO-5 items | Yes | No | |
| Question | Content | Origin |
|---|---|---|
| A | Q9 | as in SW1 |
| B | Q10 | as in SW1 |
| C | Q11 | as in SW1 |
| D | Q12 | as in SW1 |
| 1 | Q8 | as in SW1 |
| 2 | Q1 | as in SW1 |
| 3 | Q2 | as in SW1 |
| 4 | Q3 | as in SW1 |
| 5 | Q4 | as in SW1 |
| 6 | Q7 | as in SW1 |
| 7 | To what extent are you able to orientate yourself in this site? | NEW (Q7N) |
| 8 | Would you say environmental noise could be a problem at this site? | NEW (Q8N) |
| 9 | Would you recognize this site if your ever came back here? | NEW (Q9N) |
| Question | Content | Origin |
|---|---|---|
| 10 | In relation to pedestrian accessibility, comfort, and architectural barriers that would prevent access, what was the soundwalk like until you reached the site number? (a reference to every stop site follows) | NEW (Q10N) |
| Soundwalk | Participants Total (F/M) | Stops | Answers (Max. Resp. Number) | N° of Questions in Survey | Pieces of Info from Soundwalk |
|---|---|---|---|---|---|
| SW1 | 9 (3/6) | 4 | 34 (36) | 12 | 408 |
| SW2 | 13 (6/7) | 6 | 67 (78) | 13 | 871 |
| SW3 | 11 (7/4) | 5 | 50 (55) | 14 | 700 |
| TOTAL | 33 | 15 | 151 (169) | - | 1.979 |
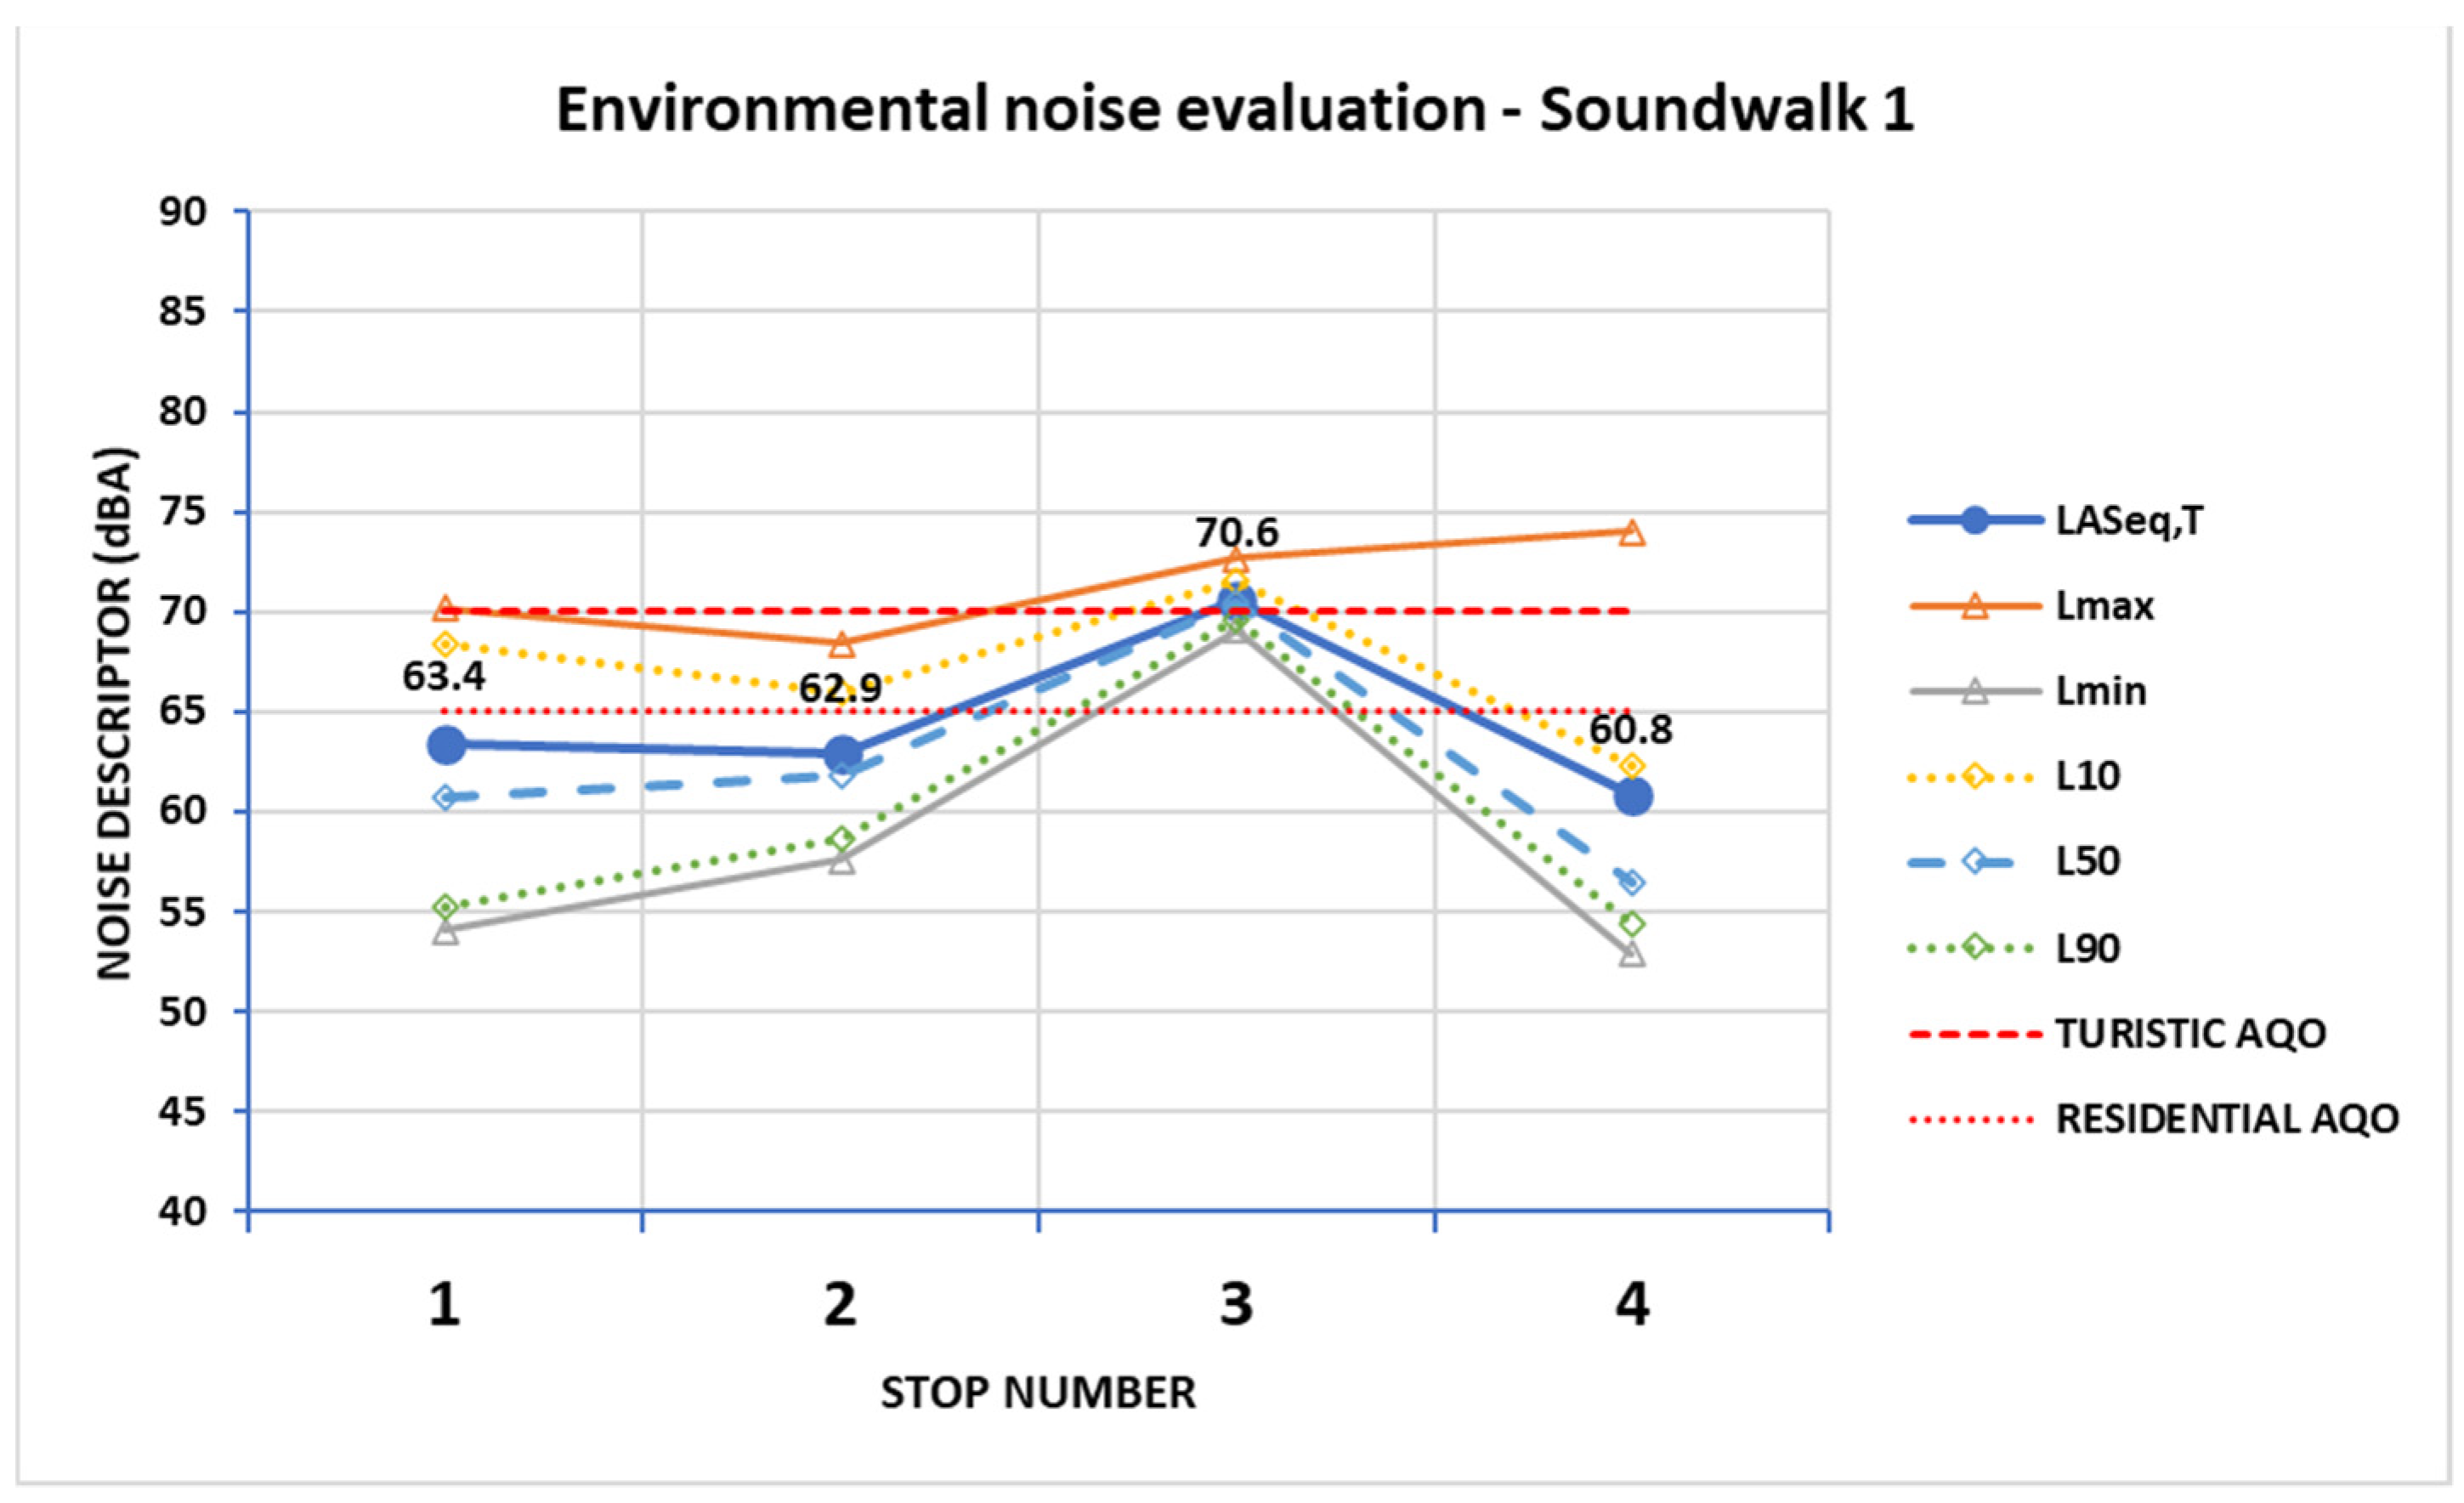
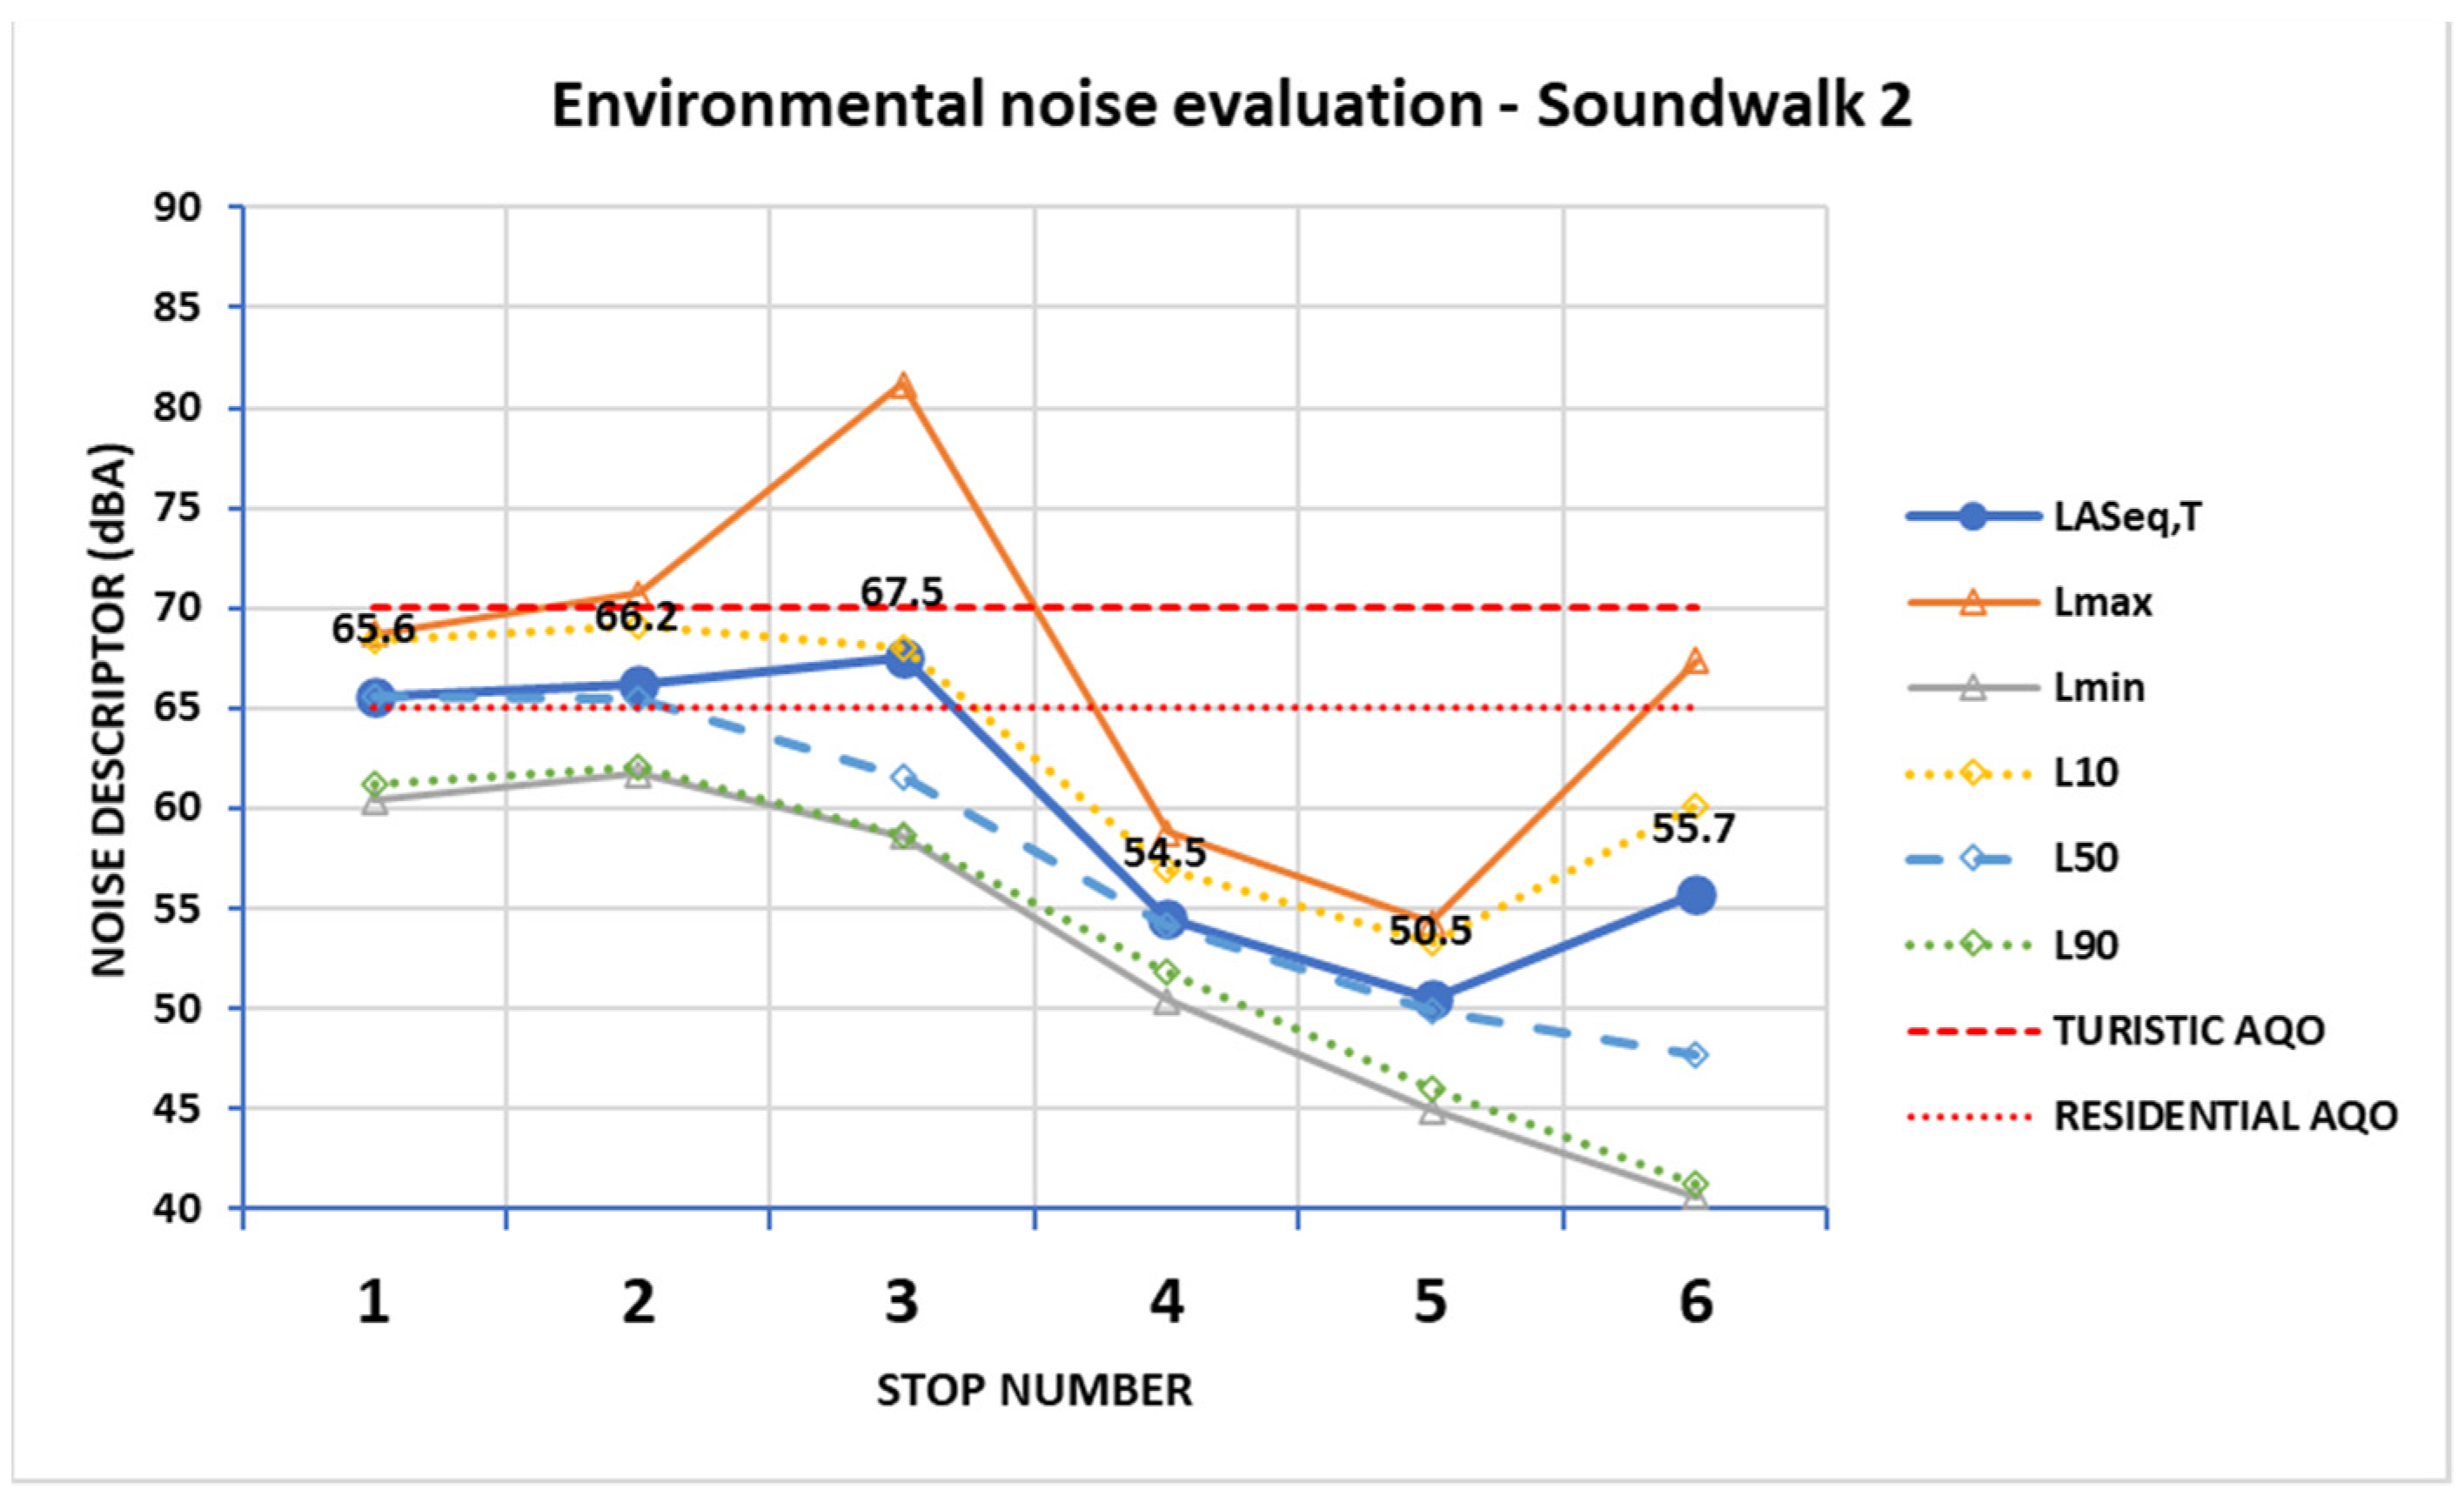
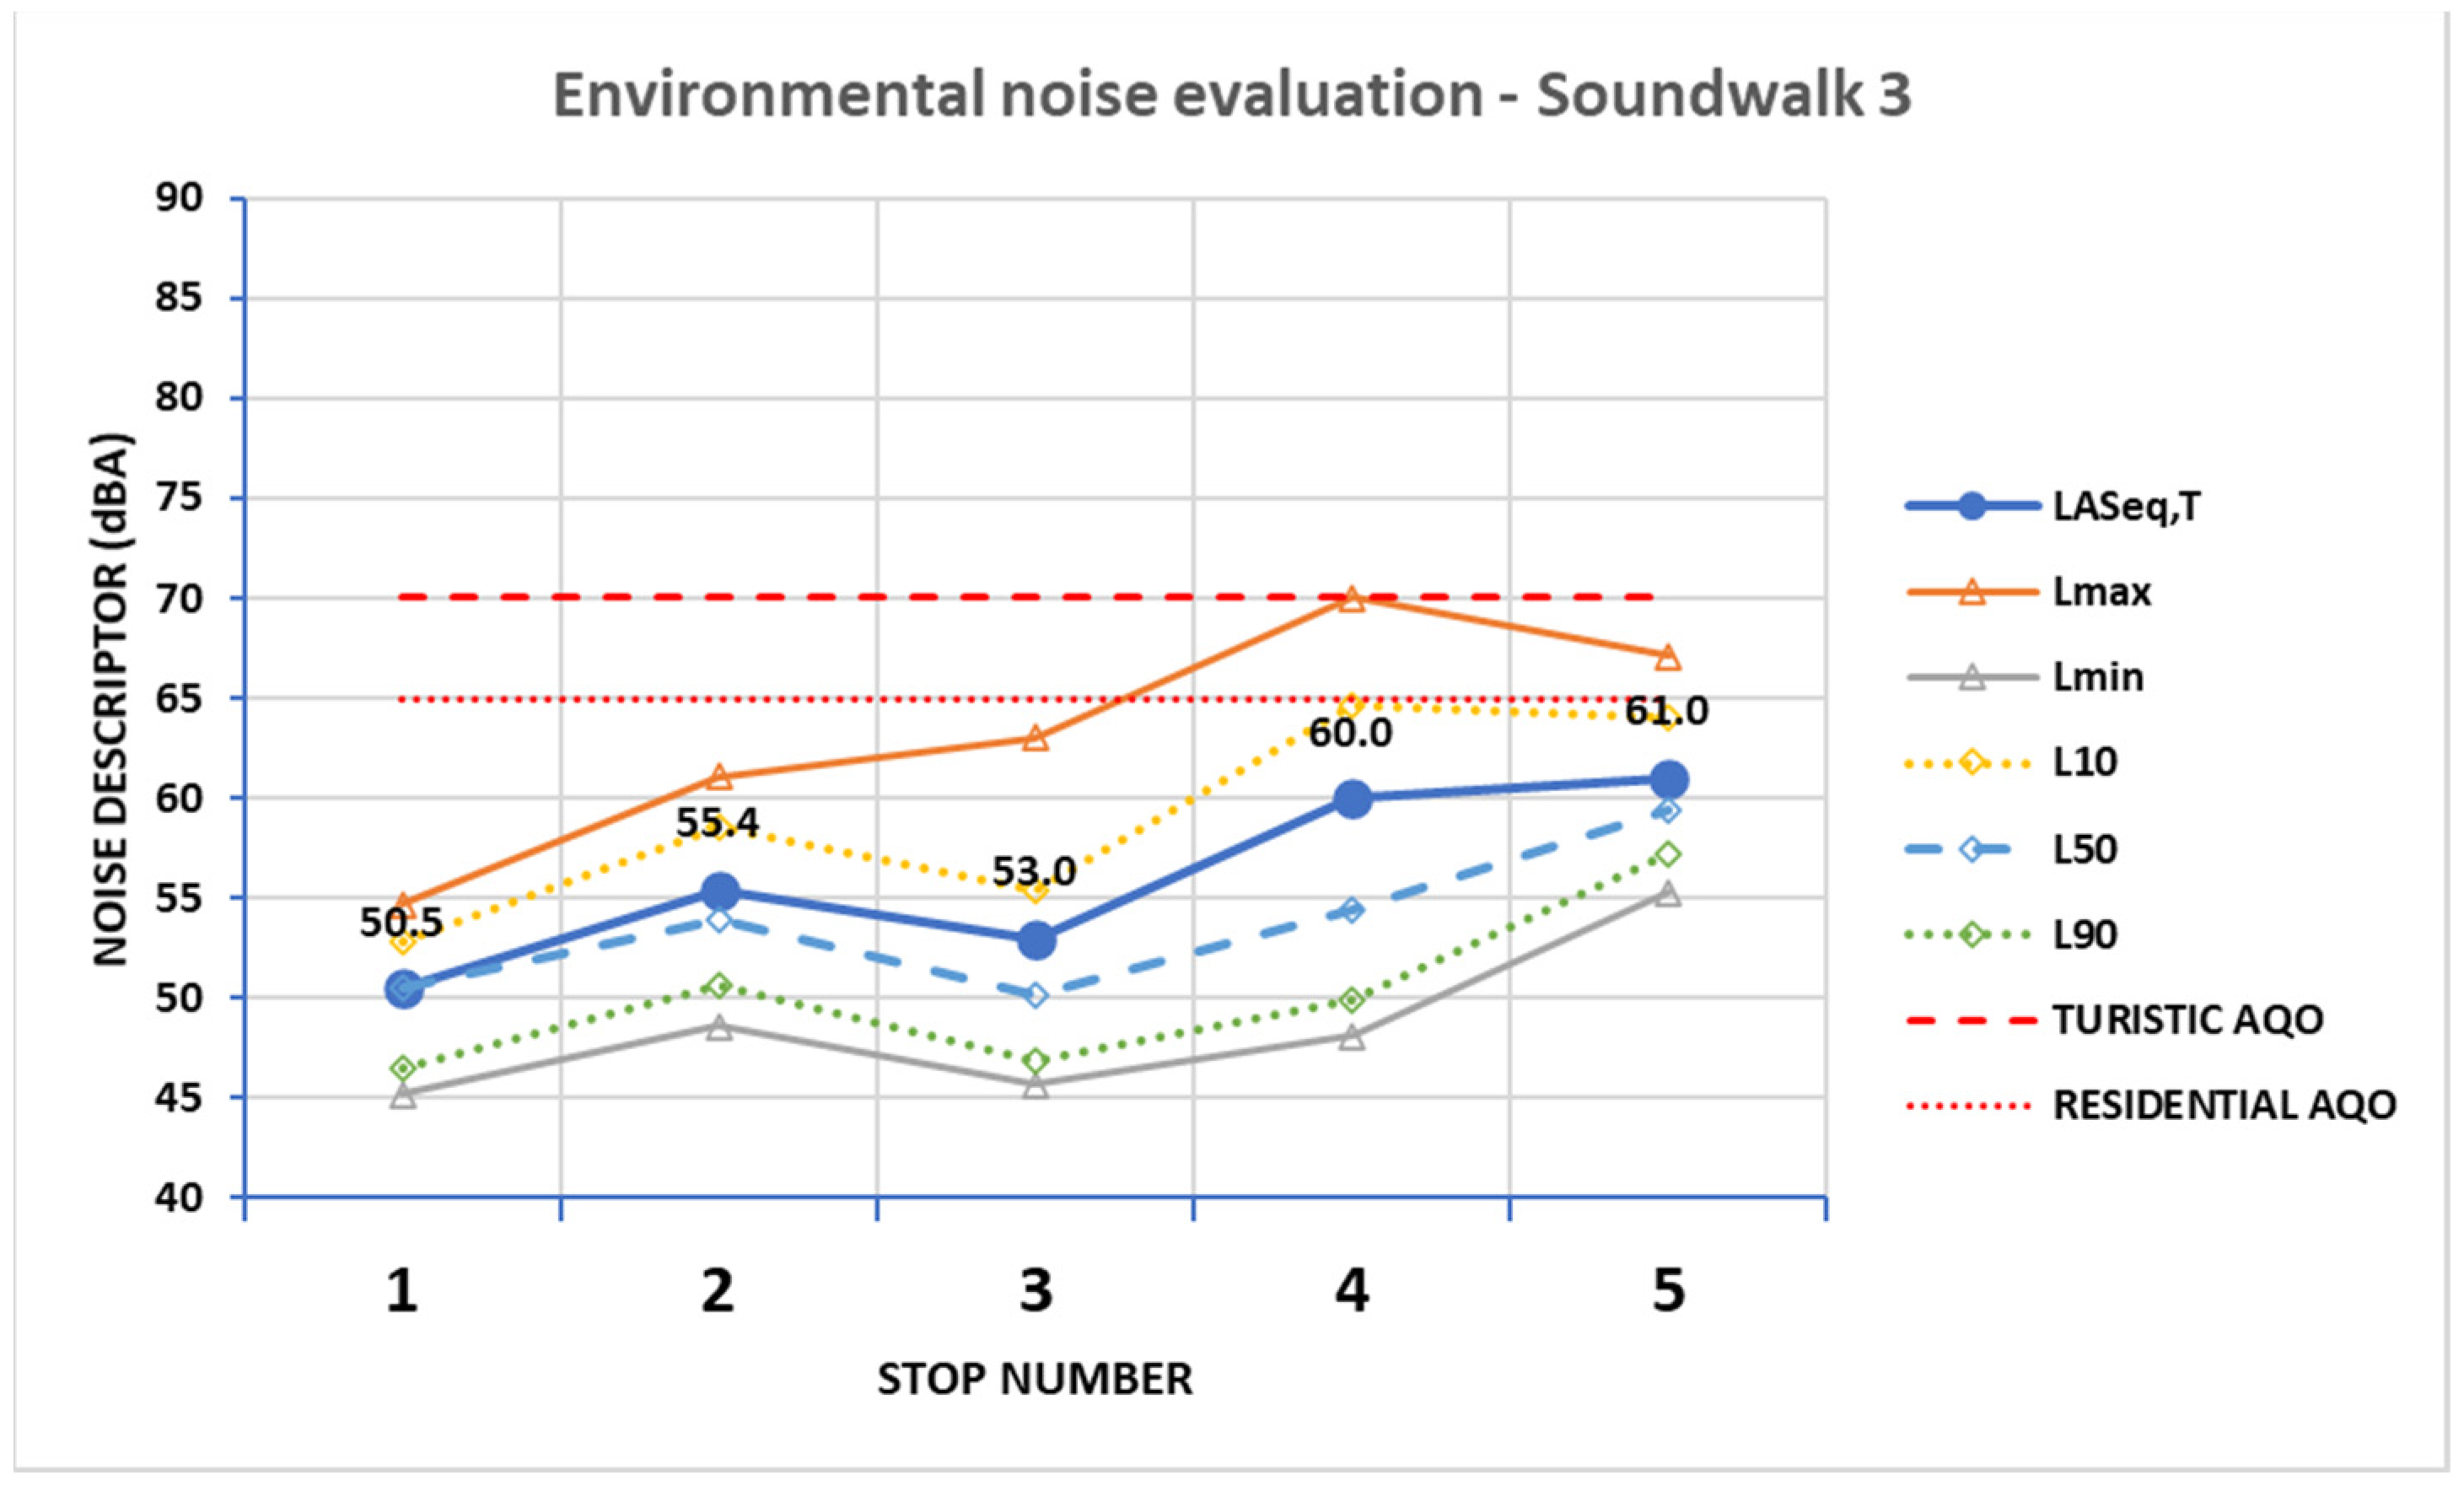
| Soundwalk | Stop Site | Time (hh:mm) | LASeq | LAmax | LAmin | L10 | L50 | L90 | (L10–L90) |
|---|---|---|---|---|---|---|---|---|---|
| SW1 | 1 | 8:55 | 63.4 | 70.2 | 54.0 | 68.3 | 60.8 | 55.2 | 13.1 |
| 2 | 11:07 | 62.9 | 68.4 | 57.6 | 65.9 | 61.8 | 58.6 | 7.3 | |
| * 3 | 11:41 | 70.6 | 72.7 | 69.1 | 71.6 | 70.5 | 69.6 | 2.0 | |
| ** 4 | 12:15 | 60.8 | 74.0 | 52.9 | 62.3 | 56.4 | 54.4 | 7.9 | |
| SW2 | * 1 | 10:24 | 65.6 | 68.7 | 60.4 | 68.4 | 65.6 | 61.2 | 7.2 |
| 2 | 11:06 | 66.2 | 70.7 | 61.7 | 69.1 | 65.5 | 62.1 | 7.0 | |
| 3 | 11:03 | 67.5 | 81.2 | 58.6 | 68.0 | 61.6 | 58.7 | 9.3 | |
| 4 | 11:25 | 54.5 | 58.8 | 50.4 | 56.9 | 54.2 | 51.8 | 5.1 | |
| 5 | 11:48 | 50.5 | 54.3 | 44.9 | 53.3 | 49.9 | 46.0 | 7.3 | |
| 6 | 12:13 | 55.7 | 67.4 | 40.6 | 60.1 | 47.7 | 41.3 | 18.8 | |
| SW3 | 1 | 10:28 | 50.5 | 54.7 | 45.2 | 52.8 | 50.5 | 46.5 | 6.3 |
| 2 | 11:00 | 55.4 | 61.1 | 48.6 | 58.5 | 53.9 | 50.6 | 7.9 | |
| 3 | 11:24 | 53.0 | 63.0 | 45.7 | 55.4 | 50.2 | 46.9 | 8.5 | |
| 4 | 11:51 | 60.0 | 70.0 | 48.1 | 64.7 | 54.4 | 49.9 | 14.8 | |
| ** 5 | 12:15 | 61.0 | 67.1 | 55.3 | 64.0 | 59.4 | 57.2 | 6.8 |
| San Nicolás Viewpoint | LCeq (1) | LAeq | LAF10 | LAFmax | LAF90 | LAFmin | LAF10-LAF90 | LAE |
|---|---|---|---|---|---|---|---|---|
| SSID (2019) | 67.3 | 62.0 | 64.2 | 78.2 | 56.7 | 52.0 | 7.5 | 87.6 |
| ONCE (2020) | 62.3 | 50.5 | 52.8 | 54.7 | 46.5 | 45.2 | 6.3 | 68.3 |
Publisher’s Note: MDPI stays neutral with regard to jurisdictional claims in published maps and institutional affiliations. |
© 2021 by the authors. Licensee MDPI, Basel, Switzerland. This article is an open access article distributed under the terms and conditions of the Creative Commons Attribution (CC BY) license (https://creativecommons.org/licenses/by/4.0/).
Share and Cite
Vida, J.; Almagro, J.A.; García-Quesada, R.; Aletta, F.; Oberman, T.; Mitchell, A.; Kang, J. Urban Soundscape Assessment by Visually Impaired People: First Methodological Approach in Granada (Spain). Sustainability 2021, 13, 13867. https://doi.org/10.3390/su132413867
Vida J, Almagro JA, García-Quesada R, Aletta F, Oberman T, Mitchell A, Kang J. Urban Soundscape Assessment by Visually Impaired People: First Methodological Approach in Granada (Spain). Sustainability. 2021; 13(24):13867. https://doi.org/10.3390/su132413867
Chicago/Turabian StyleVida, Jerónimo, José Antonio Almagro, Rafael García-Quesada, Francesco Aletta, Tin Oberman, Andrew Mitchell, and Jian Kang. 2021. "Urban Soundscape Assessment by Visually Impaired People: First Methodological Approach in Granada (Spain)" Sustainability 13, no. 24: 13867. https://doi.org/10.3390/su132413867
APA StyleVida, J., Almagro, J. A., García-Quesada, R., Aletta, F., Oberman, T., Mitchell, A., & Kang, J. (2021). Urban Soundscape Assessment by Visually Impaired People: First Methodological Approach in Granada (Spain). Sustainability, 13(24), 13867. https://doi.org/10.3390/su132413867