Article

The Booming Number of Museums and Their Inequality Changes in China

1
College of Life Sciences, Zhejiang University, Hangzhou 310058, China
2
Artistic Design & Creation School, Zhejiang University City College, Hangzhou 310015, China
*
Authors to whom correspondence should be addressed.
Sustainability 2021, 13(24), 13860; https://doi.org/10.3390/su132413860
Submission received: 20 November 2021 / Revised: 9 December 2021 / Accepted: 12 December 2021 / Published: 15 December 2021
(This article belongs to the Section Tourism, Culture, and Heritage)

Abstract

:
As the spaces for dialogue between the past and the future, museums are essential to human well-being and social sustainability. Here, we collected data from 328 cities in 31 provinces of mainland China from 1980 to 2019 to investigate the changes in number and spatial inequalities of museums. The results showed that: (1) in mainland China, there were only 137 museums in 1980, and while this increased to 5626 in 2019, China still possessed only four museums per million people; (2) the increasing number of museums lagged behind the growth rate of both the population and economy at both the province and city level; (3) the Gini coefficient of museums per million people was only 0.27 in 2019, indicating relative equality of visiting opportunities among the provinces of China; (4) the Gini coefficients of per capita museums in some provinces were higher than that of the whole nation, with the highest ~0.6 in 2010 and 0.4 in 2017; (5) the economic competitiveness and human well-being of a city were promoted by an increased number of museums. We suggest that the central government of China should increase the number of museums in all provinces, while some provinces should pay more attention to the inequality in the distribution of cultural facilities among cities.

1. Introduction

A museum is a permanent non-profit institution in the service of society and its development that is open to the public [1]. Museums hold archives of ideas, carry abundant cultural connotations, and promote diffusion of knowledge. Culture and heritage can be considered key factors for sustainable development [2]. Since the first modern public museum was established in 1683 in the United Kingdom [3], people have increasingly appreciated the contribution of museums to a sustainable society [1]. Until now, museums have mainly been distributed among developed countries. The development of museums is a new topic in developing countries, where cultural facilities are receiving attention along with economic development. For example, most museums in China were established in the past three decades. However, with China having been the world’s second-largest economy since 2010 [4], the number of museums per million people in 2019 was 4.03, only ~1/5 that of France [5], 1/9 that of the United Kingdom [6], and 1/23 that of the United States [7]. Understanding the growth trend of museums and its relationship with city development has become a primary issue in formulating corresponding development policies.
The equitable distribution of public facilities is one of the major concerns of planners [8], and the distribution of museums is regarded as a matter of social justice [9]. Recently, some studies [10] have noticed the inequality caused by mismatching of the spatial distribution of populations and museums within cities, similar to inequality studies on other types of cultural relics [11,12]. Most museums are located in large cities [10]. Owing to the distance decay effect of public facilities [13,14], museums mainly serve local people [15]. This means that the uneven spatial distribution of the number of museums results in inequality of opportunities for people to visit museums in different regions. For example, in the United States of America Vermont has nine times more museums per million people than Florida. This inequality relates to the economic level of a region [16,17], with rich areas having a higher level of participation in cultural activities [18]. These inequalities in many aspects are recognized as a barrier to sustainable urban development and the improvement of human well-being [19]. Reducing inequalities and eliminating disparities in accessibility are central to sustainable development goals [20].
Accurately measuring inequity is a necessary premise on the way to proposing potential solutions. The Gini coefficient was first used in economics to measure income inequality within a population [21,22]. It has also been used in many other fields, and provides a quantitative measure of the inequality in different socioeconomic conditions among areas [23,24] while also evaluating the mismatch between the spatial distributions of facilities and populations [22,25]. For example, some studies have quantified the Gini coefficients of the accessibility of public facilities such as walking roads, public transport facilities and cars [8], hospitals in cities [26], and the spatial inequality of museums in different parts of a city [10]. The Gini coefficient can be used by policymakers to measure the equality of cultural facilities in order to maintain social vitality and sustainable development. These pioneering studies quantified the inequality of cultural facilities; however, they were mainly limited to the interiors of cities. Using the Gini coefficient to quantify the spatial inequalities of the number of museums in different cities and regions of a country is crucial to investigating cultural resource allocation and optimization.
In contrast to the negative effects of inequality, the uneven spatial distribution of city facilities can promote the efficient use of facilities due to the agglomeration effect [27]. The agglomeration effect with respect to museums is conducive to the vitality and sustainable development of cities [28] because it heightens the demand of consumers and enhances a perception for quality [29,30]. Leisure and tourism are increasingly important beyond museums’ basic functions [31]. The positive externalities of the agglomeration effect such as knowledge spillovers, labor sharing and economies of scale [32,33] enlarge the gap in city development and well-being between large cities and small cities. Yet, the promotion of the agglomeration effect of museums on economic activities and human well-being is still lacking exploration.
In this study, we take China as a case study to explore the increasing trends of the number of museums as well as spatial inequities at both the provincial and city level. Based on data from 31 provinces and 328 cities in mainland China from 1980 to 2019, this study aimed to examine: (1) historical trends in the number of museums in different provinces of China; (2) the number of museums relative to the local population and economic level; (3) the inequalities (Gini coefficients) of the per capita number of museums among the provinces and the cities within the provinces; and (4) the relationships between the number and unequal distribution of museums and some crucial features related to human well-being. Due to the research scale, this study is highly indicative in the macro-geographic sense. Finally, we provide some advice concerning cultural policies, in order to aid in the proper development of museums at different geographical scales with a balance of equality and efficiency.

2. Materials and Methods

Data Collection

The number of museums in 31 provinces and 328 cities of mainland China were obtained from two sources. The data for 2000 and 2008–2019 were collected from the China Museum List [34] issued by the central government, and the data for other years were collected from provincial government documents [35]. These statistics did not mark the city where museums were located, so we used the positioning system to identify them manually. We also considered changes in administration districts. We visited more than 100 museums in Beijing, Tianjin, Hebei, Henan, Zhejiang, Inner Mongolia Autonomous Region, Xinjiang Uygur Autonomous Region, Jilin, Heilongjiang, Shanghai, Fujian, Gansu, Shaanxi, Shanxi, Jiangsu, Shandong, Guizhou, Sichuan, Chongqing, and Jiangxi Provinces, and confirmed that many museums in the list were in normal operation and the information was accurate.
According to the China Museum List, there are four types of museums in China: cultural relics, industry, non-state owned, and other. Among these, cultural relics and industry museums are operated by the state governments. The ‘other’ category refers mainly to celebrity memorial museums, which are non-state operated. Therefore, in this study, the museums in China are divided into state owned and non-state owned museums.
The population and GDP data of the cities were obtained from the Chinese City Censuses, Chinese City Statistical Yearbooks, and National Economic and Social Development Statistical Bulletins [36]. The municipalities or autonomous regions in China are equal to provinces. In terms of the accessibility of data, Gini calculations are available up to 2017, while the historical trend in the number of museums is measured up to 2019.
Data on comprehensive urban economic competitiveness were obtained from the Annual Report on China’s Urban Competitiveness [37]. Economic competitiveness is a compound variable and is measured by multiplying the average increment of GDP for five consecutive years by the GDP per unit city area. Economic competitiveness was transformed through the method of min–max normalization to a fixed scale (0–1 here) in which a higher value corresponds to higher competitiveness. The healthy life index [38] integrates the income, public services, environment, education and medical conditions for people, while the livable competitiveness [37] integrates the life expectancy, education, number of doctors and schools per capita, crime rate, and living environment. The cultural policies of the central government of China were obtained from publications or websites (Supplementary Table S1).
The frequency of words in newspapers can reflect public attention toward something [39], including museums. In order to quantify the human preference for museums at different stages, we collected the number of occurrences of the concept of a museum in the Chinese language from People’s Daily [40], the largest newspaper group in China, from 1946 to 2015, in order to find historical trends in people’s preferences regarding museums. We searched for the words “museum”, “art gallery”, “exhibition hall”, “cultural center” and “memorial hall”, which cover most synonyms of “museum” in Chinese. The search scope covers the title and body of the articles. We divide the search results by the total number of articles to obtain the frequency in order to eliminate the interference of layout change or the number of articles.

3. Calculations

Increasing rate Scale law has been frequently used to investigate the relationship between the number of city components or facilities and city size, which is often indicated by the population or economy [41,42]. If the city components in the scale law model (Y = a·Xβ) show a super-linear response to population, the agglomeration effect exists, which may cause inequality [43]. For example, the number of restaurants shows a super-linear (β > 1) response to population in Italy and the Netherlands [44]. However, many cultural components, such as schools and theatres, have shown a near-linear (β~1) response to local population [45,46], suggesting the absence of an agglomeration effect.

Inequality

The Lorenz curve and Gini coefficient in economics [24] were used to quantify the inequality of the per capita number of museums among provinces and the cities within provinces. Then, the per capita number of museums (Npm) within a province or a city was
Npm = Ntm/Ppop
where Ntm is the total number of museums in a province or a city and Ppop is the total resident population of a province or a city.
For the Lorenz curve, we first ranked the population according to the per capita number of museums from low to high. Second, the total population was evenly divided into ten groups. The Lorenz curve of the museum distribution is a ranked distribution of the cumulative population on the horizontal axis versus the cumulative number of museums on the vertical axis. Based on the Lorenz curve of the distribution of museums, the Gini coefficient is calculated as
Gini = 1 k = 1 n ( P k P k 1 ) ( S k + S k 1 )
where n is the number of population groups sorted by per capita museums from low to high, n = 10 in this study; k ranges from 0 to n; P k is the cumulative proportion of the population of the province or city, P 0 = 0, P n   = 1; and S k is the cumulative proportion of museums shared by the corresponding number of people when S k   = 0, S n   = 1. A Gini coefficient close to 0 means perfect equality; in contrast, a Gini coefficient close to 1 means complete inequality.

4. Scale Law and Allometric Relationships

Power-law function was used to analyze the scale law of the number of museums in response to province or city size, which was indicated by population. The function was also used to analyze the allometric relationships between the number of museums and local economic level (GDP):
Y = a · Xβ
where Y is the number of museums in the province or city, X is the population or the GDP of the province or city, and β is the scaling exponent of the museums. The response of the number of visitors to the number of museums also applies to this equation.

5. Results

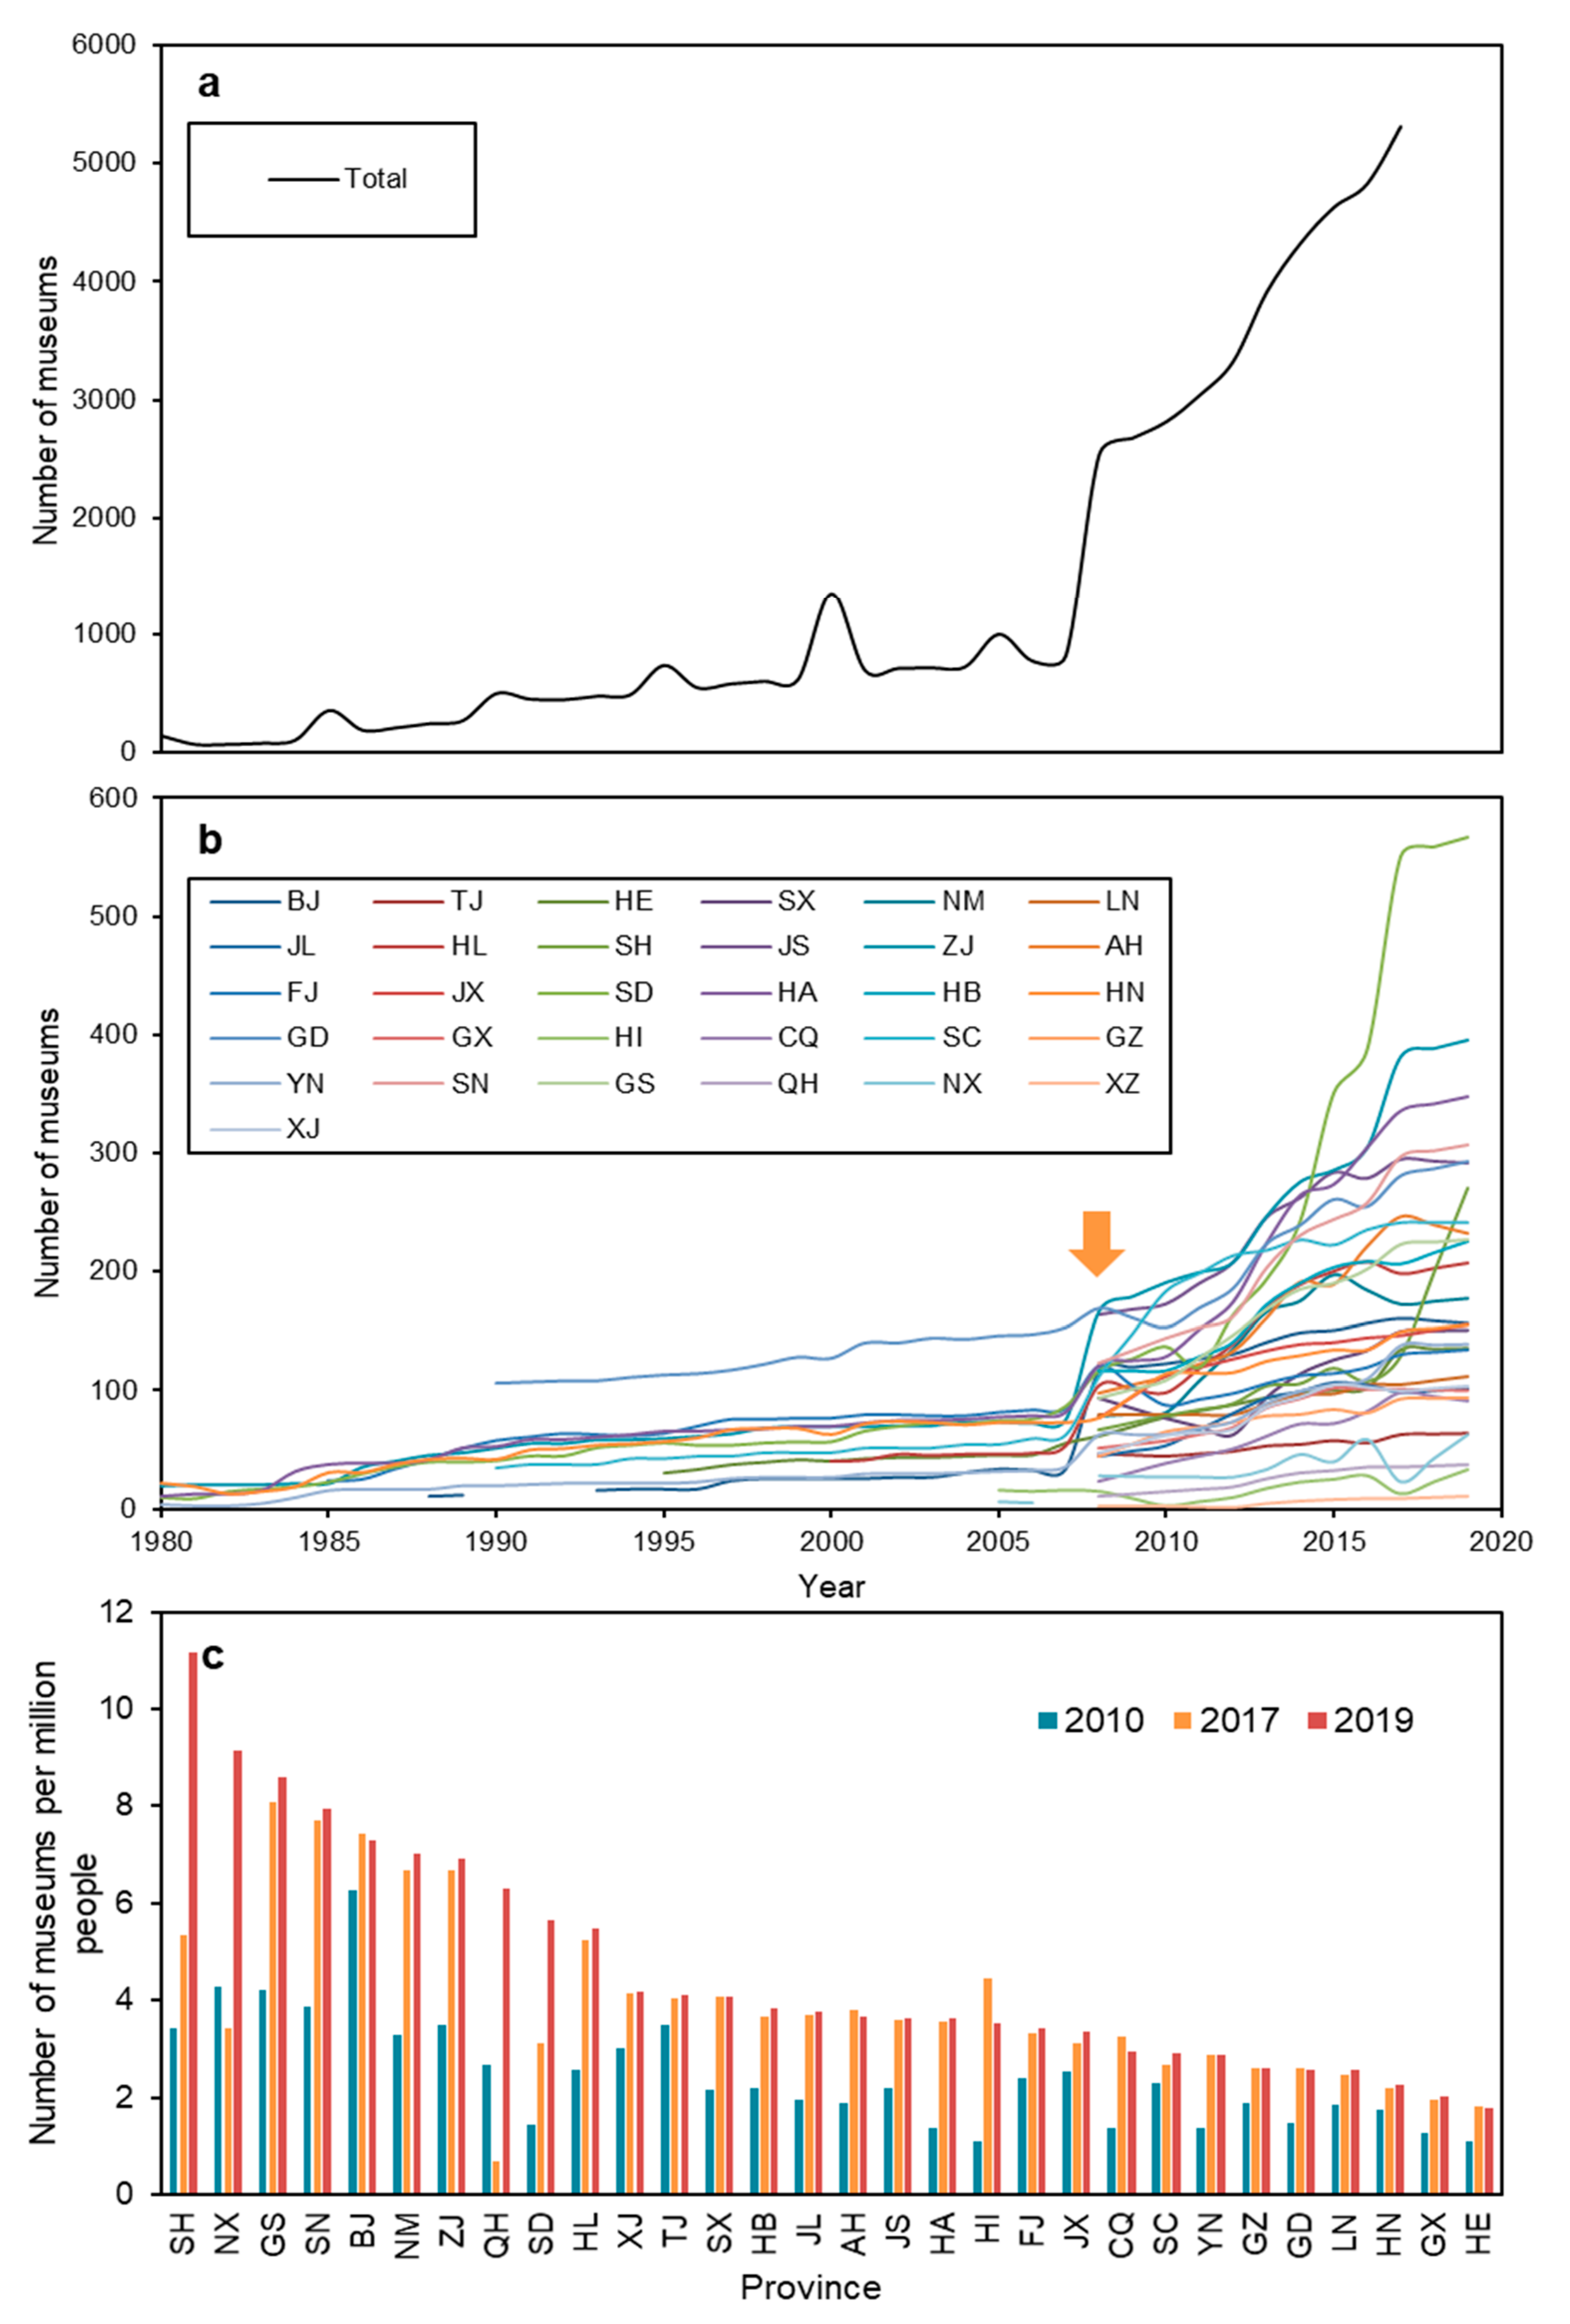
5.1. Historical Trends of the Number of Museums

The number of museums in China used to be very low, and has accelerated since reform and opening-up in the 1980s (Figure 1a; Supplementary Table S1). The rate of growth in the number of museums in most provinces has further accelerated since 2008, although the numbers of different provinces differ greatly (Figure 1b). The total number of museums in China in 1990 was 494, increased to 1351 in 2010, then accelerated to 5616 in 2019.
Among the 31 provinces in China, the top five provinces (Zhejiang, Sichuan, Jiangsu, Guangdong and Shaanxi Provinces) had 191, 184, 173, 153 and 144 museums in 2010, respectively (Figure 1), and the sum of these five provinces accounted for 30% of the total museums in China. In contrast, the bottom three provinces (Hainan, Qinghai, Ningxia) had only 3, 15 and 27 museums, respectively. The fastest growth occurred in Shandong Province, in which the number of museums increased from 137 to 567 museums by 2019. The top five provinces (Shandong, Zhejiang, Henan, Shaanxi, Guangdong) currently have 567, 396, 348, 307 and 283 museums, respectively, and account for 34% of the total in China, while the numbers of museums in the bottom three provinces (Hainan, Qinghai, Ningxia) increased to 33, 38 and 63 museums, respectively. The increment in the number of museums in the provinces at the bottom showed that the number of museums is growing faster in these provinces than in the top provinces.
From 2010 to 2019, the number of museums per million people in China increased from 1.07 to 4.03. At the provincial level, the ranking regarding the per capita number of museums (Figure 1c) does not correspond with the ranking regarding the total number of museums (Figure 1). In 2019, in terms of the number of museums per million people, Shanghai, Ningxia and Gansu ranked in the top three in China; however, they ranked only 7th, 28th and 10th in terms of the total number of museums. Henan Province ranked 3rd according to the total number of museums, but it had only 3.62 museums per million, ranking it in 18th place. The inconsistent ranking of the per capita number of museums and the total number of museums is due to the large population of Henan Province, reaching 96 million people. In contrast to Henan, Ningxia had a small population of only 6.9 million, resulting in a relatively high per capita number of museums.

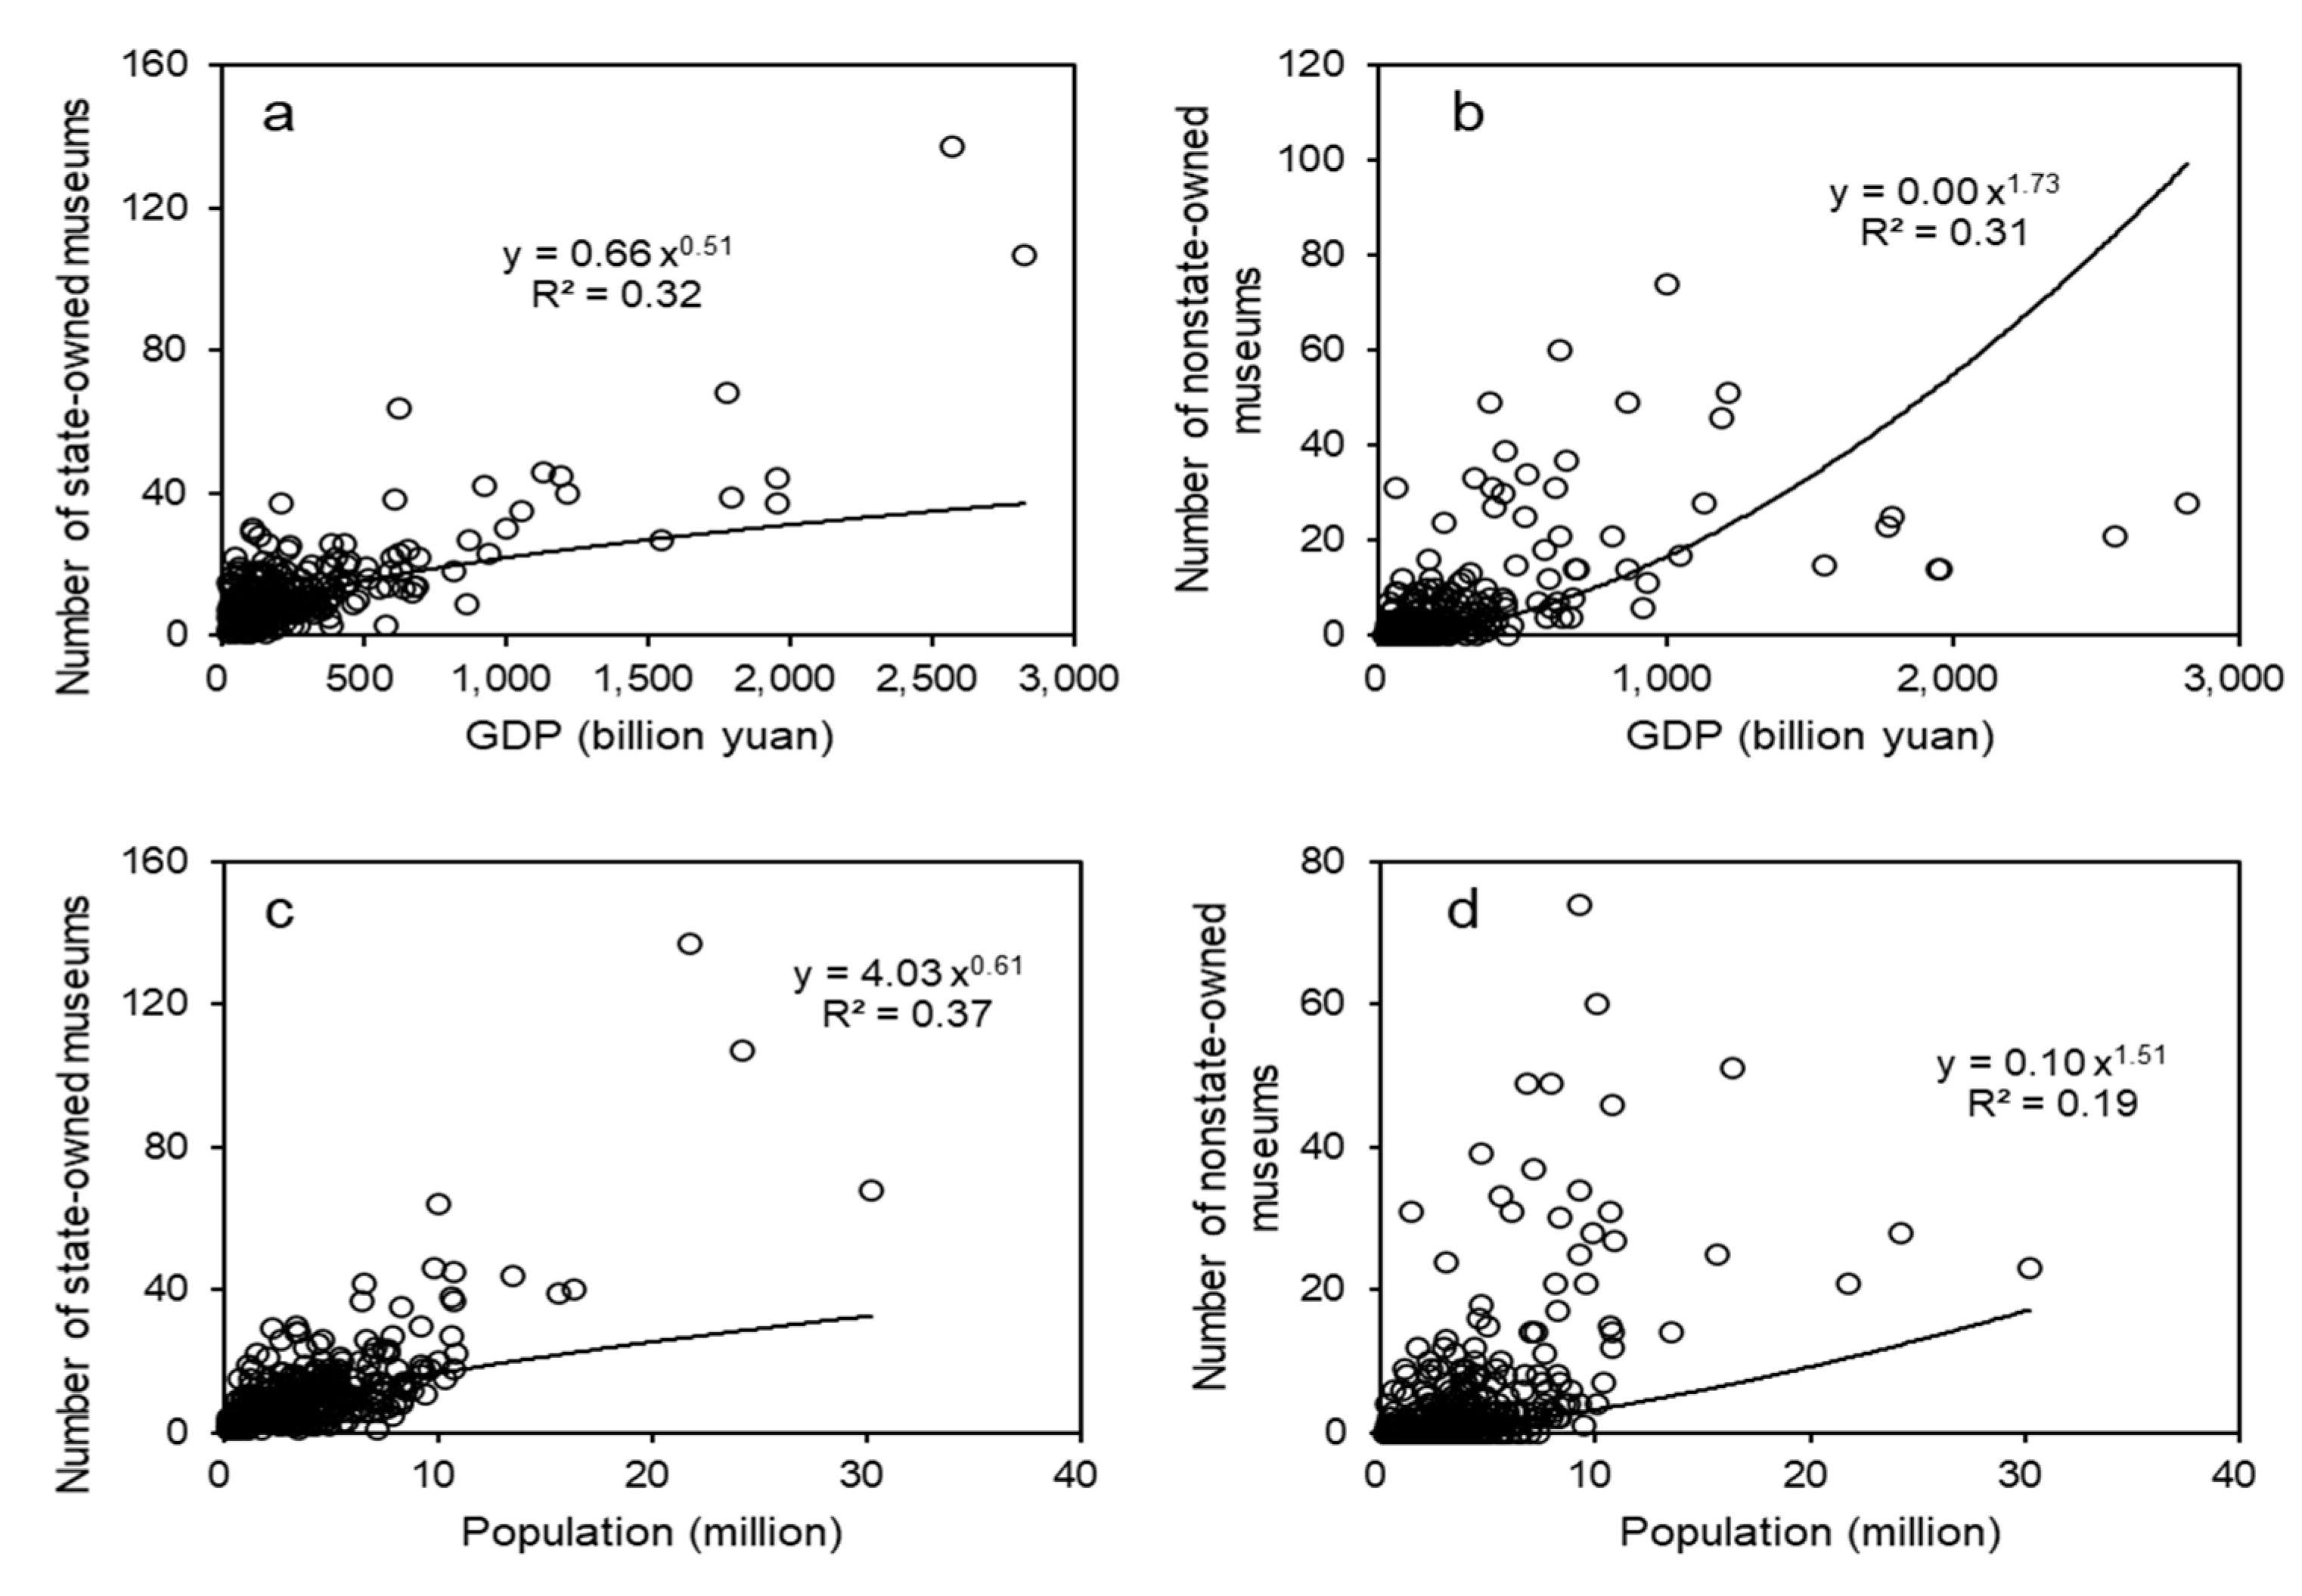
5.2. Scale Law of the Number of Museums and Local Population

The number of museums in the provinces was significantly correlated with the local population and followed the power law (Y = a · Xβ). In 2010, the exponent β was 0.84, which indicates that the number of museums sublinearly responded to local population. It means that when a province had double the population of another province, the number of museums was only 0.84-fold higher. The β rose to 0.90 in 2017, revealing an improvement in the number of museums in larger provinces (Figure 2a). The number of museums in the cities also significantly corresponded to the local population and followed the power law, while the β was low at only 0.64 in 2010 and rose to 0.68 in 2017 (Figure 2b). The absolute vales of β at the provincial level in 2017 were bigger than those at the city level, and the increments of β between 2010 and 2017 at the province level were also larger than those (0.06) at the city level (0.04). Thus, the differences in the per capita number of museums among cities will be enlarged.
The responsiveness of the number of museums in the provinces to GDP was lower than those to population, and the β in 2010 was only 0.55. This suggests that the growth rate of museums was little more than half of the growth rate of GDP. In 2017, the β increased to 0.65, which indicated an improvement in museum growth, though it was still 1/3 lower than the growth rate of GDP (Figure 2c). At the city level, the exponential β of museums in cities responding to the local GDP was only 0.53 in 2010 (Figure 2d), and it rose to 0.66 in 2017. The relationship between the per capita number of museums and the per capita GDP in provinces was not significant (Figure 2e), while it was significant at the city level. In 2010, the β was as low as 0.28, which meant that the per capita number of museums increased by little more than a quarter-fold when the GDP of a city doubled (Figure 2f). Fortunately, until 2017, the β had risen to 0.46, indicating a great improvement at the city level.
In China, nearly all cities have at least one state owned museum. The number of state-owned museums presents a sublinear response to both the GDP (β = 0.51) and population (β = 0.61) at the city level in 2019 (Figure 3a,c). In contrast, only some cities have at least one non-state owned museum. The number of non-state owned museums showed a superlinear response to GDP (β = 1.73) and population (β = 1.51) in cites (Figure 3b,d). This finding suggests that the agglomeration effect occurred in the number of non-state-owned museums.

5.3. Relationships between the Number of Visitors and the Number of Museums

The number of museum visitors presented a superlinear response to the number of museums at both the provincial (β = 1.46) and city (β = 1.16) levels in 2019 (Figure 4a,b). The number of educational activities carried out by museums also showed a superlinear response to the number of museums at both the provincial (β = 1.17) and city (β = 1.17) levels (Figure 4c,d). In contrast, there was a sublinear relationship between the number of visitors and the local GDP at the provincial (β = 0.8) and city (β = 0.92) levels (Figure 4e,f). The number of visitors to museums was linearly correlated with the number of collections in the museums at the provincial level (β = 0.99, Figure 4g). However, this was sublinear at the city level (β = 0.80, Figure 4h).
The economic competitiveness of a city was positively related to the number of museums in the city (Figure 5a). Meanwhile, the number of universities was also positively correlated with the number of museums (Figure 5b). Both the healthy life index and the livable competitiveness were positively related to the number of museums in a city (Figure 5c,d).
When we refined the museums according to their operator, we found that the attractiveness of state owned museums to visitors far exceeded that of non-state owned museums. The number of visitors responded superlinearly to the number of state owned museums (β = 1.25, Figure 5e). However, the number of visitors was sublinearly correlated with the non-state owned museums, and the β was as low as 0.25 (Figure 5f).

5.4. Historical Changes in the Gini Coefficient of the per Capita Number of Museums

In mainland China, the Gini coefficient of museums per capita among the 31 provinces in 2010 was 0.22 (Figure 6a), indicating considerable equality in the spatial distribution of museums. In 2017, the Gini increased to 0.24, and in 2019 it further rose to 0.27, which is still relatively low and indicates relative equality. The historical trend of the Gini coefficient means that the cultural resource allocation in China among the provinces is quite equal.
The Gini coefficient of the per capita number of museums among the cities in Fujian Province was the highest (0.6), while Hainan Province had the lowest Gini coefficient (0.1) in China in 2010 (Figure 6b). In 2017, the cities in Anhui Province had the highest Gini coefficient (0.4), while those in Qinghai Province had the lowest Gini coefficient (0.18) in China (Figure 6c). The range of variation in Gini coefficients between the provinces decreased in the past two decades.
The improvements in the Gini coefficients in each province varied greatly. Half of the provinces had decreased Gini coefficients from 2010 to 2017 (Figure 6d,e), while in the other half of the provinces it decreased. Among the provinces, the Gini coefficient in Hainan was 0.1 in 2010 and increased to 0.4 in 2017. Both the number of museums and the population of Hainan Province are small; therefore, even slight changes in the number of museums can cause great variation in the Gini coefficient. In Hubei Province, the Gini changed from 0.22 to 0.33, as the population growth of the cities in Hubei Province was similar, but the museum growth was not synchronized. For example, from 2010 to 2017, Wuhan City gained 60 museums, while the other cities within the province gained only a few museums, resulting in an increase in spatial inequality.

5.5. Relationship between Inequality and Socioeconomic Development

The spatial inequality of the number of museums remained stable with population and GDP changes in cities in 2010 and 2017 (Figure 7a–c). Similarly, the difference in Gini, ΔGini, did not respond to the increasing GDP per capita in provinces from 2010 to 2017 (Figure 7d). However, the increase in the number of museums from 2010 to 2017 (Δnumber) significantly correlated with the increasing GDP per capita, and peaked at 70–80 thousand yuan (1 USD~6.45 yuan) per year (Figure 7e). The Δnumber of museums was positively correlated with GDP growth at the province level (Figure 7f).

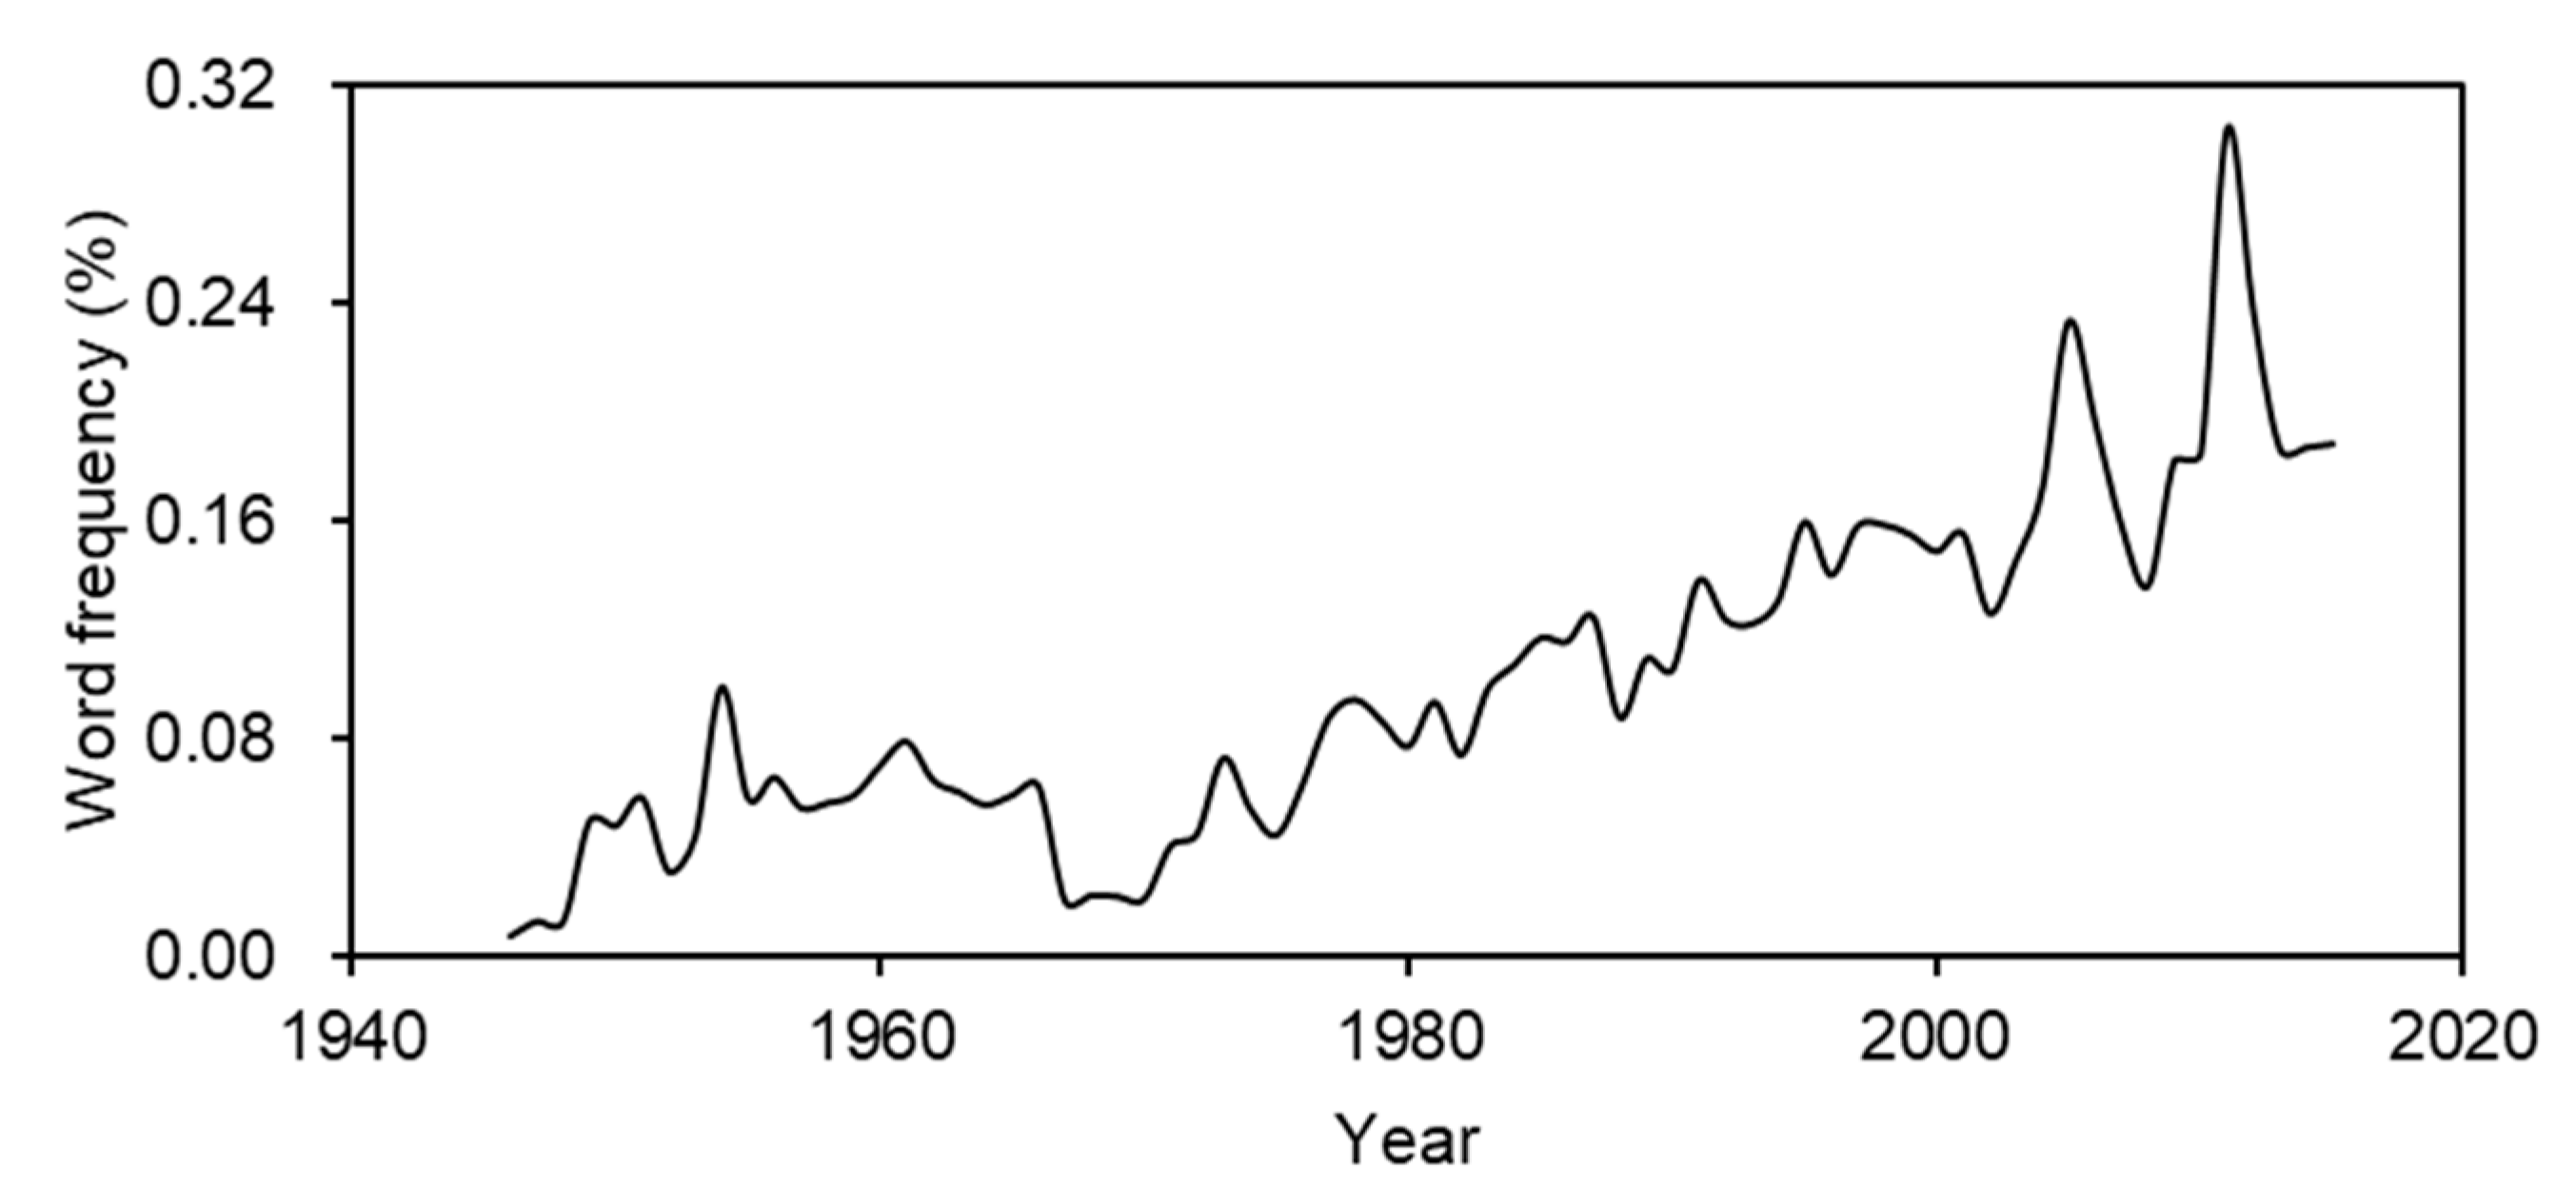
5.6. Public Attention Regarding the Museums

Public attention to museums increased rapidly after the founding of new China in 1949, as reflected by the frequency of the word ‘museum’ in the People’s Daily. However, the frequency declined from the 1960s to the 1970s (Figure 8); in this period, there were frequent political movements, including the ‘Cultural Revolution’. After the reform and opening-up in 1978, the frequency of the word ‘museum’ increased continuously and reached a peak in 2011 (the number of articles containing ‘museum’ accounting for approximately 0.3% of the total number of articles in that year). This means that with the development of the economy, public attention to museums has increased.

6. Discussion

6.1. The Museum Boom Still Lags behind Population and Economic Development

Industrialization needs the support of knowledge and inspiration provided by museums. Consequently, cultural development is promoted by economic development in many regions [18]. China remained an agricultural country for thousands of years and transitioned to an industrial nation at the end of the 19th century. The first museum in China was built in 1902 in Jiangsu Province, a rich region, at the beginning of industrialization in China. However, the progress was very slow, and there were only 137 museums until 1980 in the whole country. Since the 1980s, the reform and opening-up in China have promoted economic development. A dramatic increase occurred in the number of museums, and a boom in the late 1990s (Figure 1). All provinces, except for a few in western China, exhibited a sudden increase in museums in the 1980s, revealing a synergistic effect between the number of museums and economic development (Figure 2). However, although China became the second-largest economy in the world in 2010 [4], the number of museums per million people in China in 2019 was only 4.03 (Figure 1c), while it was 92.29 in the United States in 2018 [7], 37.43 in the United Kingdom in 2020 [6], and 18.18 in France in 2020 [5]. This reveals a time lag in the number of museums between developing and developed countries.
The return on investment provided by cultural facilities takes time to realize [47]. In China, the growth in the number of museums has lagged behind the growth of GDP at both the provincial and city levels (Figure 2c,d), although the situation slightly improved from 2010 to 2017. The lags in some cities, however, are still bad. For example, the per capita GDPs of Ordos City in Inner Mongolia (215,000 yuan per capita) and Karamay City in Xinjiang (138,000 yuan per capita) are much higher than the average level of Chinese cities (55,000 yuan per capita); nevertheless, the numbers of museums per million yuan GDP in Ordos (120 museums) and Karamay (10 museums) are much lower than the average (350 museums) cities of China. The economic development of these cities is driven by coal and oil exploitation, they are remote and sparsely populated, and cultural construction has not kept up with the economic level. The case is similar to a study about museums and libraries in England [48] that showed how the development of cultural facilities is not completely synchronized with economic development. Research on the United States [49] also shows that some tourism sub-industries do not directly respond to economic development, but rather rely on the drive of the accommodation industry. In sum, the influence of economic level on the per capita number of museums is not always direct and immediate.
Many cultural facilities showed near-linear growth in response to population. For example, schools, hospitals, post offices and theatres presented a nearly linear relationship (0.83, 0.77, 0.71 and 0.96, respectively) in response to local population size in China [46]; the β for libraries in the United States was 0.76 [50], and the β of schools in the United States and Brazil was 0.95 and 0.94, respectively [45,51]. However, the scale exponent of museums to population size was sublinear (β = 0.84) at the provincial level in 2010 (Figure 2a), while it was only 0.64 at the city level (Figure 2b). Fortunately, supported by active cultural policy, the β increased to 0.90 in 2017 at the provincial level. This indicates that the growth rate of museums to population follows a common scale law with other culture components in response to population.
Policies also play an important role in promoting an increased number of museums [10]. For example, the number of museums boomed after 2008 in Ya’an City, Sichuan Province, although the per capita GDP of this city was relatively low. This was due to powerful support from the central government and other provinces, and even foreign aid to the region after the Wenchuan Earthquake in 2008 [52,53]. These policies promoted cultural resource allocation and guaranteed the effect of distribution policies. In fact, in 2008, China’s central government issued incentive policies related to the development of museums, and the number of museums in every province and city has increased greatly in subsequent years. Considering that the demand for cultural services is increasing, the Chinese government needs to further boost policies to promote the increase in museums.

6.2. The Museum Agglomeration Effect Promotes Visits to Museums

The increasing rate of visitors was superlinear (β = 1.53) in response to the number of museums at the provincial level (Figure 4a). This clearly reveals the presence of the agglomeration effect, as provinces with more museums attract more visitors than provinces with fewer museums. At the city level, the agglomeration effect also exists, as β = 1.17 (Figure 4b). The agglomeration effect simulates knowledge and labor sharing [32,33] and increased efficiency [29]. For museums, the agglomeration effect of visitors means that the service efficiency of single museum is higher in regions with more museums (Figure 4c,d), although it may cause inequality [43]. Policymakers need to compromise between equality and efficiency. In fact, in China, the crucial challenge at present is the insufficient number of museums.
In contrast to the agglomeration effect of visitors to state owned museums, the non-state owned museums are disadvantaged at attracting visitors (Figure 5e), and the β is only 0.25 (Figure 5f). The state owned museums are more mainstream in China, and their content is comprehensive, while the contents of each non-state owned museum is often focused on a few topics; many are small in size, and therefore lack attractiveness [54]. The museums themselves should more actively participate in social services and give full play to their educational value [55]. Due to the ‘luxury effect’ in non-state- owned museums, more museums are expected to be built along with economic development, and non-state owned museums can supplement the state owned museums and thus promote the spatial equality of museums. In this case, the policy should be adjusted to improve the use efficiency of non-state owned museums in order to serve more people.

6.3. The Number of Museums among Provinces Is Relatively Equal, but Gini among Cities Needs to Be Improved

The Gini coefficient of income in China is 0.53–0.55 [56], while the Gini coefficients of museums in the provinces of China are as low as 0.27 (Figure 6a). This is similar to the Gini coefficients of sports activities (0.22–0.34) in many countries [25], but is lower than many other social dimensions or facilities in cities. For example, the Gini of the distribution of schools in cities is 0.35–0.63, while the Gini of spatial patterns of park visitors and park areas per capita ranges from 0.2 to 0.8 [11]. There are great differences in the socioeconomic conditions among provinces in China, and the relatively equal spatial pattern of the museums means that macro-control policies in China play a crucial role in cultural resource allocation. The equality of museums among provinces is conducive to the nationwide balanced popularization of education.
Inequalities in cultural consumption, such as education, often respond to countries’ economic levels [17]. However, the inequality of museums per capita in different provinces and different cities with high or low economic levels was not significantly different (Figure 7). The relative equality in museums per capita among the provinces of China does not support the conclusion that inequality responds to economic level [16,17]. Furthermore, the changes in Gini along with development are not a response to the economic level, although the GDP increased by 82% from 2010 to 2019, which is similar to findings in Italy [16]. Fortunately, the highest Gini coefficient is decreasing, and the range of Gini coefficients is narrowing (Figure 6d). This indicates that the number of newly built museums is matching the population distribution.
The agglomeration effect of visitors in response to the number of museums (Figure 4a,b) supports the conclusion that rich areas have a higher level of participation in cultural activities [18]. Economic growth promotes the number of museums and educational activities in provinces and cities (Figure 2 and Figure 4), especially the number of non-state owned museums (Figure 3 and Figure 7f). However, economic growth does not necessarily lead to improvements in equity (Figure 7d). As the central government can allocate cultural resources more equally among the provinces, we suggest that provincial governments also optimize their cultural policies to reduce the inequality in per capita museums among their cities.
The accessibility of different types of facility is not equal. For example, parks have higher accessibility than museums because they are public facilities accessed on a day-to-day basis. When museums are open to the public free of charge, the accessibility difference between museums and parks narrows. For example, Zhejiang Provincial Museum is located near the West Lake of Hangzhou, a famous world cultural heritage site, and tourists usually flock to the museum to enjoy the cool in summer, making the museum the 15th largest museum by visitors worldwide in 2018 [57]. Another example is Anyang Museum in Henan Province: the hall is designed as a study room open to the public. In addition, the number of visitors to non-state owned museums in China is increasing, as more and more of them can now be visited free of charge.

6.4. Museum Development Synergizes with Economic Growth and Human Well-Being

Museums are institutions that generally reflect a cultural substrate or instance (tangible or intangible) that pre-exists in a place. The local institution and building of museums follow as a necessity of popular demand. However, our results shows that the number of museums in a province does not match the number of cultural heritage sites. For example, Shanxi Province is one of the regions with the longest history and the largest number of aboveground cultural relics in China; however, there were only 151 museums in 2019 (Figure 1b), ranked 17th in China. Another example, Henan Province, which is the original region of Chinese culture, has only 3.62 museums per million people in 2019, lower than the nation as a whole (Figure 1c). These two provinces are ranked low in GDP. Compared with cultural heritage resources, economy seems to be the key factor in determining the number of museums.
The development of museums is conducive to the vitality and sustainable development of cities [28], as museums promote socioeconomic and ecological reconstruction and the development of the region [27]. The number of museums in a city coincides with the city’s economic competitiveness (Figure 5a). This may be due to the agglomeration effect of economic activities in response to museum numbers [30]. Furthermore, the number of universities is consistent with the number of museums in a region, indicating a synergistic agglomeration effect of cultural services (Figure 5b). For the residents, the healthy life index and the livable competitiveness that directly relate to human well-being also positively relate to the number of museums (Figure 5c,d). The two indices integrate the income, public services, education, medical conditions, life expectancy, crime rate and living environment. This suggests that the cultural services of museums in a city are conducive to attracting talent and promoting city development. This win-win effect can be achieved more easily in large cities than in small cities for improvement of both the economy and cultural services to enhance social sustainability.
With socioeconomic development, public attention to museums is increasing. The definition of a museum by the ICOM has been updated eight times within half a century, in 1946, 1951, 1962, 1971, 1974, 2001, 2004, and 2007. Since the 2019 ICOM General Conference in Kyoto, a new definition has been discussed reflecting equality, human well-being and sustainability as carried out by museums [1]. This shows that the evolution of people’s understanding and demand for the services of museums frequently change with the rapid development of society. Meanwhile, public attention to a thing also varies along with social development [39]. In China, the first peak in the frequency of the word ‘museum’ occurred around 1949, when the People’s Republic of China was founded amid economic and cultural restoration, and the second peak occurred around 2011, when economic development began to accelerate (Figure 8). A valley in the word’s frequency was observed during a period with many political movements, when economic depressions and wars caused it to drop rapidly. This supports the existence of synergy between cultural development and economic and social development. The economy is the foundation of cultural development, while cultural development also promotes economic, social and ecological development [58]. Based on the frequency of the word in the newspaper, we can predict that Chinese people’s awareness of museums will increase greatly in the near future; thus, more museums need to be developed in provinces and cities to meet the demands of the people.

6.5. Limitations and Uncertainties

First, due to data availability, whether visitors to museums are locals or tourists from other cities is not distinguished in this study. There is no doubt that cities with more museums attract more tourists, who are assumed to have equal opportunities to visit the museums in different provinces or cities. In addition, the aim of this pioneer study is to explore the degree of inequality in the per capita number of museums across the whole country; thus, the results cannot reflect the unique cultural, economic and social impact of each city. Future studies should consider the specific characteristics of each museum and city in order to refine the study.
Second, the museums are not classified by the number of collections, floor area or type of exhibits. Nevertheless, to our knowledge, this paper is the first to explore the number and equality of museums at the national and regional scale from a macro perspective, and it has great significance to this research field.
Third, the word frequency analysis can only reflect the changes in ‘hot spots’ of public attention, and does not directly reflect the real world.

7. Conclusions

This study fills a gap in the field concerning inequality in the spatial distribution of museums. The spatial inequality in the number of museums among provinces was much lower than that among the cities within a province. In addition, the Gini coefficients for museums in China were close to those for physical activity, and lower than those for schools, parks, and income inequality. This study enriches research objects having to do with spatial inequality, and is helpful in promoting the understanding of multi-scale and multi-dimensional inequality in society.
Although the number of museums has increased quickly in the past two decades, the per capita number of museums remains very low in China compared with developed countries. In addition, the scale law shows that the exponent β (the response of the museum number to population in provinces) has increased from 0.84 to 0.90 from 2010 to 2017. The scale law is heading toward a near linear response to population, which means that the growth rate of museums is catching up with the growth rate of population in the provinces. This is a general development trend of cultural facilities with population increasing. However, the scale law of museums to population in cities remains very low, at only 0.68 in 2017. The increased rate of the number of museums is less than two-thirds (β~0.66) that of the increasing rate of GDP in cities. Thus, cultural policy improvements are a crucial element of the boom in museums in China.
Fortunately, the distribution of museums matching the population is relatively equal at the provincial level in China. The Gini coefficient of the number of museums per capita among the provinces was only 0.27 in 2019, and it was determined by cultural policy, not economic level. The cultural policy of the national government plays an important role in balancing resource allocation among the provinces. In contrast, some provinces in China showed high inequality in their per capita number of museums among cities, with the highest Gini coefficient being 0.4 in 2017. Thus, these provincial governments should optimize their resource distribution for museums among the cities more equally.
Museum visiting involves activities across cities and provinces. The number of visitors was superlinear in response to the number of museums, revealing an agglomeration effect which the number of visitors per museum increases. Provinces or cities with more museums attract more visitors through increased efficiency per museum, thus further promoting local economic competition. However, this may cause inequality, and a tradeoff between inequality and economy is therefore needed. To service more people, online museum exhibits have become a new exhibition mode. For example, the National Cultural Heritage Administration of China recommended 300 online exhibitions to public in six batches in 2020. Among them, the Palace Museum adopts a variety of online visit modes such as “Panoramic Palace Museum” and “Palace Virtuality”. Other famous museums, such as the Louvre in Paris, the Metropolitan Museum of Art in New York and the British Museum in London, also showed some their works to public through high-resolution images, videos, three dimensional (3D) models, panoramic introductions, and other approaches. Combined with Virtual Reality (VR) technology, online museum exhibitions will become popular in the future. Online museum visits can partially replace visits to physical museums, and alleviate the insufficient number and unequal spatial distribution of museums. The aspects considered in this study can provide experience for the development of similar cultural facilities around the world.
In the future, China should promote the diversified development of museums, especially non-state owned museums. Although most of China’s non-state owned museums are sponsored by companies or powerful individuals, more and more non-state owned museums are open to the public free of charge. This transition means that the non-state owned museums supplement the insufficient number of state owned ones. Further, the government can give appropriate financial subsidies to the development of non-state owned museums. Fortunately, China has begun to take action in Guangdong, Henan, and Zhejiang provinces. For example, in Shenzhen City, the operation subsidy ceiling of non-state owned museums has increased from 0.5 million to 1 million yuan per year, and can even reach as high as 10 million yuan for non-state owned national first-class museums. These pioneering policies will promote investment in the cultural industry. Hence, it is feasible to supplement the total number of museums through funding that supports the construction of non-state owned museums, combined with online and virtual visitation technologies, to improve equality of access to museums both in China and around the world.

Supplementary Materials

The following are available online at https://www.mdpi.com/article/10.3390/su132413860/s1, Table S1: Policy or law about museum by the central government of China.

Author Contributions

Conception and Design: X.C., J.C. and G.Y. Data Acquisition: X.C., Z.W. and L.S. Data Analysis and Interpretation: X.C., Y.C. and Y.D. Drafting the Manuscript: X.C., J.C. and Y.G. Critical Revision: All Authors. Final Approval: All Authors. All authors have read and agreed to the published version of the manuscript.

Funding

This research was funded by National Natural Science Foundation of China: 31870307; 31770434.

Institutional Review Board Statement

Not applicable.

Informed Consent Statement

Not applicable.

Data Availability Statement

The data presented in this study are available on request from the corresponding author.

Conflicts of Interest

The authors declare no conflict of interest.

References

  1. International Council of Museums. History of ICOM. 2021. Available online: https://icom.museum/en/ (accessed on 24 September 2021).
  2. Pietro, L.D.; Mugion, R.G.; Renzi, M.F.; Toni, M. An Audience-Centric Approach for Museums Sustainability. Sustainability 2014, 6, 5745–5762. [Google Scholar] [CrossRef] [Green Version]
  3. Denton, K.A. Museums, Memorial Sites and Exhibitionary Culture in the People’s Republic of China. China Q. 2005, 183, 565–586. [Google Scholar] [CrossRef]
  4. Chen, J.; Li, Y.; Liu, S.; Wang, T. Blue Book of China’s Economy; Social Sciences Academic Press: Beijing, China, 2011. [Google Scholar]
  5. Ministère de la Culture. Museéofile, Directory of Museums in France. 2021. Available online: http://traduction.culture.gouv.fr/url/Result.aspx?to=en&url=https://www.culture.gouv.fr/Espace-documentation/Bases-de-donnees (accessed on 24 September 2021).
  6. Museums Association. How Many Museums Are There in the UK? 2021. Available online: https://www.museumsassociation.org/about/faqs/ (accessed on 24 September 2021).
  7. Institute of Museum and Library Services. The Museum Data Files. 2018. Available online: https://www.imls.gov/research-evaluation/data-collection/museum-data-files (accessed on 1 October 2019).
  8. Tahmasbi, B.; Mansourianfar, M.H.; Haghshenas, H.; Kim, I. Multimodal accessibility-based equity assessment of urban public facilities distribution. Sustain. Cities Soc. 2019, 49, 101633. [Google Scholar] [CrossRef]
  9. Kinsley, R.P. Inclusion in museums: A matter of social justice. Mus. Manag. Curatorship 2016, 31, 474–490. [Google Scholar] [CrossRef]
  10. Zhang, H.; Xu, F.; Lu, L.; Yu, P. The spatial agglomeration of museums, a case study in London. J. Herit. Tour. 2017, 12, 172–190. [Google Scholar] [CrossRef]
  11. Dadashpoor, H.; Rostami, F.; Alizadeh, B. Is inequality in the distribution of urban facilities inequitable? Exploring a method for identifying spatial inequality in an Iranian city. Cities 2016, 52, 159–172. [Google Scholar] [CrossRef]
  12. Wang, S.; Zhang, Y.; Xu, Y.; Yan, S. A quantitative analysis of inequality of urban cultural space distribution in Xi’an. Sci. China Technol. Sci. 2019, 62, 502–510. [Google Scholar] [CrossRef]
  13. Pun-Cheng, L.S.C. Distance Decay. In International Encyclopedia of Geography; John Wiley & Sons, Ltd.: New York, NY, USA, 2016; pp. 1–5. [Google Scholar] [CrossRef]
  14. Drezner, T.; Drezner, Z.; Zerom, D. Facility Dependent Distance Decay in Competitive Location. Netw. Spat. Econ. 2020, 20, 915–934. [Google Scholar] [CrossRef]
  15. Kabisch, N.; Haase, D. Green justice or just green? Provision of urban green spaces in Berlin, Germany. Landsc. Urban Plan. 2014, 122, 129–139. [Google Scholar] [CrossRef]
  16. Raspadori, P. Inequality and culture: Geographical differences in the access to cultural enrichment in Italy (1863–1992). Contin. Chang. 2011, 26, 219. [Google Scholar] [CrossRef]
  17. Hek, M.A.; Kraaykamp, G. Cultural consumption across countries: A multi-level analysis of social inequality in highbrow culture in Europe. Poetics 2013, 41, 323–341. [Google Scholar] [CrossRef]
  18. Veal, A.J. Leisure, income inequality and the Veblen effect: Cross-national analysis of leisure time and sport and cultural activity. Leis. Stud. 2016, 35, 215–240. [Google Scholar] [CrossRef] [Green Version]
  19. Lusseau, D.; Mancini, F. Income-based variation in Sustainable Development Goal interaction networks. Nat. Sustain. 2019, 2, 242–247. [Google Scholar] [CrossRef] [Green Version]
  20. Olaiya, H.B.A. Transforming Our World: The 2030 Agenda for Sustainable Development & International Decade for People of African Descent. 2015. Available online: https://uwe-repository.worktribe.com/output/801754 (accessed on 24 September 2021).
  21. Moll, B.; Townsend, R.M.; Zhorin, V. Economic Development, Flow of Funds and the Equilibrium Interaction of Financial Frictions. Natl. Bur. Econ. Res. 2013, 114, 6176–6184. [Google Scholar]
  22. Brelsford, C.; Lobo, J.; Hand, J.; Bettencourt, L.M.A. Heterogeneity and scale of sustainable development in cities. Proc. Natl. Acad. Sci. USA 2017, 114, 8963–8968. [Google Scholar] [CrossRef] [PubMed] [Green Version]
  23. Eliazar, I. Harnessing inequality. Phys. Rep. 2016, 649, 1–29. [Google Scholar] [CrossRef]
  24. Wu, S.; Zheng, X.; Wei, C. Measurement of inequality using household energy consumption data in rural China. Nat. Energy 2017, 2, 795–803. [Google Scholar] [CrossRef]
  25. Althoff, T.; Sosič, R.; Hicks, J.L.; King, A.C.; Delp, S.L.; Leskovec, J. Large-scale physical activity data reveal worldwide activity inequality. Nature 2017, 547, 336–339. [Google Scholar] [CrossRef]
  26. Zhang, T.; Xu, Y.; Ren, J.; Sun, L.; Liu, C. Inequality in the distribution of health resources and health services in China: Hospitals versus primary care institutions. Int. J. Equity Health 2017, 16, 42. [Google Scholar] [CrossRef] [PubMed] [Green Version]
  27. Lazzeretti, L. The resurge of the “societal function of cultural heritage”. An introduction. City Cult. Soc. 2012, 3, 229–233. [Google Scholar] [CrossRef]
  28. Lazzeretti, L.; Capone, F. Museums as Societal Engines for Urban Renewal. The Event Strategy of the Museum of Natural History in Florence. Eur. Plan. Stud. 2015, 23, 1548–1567. [Google Scholar] [CrossRef]
  29. Jung, S.; Jang, S. To cluster or not to cluster? Understanding geographic clustering by restaurant segment. Int. J. Hosp. Manag. 2019, 77, 448–457. [Google Scholar] [CrossRef]
  30. Keuschnigg, M. Scaling trajectories of cities. Proc. Natl. Acad. Sci. USA 2019, 116, 13759–13761. [Google Scholar] [CrossRef] [Green Version]
  31. Choi, A.; Berridge, G.; Kim, C. The Urban Museum as a Creative Tourism Attraction: London Museum Lates Visitor Motivation. Sustainability 2020, 12, 9382. [Google Scholar] [CrossRef]
  32. Claudio-Pachecano, L.; Larralde, H. Agglomeration or separation: Store patterns through an optimal location model. Phys. A Stat. Mech. Its Appl. 2020, 542, 123366. [Google Scholar] [CrossRef]
  33. Kim, Y.R.; Williams, A.M.; Park, S.; Chen, J.L. Spatial spillovers of agglomeration economies and productivity in the tourism industry: The case of the UK. Tour. Manag. 2021, 82, 104201. [Google Scholar] [CrossRef]
  34. National Cultural Heritage Administration of China. National Museum Directory. 2021. Available online: http://www.ncha.gov.cn/index.html (accessed on 24 September 2021).
  35. The Statistical Yearbook for Provinces. China National Knowledge Infrastructure. 2021. Available online: Data.cnki.net/ (accessed on 24 September 2021).
  36. China Bureau of Statistics. China Statistical Yearbook; China Statistic Press: Beijing, China, 2019.
  37. Ni, P.F. (Ed.) Annual Report on China’s Urban Competitiveness (No.14); Beijing-Social Sciences Academic Press: Beijing, China, 2016. [Google Scholar]
  38. Huang, G.; Jin, C. Report of China’s Urban Health Life; Science Press: Beijing, China, 2016. [Google Scholar]
  39. Lansdall-Welfare, T.; Sudhahar, S.; Thompson, J.; Lewis, J.; FindMyPast Newspaper Team; Cristianini, N. Content analysis of 150 years of British periodicals. Proc. Natl. Acad. Sci. USA 2017, 114, E457–E465. [Google Scholar] [CrossRef] [Green Version]
  40. Xun, E.; Rao, G.; Xiao, X.; Zang, J. The construction of the BCC Corpus in the age of Big Data. Corpus Linguist. 2016, 3, 93–109. [Google Scholar]
  41. Bettencourt, L.M.A.; Lobo, J.; Helbing, D.; Kühnert, C.; West, G.B. Growth, innovation, scaling, and the pace of life in cities. Proc. Natl. Acad. Sci. USA 2007, 104, 7301–7306. [Google Scholar] [CrossRef] [PubMed] [Green Version]
  42. Bettencourt, L.M.A. The Origins of Scaling in Cities. Science 2013, 340, 1438–1441. [Google Scholar] [CrossRef] [Green Version]
  43. Huang, H.; Wei, Y.D. Spatial inequality of foreign direct investment in China: Institutional change, agglomeration economies, and market access. Appl. Geogr. 2016, 69, 99–111. [Google Scholar] [CrossRef]
  44. Kühnert, C.; Helbing, D.; West, G.B. Scaling laws in urban supply networks. Phys. A Stat. Mech. Its Appl. 2006, 363, 96–103. [Google Scholar] [CrossRef]
  45. Meirelles, J.; Neto, C.R.; Ferreira, F.F.; Ribeiro, F.L.; Binder, C.R. Evolution of urban scaling: Evidence from Brazil. PLoS ONE 2018, 13, e0204574. [Google Scholar] [CrossRef] [PubMed] [Green Version]
  46. Qian, J.-H.; Yang, C.-H.; Han, D.-D.; Ma, Y.-G. Multi-scaling mix and non-universality between population and facility density. Phys. A Stat. Mech. Its Appl. 2012, 391, 5146–5152. [Google Scholar] [CrossRef] [Green Version]
  47. Bowitz, E.; Ibenholt, K. Economic impacts of cultural heritage—Research and perspectives. J. Cult. Herit. 2009, 10, 1–8. [Google Scholar] [CrossRef]
  48. Stanziola, J.; Méndez-Carbajo, D. Economic growth, government expenditure and income: The case of museums and libraries in England. Cult. Trends 2011, 20, 243–256. [Google Scholar] [CrossRef]
  49. Aratuo, D.N.; Etienne, X.L. Industry level analysis of tourism-economic growth in the United States. Tour. Manag. 2019, 70, 333–340. [Google Scholar] [CrossRef]
  50. Ensenat, E.C. Beyond City Size: Characterizing and Predicting the Location of Urban Amenities. Ph.D. Thesis, Massachusetts Institute of Technology, Cambridge, MA, USA, 2015. [Google Scholar]
  51. Um, J.; Son, S.; Lee, S.; Jeong, H.; Kim, B.J. Scaling laws between population and facility densities. Proc. Natl. Acad. Sci. USA 2009, 106, 14236–14240. [Google Scholar] [CrossRef] [PubMed] [Green Version]
  52. Zhao, R.; Zhong, S.; He, A. Disaster Impact, National Aid, and Economic Growth: Evidence from the 2008 Wenchuan Earthquake. Sustainability 2018, 10, 4409. [Google Scholar] [CrossRef] [Green Version]
  53. Zhang, H.; Tao, Z. Evaluating China’s Paired-Assistance Policy (PAP) in Response to the Wenchuan Earthquake: A Sustainability Perspective. Sustainability 2018, 10, 3732. [Google Scholar] [CrossRef] [Green Version]
  54. Pop, I.L.; Borza, A. Factors Influencing Museum Sustainability and Indicators for Museum Sustainability Measurement. Sustainability 2016, 8, 101. [Google Scholar] [CrossRef] [Green Version]
  55. Monteagudo-Fernández, J.; Gómez-Carrasco, C.J.; Chaparro-Sainz, Á. Heritage Education and Research in Museums. Conceptual, Intellectual and Social Structure within a Knowledge Domain (2000–2019). Sustainability 2021, 13, 6667. [Google Scholar] [CrossRef]
  56. Xie, Y.; Zhou, X. Income inequality in today’s China. Proc. Natl. Acad. Sci. USA 2014, 111, 6928–6933. [Google Scholar] [CrossRef] [PubMed] [Green Version]
  57. Rubin, J. (Ed.) TEA/AECOM 2018 Theme Index and Museum Index: The Global Attractions Attendance Report; Themed Entertainment Association (TEA): Burbank, CA, USA, 2019. [Google Scholar]
  58. Pumain, D.; Rozenblat, C. Two metropolisation gradients in the European system of cities revealed by scaling laws. Environ. Plan. B Urban Anal. City Sci. 2019, 46, 1645–1662. [Google Scholar] [CrossRef]
Figure 1. Historical trend of the number of museums in 31 provinces of China mainland from 1980 to 2019. (a) Total number of museums in mainland China; (b) the number of museums in 31 provinces; (c) changes in the number of museums in provinces of China in 2010, 2017 and 2019. Blue—2010, orange—2017, red—2019. The provinces on the horizontal axis are ranked according to the number of museums per million people in 2019 from high to low. BJ—Beijing City, TJ—Tianjin City, HE—Hebei Province, SX—Shanxi Province, NM—Inner Mongolia Autonomous Region, LN—Liaoning Province, JL—Jilin Province, HL—Heilongjiang Province, SH—Shanghai City, JS—Jiangsu Province, ZJ—Zhejiang Province, AH—Anhui Province, FJ—Fujian Province, JX—Jiangxi Province, SD—Shandong Province, HA—Henan Province, HB—Hubei Province, HN—Hunan Province, GD—Guangdong Province, GX—Guangxi Province, HI—Hainan Province, CQ—Chongqing City, SC—Sichuan Province, GZ—Guangzhou Province, YN—Yunnan Province, SN—Shaanxi Province, GS—Gansu Province, QH—Qinghai Province, NX-—Ningxia Autonomous Region, XZ—Tibet Autonomous Region, and XJ—Xinjiang Province. The orange arrow denotes a national policy (Notice on the free opening of national museums and memorials) boost in 2008.
Sustainability 13 13860 g001
Figure 2. Relationships between the number of museums and population and economic level. (a,c,e) at the provincial level: (a) population, (c) total GDP, and (e) per capita GDP; (b,d,f) at the city level: (b) population, (d) total GDP, and (f) per capita GDP. Blue—2010, orange—2017.
Sustainability 13 13860 g002
Figure 3. Relationships between the number of state and non-state owned museums in the cities and GDP, population, and visitors in 2019. (a) The number of state owned museums and GDP; (b) the number of non-state owned museums and GDP; (c) the number of state owned museums and population; (d) the number of visitors and non-state owned museums and population.
Sustainability 13 13860 g003
Figure 4. Relationships between the number of visitors and the number of museums, GDP and the number of collections of museums. (a,c,e,g) at the provincial level: (a) the number of visitors and the number of museums, (c) the number of educational activities promoted by museums and the number of museums, (e) the number of visitors and GDP, (g) the number of visitors and the number of collections. (b,d,f,h) at the city level: (b) the number of visitors and the number of museums, (d) the number of educational activities promoted by museums and the number of museums, (f) the number of visitors and the number of collections, and (h) the number of visitors and the number of collections. The data are for 2019.
Sustainability 13 13860 g004
Figure 5. The relationships between city characteristics and museum numbers in cities of China. (a) Urban comprehensive economic competitiveness and number of museums, (b) university number and number of museums, (c) healthy life index and number of museums, (d) livable competitiveness and number of museums, (e) number of visitors and number of state owned museums, (f) number of visitors and number of non-state owned museums.
Sustainability 13 13860 g005
Figure 6. Changes in the inequalities in the number of museums. (a) Lorenz curves of per capita museums and comparison of Gini coefficients among the provinces of China from 2010 to 2019, (b) among the cities of Fujian Province (FJ) with the highest Gini and Hainan Province (HN) with the lowest Gini in 2010, (c) among cites of Anhui Province (AH) with the highest Gini and Qinghai Province (QH) with the lowest Gini in 2017. The Gini coefficient is in parentheses in the top left. (d) The inequalities in the number of museums of each province from 2010 to 2017; blue bar−2010, orange bar−2017, red line-the average Gini coefficient for 2017 (0.28); (e) changes in Gini coefficients between 2010 and 2017. The municipalities (BJ, TJ, SH, CQ) directly under the central government had not no data for the subregions. The provinces are ranked by the difference in Gini coefficients (ΔGini) between the two years. Negative values mean that inequality has been reduced, while positive values mean that it has increased.
Sustainability 13 13860 g006
Figure 7. The Gini coefficient of museums and its interannual changes related to the economic level and population at the provincial level between 2010 and 2017. (a) Two-year Gini coefficient and GDP, (b) two-year Gini coefficient and per capita GDP, (c) two-year Gini coefficient and population, (d) ΔGini and two-year per capita GDP, (e) difference in the number of museums and per capita GDP of 2010, (f) difference in the number of museums and GDP between the two years. Blue dot- 2010, orange dot−2017; solid line means p < 0.05, dashed line means p < 0.1.
Sustainability 13 13860 g007
Figure 8. The frequency of the word ‘museum’ in the newspaper People’s Daily from 1946 to 2015.
Sustainability 13 13860 g008
Publisher’s Note: MDPI stays neutral with regard to jurisdictional claims in published maps and institutional affiliations.

