Article

U-Net-Based Foreign Object Detection Method Using Effective Image Acquisition System: A Case of Almond and Green Onion Flake Food Process

1
ICT Research Institute, DGIST, Daegu 42988, Korea
2
Department of Artificial Intelligence, Kyungpook National University, Daegu 41566, Korea
3
School of Food Science and Biotechnology, Kyungpook National University, Daegu 41566, Korea
*
Authors to whom correspondence should be addressed.
Sustainability 2021, 13(24), 13834; https://doi.org/10.3390/su132413834
Submission received: 2 November 2021 / Revised: 6 December 2021 / Accepted: 10 December 2021 / Published: 14 December 2021
(This article belongs to the Special Issue Non-destructive Techniques for Sustainable Food Quality Evaluation)

Abstract

:
Supervised deep learning-based foreign object detection algorithms are tedious, costly, and time-consuming because they usually require a large number of training datasets and annotations. These disadvantages make them frequently unsuitable for food quality evaluation and food manufacturing processes. However, the deep learning-based foreign object detection algorithm is an effective method to overcome the disadvantages of conventional foreign object detection methods mainly used in food inspection. For example, color sorter machines cannot detect foreign objects with a color similar to food, and the performance is easily degraded by changes in illuminance. Therefore, to detect foreign objects, we use a deep learning-based foreign object detection algorithm (model). In this paper, we present a synthetic method to efficiently acquire a training dataset of deep learning that can be used for food quality evaluation and food manufacturing processes. Moreover, we perform data augmentation using color jitter on a synthetic dataset and show that this approach significantly improves the illumination invariance features of the model trained on synthetic datasets. The F1-score of the model that trained the synthetic dataset of almonds at 360 lux illumination intensity achieved a performance of 0.82, similar to the F1-score of the model that trained the real dataset. Moreover, the F1-score of the model trained with the real dataset combined with the synthetic dataset achieved better performance than the model trained with the real dataset in the change of illumination. In addition, compared with the traditional method of using color sorter machines to detect foreign objects, the model trained on the synthetic dataset has obvious advantages in accuracy and efficiency. These results indicate that the synthetic dataset not only competes with the real dataset, but they also complement each other.

1. Introduction

Foreign objects contained in raw materials of food (RMF) not only can be disgusting to consumers but also can have a negative effect on health. With the increase in the consumption of processed food, consumer complaints about foreign objects mixed with food are also increasing. This reduces weakened consumer satisfaction and causes various types of boycotts [1,2,3]. To tackle this problem, a large number of screening personnel are employed to ensure quality production manually. However, most of these manual inspections are slow and inefficient and have a low rate of foreign object detection [4]. To replace manual inspection, many food companies and laboratories in different countries have conducted various studies on foreign object detection using computer vision [5,6,7]. Figure 1 shows various methods for foreign object detection. The conventional foreign object detection method (FODM) is manual detection by humans during food inspection of green onion flakes (GOF), as shown in Figure 1a. Computer vision technology is used to assist humans in detecting foreign objects in the food inspection of GOF, as shown in Figure 1b. Computer vision technology detects foreign objects in moving almonds, as shown in Figure 1c. Both Figure 1b,c are inference stages, not training stages. Foreign objects consist of various types such as insects, wood debris, plants, paper scraps, metal parts, and plastic scraps, as shown in Figure 1d.
Computer vision technology is one of the best alternatives to replace the human eye [8,9,10]. Many researchers have proposed various image processing methods to detect foreign objects. However, they have mainly used methods to learn the features of objects manually (handcrafted features). Handcrafted features are obtained from classifying each object in an image belonging to a certain class to extract features of each object directly [11]. Feature extraction is defined as a set of features (e.g., color features, shape features, texture features), and classification is ordering objects into groups based on similarities and differences [12]. Most detection of foreign objects adopts color sorting machines based on computer vision [13]. The color sorter machines mainly use the principle of the color difference between RMF and foreign objects. In addition, these machines focus on detecting the color of an object while ignoring its shape or texture. Therefore, the color sorting machines significantly suffer from detection failures for foreign objects with a similar color [14]. Moreover, they have a disadvantage in that the performance of FODM drops sharply due to changes in illuminance [15] and have another disadvantage in that it is necessary to select the optimal parameters manually.
Recently, deep convolutional neural networks (DNN) have been in the spotlight, replacing handcrafted features. DNN [16] were first used in the 2012 ImageNet Massive Visual Recognition Challenge and became famous for their success in classifying a huge dataset with superior performance. Unlike handcrafted features that manually select the optimal parameters, DNN can automatically optimize parameters based on a training dataset. In previous food safety research, D.Rong [17] proposed a method to detect foreign objects in walnuts by combining two different convolutional neural networks. The study achieved a 95% foreign object detection rate based on a self-collected dataset. Y. Shen [18] proposed a method to detect worms in stored grains. The study results achieved 88mAP detection rates based on a self-collected dataset.
DNN with annotated training datasets shows improvement on various image recognition tasks including image classification [19,20], object detection [21,22], and semantic segmentation [23,24]. However, the performance of DNN greatly depends on the quality and number of training datasets [25]. In food safety research, there are not enough datasets required for training DNN, and many researchers are using datasets collected by themselves. However, when a DNN-based algorithm is applied to the detection of foreign objects, it requires thousands of different images and annotations for training. Manual annotation is a cumbersome task that requires a lot of time and effort. Figure 2 shows how to manually annotate the training data required for DNN-based algorithm training. A manual method to collect annotations is to use annotation tools. Figure 2a shows manually collecting annotations on GOF using Labelme [26]. Labelme is a method of drawing the outline of objects in a polygonal method. Manual annotation of GOF in Figure 2a requires at least 5 minutes of time and effort. Annotation collected using annotation tools is shown in Figure 2b.
Our proposed method, similar to the color sorting machines, focuses on the RMF and background of the work bench that can be easily obtained in food inspection. However, it uses DNN to consider not only color but also various features such as shape, texture, and size. To train the features of RMF, several images of RMF mixed with various objects are required [27]. However, our system is not a multi-class classification. It is a pixel-wise binary classification consisting of an RMF category and a category grouping all objects except RMF. For example, if almond is selected as the RMF, it is a pixel-wise binary classification consisting of the almond category and the object category excluding almond. The proposed method predicts pixel-wise binary classification using U-Net [28]. U-Net is an architecture used for medical cell image segmentation [29] and is recognized as a representative model of semantic segmentation using deep learning due to its simple structure and high performance. Accordingly, research using U-Net is actively conducted in various fields such as agriculture, medicine, and engineering [30,31,32,33]. In addition, we introduced a method of generating a synthesis image that trains U-Net to only focus on features of RMF.
The synthesis method is a simple and easy approach to generating training datasets with minimal effort. The conventional synthesis method [34,35,36] should manually generate the annotation of the training dataset. However, the proposed method automatically acquires the mask of RMF using an effective image acquisition system that uses illumination and the Otsu algorithm. The automatically acquired mask of RMF is used as annotations for the training dataset of U-Net detecting RMF. As a result, the time and effort of collecting training datasets and annotations were dramatically reduced using an effective image acquisition system and synthesis image. As a result, the proposed method improves the performance of FODM through the combination of U-Net, a synthetic dataset, and the Otsu algorithm [37], rather than improving the DNN model alone.

2. Material and Methods

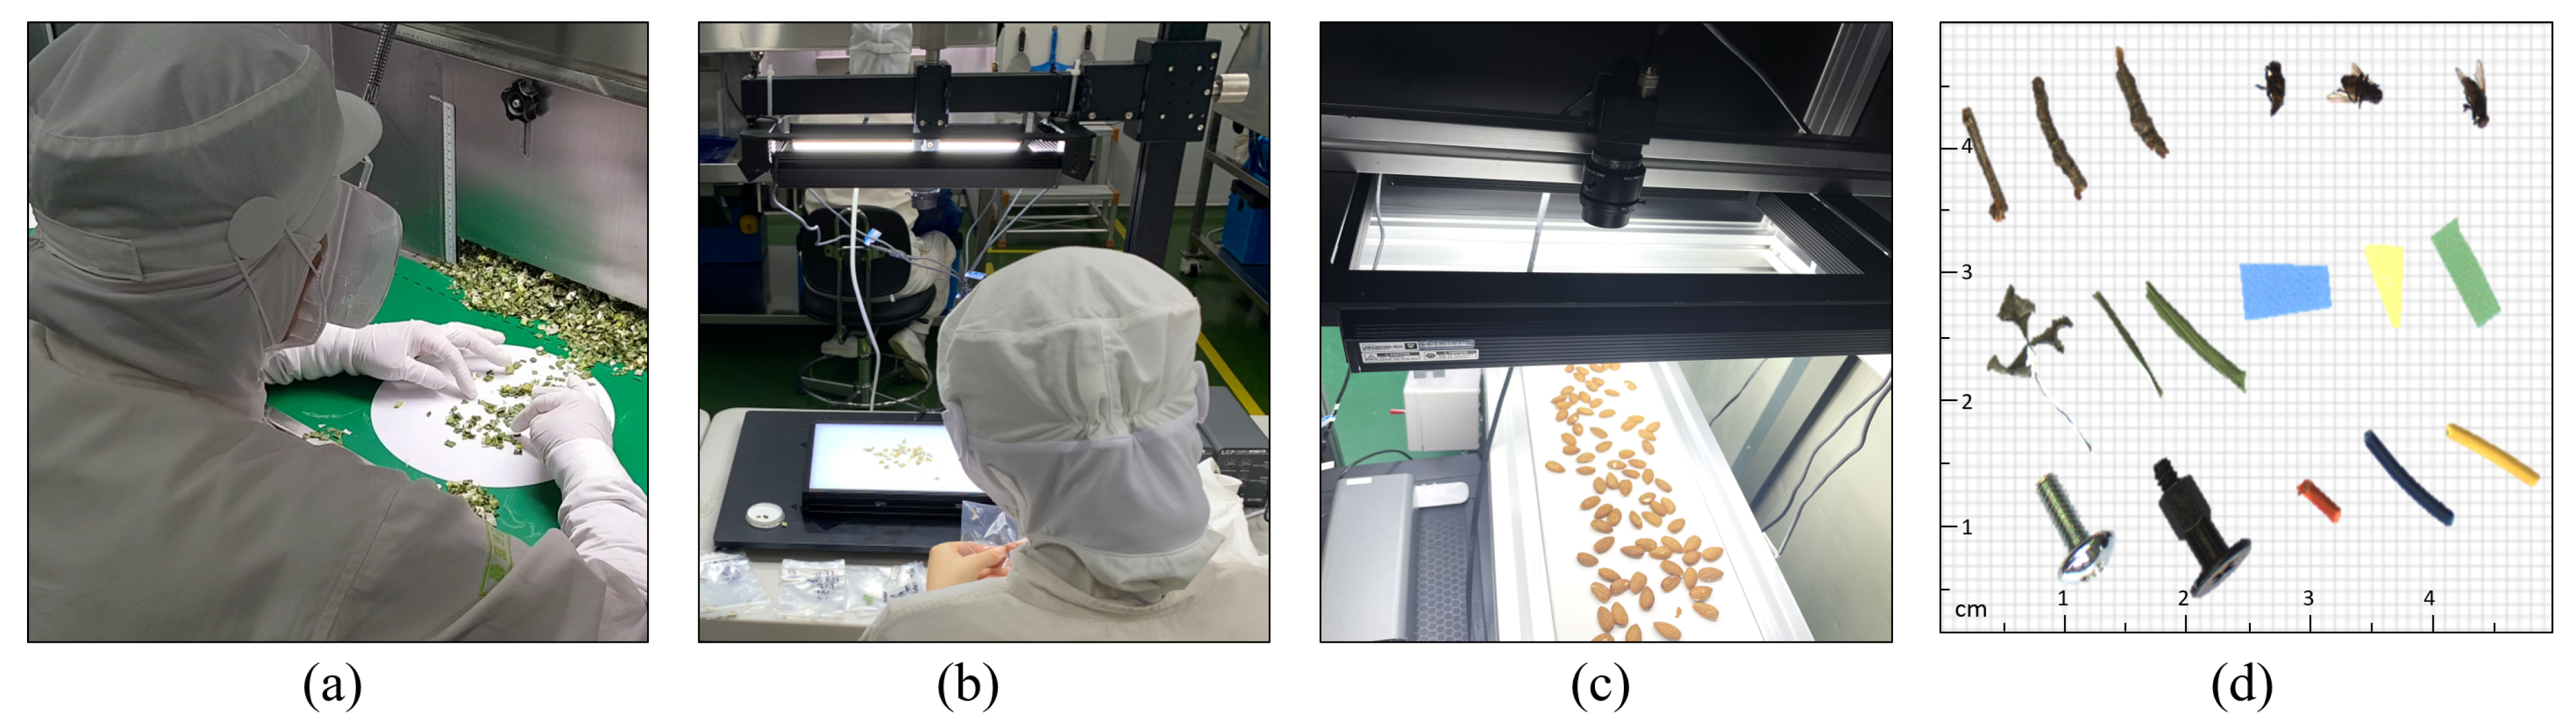
2.1. Sample Preparation
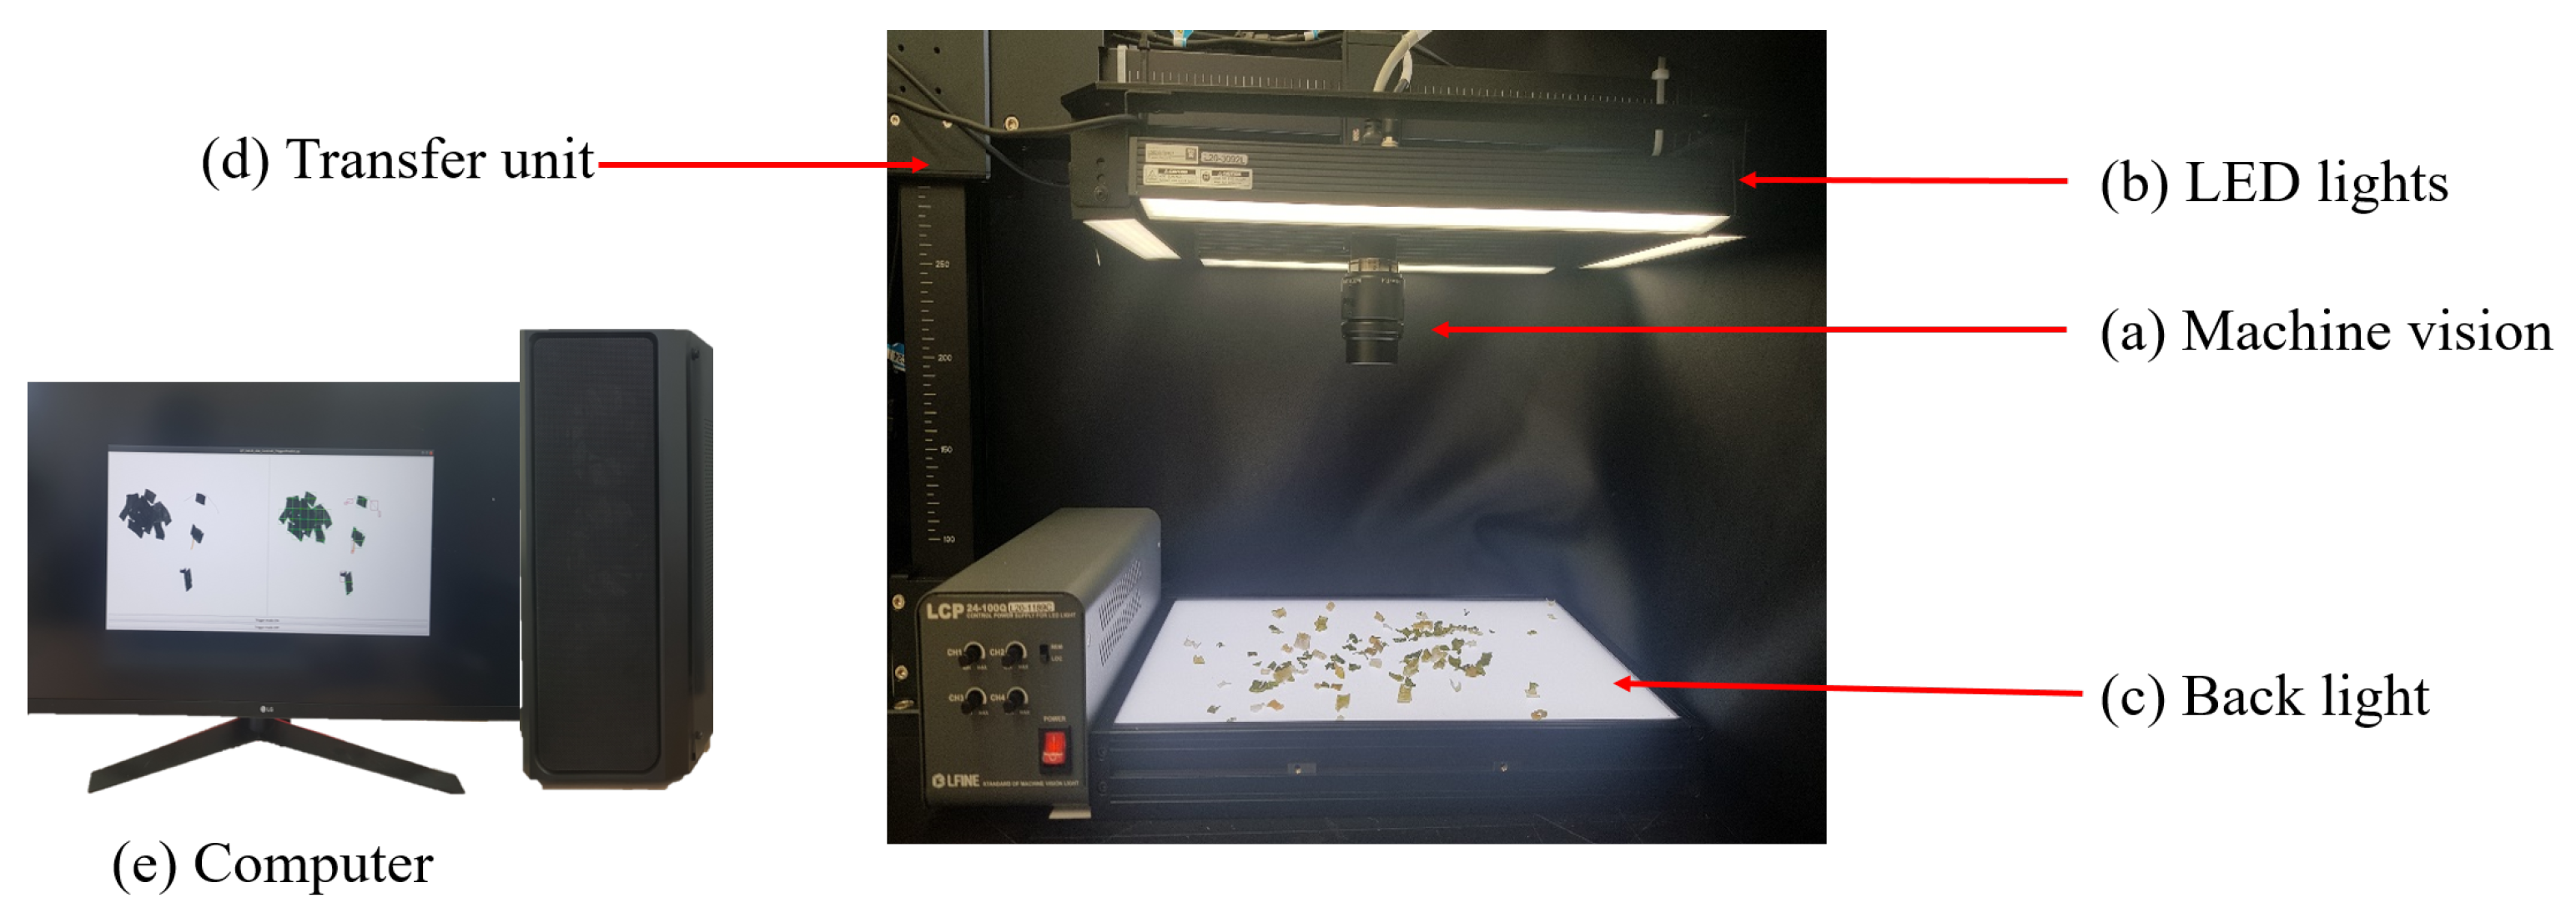
We adopt almonds and GOF among various RMF to verify the performance of the proposed method. However, GOF and almonds are only examples of various RMF; the proposed method can be widely used in various RMF. Almond is a very familiar nut and is used to make bread, butter, cakes, and other desserts. GOF is used widely in seasoning food, removing unpleasant odors, and increasing the richness of taste. Recently, the consumption of GOF as subsidiary materials for instant food continues to increase. From the acquired image standpoint, most almonds have similar features such as color, texture, shape, and size. Individual GOFs also have similar features to each other. However, thin and light GOFs have a tendency to overlap each other. GOFs overlapping each other have arbitrary shapes and sizes, and sometimes foreign objects are hidden. However, it should be noted that separation of the overlapping GOF and detection of hidden foreign objects are not considered in this paper, because it is expected that overlapping GOF or hidden foreign objects can be resolved by a vibration of the workbench [38]. When the proposed method is deployed with the above vibration equipment together, the overall performance will certainly be enhanced. Table 1 shows the training dataset and the test dataset. The training dataset was acquired at an illuminance intensity of 360 lux. The test dataset acquires the same sample at different illuminance intensities. Test dataset (1) is an image acquired at 360 lux, which is the same illuminance intensity as the training dataset. Test dataset (2) is an image acquired at 550 lux, which is a brighter illuminance intensity than the training dataset. Test dataset (3) is an image acquired at 175 lux, which is a darker illuminance intensity than the training dataset.

2.2. Equipment

The color image acquisition system was set up to acquire color images with RMF and foreign objects, as shown in Figure 3. The system consists of machine vision (Figure 3a), LED line illuminations (Figure 3b), a backlight (Figure 3c), a transfer unit (Figure 3d), and a computer (Figure 3e). The machine vision with a resolution of 2048 pixels × 1536 pixels (BFLY-PGE-31S4C-C, FLIR Integrated Imaging Solutions, USA) contained a focal length 16mm fixed megapixel lens (LM16JC5M2, KOWA, JP). The machine vision was connected to a personal computer ([email protected] GHz, 16 GB of RAM (random access memory), and a Titan XP graphic card with 16 GB of RAM). The LED line illuminations were used to adjust angle independently as bar illuminations mounted in four directions (LDBQ300, CLF, KOR). The backlight has a wide illuminating angle and high uniformity with chip mount LED on PCB at a regular interval (LXL300, CLF, KOR). This backlight serves to remove shadows from objects and provide a constant background to the image. The transfer unit included an X-axis and a Y-axis transfer unit for transferring the imaging section. All components except the computer were fixed inside a dark chamber to avoid any light. A light meter was used to measure the intensity of illumination (TES-1330A, TES, TW).

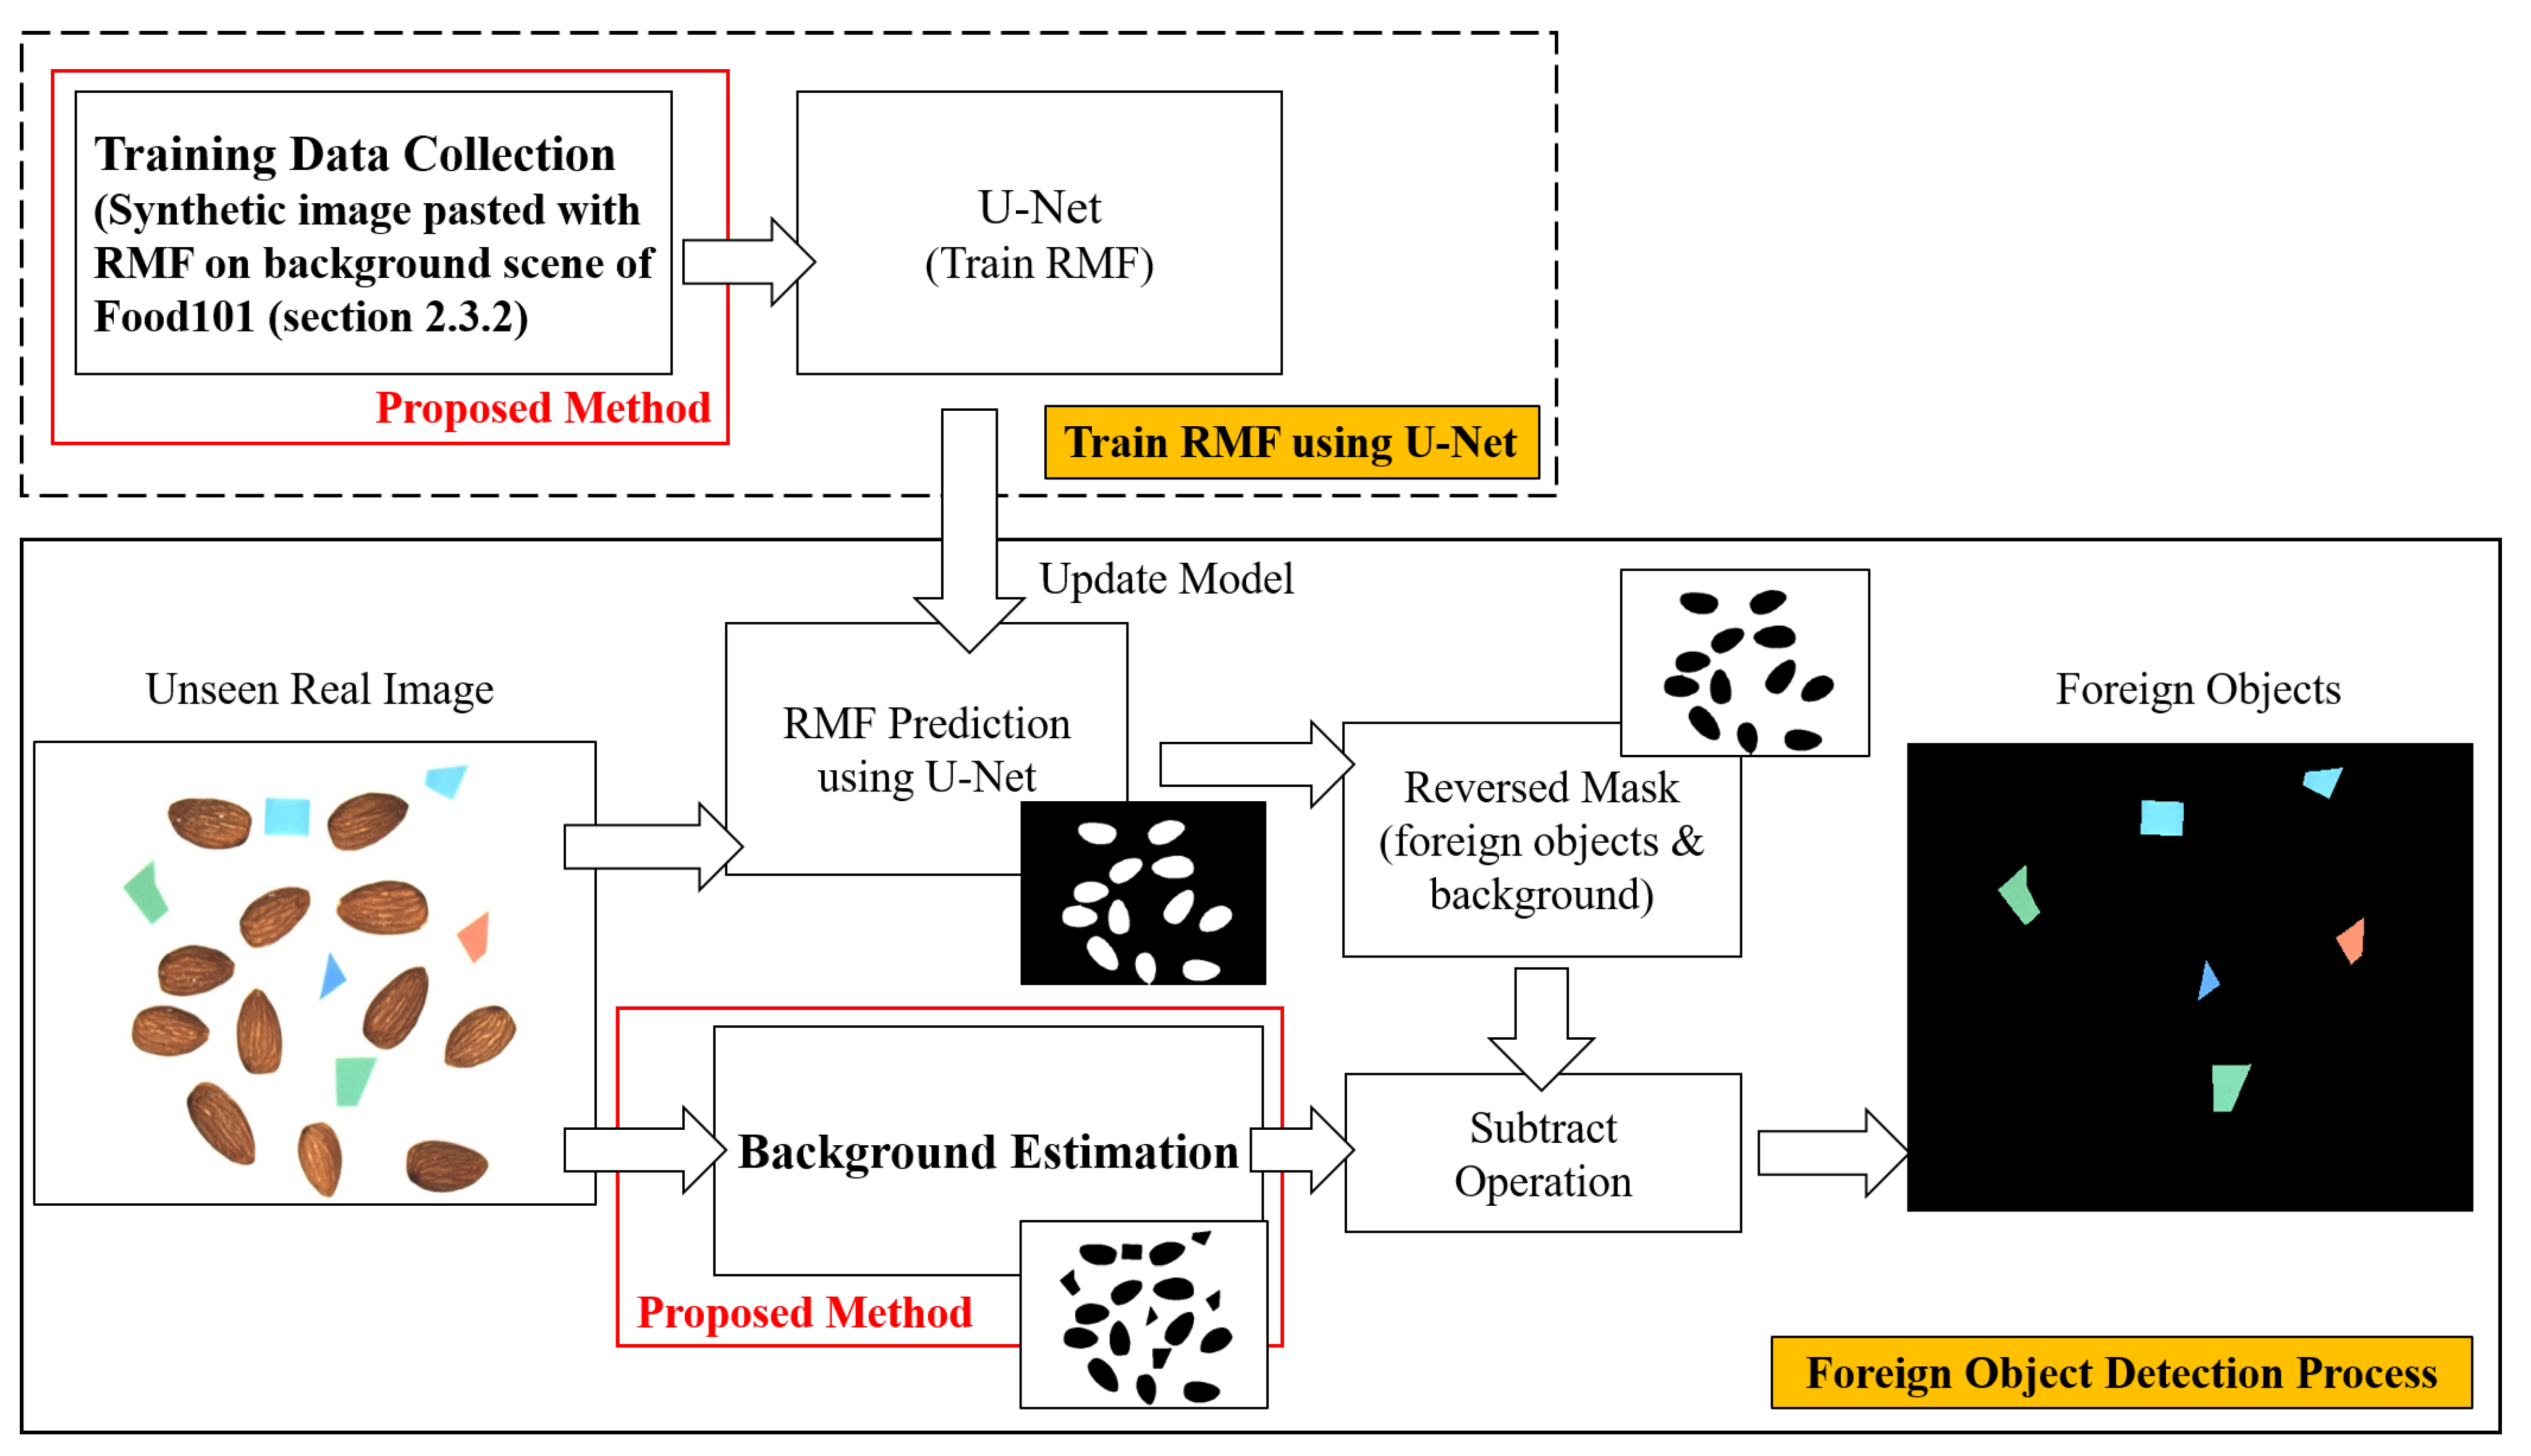
2.3. Proposed Method

All foreign objects could not be collected, so FODM using DNN limited them to frequently appearing foreign objects. However, both foreign objects that appear frequently and foreign objects that appear sometimes are foreign objects. Ideally, we want to detect all foreign objects that can be found during food inspection. However, to train a model for FODM, collecting all foreign objects that can be found during food inspection is almost impossible. To resolve this matter, we propose a method for detecting foreign objects without collecting any foreign objects. The main idea is to only focus on RMF and a background that can be easily obtained during food inspection. Only foreign objects will remain naturally when the proposed method removes RMF and a background from the test image. Figure 4 shows the two main steps of the proposed method. The first step is the training of U-Net to predict the RMF. The training dataset of U-Net uses images with RMF pasted in the Food101 background scenes in Section 2.3.2. The next step is the FODM through RMF prediction and background estimation. The proposed method uses deep learning as the main algorithm to detect foreign objects, so it is called deep learning-based foreign object detection (DLFOD). The steps for DLFOD are: (1) predict mask of RMF from an unseen real image using the trained U-Net in Section 2.3.3; (2) estimate background of the test image in Section 2.3.4; and (3) subtract predicted RMF and estimated background from the unseen real image. The proposed method provides high accuracy of FODM with little effort and no human annotation.

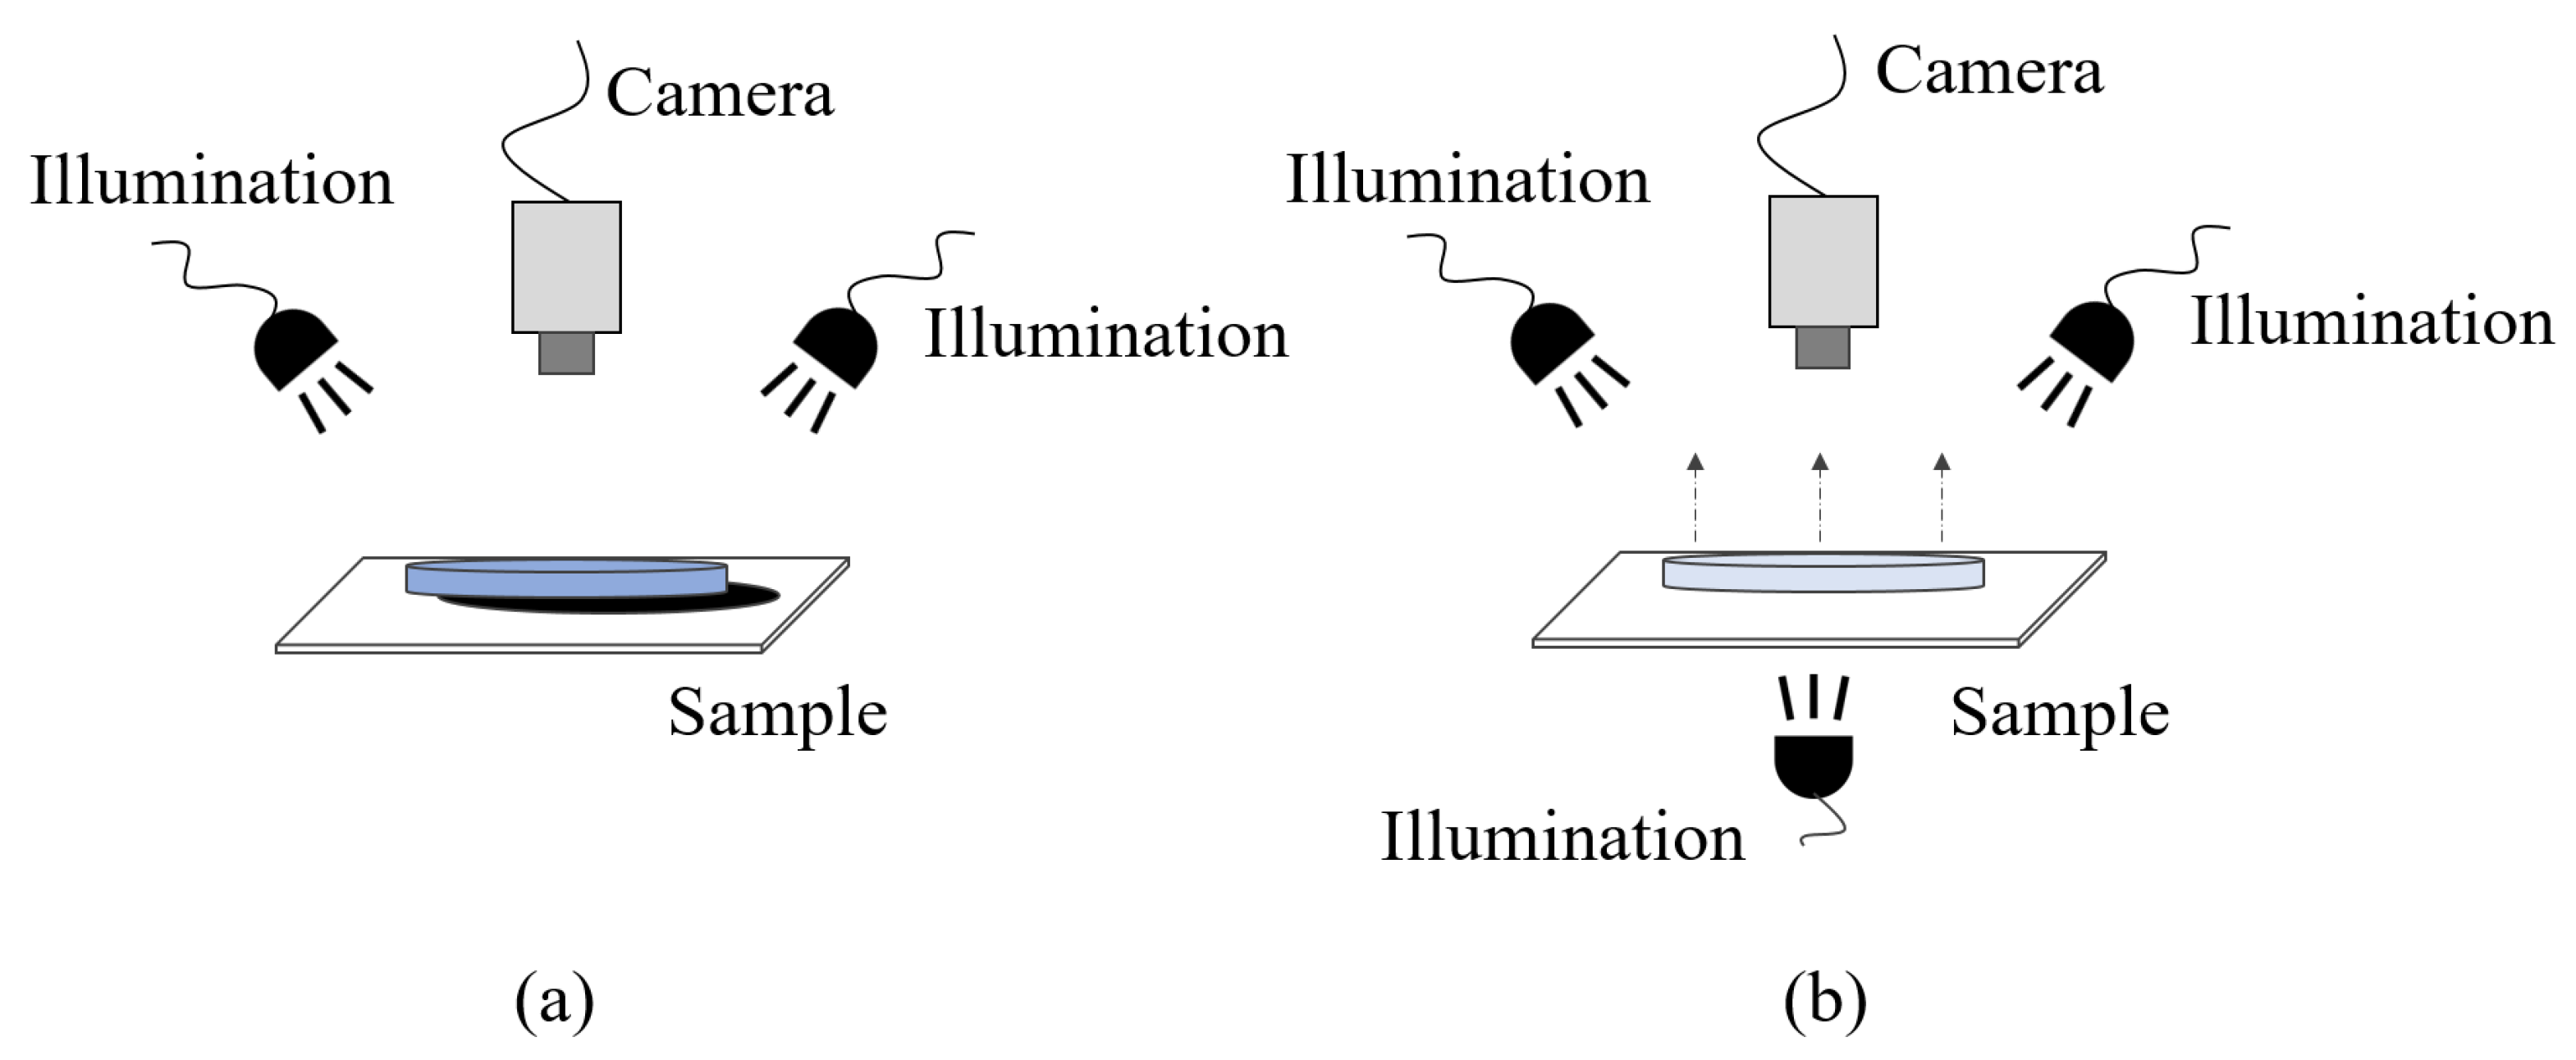
2.3.1. Effective Image Acquisition System

The illumination plays an important role in improving the performance of the camera, but it also has a problem of creating shadows of objects. The RMF image, which is required when generating a synthesis image, should not have shadows. Therefore, we propose a method of combining the reflectance and transmittance modes of illumination for shadow removal as shown in Figure 5b. Modes of illumination are reflectance mode and transmittance mode depending on the location where the illumination is installed. Typically, illumination installed above the object being observed is in reflectance mode as shown in Figure 5a, which emphasizes the features of the object in the image gained by the camera, making the colors more vivid. However, the transmittance mode illumination installed under the observation object is mainly used for observing the inside of thin objects. We tried a combination of reflective and transmittance modes for shadow removal. As a result, this method achieved the effect of emphasizing the features of the object more but removing the shadows. In addition, there was an advantage in that the distinction between the foreground and the background becomes clear. This advantage becomes an important clue to easily obtaining the training dataset and annotation required for DNN.
We use the Otsu algorithm as a method to separate the RMF images acquired in an effective image acquisition system into foreground and background. In computer vision and image processing, the Otsu algorithm is used to perform automatic image threshold. This threshold is determined by minimizing intraclass intensity variance or, equivalently, by maximizing interclass variance [39].

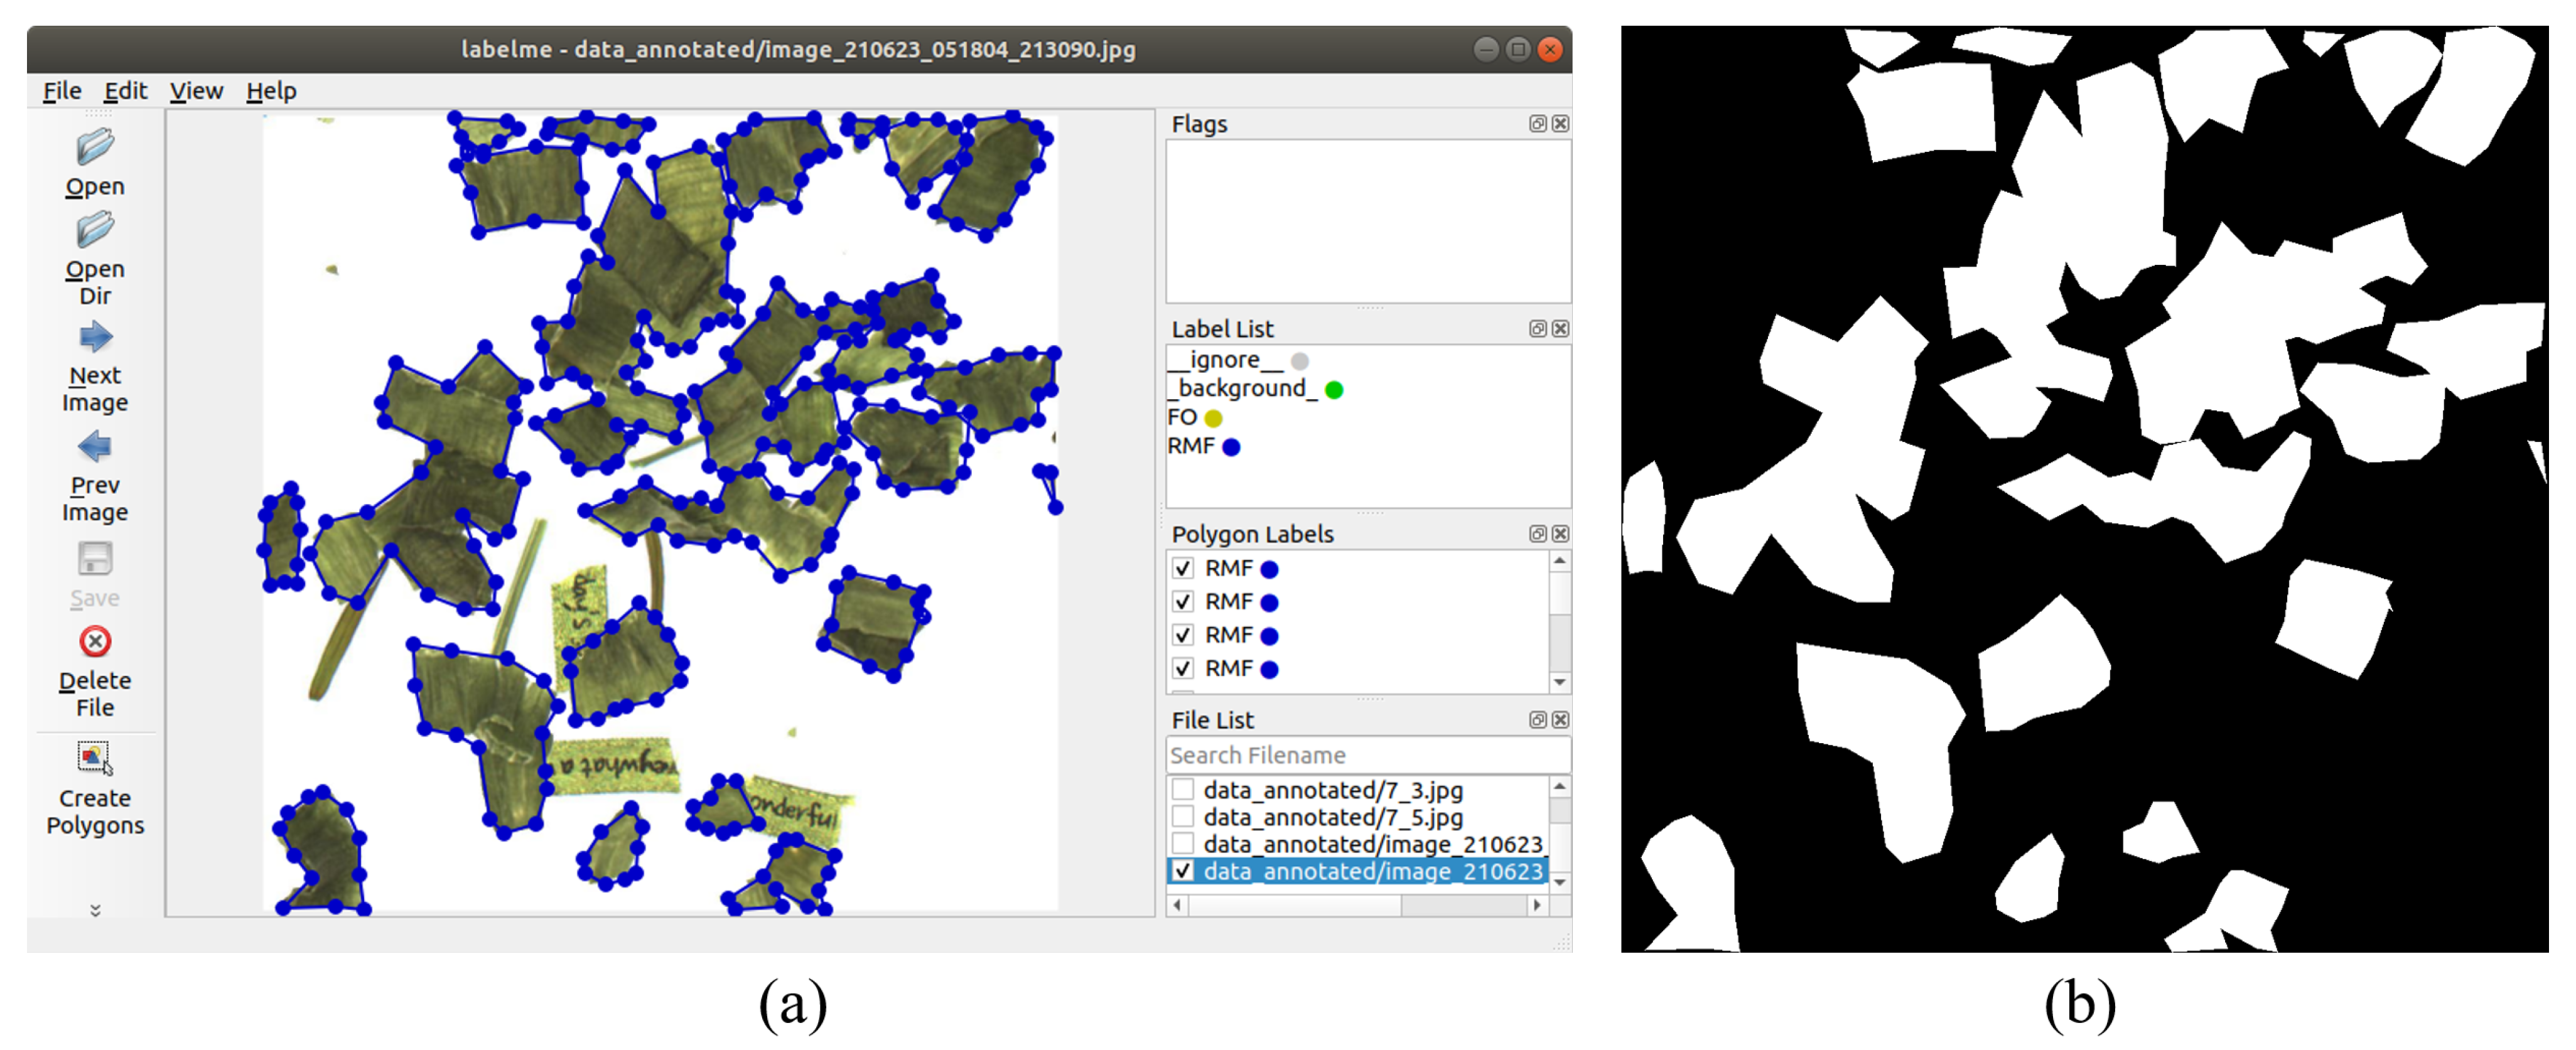
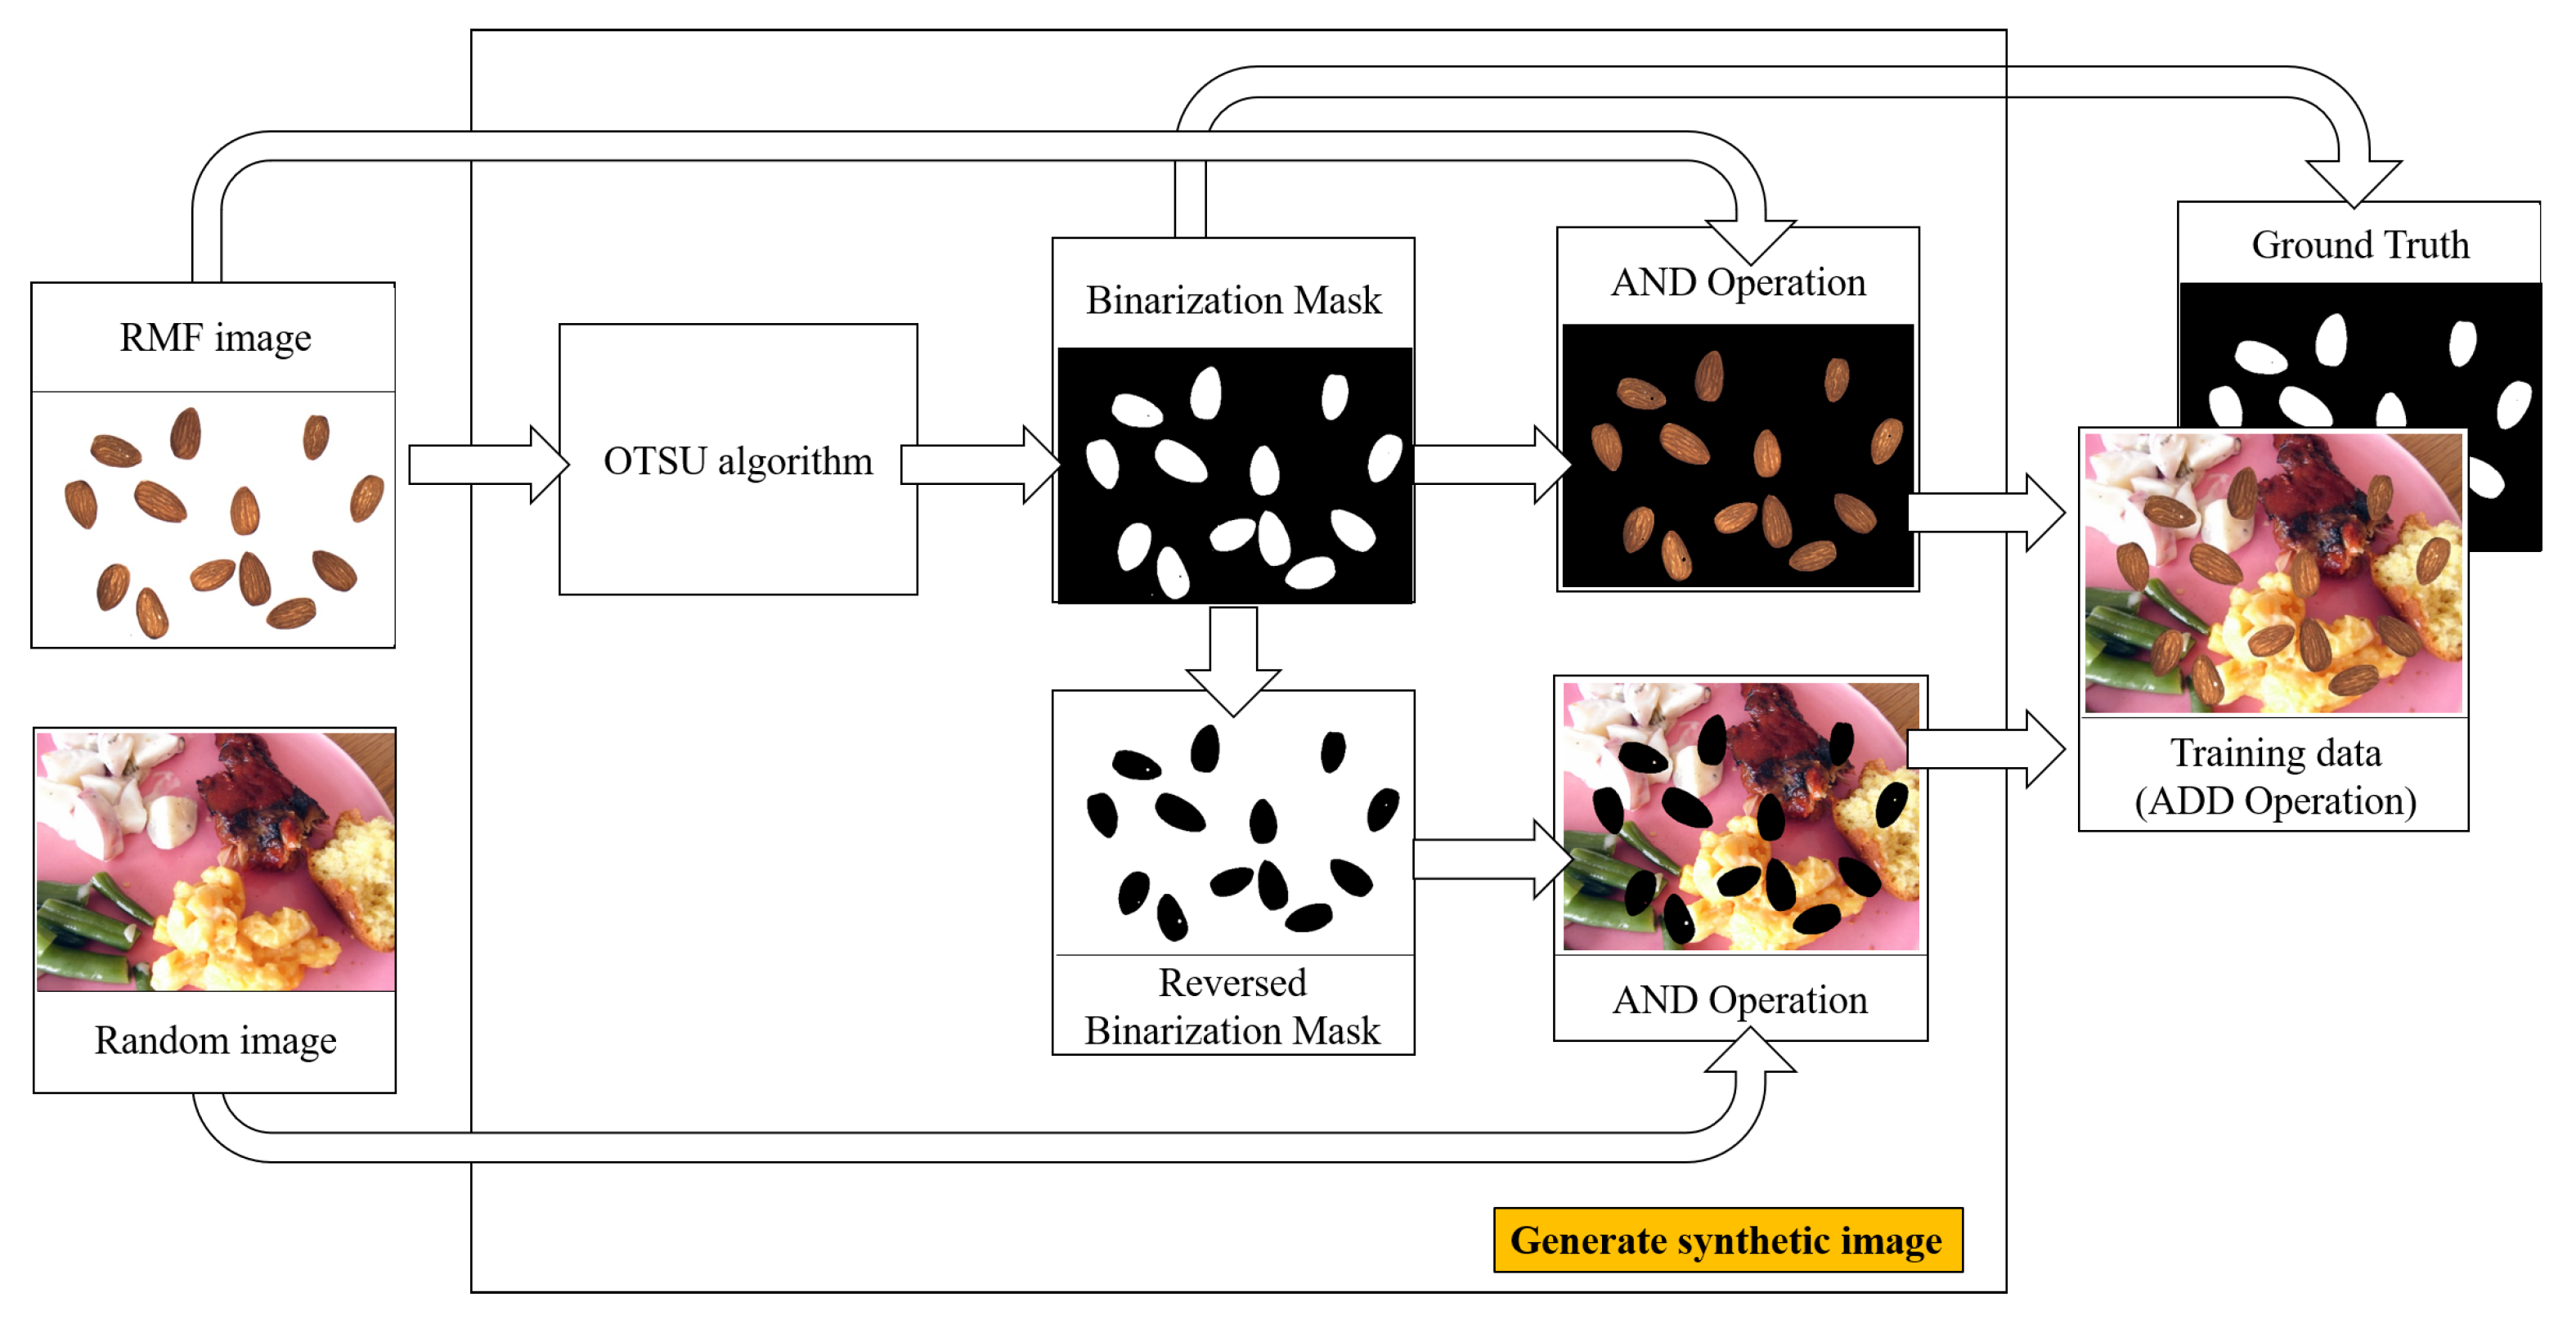
2.3.2. Generating Synthetic Images

To detect foreign objects using DNN, many images of RMF mixed with various foreign objects are required. In general, it takes a lot of time and effort to collect RMF with various foreign objects. To solve this problem, we generate synthetic images with only RMF pasted on the scene in the open datasets. Open datasets [40,41,42,43,44,45] are collected images from several categories of computer vision. We use open datasets to indirectly replace unspecified foreign objects. Figure 6 shows the main steps of the method to generate the synthetic image. The steps include: (1) prepare an image containing RMF acquired by effective image acquisition system and a randomly selected image from the open dataset, (2) convert RMF to a grayscale image, (3) acquire binarization mask image of RMF from the grayscale image using Otsu algorithm, (4) acquire the image through bitwise AND operation between RMF and the binarization mask image, (5) convert reversed binarization mask image of RMF from binarization mask image, (6) acquire the image through bitwise AND operation between the randomly selected image from the open dataset and the reversed binarization mask image, and (7) acquire the synthesis image by merging the two results. The binarization mask image is used as annotation for the resulting synthetic image. The proposed method acquires the training images and extracts the annotation of RMF without human effort.
To train a model that is robust for the change of illumination intensity, the color jittering was performed by randomly adjusting the saturation, contrast, and brightness of the synthetic image.

2.3.3. Raw Materials of Food Prediction

We require a method to predict the region of RMF for input images mixed with RMF, a background, and foreign objects. In addition, the predicted output image should have the same spatial resolution as the input image. Semantic segmentation is the task of assigning categorical annotations to every pixel in a given image and is used for image segmentation tasks with the same resolution of the input image as the output image. We predict the region of RMF using U-Net. U-Net is used to detect various objects such as vehicles and medicine, but no research references exist concerning the detection of RMF such as almond and GOF. However, RMF is similar to medical cells in that other RMF or foreign objects are adjacent to each other and are symmetrical up and down and left and right. U-Net uses the overlap-tile technique to train symmetric and adjacent cells. Therefore, we train the RMF using U-Net, which enables segmentation between symmetric and adjacent objects using the overlap-tile technique and tasks with the same resolution of the input image as the output image for image segmentation.
The architecture of the U-Net is shown in Figure 7. It consists of contraction and expansion paths and does not use the lateral connection between the contraction and expansion paths. The contraction path is made of contraction blocks. Each block takes two 3 × 3 convolutions, each followed by a rectified linear unit (ReLU) and a 2 × 2 max pooling operation [46] with stride 2 for downsampling. The number of feature maps after each block doubles. The feature map is a mapping that corresponds to the activation of different parts of the image and is also a mapping of where a certain kind of feature is found in the image. A high activation means a certain feature was found. As the number of feature maps increases, the architecture can learn complex structures more effectively because the architecture can find more certain features in the image [47]. For example, the first feature map looks for curves. The next feature map looks at a combination of curves that build circles. The next feature map could detect extended features from circles. Every block in the expansive path is made up of a 2 × 2 convolution and two 3 × 3 convolutions, each followed by a ReLU. The expansive path ensures that the features that are learned while contracting the image will be used to reconstruct it. At the final layer, a 1 × 1 convolution is used to map each 64-component feature vector to the 2 classes. In total, U-Net has 23 convolutional layers.
The energy function is computed by a pixel-wise sigmoid over the final feature map combined with the cross-entropy loss function. The sigmoid layer at the end of the model created a two-channel output and then an output image containing the result—whether it is green onion flakes or not. The sigmoid used to train the model is shown in Equation (1):
s ( x ) = 1 1 + e x
where x is the input data.
The cross-entropy used to train the model is shown in Equation (2):
C E = i = 0 C = 2 [ t i l o g ( f ( s i ) ) + ( 1 t i ) l o g ( 1 f ( s i ) ) ]
where t i { 0 , 1 } c is the true label of each pixel, and s i [ 0 , 1 ] c is sigmoid output data.

2.3.4. Background Estimation

To leave only foreign objects in the image, we need to remove the background. The background corresponds to the surface of the workbench. Figure 3c shows the workbench image which consists of a backlight. On a workbench without a backlight, shadows appear on RMF, as shown in Figure 8a. Although the shadow is not a foreign object, the FODM is highly likely to predict it as a foreign object. Hence, the workbench with a backlight is effective in removing shadows from the objects, as shown in Figure 8c, and has a white background. The white background pixels have high gray level strength [48]. Moreover, the color intensity of the background is very similar. Consequently, the minimum intensity of the empty workbench image is used to calculate the threshold used to determine whether it is a background or not. This is defined as
M ( x , y ) = 255 g ( x , y ) T r 0 o t h e r w i s e
where g(x,y) is the gray-value at position (x,y) of the input image, and T r the minimum intensity value of the empty workbench image. M(x,y) is a gray-value at position (x,y) of the output image. At position M(x,y), the gray value of 255 means background, and 0 means foreground. The binarization result of region segmentation of a background is obtained from Equation (3).

2.4. Histogram Backprojection

Most food inspection methods use color sorting machines to detect foreign objects [13,49]. The color sorter machines use a method to detect foreign objects based on the color difference between RMF and foreign objects [50]. Color-based foreign object detection mainly uses the histogram backprojection algorithm [51], so it is called histogram backprojection-based foreign object detection (HBFOD). Histogram can be used to roughly inspect the distribution of pixels in an image. Back projection is a method of recording how well the pixels of a given image fit the distribution of pixels in the histogram model. By deriving histograms of both a target image and a source image, the histogram backprojection calculates the ratio histogram of the source with the target [52]. The source S is determined from the object to be found, and the target T is determined to be searched. A ratio histogram R is obtained by dividing S by T:
R i = m i n [ S i / T i , 1 ]
where i is the index of a bin. This ratio histogram R is then backprojected on the image:
b x , y = R h ( C x , y )
where C x , y is the pixel value at (x,y), h ( C x , y ) is the bin corresponding to C x , y , and the backprojected image is b x , y .

2.5. Metrics to Evaluate the DNN Model

We assessed the performance of the FODM as F1-score [53]. F1-score is the harmonic mean of precision and recall computed from the number of foreign objects detected. The highest possible value of an F1-score is 1.0, and the lowest possible value is 0. Recall is the ratio of the number of correctly detected foreign objects to the number of actual foreign objects. Precision is the ratio of the number of correctly detected foreign objects to the number of actual foreign objects and RMF. A high F1-score means that precision and recall are harmoniously high. Therefore, the region of the foreign objects is accurately detected, and the RMF region is not detected as the region of the foreign objects. However, A low F1-score means that there is a gap between precision and recall, or that both precision and recall are low. Therefore, a low F1-score has a disadvantage in that even if the region of foreign objects is accurately detected, the false detection of the RMF region as a foreign object is also high. Mean F1-score is the average F1-score of types of foreign objects included in the test data. A high mean F1-score means that it can detect various types of foreign objects. As a result, a high mean F1-score can detect various types of foreign objects and does not misrecognize the RMF region as a foreign object, so it is a suitable method for food inspection.
F 1 = 2 * P r e c i s i o n * R e c a l l P r e c i s i o n + R e c a l l

3. Results and Discussion

We compare the effectiveness of the proposed synthesized dataset against the human-annotated dataset. Firstly, we show that the effective image acquisition system obtains images that can be easily distinguished between foreground (RMF) and background (workbench). Secondly, we generate synthetic images by pasting the RMF obtained from the effective image acquisition system onto a randomly selected background in Food101. Lastly, we compare the performance of detecting foreign objects in the test dataset using a trained U-Net for the proposed synthesized dataset with automatically generated annotations and the real dataset with the human-annotated annotations.

3.1. Training Image and Annotation Acquisition

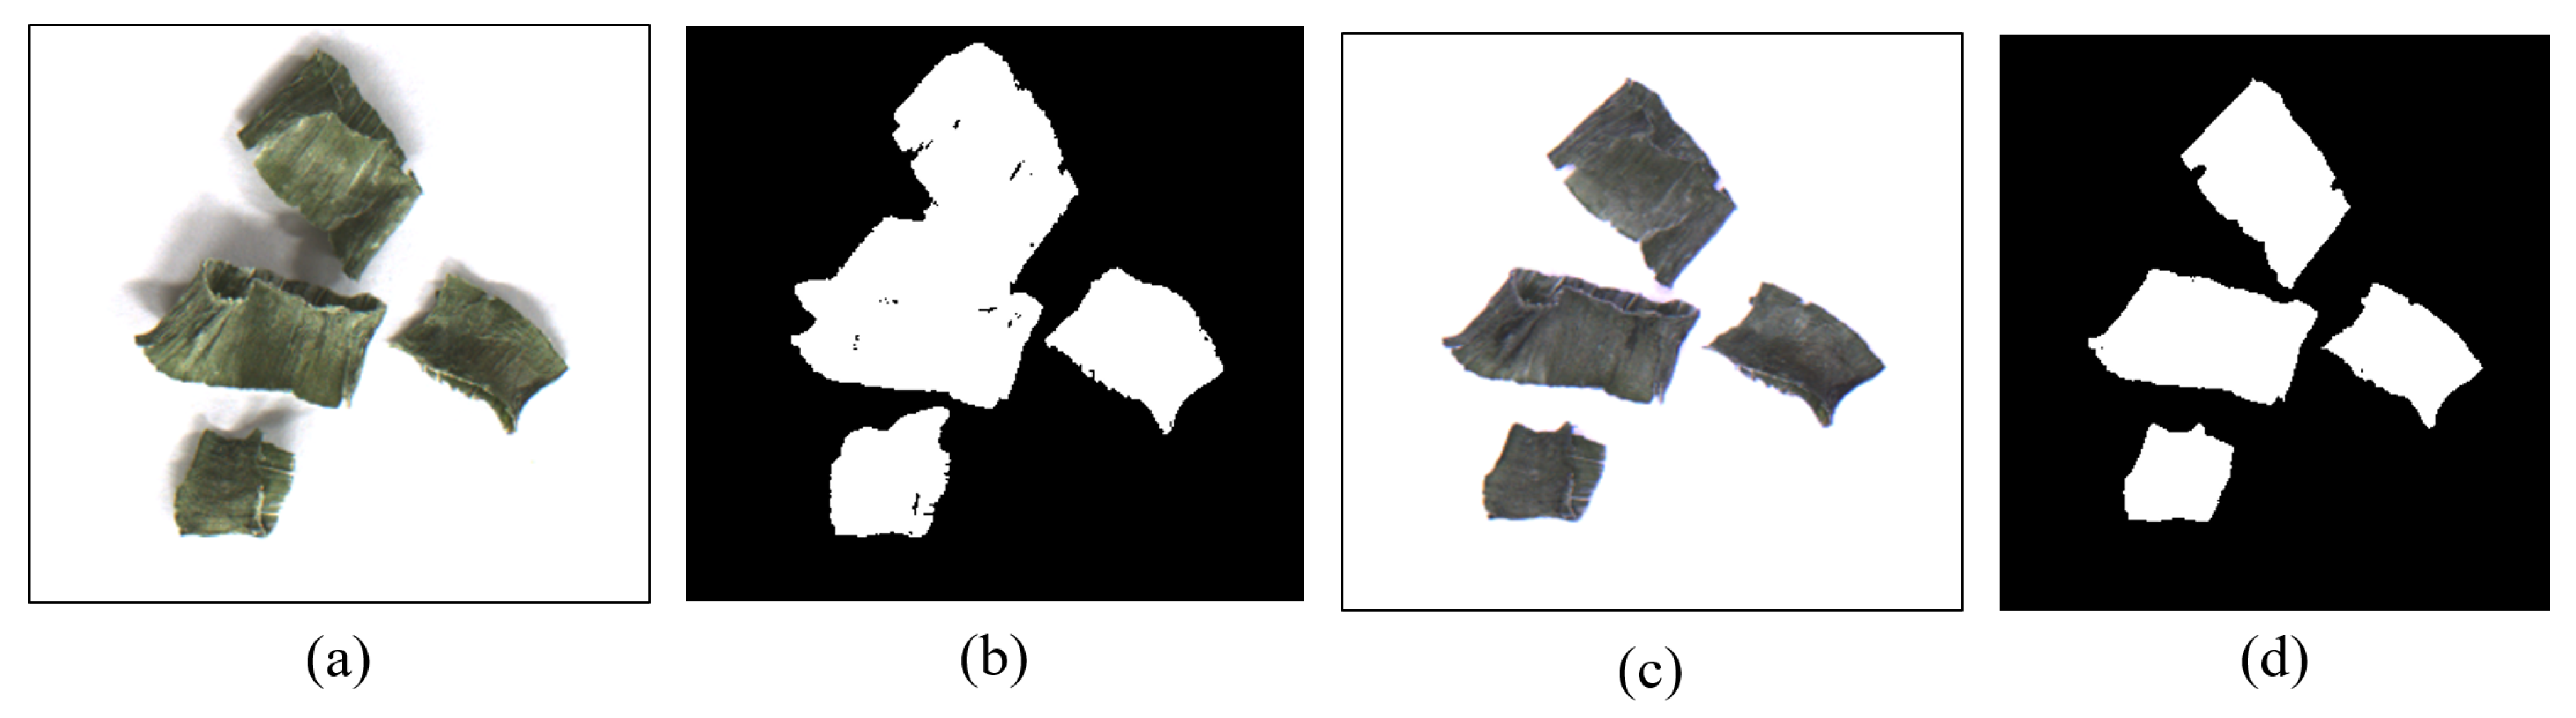
3.1.1. Effective Image Acquisition System Result

To acquire RMF images and binarization masks for synthesis image generation, we propose the effective image acquisition system with both reflectance and transmittance modes. The image acquired in reflectance mode has a shadow as shown in Figure 8a, whereas the image acquired in the proposed system has no shadow as shown in Figure 8c, and the foreground and background can be clearly distinguished. The acquired image is automatically converted to a binarization mask using the Otsu algorithm. In the binarization mask obtained based on the reflectance mode, it is difficult to distinguish the boundary between the foreground and the background due to shadows as shown in Figure 8b. On the other hand, the binarization mask obtained based on the proposed system can clearly distinguish the boundary between the foreground and the background as shown in Figure 8d. A method similar to our proposed effective image acquisition system is to acquire an object mask using a depth sensor. The Big Berkeley Instance Recognition Dataset [54] provides object masks using a depth sensor, and many researchers use it as a training dataset for semantic segmentation. However, the depth sensor is difficult to use for RMF that are attached to the background or thin. On the other hand, the proposed image acquisition system is advantageous for acquiring a mask of a thin object such as GOF.

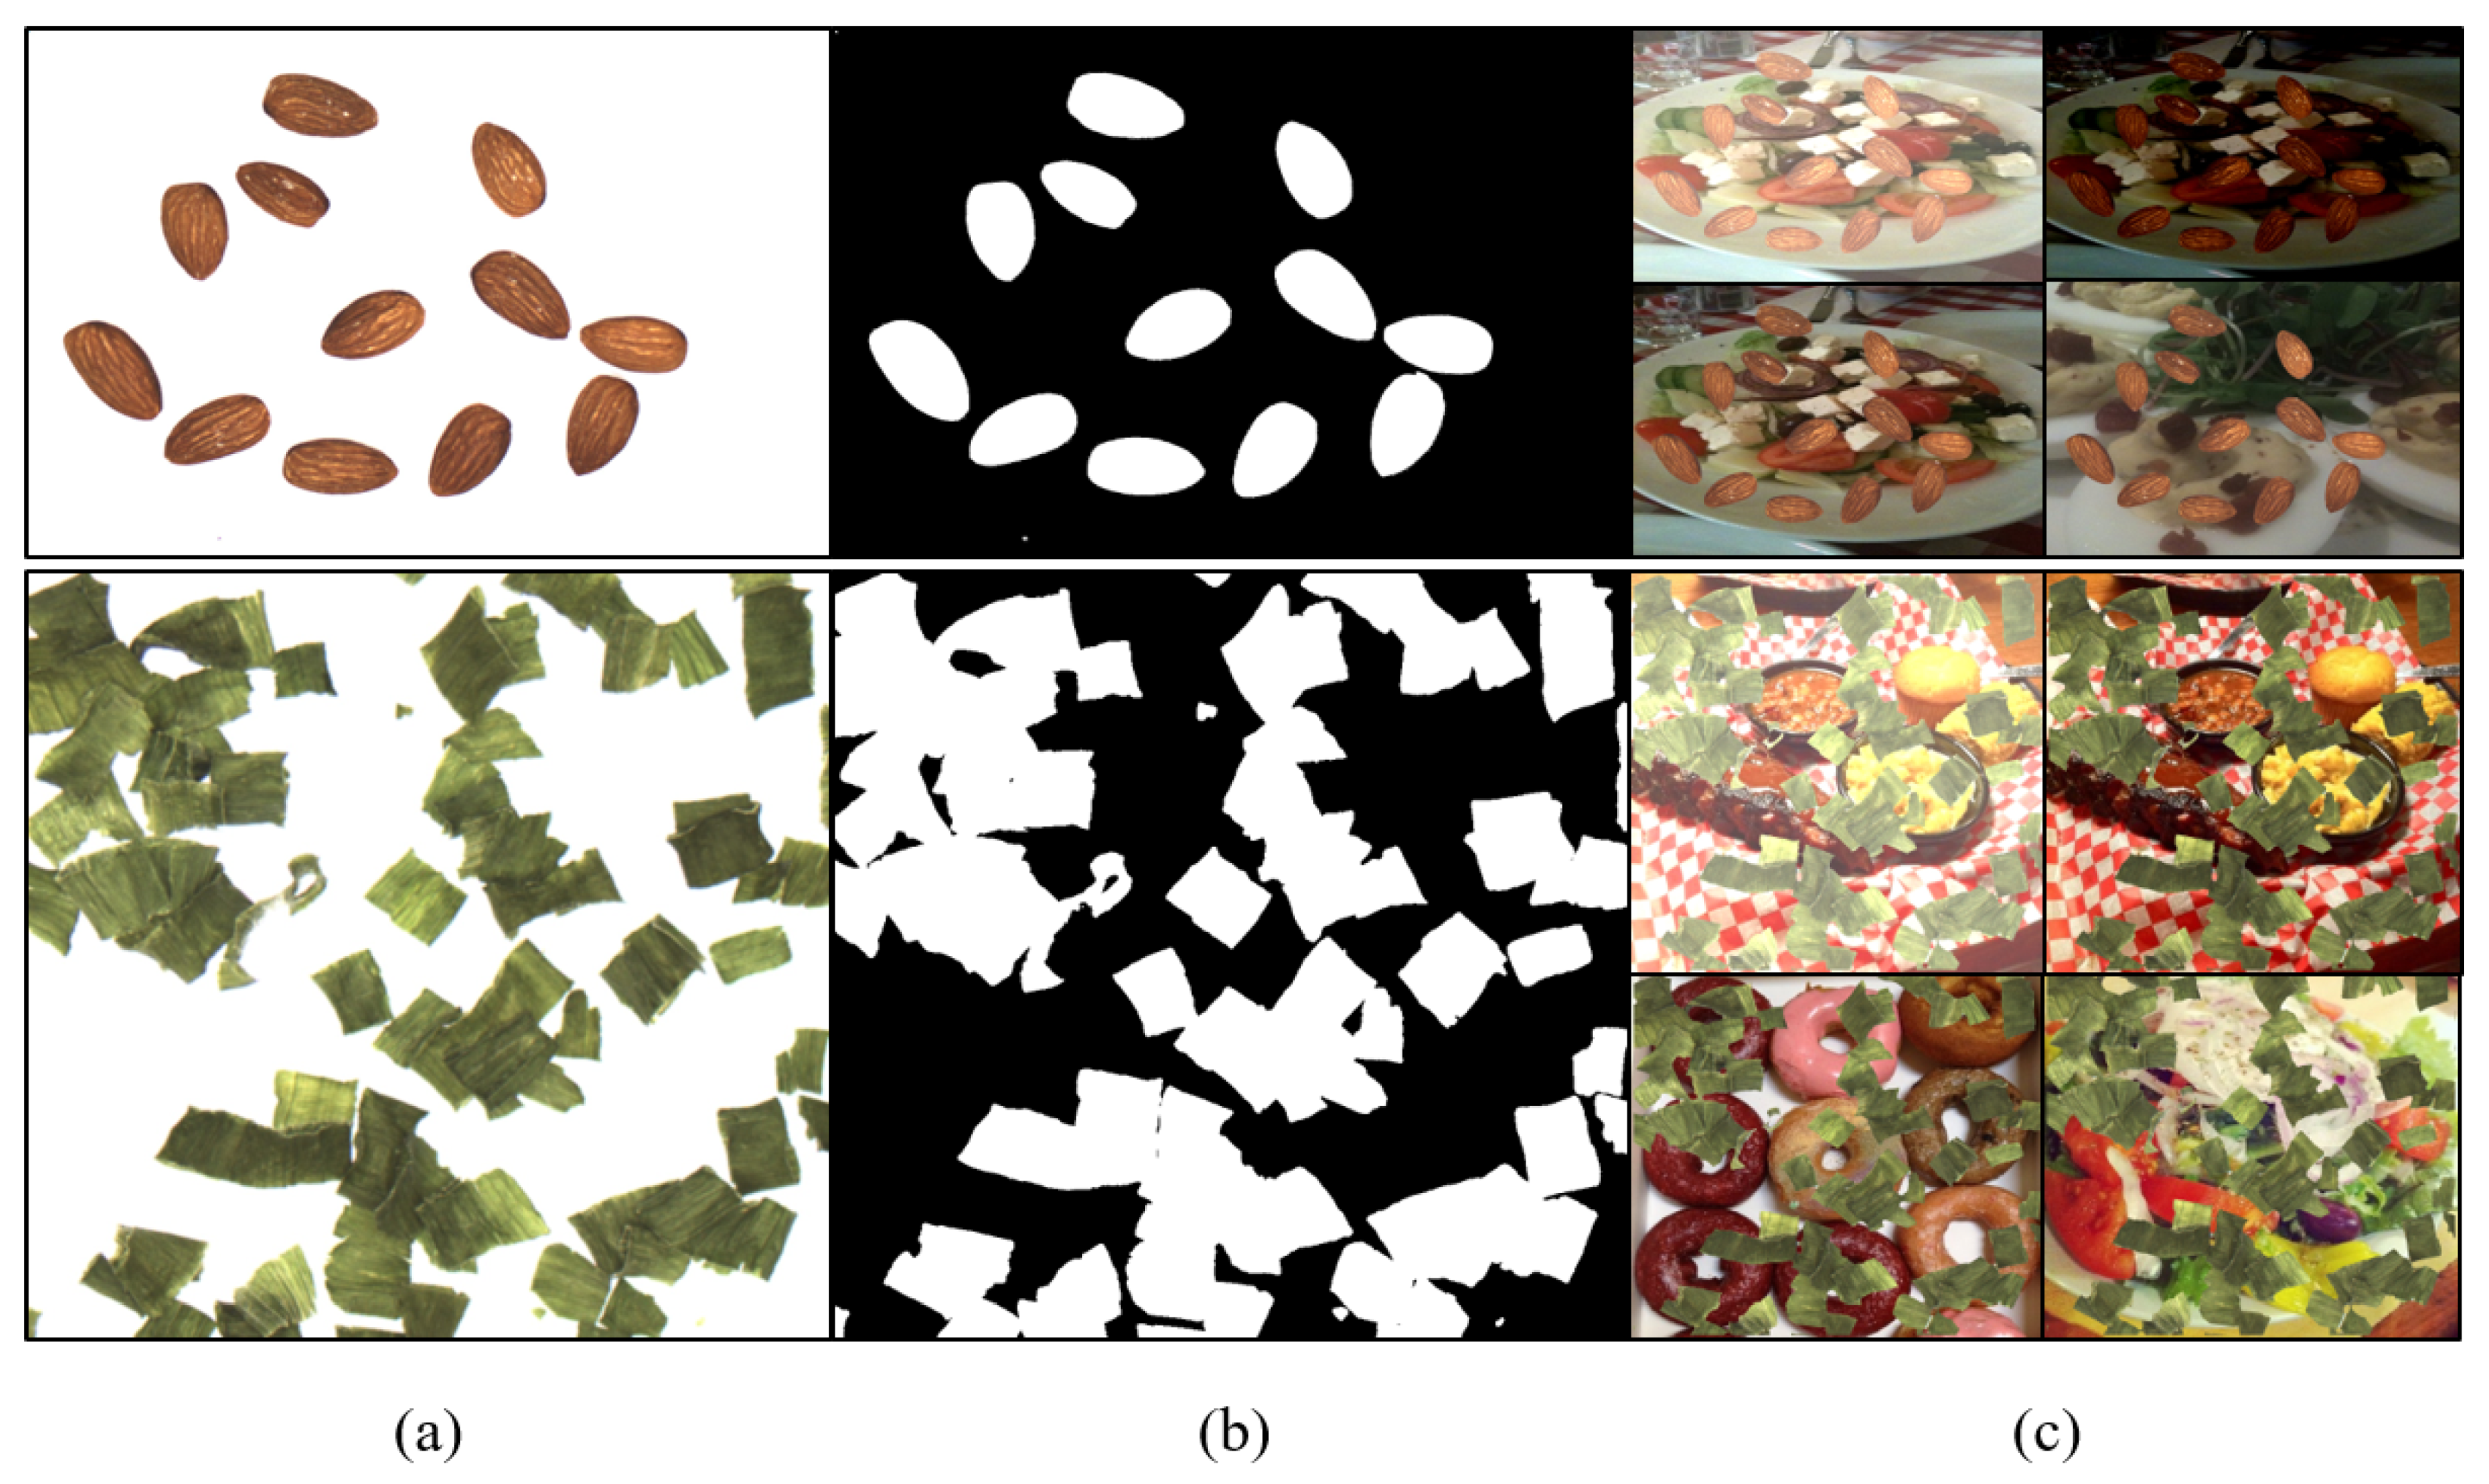
3.1.2. Synthetic Image Result

We augmented the training dataset using the synthetic image; the images in Figure 9 are examples of the data augmentation. To generate the synthetic image, we chose the Food101 dataset as the open dataset to synthesize RMF. The Food101 dataset [55] presented in [41] consists of food images and related objects. The Food101 dataset contains 101 food categories and 101,000 images. For example, samples of the Food101 dataset include spinach, carrots, cucumbers, and mushrooms belonging to natural objects and some categories similar to RMF. In addition, it also includes metal, glass, and paper that belong to man-made objects. The synthetic image is generated by combining the RMF images and randomly selected images from the Food101 dataset. In Figure 9a, almond and GOF are acquired by the effective image acquisition system. In Figure 9b, The image acquired by the image acquisition system is separated into the region segmentation of RMF and the background using the Otsu algorithm. The separated region segmentation of RMF is used as the annotation for the training dataset. Figure 9c includes synthetic images pasted with RMF from the training dataset to the randomly selected background from the Food101 dataset. RMF were surrounded by various objects related to food in the synthetic image. Color jittering was performed by randomly adjusting the saturation, contrast, and brightness of the synthetic image.

3.2. Evaluation of the Synthesis Images

DLFOD To evaluate the performance of DLFOD across datasets, we conducted experiments using the acquired real images or synthetic images or both real images and synthesized images as training datasets. Table 1 shows the number of RMF and foreign objects used in the training and test datasets. The real image with the human-annotated annotations consisted of RMF and real foreign objects from the training dataset. On the other hand, the synthesized image with automatically generated annotations uses images pasted with RMF from the training dataset to the randomly selected background from the Food101 dataset. The test dataset consists of real images including RMF mixed with real foreign objects. The test dataset acquired the same sample at different illuminance intensities (360, 175, and 550 lux).
We used the DLFOD introduced in Section 2.3 and initialized all the weights in the training model to values generated randomly from a Gaussian. We trained all models for 50 epochs using SGD + momentum with a learning rate of 0.001, momentum of 0.9, batch size of 5. A weight decay of 0.0005 was also used. We set the value of all the loss weights as 1.0 in our experiments. We ensured that the model hyperparameters did not change by utilizing the same random seed for consistency.
Table 2 shows the evaluation results of the FODM performance of DLFOD according to the training datasets. The mean F1-score of the test dataset (1) obtained from DLFOD trained on the synthetic image (almonds) achieved a performance of 0.82, similar to the mean F1-score obtained from the DLFOD trained on the real image (rows 1 vs. 3). We collected manual annotations of real images (almonds) in the training dataset using annotation tools in Figure 2a and took about 1–2 min per sample—a total of 40 h. On the other hand, synthetic images are not annotated by humans, saving 40 h and effort. The mean F1-score of the test dataset (1) obtained from DLFOD trained on the GOF synthetic image achieved a performance of 0.70, which obtained lower performance than almond (rows 10 vs. 12). Almonds have a distinct shape and texture compared to GOF and do not overlap each other. It is easy for the DLFOD to accurately learn the almond features using the synthetic image. Conversely, GOF is thin and easily overlaps with other GOFs, so the shape of the GOF is unclear, making it difficult for the DLFOD to learn the GOF features compared to almond. This agrees with [56] that the higher-level DNN layer concentrates on the shape of an object. In Figure 10, (a) shows foreign objects having a color similar to that of GOF mixed with GOF at an illuminance intensity of 360 lux, (b) shows that some of the foreign objects with a shape and color similar to GOF are false detections, (c) shows foreign objects mixed with GOF, and (d) shows that some of the RMF and foreign objects are false detections.
The mean F1-score of the test dataset (2) obtained from DLFOD trained on the synthetic image (almonds) achieved a performance of 0.80. On the other hand, the DLFOD learned from the real image was 0.78, which had a lower performance than the synthetic image. In addition, The mean F1-score of the test dataset (3) obtained from DLFOD trained on the real image (almonds) achieved a performance of 0.74, which had a lower performance than the synthetic image. As a result, the mean F1-score of the test dataset (2, 3) obtained from DLFOD that learned the real image showed a large difference in performance according to the change in illuminance. However, the mean F1-score of DLFOD that learned the synthetic image that conducted dataset augmentation using color jitter showed a relatively small difference in performance according to the change in illuminance. Combining the real image and the synthetic image can overcome the disadvantage that the training dataset of the real image is weak to changes in illuminance. These results show that the synthetic dataset not only competes with the real dataset, but the two also complement each other.

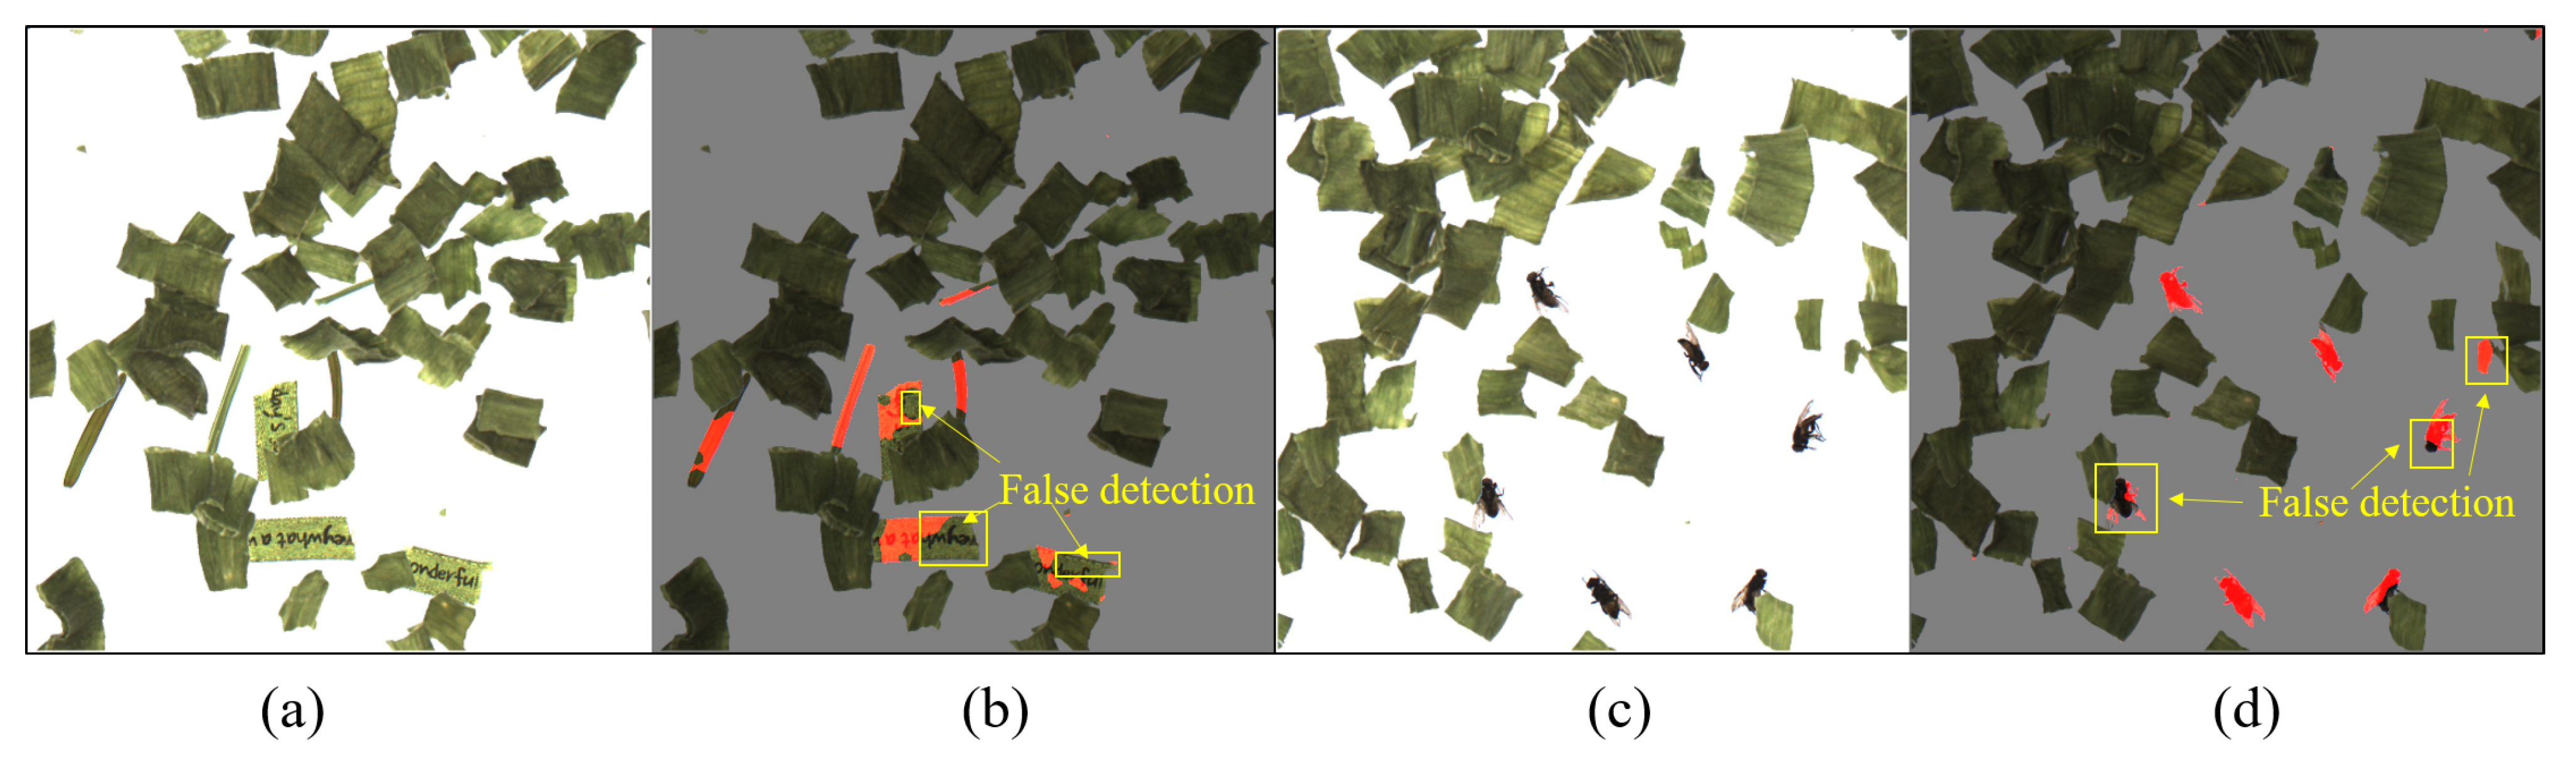
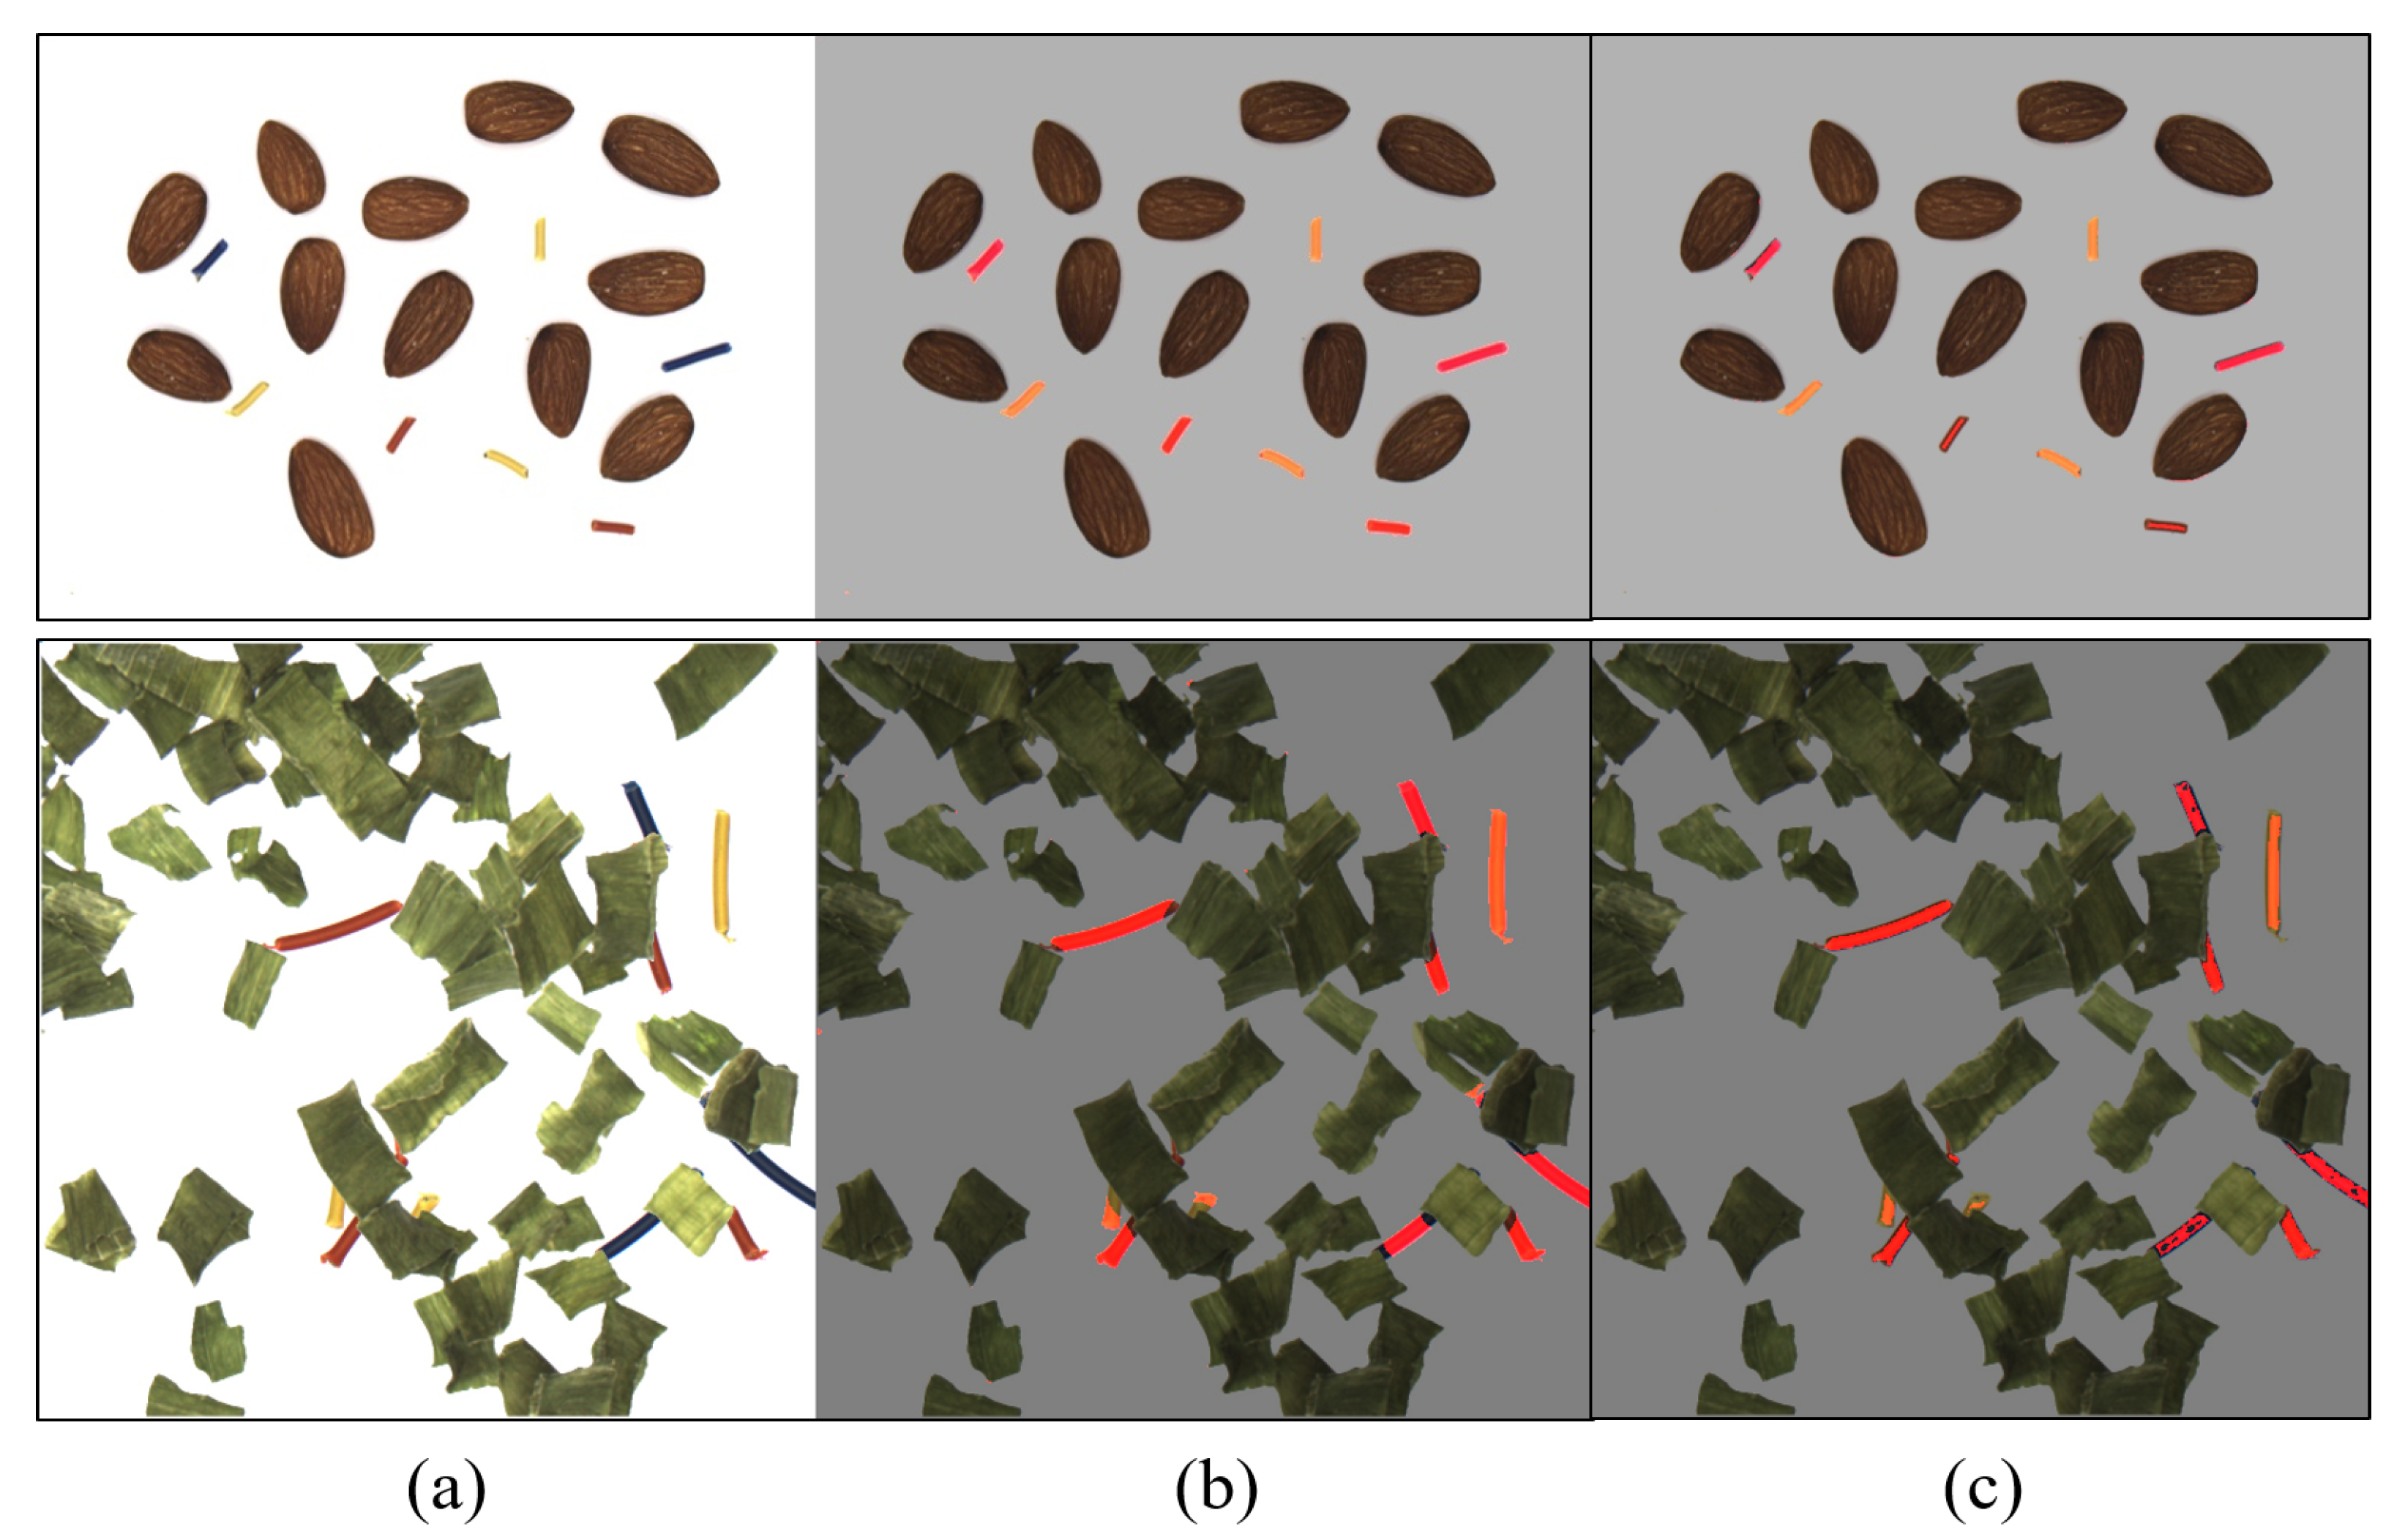
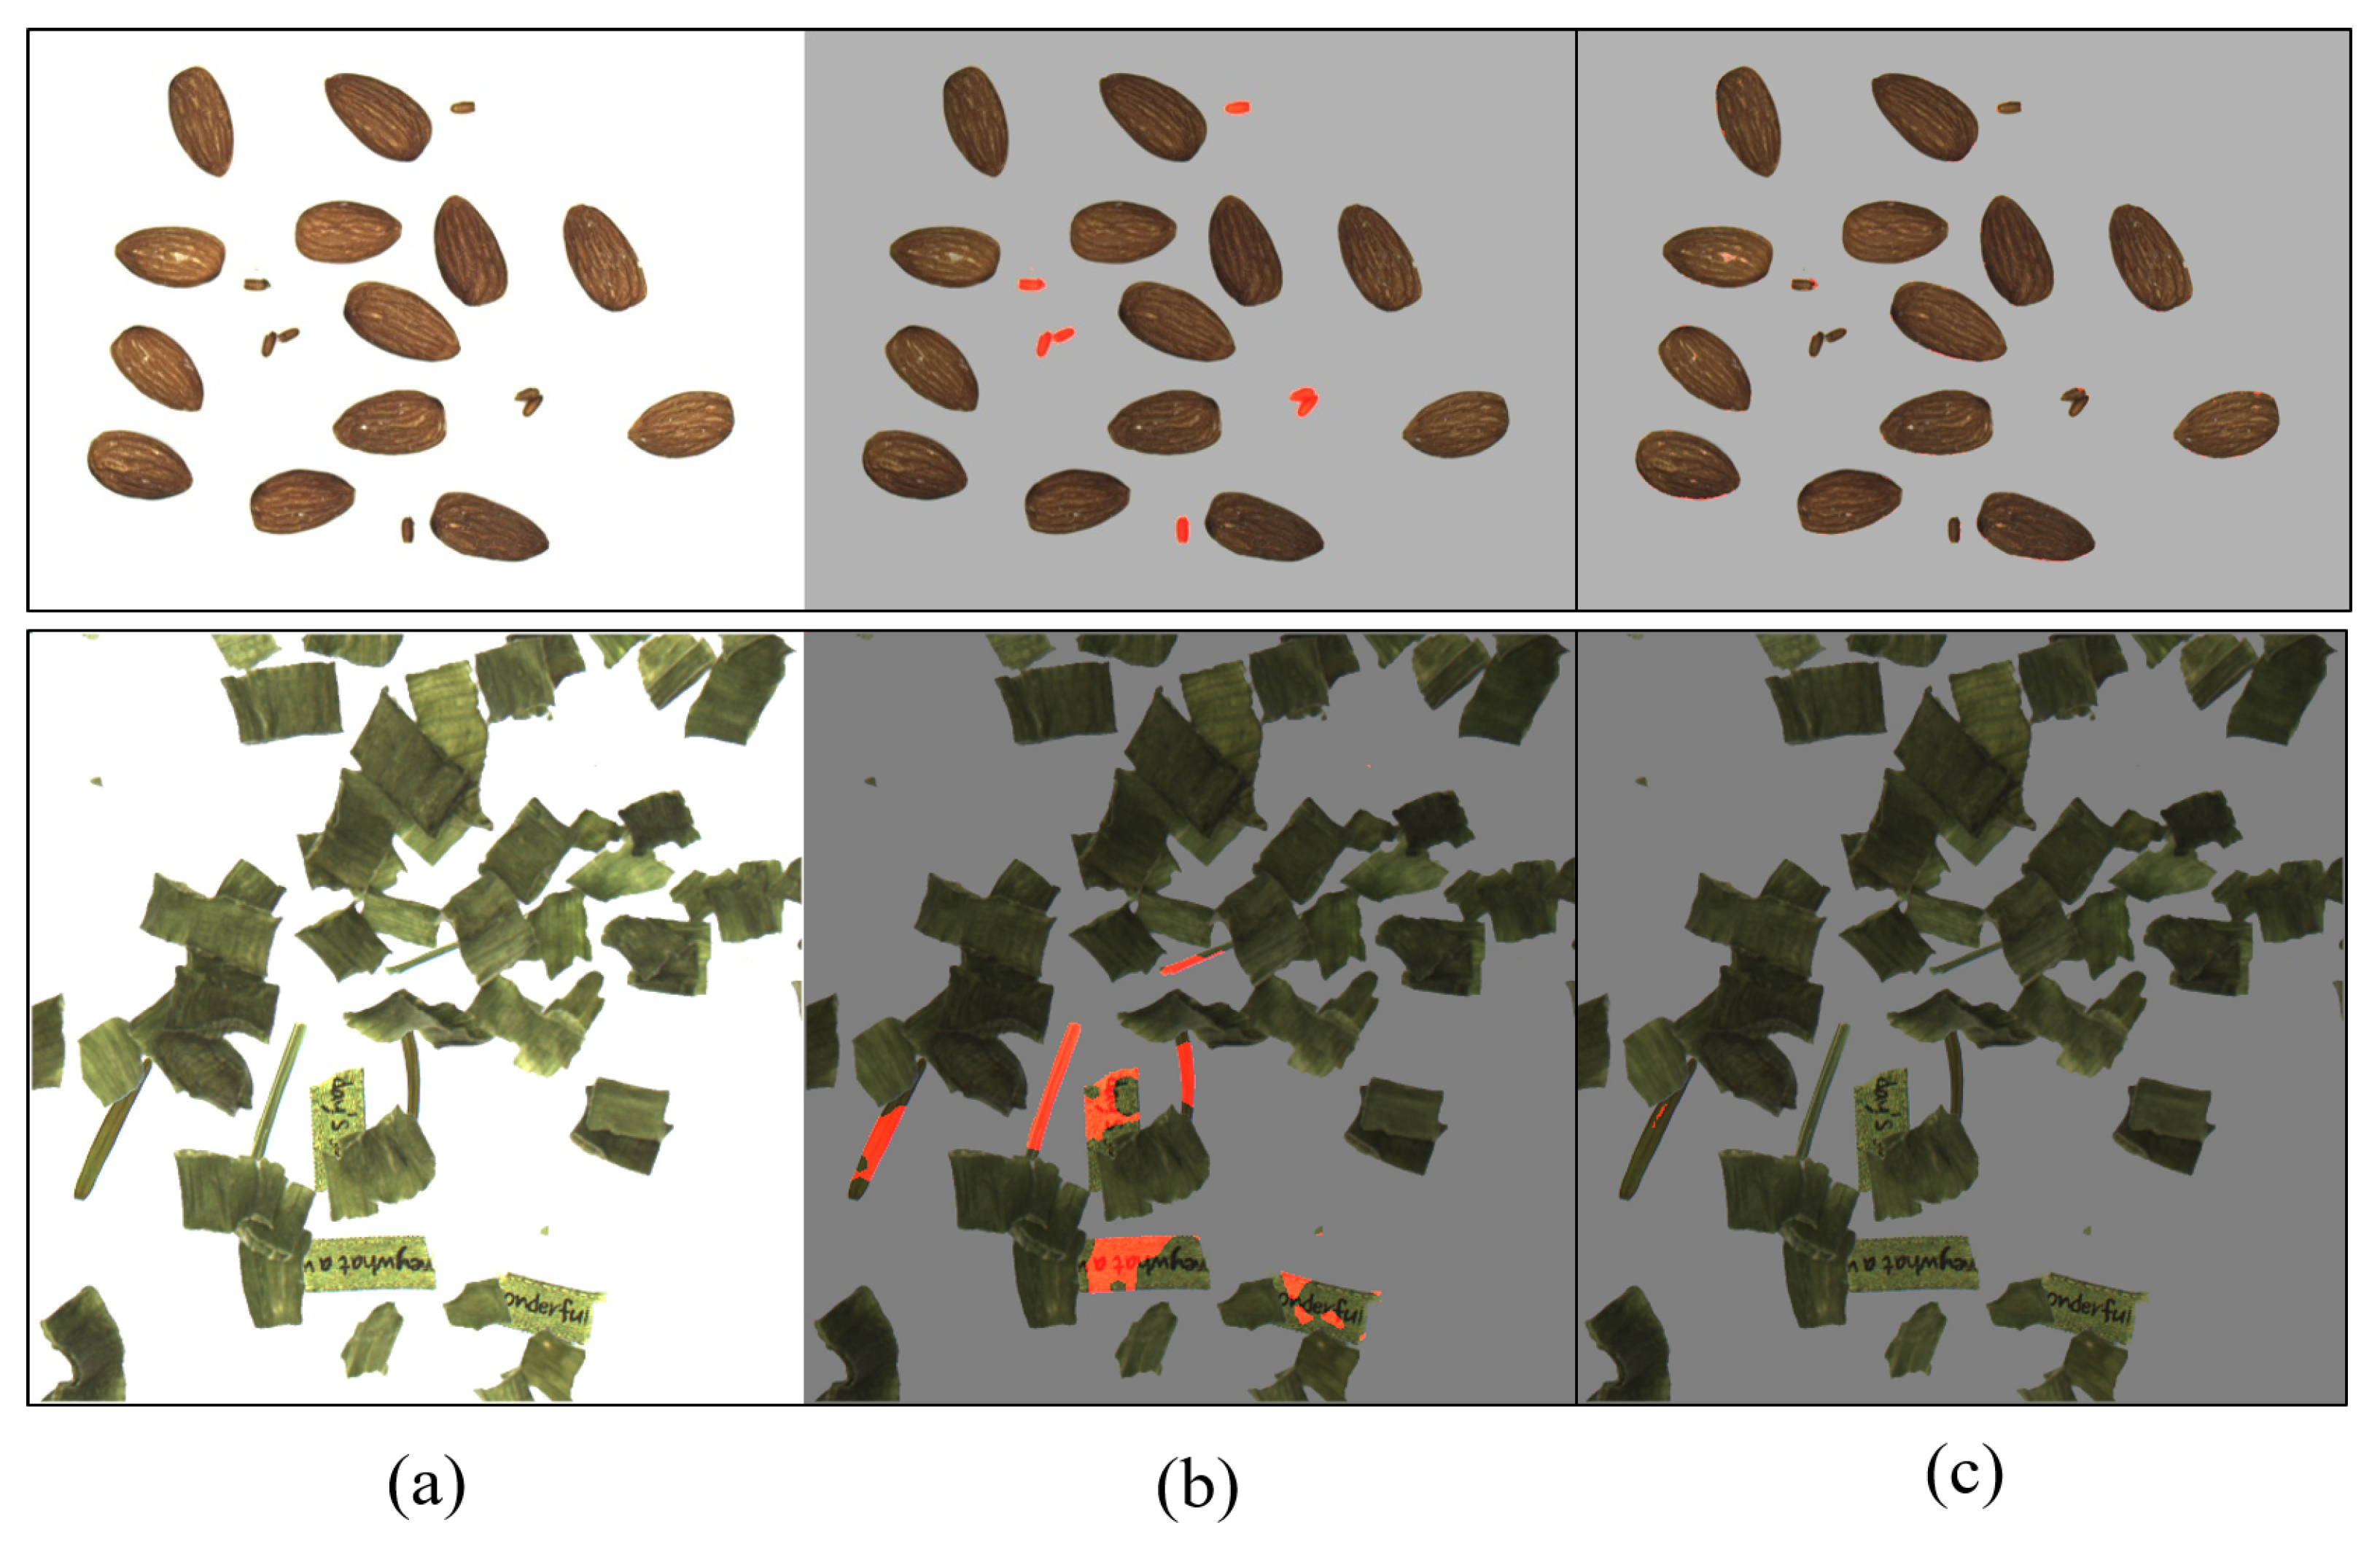
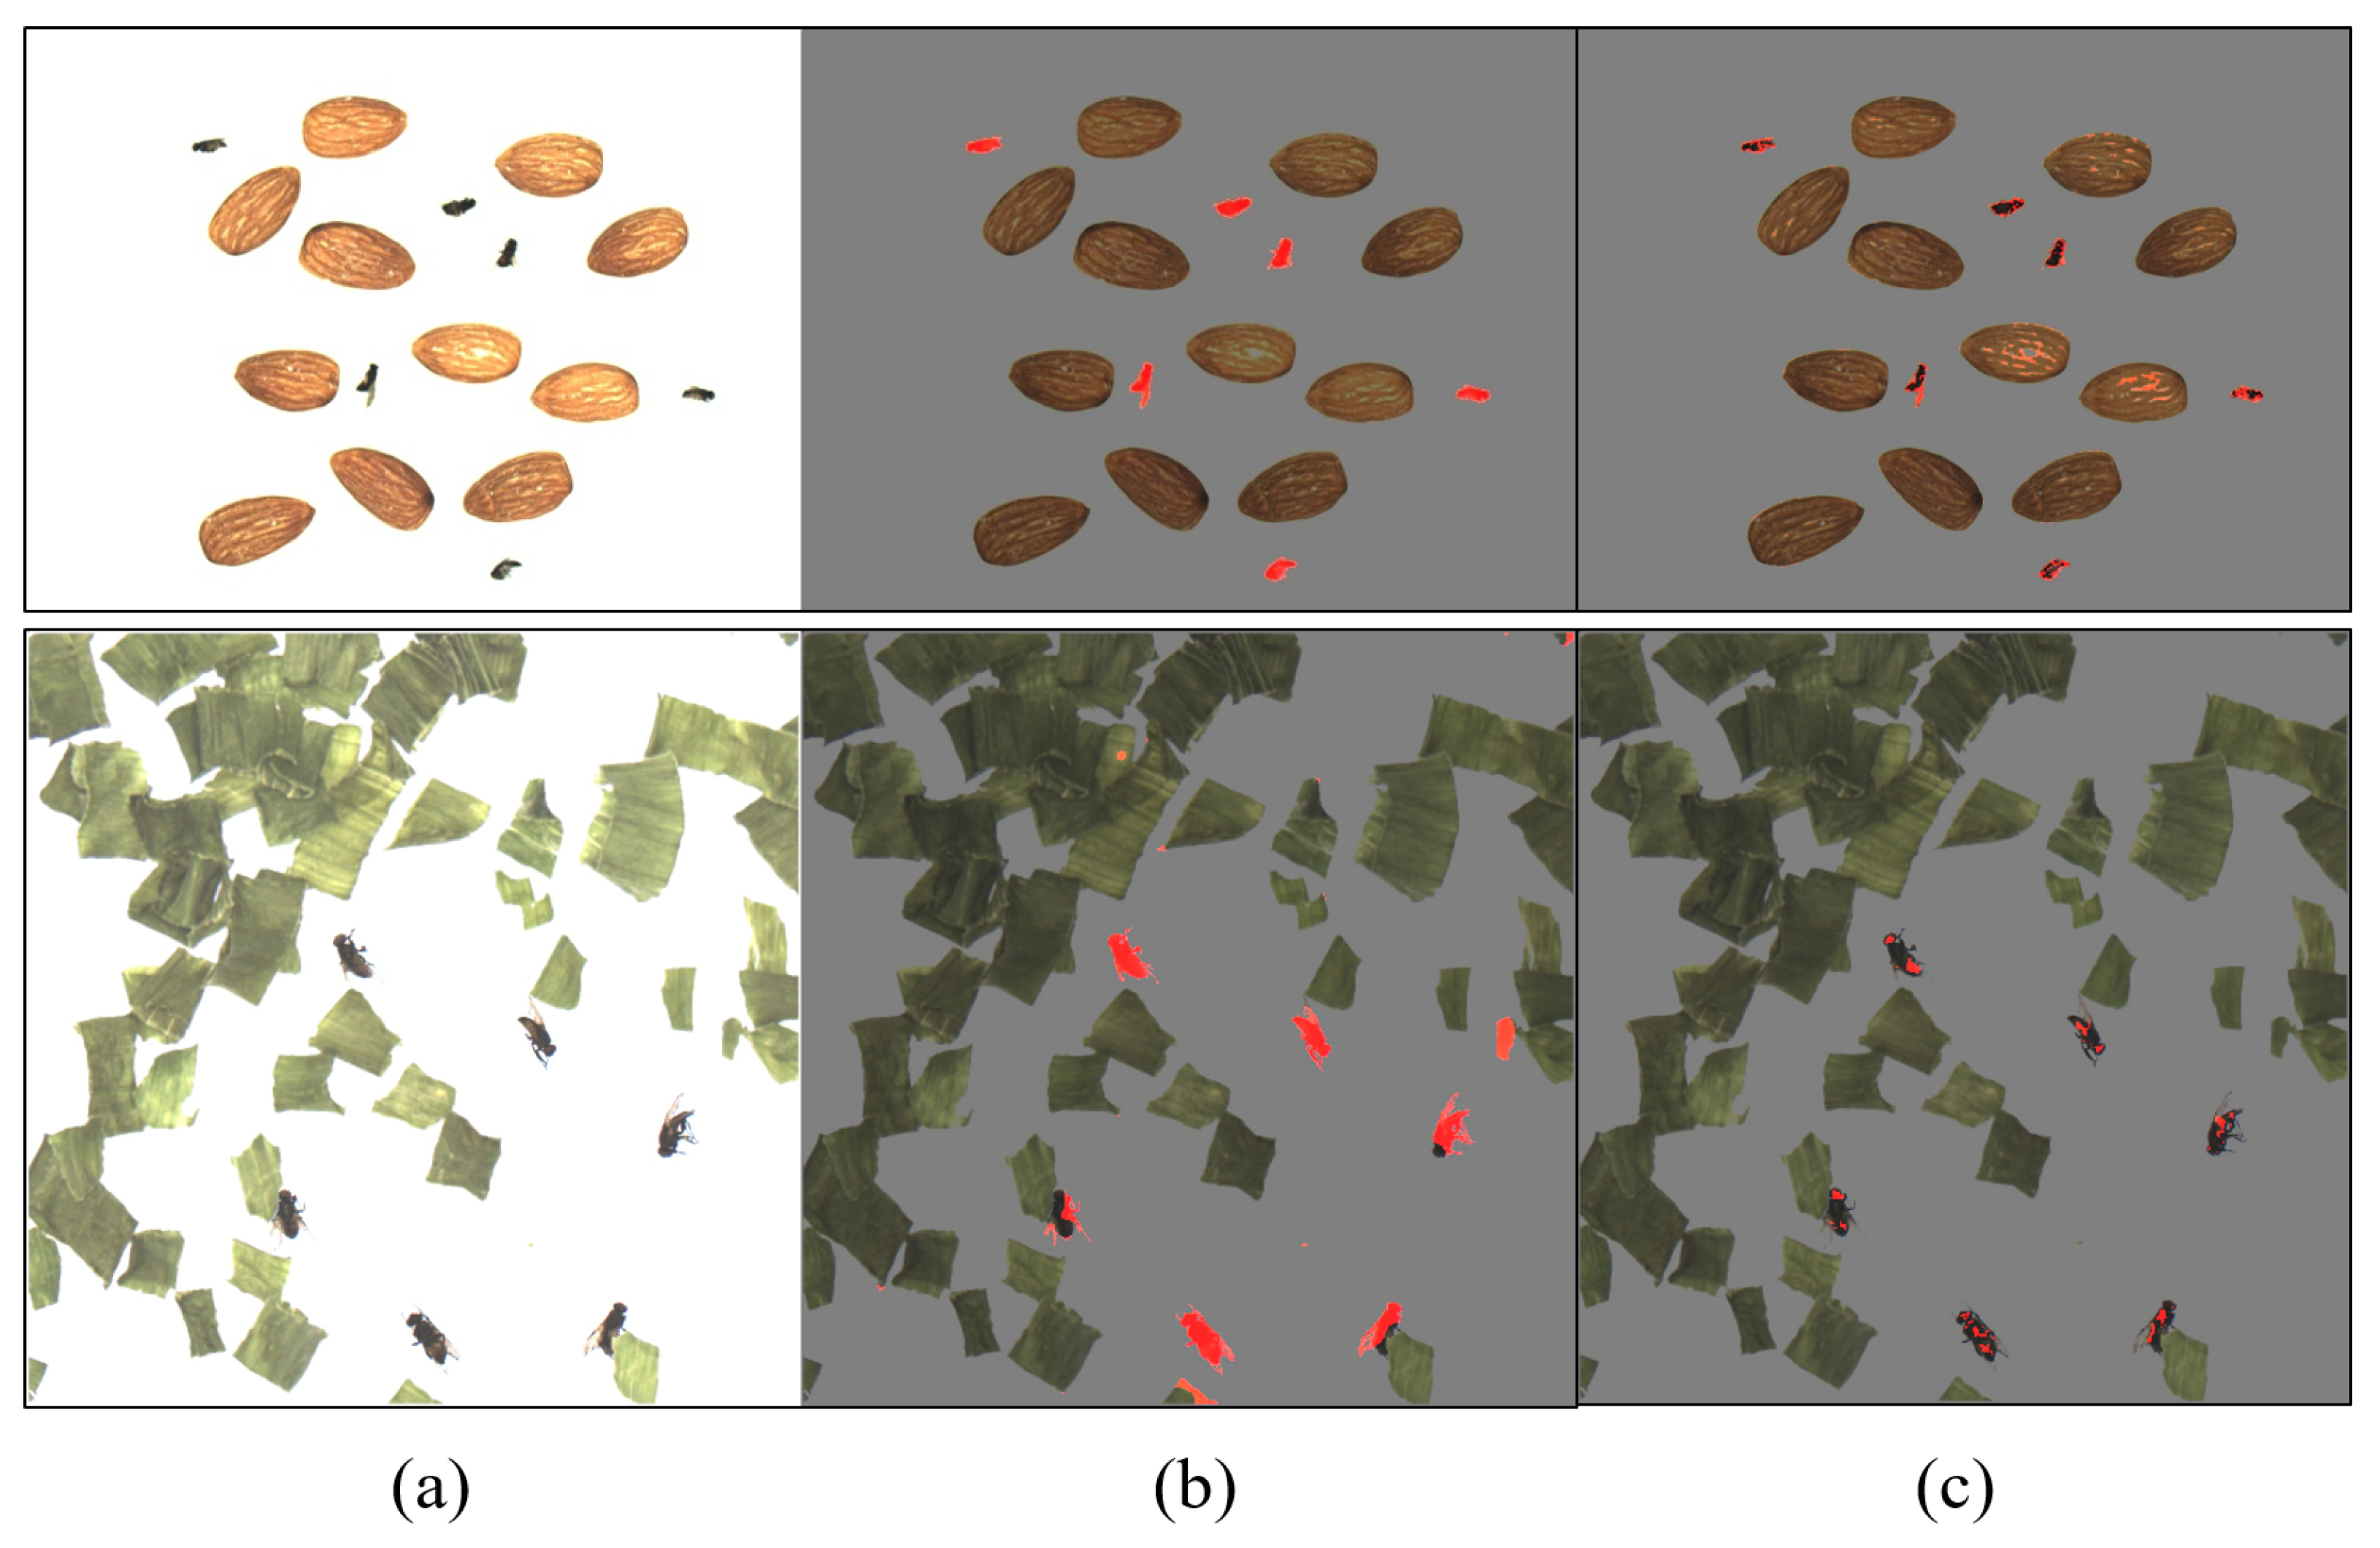
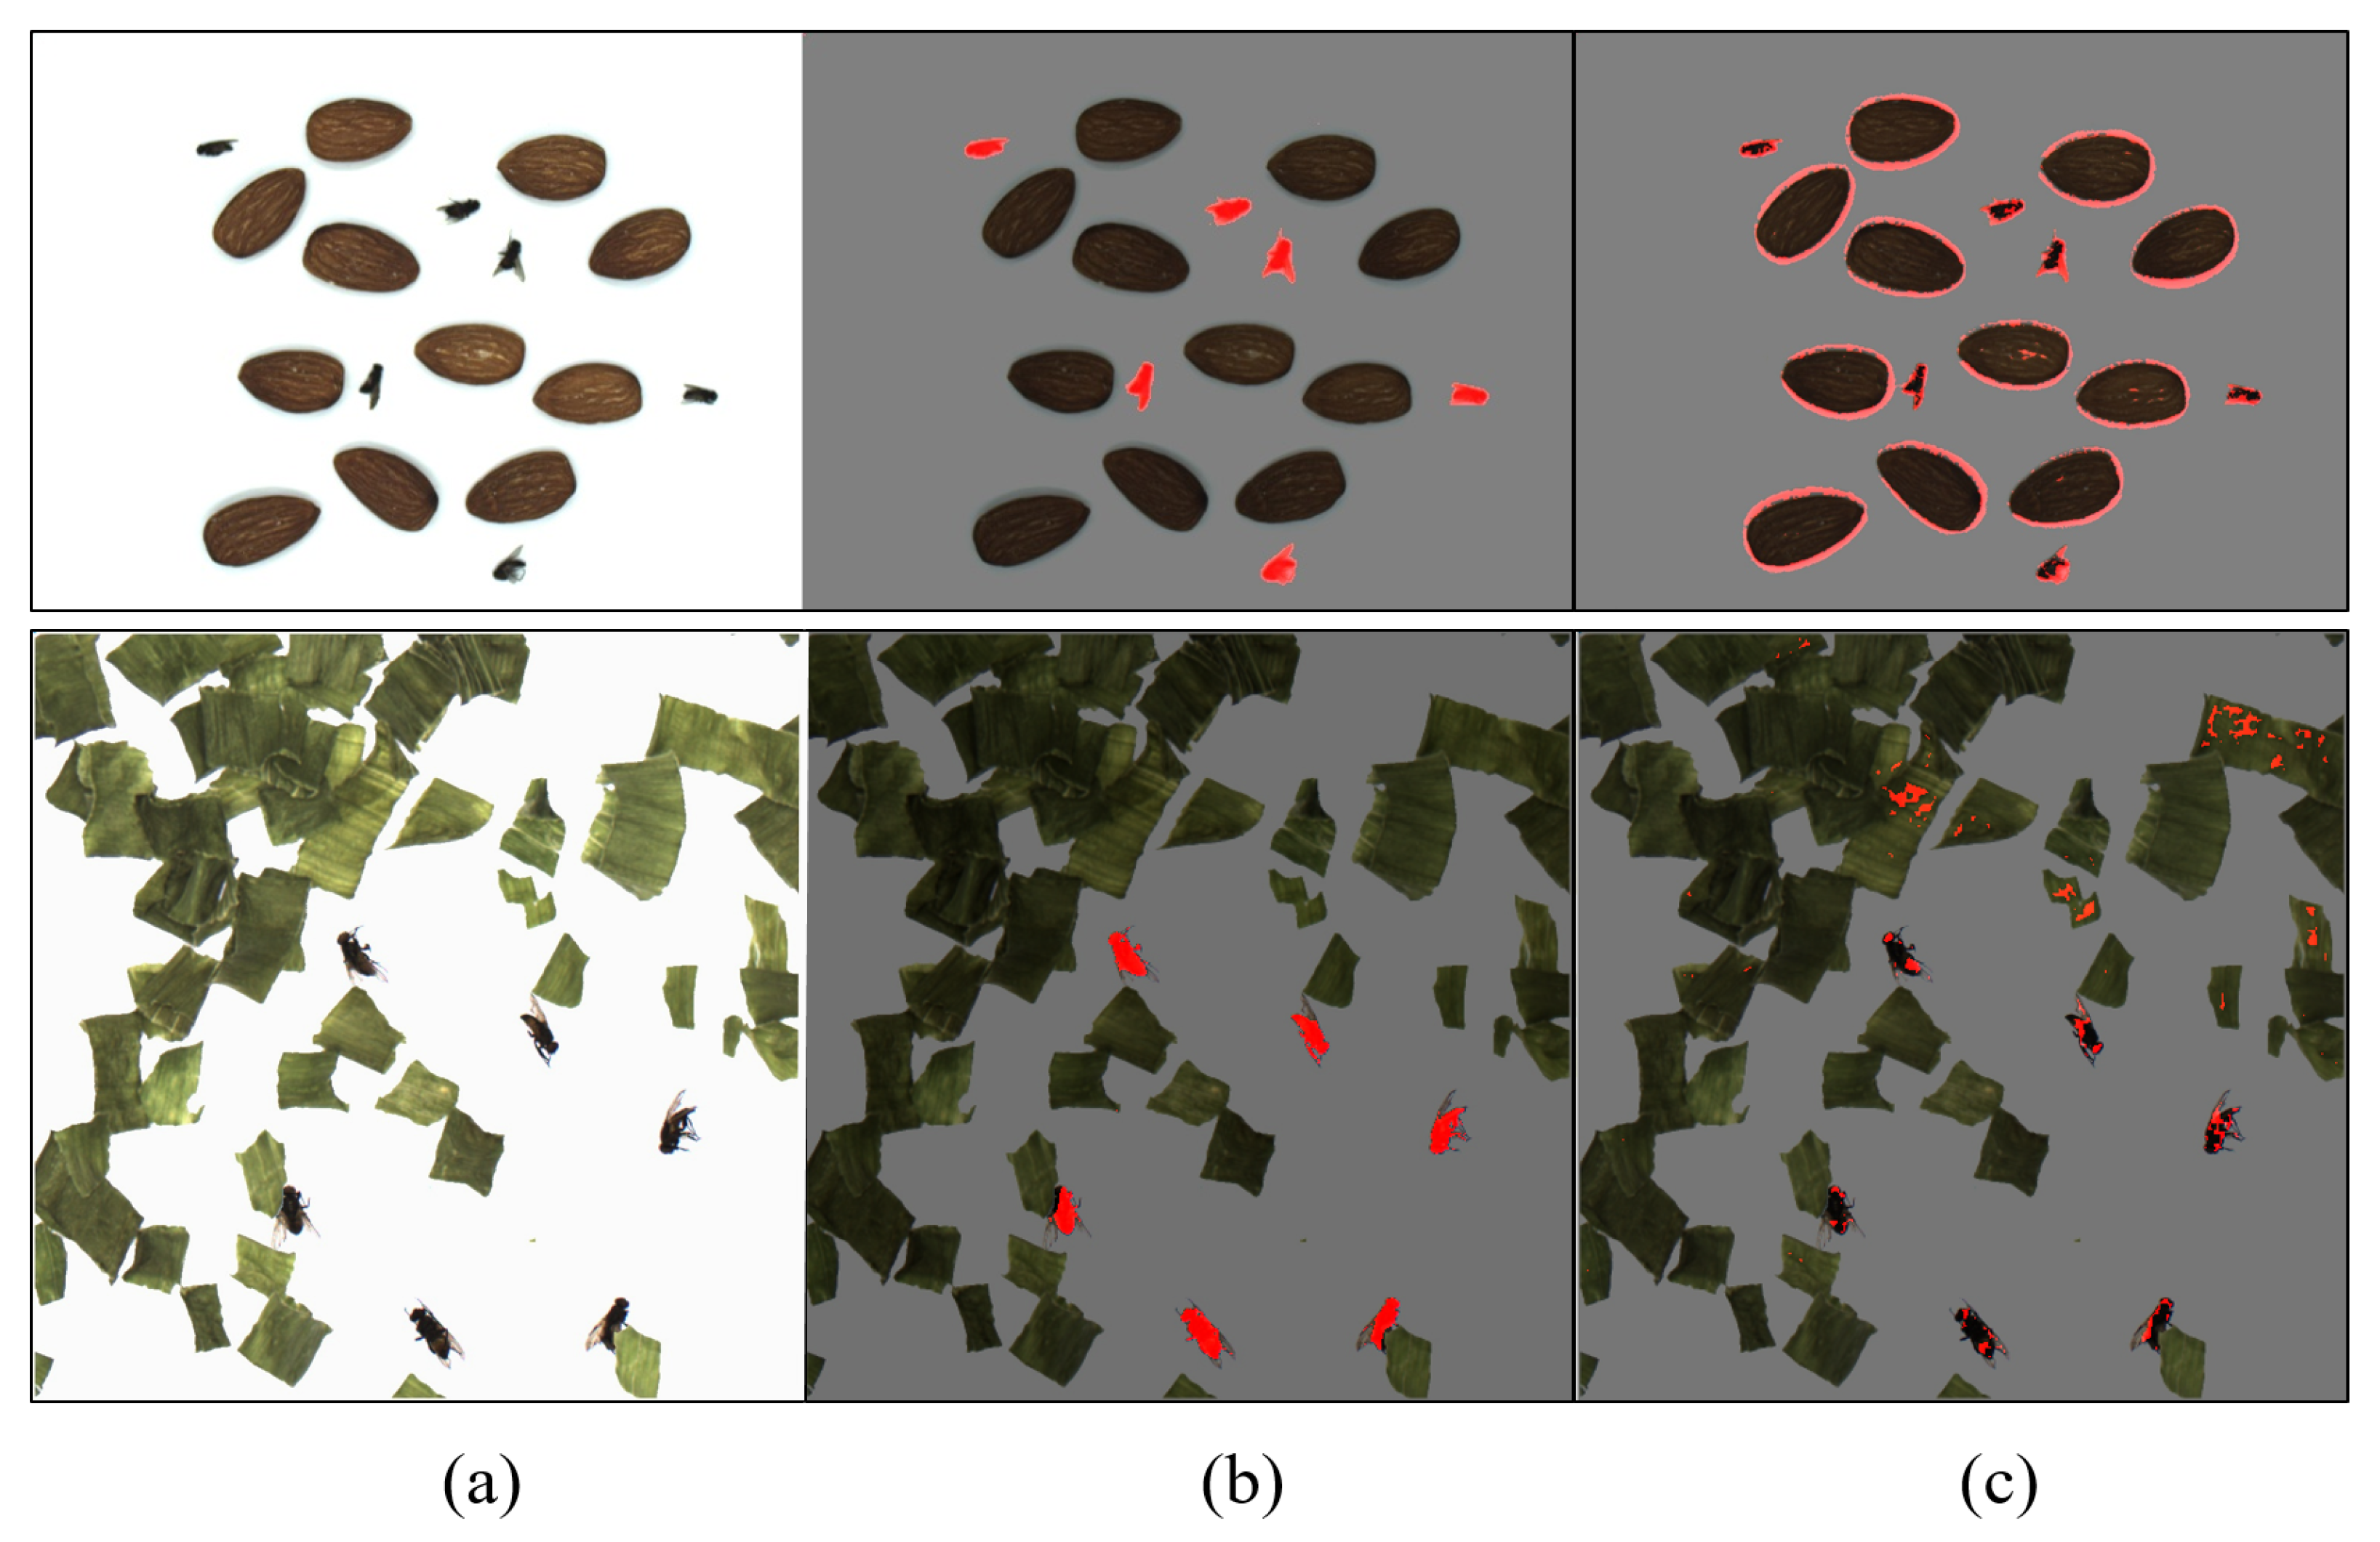
3.3. Foreign Object Detection Performance of Each Method

Table 3 shows the evaluation results of DLFOD trained using the proposed synthetic image and HBFOD. Figure 11 and Figure 12 show the foreign object detection of the model for the test image acquired at the same illuminance (360 lux) as the training dataset. In order to emphasize the foreign object detection performance in RMF, the foreign object regions from the image are marked in red. In Figure 11, (a) shows images of foreign objects of various colors (plastic) mixed with RMF at an illuminance intensity of 360 lux, (b) shows the foreign object detection result of DLFOD for foreign objects of various colors, and (c) shows the foreign object detection result of HBFOD for foreign objects of various colors. For both DLFOD and HBFOD, the foreign object detection result was reasonably good, and all regions of the foreign object were highlighted in red. In Figure 12, (a) shows images of foreign objects (fly eggs, plants, paper scraps) having a color similar to that of a food raw object mixed with RMF at an illuminance intensity of 360 lux, (b) shows the detection result of DLFOD, and (c) shows the foreign object detection result of HBFOD. The foreign object detection result of the DLFOD was reasonably good. On the other hand, HBFOD could not detect foreign objects similar to RMF.
To evaluate the performance of DLFOD and HBFOD according to changing illumination intensity, we conducted foreign object detection experiments in various illumination intensities, and Figure 13 and Figure 14 are examples of the experimental results. In order to emphasize the foreign object detection performance in RMF, the foreign object regions from the image are marked in red. In Figure 13, (a) shows images of foreign objects (fly) mixed with RMF at an illuminance intensity of 550 lux, (b) shows the detection result of DLFOD, and (c) shows the foreign object detection result of HBFOD. The foreign object detection result of the DLFOD was reasonably good. HBFOD could distinguish between RMF and foreign objects but only detected a part of the foreign objects. In Figure 14, (a) shows images of foreign objects (fly) mixed with RMF at an illuminance intensity of 175 lux, (b) shows the detection result of DLFOD, and (c) shows the foreign object detection result of HBFOD. DLFOD was reasonably good. HBFOD could distinguish between RMF and foreign objects but only detected a part of the foreign objects. Additionally, HBFOD had a problem of falsely detecting shadows or parts of RMF as foreign objects.

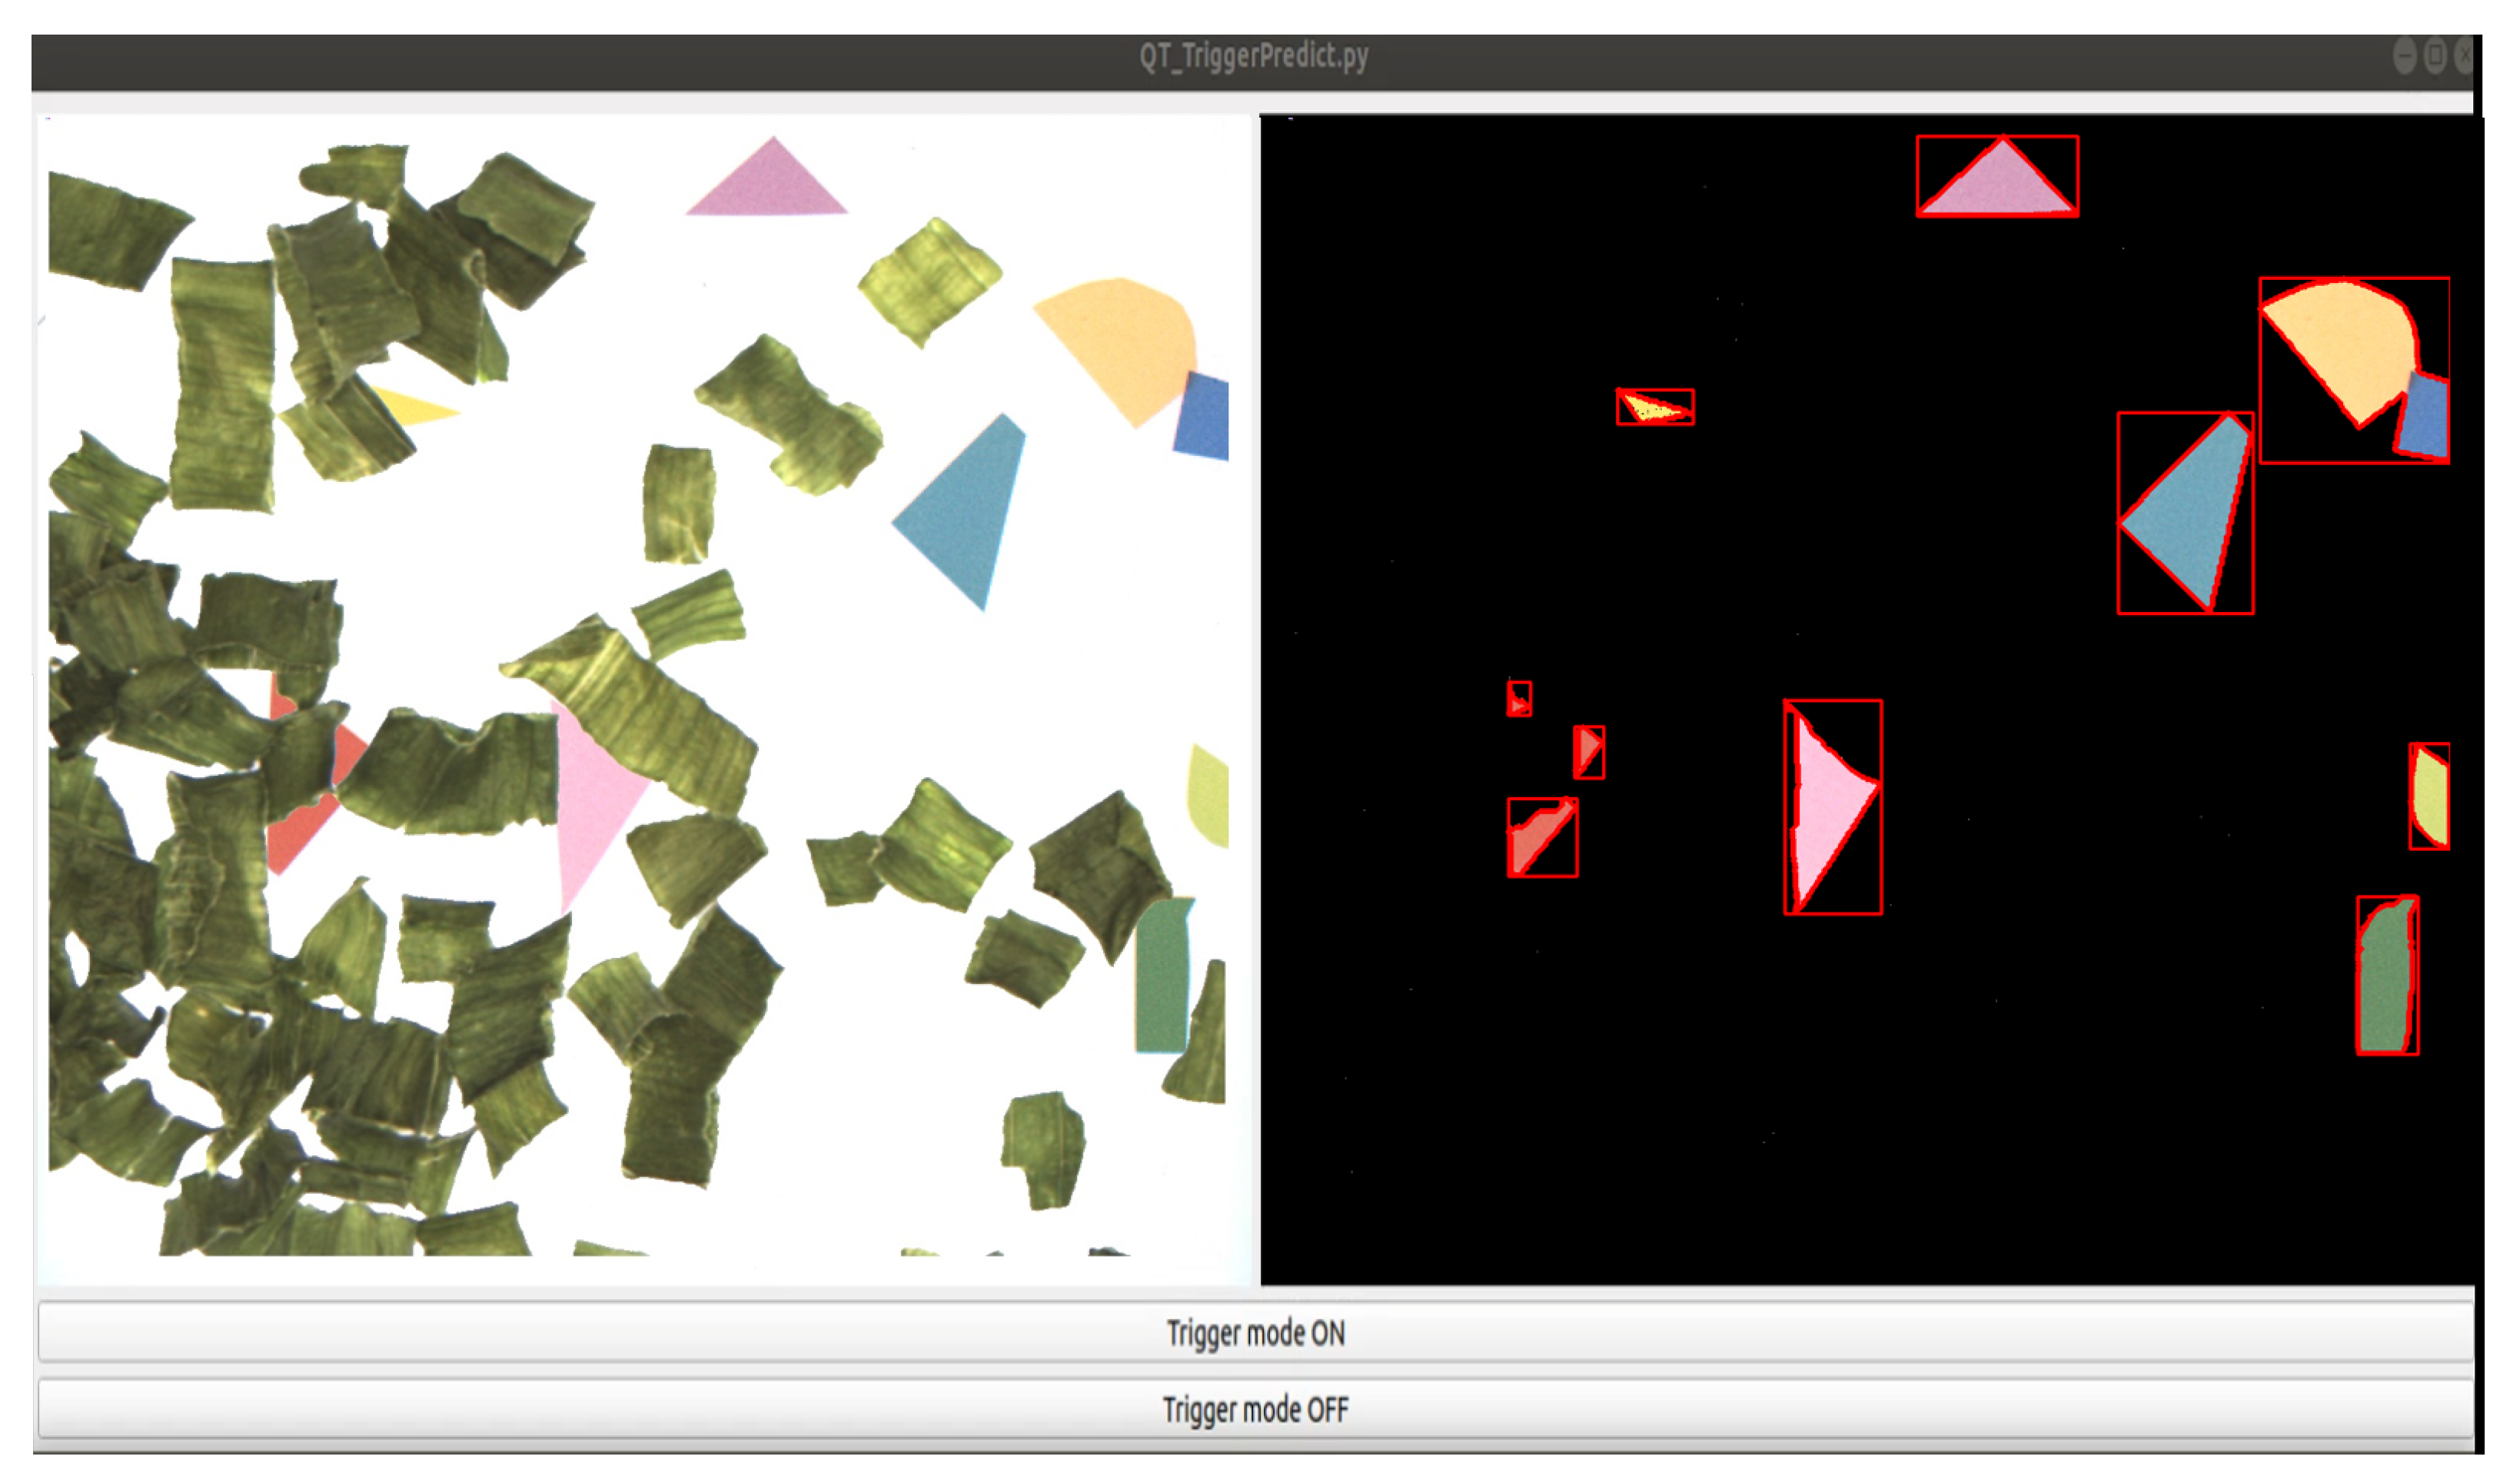
3.4. Foreign Object Detection Platform

Figure 15 shows the foreign object detection platform. The foreign object detection platform was implemented using the proposed method to verify its applicability in food inspection. It was implemented in the Ubuntu 18.04 environment and used the python language. The foreign object detection platform consists of a screen that outputs the image acquired by the camera and a screen that outputs only foreign objects. After classifying the pixels using the proposed method, on the screen that outputs only the foreign object, foreign objects were highlighted with red lines and bounding boxes to increase the visibility of the classified results.

4. Conclusions

We proposed a method to detect foreign objects regardless of the type of foreign objects, focusing on RMF and background detection. In particular, we proposed a method that effectively collects the training data required for RMF prediction using U-Net. From a practical standpoint, the effective image acquisition system afforded the possibility to collect training data that can detect RMF and foreign objects without manual annotation.
HBFOD extracted features from images of foreign objects and food based on color and experience. This method could not detect foreign objects with a color similar to RMF, and the performance was easily degraded by changes in illuminance. This paper used a foreign object detection method using DNN to solve the problem of the conventional method. As a result, DLFOD achieved higher performance than HBFOD in detecting foreign objects, although there was a difference in performance depending on the type of RMF such as almond and GOF. Additionally, the DNN which learned RMF using the proposed synthetic images was robust to changes in illuminance compared to HBFOD. However, our proposed method was not suitable for general object detection because there are limitations that objects should have similar viewpoints and scales, and the background should be monotonous, although it was a suitable method for food quality evaluation in which the background is monotonous, and the acquired image had the same viewpoint and scale using a camera installed at the same location. Nevertheless, it should be noted that the detection of foreign objects mixed with thin and overlapping RMF such as GOF still needs to be investigated. Future work will focus on DNN using multi-waveband imaging hardware. We are convinced that the method to improve the performance of foreign object detection is to acquire image datasets with more features of RMF by using multi-waveband imaging hardware.

Author Contributions

Conceptualization, G.-J.S., Y.-D.K. and H.-C.J.; methodology, G.-J.S. and H.-C.J.; software implementation, G.-J.S.; validation, G.-J.S. and D.-H.K.; formal analysis, G.-J.S.; data curation, D.-H.K. and M.-K.P.; writing—original draft preparation, G.-J.S.; writing—review and editing, Y.-D.K.; project administration, Y.-D.K. All authors have read and agreed to the published version of the manuscript.

Funding

This research was supported by a grant (No.19163MFDS521) from the Ministry of Food and Drug Safety of Korea, and this work was also supported by a DGIST research grant (No. 21-IT-02).

Institutional Review Board Statement

Not applicable.

Informed Consent Statement

Not applicable.

Data Availability Statement

Not applicable.

Conflicts of Interest

The authors declare no conflict of interest.

References

  1. Edwards, M.; Stringer, M. Observations on patterns in foreign material investigations. Food Control 2007, 18, 773–782. [Google Scholar] [CrossRef]
  2. Trafialek, J.; Kaczmarek, S.; Kolanowski, W. The Risk Analysis of Metallic Foreign Bodies in Food Products. J. Food Qual. 2016, 39, 398–407. [Google Scholar] [CrossRef]
  3. Djekic, I.; Jankovic, D.; Rajkovic, A. Analysis of foreign bodies present in European food using data from Rapid Alert System for Food and Feed (RASFF). Food Control 2017, 79, 143–149. [Google Scholar] [CrossRef]
  4. Yang, W.; Li, D.; Zhu, L.; Kang, Y.; Li, F. A new approach for image processing in foreign fiber detection. Comput. Electron. Agric. 2009, 68, 68–77. [Google Scholar] [CrossRef]
  5. Jagtap, S.; Bhatt, C.; Thik, J.; Rahimifard, S. Monitoring Potato Waste in Food Manufacturing Using Image Processing and Internet of Things Approach. Sustainability 2019, 11, 3173. [Google Scholar] [CrossRef] [Green Version]
  6. Lim, J.; Lee, A.; Kang, J.; Seo, Y.; Kim, B.; Kim, G.; Kim, S.M. Non-Destructive Detection of Bone Fragments Embedded in Meat Using Hyperspectral Reflectance Imaging Technique. Sensors 2020, 20, 4038. [Google Scholar] [CrossRef] [PubMed]
  7. Kwak, D.H.; Son, G.J.; Park, M.K.; Kim, Y.D. Rapid Foreign Object Detection System on Seaweed Using VNIR Hyperspectral Imaging. Sensors 2021, 21, 5279. [Google Scholar] [CrossRef] [PubMed]
  8. Mohd Khairi, M.T.; Ibrahim, S.; Md Yunus, M.A.; Faramarzi, M. Noninvasive techniques for detection of foreign bodies in food: A review. J. Food Process Eng. 2018, 41, e12808. [Google Scholar] [CrossRef]
  9. Janowski, A.; Kaźmierczak, R.; Kowalczyk, C.; Szulwic, J. Detecting Apples in the Wild: Potential for Harvest Quantity Estimation. Sustainability 2021, 13, 8054. [Google Scholar] [CrossRef]
  10. Samiei, S.; Rasti, P.; Richard, P.; Galopin, G.; Rousseau, D. Toward Joint Acquisition-Annotation of Images with Egocentric Devices for a Lower-Cost Machine Learning Application to Apple Detection. Sensors 2020, 20, 4173. [Google Scholar] [CrossRef]
  11. Zhang, H.; Fritts, J.E.; Goldman, S.A. Image segmentation evaluation: A survey of unsupervised methods. Comput. Vis. Image Underst. 2008, 110, 260–280. [Google Scholar] [CrossRef] [Green Version]
  12. Zhang, H.; Li, D. Applications of computer vision techniques to cotton foreign matter inspection: A review. Comput. Electron. Agric. 2014, 109, 59–70. [Google Scholar] [CrossRef]
  13. Inamdar, A.; Suresh, D.S. Application of color sorter in wheat milling. Int. Food Res. J. 2014, 21, 2083. [Google Scholar]
  14. Lorente, D.; Aleixos, N.; Gómez-Sanchis, J.; Cubero, S.; García-Navarrete, O.L.; Blasco, J. Recent advances and applications of hyperspectral imaging for fruit and vegetable quality assessment. Food Bioprocess Technol. 2012, 5, 1121–1142. [Google Scholar] [CrossRef]
  15. Lo, Y.C.; Chang, C.C.; Chiu, H.C.; Huang, Y.H.; Chen, C.P.; Chang, Y.L.; Jou, K. CLCC: Contrastive Learning for Color Constancy. In Proceedings of the IEEE/CVF Conference on Computer Vision and Pattern Recognition, Nashville, TN, USA, 19–25 June 2021; pp. 8053–8063. [Google Scholar]
  16. Krizhevsky, A.; Sutskever, I.; Hinton, G.E. ImageNet Classification with Deep Convolutional Neural Networks. Commun. ACM 2017, 60, 84–90. [Google Scholar] [CrossRef]
  17. Rong, D.; Xie, L.; Ying, Y. Computer vision detection of foreign objects in walnuts using deep learning. Comput. Electron. Agric. 2019, 162, 1001–1010. [Google Scholar] [CrossRef]
  18. Shen, Y.; Zhou, H.; Li, J.; Jian, F.; Jayas, D.S. Detection of stored-grain insects using deep learning. Comput. Electron. Agric. 2018, 145, 319–325. [Google Scholar] [CrossRef]
  19. Dai, Z.; Liu, H.; Le, Q.V.; Tan, M. CoAtNet: Marrying Convolution and Attention for All Data Sizes. arXiv 2021, arXiv:2106.04803. [Google Scholar]
  20. Zhai, X.; Kolesnikov, A.; Houlsby, N.; Beyer, L. Scaling vision transformers. arXiv 2021, arXiv:2106.04560. [Google Scholar]
  21. Liu, Z.; Hu, H.; Lin, Y.; Yao, Z.; Xie, Z.; Wei, Y.; Ning, J.; Cao, Y.; Zhang, Z.; Dong, L.; et al. Swin Transformer V2: Scaling Up Capacity and Resolution. arXiv 2021, arXiv:2111.09883. [Google Scholar]
  22. Dai, X.; Chen, Y.; Xiao, B.; Chen, D.; Liu, M.; Yuan, L.; Zhang, L. Dynamic Head: Unifying Object Detection Heads with Attentions. In Proceedings of the IEEE/CVF Conference on Computer Vision and Pattern Recognition, Nashville, TN, USA, 19–25 June 2021; pp. 7369–7378. [Google Scholar]
  23. Yuan, Y.; Chen, X.; Chen, X.; Wang, J. Segmentation transformer: Object-contextual representations for semantic segmentation. In Proceedings of the European Conference on Computer Vision (ECCV), Montreal, QC, Canada, 11–17 October 2021; Volume 1. [Google Scholar]
  24. Mohan, R.; Valada, A. Efficientps: Efficient panoptic segmentation. Int. J. Comput. Vis. 2021, 129, 1551–1579. [Google Scholar] [CrossRef]
  25. Kamilaris, A.; Prenafeta-Boldú, F.X. Deep learning in agriculture: A survey. Comput. Electron. Agric. 2018, 147, 70–90. [Google Scholar] [CrossRef] [Green Version]
  26. Wada, K. Labelme: Image Polygonal Annotation with Python. 2016. Available online: https://github.com/wkentaro/labelme (accessed on 2 November 2021).
  27. Kushwaha, A.; Gupta, S.; Bhanushali, A.; Dastidar, T.R. Rapid Training Data Creation by Synthesizing Medical Images for Classification and Localization. In Proceedings of the 2020 IEEE/CVF Conference on Computer Vision and Pattern Recognition Workshops (CVPRW), Seattle, WA, USA, 14–19 June 2020; pp. 4272–4279. [Google Scholar] [CrossRef]
  28. Ronneberger, O.; Fischer, P.; Brox, T. U-Net: Convolutional Networks for Biomedical Image Segmentation. In Medical Image Computing and Computer-Assisted Intervention—MICCAI 2015; Navab, N., Hornegger, J., Wells, W.M., Frangi, A.F., Eds.; International Publishing: Cham, Switzerland, 2015; pp. 234–241. [Google Scholar]
  29. Zhou, T.; Ruan, S.; Canu, S. A review: Deep learning for medical image segmentation using multi-modality fusion. Array 2019, 3, 100004. [Google Scholar] [CrossRef]
  30. Roy, K.; Chaudhuri, S.S.; Pramanik, S. Deep learning based real-time Industrial framework for rotten and fresh fruit detection using semantic segmentation. Microsyst. Technol. 2021, 27, 3365–3375. [Google Scholar] [CrossRef]
  31. Chang, S.; Lee, U.; Hong, M.J.; Jo, Y.D.; Kim, J.B. Lettuce Growth Pattern Analysis Using U-Net Pre-Trained with Arabidopsis. Agriculture 2021, 11, 890. [Google Scholar] [CrossRef]
  32. Trebing, K.; Staǹczyk, T.; Mehrkanoon, S. SmaAt-UNet: Precipitation nowcasting using a small attention-UNet architecture. Pattern Recognit. Lett. 2021, 145, 178–186. [Google Scholar] [CrossRef]
  33. Zhao, X.; Yuan, Y.; Song, M.; Ding, Y.; Lin, F.; Liang, D.; Zhang, D. Use of Unmanned Aerial Vehicle Imagery and Deep Learning UNet to Extract Rice Lodging. Sensors 2019, 19, 3859. [Google Scholar] [CrossRef] [Green Version]
  34. Karsch, K.; Hedau, V.; Forsyth, D.; Hoiem, D. Rendering Synthetic Objects into Legacy Photographs. ACM Trans. Graph. 2011, 30, 1–12. [Google Scholar] [CrossRef]
  35. Movshovitz-Attias, Y.; Kanade, T.; Sheikh, Y. How Useful Is Photo-Realistic Rendering for Visual Learning? In Proceedings of the European Conference on Computer Vision (ECCV), Amsterdam, The Netherlands, 11–14 October 2016; pp. 202–217. [Google Scholar]
  36. Dwibedi, D.; Misra, I.; Hebert, M. Cut, Paste and Learn: Surprisingly Easy Synthesis for Instance Detection. In Proceedings of the 2017 IEEE International Conference on Computer Vision (ICCV), Venice, Italy, 22–29 October 2017; pp. 1310–1319. [Google Scholar]
  37. Otsu, N. A threshold selection method from gray-level histograms. IEEE Trans. Syst. Man. Cybern. 1979, 9, 62–66. [Google Scholar] [CrossRef] [Green Version]
  38. Bortnowski, P.; Gładysiewicz, L.; Król, R.; Ozdoba, M. Models of Transverse Vibration in Conveyor Belt—Investigation and Analysis. Energies 2021, 14, 4153. [Google Scholar] [CrossRef]
  39. Sezgin, M.; Sankur, B. Survey over image thresholding techniques and quantitative performance evaluation. J. Electron. Imaging 2004, 13, 146–165. [Google Scholar]
  40. Deng, J.; Dong, W.; Socher, R.; Li, L.J.; Li, K.; Li, F.F. ImageNet: A large-scale hierarchical image database. In Proceedings of the 2009 IEEE Conference on Computer Vision and Pattern Recognition, Miami, FL, USA, 20–25 June 2009; pp. 248–255. [Google Scholar] [CrossRef] [Green Version]
  41. Bossard, L.; Guillaumin, M.; Van Gool, L. Food-101—Mining Discriminative Components with Random Forests. In Proceedings of the European Conference on Computer Vision, Zurich, Switzerland, 6–12 September 2014; Springer: Cham, Switzerland, 2014; pp. 446–461. [Google Scholar]
  42. Krizhevsky, A.; Hinton, G. Learning Multiple Layers of Features from Tiny Images; Technical Report; University of Toronto: Toronto, ON, Canada, 2009. [Google Scholar]
  43. Lin, T.Y.; Maire, M.; Belongie, S.; Hays, J.; Perona, P.; Ramanan, D.; Dollár, P.; Zitnick, C.L. Microsoft COCO: Common Objects in Context. In Computer Vision—ECCV 2014; Fleet, D., Pajdla, T., Schiele, B., Tuytelaars, T., Eds.; International Publishing: Cham, Switzerland, 2014; pp. 740–755. [Google Scholar]
  44. Yu, F.; Seff, A.; Zhang, Y.; Song, S.; Funkhouser, T.; Xiao, J. LSUN: Construction of a Large-Scale Image Dataset using Deep Learning with Humans in the Loop. arXiv 2015, arXiv:1506.03365. [Google Scholar]
  45. Kuznetsova, A.; Rom, H.; Alldrin, N.; Uijlings, J.; Krasin, I.; Pont-Tuset, J.; Kamali, S.; Popov, S.; Malloci, M.; Kolesnikov, A.; et al. The Open Images Dataset V4: Unified image classification, object detection, and visual relationship detection at scale. Int. J. Comput. Vis. 2020, 128, 1956–1981. [Google Scholar] [CrossRef] [Green Version]
  46. Scherer, D.; Müller, A.; Behnke, S. Evaluation of Pooling Operations in Convolutional Architectures for Object Recognition. In Artificial Neural Networks—ICANN 2010; Diamantaras, K., Duch, W., Iliadis, L.S., Eds.; Springer: Berlin/Heidelberg, Germany, 2010; pp. 92–101. [Google Scholar]
  47. Zeiler, M.D.; Fergus, R. Visualizing and understanding convolutional networks. In Proceedings of the European Conference on Computer Vision, Zurich, Switzerland, 6–12 September 2014; pp. 818–833. [Google Scholar]
  48. Kwon, J.S.; Lee, J.M.; Kim, W.Y. Real-time detection of foreign objects using X-ray imaging for dry food manufacturing line. In Proceedings of the 2008 IEEE International Symposium on Consumer Electronics, Vilamoura, Portugal, 14–16 April 2008; pp. 1–4. [Google Scholar] [CrossRef]
  49. Nan, W.Q.H.M.S. Color Sorting Algorithm Based on Color Linear CCD. Trans. Chin. Soc. Agric. Mach. 2008, 10, 105–108. [Google Scholar]
  50. Chen, P.; Gao, M.; Huang, J.; Yang, Y.; Zeng, Y. High-Speed Color Sorting Algorithm Based on FPGA Implementation. In Proceedings of the 2018 IEEE 27th International Symposium on Industrial Electronics (ISIE), Cairns, Australia, 13–15 June 2018; pp. 235–239. [Google Scholar] [CrossRef]
  51. Swain, M.J.; Ballard, D.H. Indexing via color histograms. In Active Perception and Robot Vision; Springer: Berlin/Heidelberg, Germany, 1992; pp. 261–273. [Google Scholar]
  52. Wirth, M.; Zaremba, R. Flame Region Detection Based on Histogram Backprojection. In Proceedings of the 2010 Canadian Conference on Computer and Robot Vision, 31 May–2 June 2010; pp. 167–174. [Google Scholar] [CrossRef]
  53. Dice, L.R. Measures of the Amount of Ecologic Association Between Species. Ecology 1945, 26, 297–302. [Google Scholar] [CrossRef]
  54. Singh, A.; Sha, J.; Narayan, K.S.; Achim, T.; Abbeel, P. Bigbird: A large-scale 3d database of object instances. In Proceedings of the 2014 IEEE International Conference on Robotics and Automation (ICRA), Hong Kong, China, 31 May–7 June 2014; pp. 509–516. [Google Scholar]
  55. The Food-101 Data Set. Available online: https://data.vision.ee.ethz.ch/cvl/datasets_extra/food-101/ (accessed on 2 November 2021).
  56. Le, Q.V. Building high-level features using large scale unsupervised learning. In Proceedings of the 2013 IEEE international Conference on Acoustics, Speech and Signal Processing, Vancouver, BC, Canada, 26–31 May 2013; pp. 8595–8598. [Google Scholar]
Figure 1. Methods for foreign object detection. (a) Manual foreign object detection in food inspection of GOF. (b) Assistant with manual foreign object detection using computer vision technology. (c) Foreign object detection in moving almonds using computer vision technology. (d) Collected samples of foreign objects.
Sustainability 13 13834 g001
Figure 2. Manual annotation. (a) Annotation tool for manual annotation. (b) Annotation result obtained using the manual annotation tool.
Sustainability 13 13834 g002
Figure 3. The color image acquisition system equipped with: (a) an image acquisition unit, (b) a light source, (c) a backlight, (d) a sample transfer unit, and (e) a computer.
Sustainability 13 13834 g003
Figure 4. Diagram of foreign object detection method.
Sustainability 13 13834 g004
Figure 5. Two different illumination modes. (a) Reflectance mode. (b) Combination mode of reflective and transmittance modes.
Sustainability 13 13834 g005
Figure 6. Diagram of generating synthetic images.
Sustainability 13 13834 g006
Figure 7. U-net architecture.
Sustainability 13 13834 g007
Figure 8. Images and binarization results acquired from image acquisition systems. (a) Image and (b) binarization result based on the threshold intensity (Otsu algorithm) from image acquisition systems equipped with illumination in reflectance mode. (c) Image and (d) binarization result based on the threshold intensity (Otsu algorithm) from image acquisition systems equipped with combined illuminations with reflective and transmittance modes.
Sustainability 13 13834 g008
Figure 9. The synthesis image of RMF combined with the Food101 dataset [55]. (a) RMF image acquired from effective image acquisition systems. (b) The binarization results based on the threshold intensity (Otsu algorithm) from effective image acquisition systems. (c) Synthetic images acquired from the proposed synthetic method.
Sustainability 13 13834 g009
Figure 10. Example of false detection of a model trained on synthetic images. (a) GOF image mixed with foreign object with similar color and shape to GOF. (b) Result of detecting foreign objects similar to GOF as food raw objects. (c) GOF image of various shapes mixed with foreign objects. (d) Result of detecting GOF with an unspecified shape as foreign objects.
Sustainability 13 13834 g010
Figure 11. Comparison of foreign object detection results between DLFOD and HBFOD. (a) The sample images of RMF mixed with foreign objects (plastic scraps). (b) The foreign object detection results of DLFOD. (c) The foreign object detection results of HBFOD.
Sustainability 13 13834 g011
Figure 12. Comparison of foreign object detection results of similar color to RMF between DLFOD and HBFOD. (a) The sample images of RMF mixed with foreign objects (insects, plants, paper scraps). (b) The foreign object detection results of DLFOD. (c) The foreign object detection results of HBFOD.
Sustainability 13 13834 g012
Figure 13. Comparison of foreign object detection results between DLFOD and HBFOD in an environment with high illumination intensity. (a) The sample images of RMF mixed with foreign objects (insects). (b) The foreign object detection results of DLFOD. (c) The foreign object detection results of HBFOD.
Sustainability 13 13834 g013
Figure 14. Comparison of foreign object detection results between DLFOD and HBFOD in an environment with low illumination intensity. (a) The sample images of RMF mixed with foreign objects (insects). (b) The foreign object detection results of DLFOD. (c) The foreign object detection results of HBFOD.
Sustainability 13 13834 g014
Figure 15. Foreign object detection platform.
Sustainability 13 13834 g015
Table 1. Number of samples and objects used for training and testing.
FoodTypesSamples for Training DatasetSamples for Test Dataset
AlmondRMF1470883
Insects178107
Wood debris184106
Plants17998
Paper scraps181101
Metal part177100
Plastic scraps188108
GOFRMF21741204
Insects178103
Wood debris184105
Plants179103
Paper scraps181102
Metal part177100
Plastic scraps188107
Table 2. Evaluation results for each dataset.
FoodTest DatasetTraining DatasetInsectsWood
Debris
PlantsPaper
Scraps
Metal
Parts
Plastic
Scraps
Mean
Almond1Real Images0.840.850.840.870.810.830.84
Synthetic Images0.830.840.830.850.790.820.82
Synthetic Images + Real Images0.850.850.850.890.800.850.84
2Real Images0.780.790.810.820.720.810.78
Synthetic Images0.820.810.820.830.740.820.80
Synthetic Images + Real Images0.830.820.810.840.740.820.81
3Real Images0.770.730.730.810.720.720.74
Synthetic Images0.780.810.830.840.790.810.81
Synthetic Images + Real Images0.790.790.810.850.810.820.81
GOF1Real Images0.810.860.750.820.780.810.80
Synthetic Images0.730.780.540.700.730.770.70
Synthetic Images + Real Images0.830.850.760.830.800.820.81
2Real Images0.770.810.620.750.700.770.73
Synthetic Images0.720.770.520.680.710.740.69
Synthetic Images + Real Images0.780.820.590.760.710.760.73
3Real Images0.750.810.630.710.710.740.72
Synthetic Images0.730.780.510.690.740.730.69
Synthetic Images + Real Images0.760.810.580.700.740.760.72
Table 3. Evaluation results for the prediction of foreign object detection for each method.
FoodTest DatasetMethodInsectsWood DebrisPlantsPaper ScrapsMetal PartsPlastic ScrapsMean
Almond1DLFOD0.830.840.830.850.790.820.82
HBFOD0.270.710.790.760.730.780.67
2DLFOD0.820.810.820.830.740.820.80
HBFOD0.220.570.640.690.680.620.57
3DLFOD0.780.810.830.840.790.810.81
HBFOD0.210.490.480.430.510.510.43
GOF1DLFOD0.730.780.540.700.730.770.70
HBFOD0.710.720.190.640.720.780.62
2DLFOD0.720.770.520.680.710.740.69
HBFOD0.660.620.170.550.560.640.53
3DLFOD0.730.780.510.690.740.730.69
HBFOD0.510.450.160.340.480.520.41
Publisher’s Note: MDPI stays neutral with regard to jurisdictional claims in published maps and institutional affiliations.

