Article

Assessment of Distribution of Potentially Toxic Elements in Different Environmental Media Impacted by a Former Chlor-Alkali Plant

1
Department of Civil and Environmental Engineering, School of Engineering and Digital Sciences, The Environment & Resource Efficiency Cluster (EREC), Nazarbayev University, Kabanbay Batyr Ave. 53, Nur-Sultan 010000, Kazakhstan
2
Environmental Engineering and Sustainability Management, École Polytechnique de Paris, Route de Saclay, CEDEX, 91128 Palaiseau, France
3
Faculty of Engineering, University of Debrecen, Otemeto Street 2-4, 4028 Debrecen, Hungary
4
Department of Chemical and Materials Engineering, School of Engineering and Digital Sciences, The Environment & Resource Efficiency Cluster (EREC), Nazarbayev University, Kabanbay Batyr Ave. 53, Nur-Sultan 010000, Kazakhstan
5
Department of Chemical and Process Engineering, University of Strathclyde, Glasgow G1 1XQ, UK
*
Author to whom correspondence should be addressed.
Sustainability 2021, 13(24), 13829; https://doi.org/10.3390/su132413829
Submission received: 20 October 2021 / Revised: 9 December 2021 / Accepted: 10 December 2021 / Published: 14 December 2021
(This article belongs to the Special Issue Chemical Pollution, Prevention, and Environmental Sustainability)

Abstract

:
Former industrially contaminated sites are a burden from the past that still pose environmental risks. During the second half of the 20th century, the Pavlodar region in North Kazakhstan had been a part of Soviet Union’s industrial system that operated a chlor-alkali plant (CAP). The former CAP discharged approximately 135 t Hg into nearby Lake Balkyldak with total losses to water, soil, and air estimated around 1000 t. Pollution by potentially toxic elements (PTEs) due to former and currently active industrial enterprises is an under-investigated concern in the Pavlodar region. The present study aims to provide a much-needed update on the situation around the CAP area by evaluating the contamination by Hg and other selected PTEs (As, Ba, Cd, Co, Cr, Cu, Mn, Ni, Pb, Sb, Se, Zn) on the surrounding environment of the CAP and in the nearby urban zone. Soil, sediment, surface water, and groundwater samples have been collected in several sampling campaigns carried out in 2018 and 2019. Several samples had Hg concentrations exceeding maximum permissible concentrations (MPC), for soils and sediments (in mg/kg; range: 0.0006 to 24, average: 0.56) and for surface water and groundwater (in µg/L; range: 0.004 to 1340, average: 93). Critically high concentrations were mostly measured in the vicinity of Lake Balkyldak, where the majority of Hg had been discharged by the former CAP, indicating persisting Hg pollution in the studied zone. A comparison of the PTEs concentrations in soil and sediments showed less severe pollution but still some elevated values for As, Ba, Co, Cu, Mn, Ni, and Se. The inter-elemental relationship between Hg and assessed PTEs was weak, indicating the presence of sources independent from Hg emitting sources. Further research on Hg contamination on the exact territory of the former CAP is needed, and a detailed human health risk characterization to identify potential unacceptable risks is strongly recommended.

1. Introduction

Mercury (Hg) is a naturally occurring, volatile, highly toxic element originating below the Earth’s surface [1] and exists in elemental, inorganic, and organic forms (Table 1). Annually, around 5207 Mg of Hg is released from both natural (volcano eruptions, soils, rocks) sources and anthropogenic industrial processes (e.g., thermal energy generation, chemical industries, waste disposal operations) [2,3], with anthropogenic discharge significantly exceeding geogenic sources [4]. The European Commission classified Hg as a priority hazardous substance with no known safe level of exposure [5]. The USEPA has set the minimum risk level for chronic exposure to elemental Hg (via inhalation exposure: at 3 × 10⁻⁴ mg/m3) and for mercuric chloride (HgCl2) (via oral exposure: at 3 × 10⁻⁴ mg/kg/d) [6]. Exposure to Hg and other PTEs occurs via three pathways: oral, dermal, and inhalation [7] and might cause neurological diseases (Table 1) [8], where the organic form methylmercury (MeHg) is particularly problematic. MeHg is classified as a possible human carcinogen (Class C, weight of evidence characterization), also having a reference dose of 1 × 10⁻⁴ mg/kg/d and minimum risk level for chronic ingestion of 0.0003 mg/kg/d [6]. Elemental Hg can stay in the atmosphere for up to a year, where it can be transported or photo-oxidized to an inorganic form and then withdrawn through wet or dry deposition [2]. Sulfate- and iron-reducing bacteria under anoxic/sub-anoxic conditions may methylate the released inorganic Hg into organic Hg (ex., MeHg), which then can be bioaccumulated and biomagnified through the aquatic food chain thus posing health risks [9,10]. Hg cycles through the Earth’s natural processes between environmental media while posing a threat to human health and the environment [1]. Surface soils, water bodies, and bottom sediments act as sinks for directly released elemental Hg from the industrial processes [1], greatly affecting local regions [8,11]. Potentially toxic elements (PTEs) are a group of inorganic contaminants of various environmental significance, i.e., some of the elements might be toxic only at excessive concentrations, while others are posing high health risks even in trace amounts [12]. Although Hg is the primary contaminant of concern in the present study, the other PTEs are also of interest because of the rapid growth of various industries over the last centuries (chemical byproducts, herbicides, pesticides, pharmaceuticals, mining, metallurgy, nanoparticles, etc. [13,14]).
Certain chlor-alkali plants (CAPs) utilize liquid elemental Hg as catalyst during the electrolysis of saturated brine water, which could be then discharged to the environment through wastewater, solid waste, and atmospheric release [10]. Even though chlorine and caustic production industries are shifting to Hg-free membrane technologies, in 2015, the European chlor-alkali industry still accounted for 2.8 million tons of production using the Hg-cell technology [15]. The European Union’s Industrial Emissions Directive mandated the industries to phase out the utilization of Hg-cells by 2017; however, practically, an immediate cease for such plants is not possible at short notice [15]. Even after plant operations cease, Hg release might continue for extended periods. According to the World Chlorine Council (WCC), in 2016, 4378 kg Hg/year was released worldwide into the environment by 34 CAPs using Hg-cell technology [16].
In Kazakhstan, “PO Khimprom” CAP (a former USSR military-industrial establishment) operated from 1975 to 1993 in Pavlodar (North Kazakhstan) (Figure 1). The region of Pavlodar is a part of the “Pavlodar-Aksu-Ekibastuz” industrial system, a strategic complex for the industrial development of Kazakhstan comprising about 40 enterprises. Over the last 60 years, the region’s industrial facilities have significantly aggravated the environmental situation due to regular emissions including PTEs [17]. Around 1300 tons of Hg were estimated having been used during the operational period of the former CAP [18], with Hg loss estimated at 1000 t and large amounts of which still unaccounted for [19,20]. Lake Balkyldak, which is located to the north of the CAP, is considered as one of the primary pollution receivers used as a settling lagoon, where sludge and other industrial waste as well as a major part of Hg was discharged to [20,21] (Figure 1). Computer models showed the contaminant possibly migrating from the groundwater under the site to Irtysh River [22]. Furthermore, consumption of fish from Lake Balkyldak and Irtysh River was suggested to pose high risks to local population, along with studies indicating elevated concentrations of Hg in biota and in other environmental compartments (e.g., [19,22,23]). After the CAP was closed, a suggested remediation plan could not be fully executed and was limited to dismantling Hg electrolysis buildings and stabilizing its area, the removal of contaminated surface soils, covering pollution hotspots with clay, and the construction of a cut-off wall and a storage facility [20].
For the Pavlodar urban zone as well as the CAP-affected zone, studies on the current situation of Hg contamination as well as the PTE contamination are needed [20]. Studies examining Hg contamination in soil, sediments, water, and biota in the Pavlodar region have been published, but a review of these studies revealed that the literature is outdated (latest sampling campaigns before 2011) and fragmented, emphasizing a need for an up-to-date integrated site assessment. A systematic reporting of environmental assessment data contributes to the global knowledge of contaminated site assessment management and would help better understanding the persistence and fate of Hg and other selected PTEs. For the current case, such updates are critical as previously planned site remediation activities could not be completed due to lack of funding.
It is currently not known whether this site (impacted by the former activities of the CAP (Hg) as well as under current influence of Pavlodar industrial complex (other PTEs)) is potentially hazardous to environment. A systematic investigation of selected PTEs in different environmental media is needed to clarify its situation. The current study aims to (1) evaluate Hg contamination in the soil, sediment, and waters; and to (2) evaluate contamination by selected PTEs (As, Ba, Cd, Co, Cr, Cu, Mn, Ni, Pb, Sb, Se, Zn) in soils and sediments around the CAP-affected region and in the nearby urban zone, based on the analysis of samples collected during several sampling campaigns carried out in 2018 and 2019. The structure of the paper is laid out so that results for Hg content in soils, sediments, and aqueous samples (Section 3.2 and Section 3.3) are reported before other PTEs concentrations in solid samples (Section 3.4), which are followed by a comparison of the current contamination case with other CAPs from the world (Section 3.5). Finally, the study provides an analysis of the effect of distance from the point source on Hg concentrations as well as the comparison of industrial and urban zones in terms of the pollution level.

2. Materials and Methods

2.1. Site Description, Sampling

A total of 129 solid (soil, sediment) and 98 aqueous (surface water, groundwater) samples have been collected during field trips in 2018 (May, September, October) and 2019 (July) in the Pavlodar region, on a territory of around 500 km2 which was previously reported as highly contaminated with Hg and then characterized (Figure 2, Figure 3, Figure 4 and Figure 5). The water system of the affected zone, including Lake Balkyldak and Sarymsak pond, is linked to Irtysh River, which is a large water body flowing through Pavlodar city (52°18′56″ N, 76°57′23″ E); connecting Kazakhstan, China, and Siberian Russia [19]. The city has a population around 750,000 people [26] and uses the river water for domestic, agricultural, and industrial purposes [19]. The climate of the Pavlodar region is characterized as an extreme continental with sharp seasonal changes, low annual precipitation, and high potential evaporation, indicating semi-arid climate characteristics [19]. According to Köppen-Geiger climate classification, this region’s climate can be classified as Dfb—warm-summer continental climate [27]. The type and composition of soil around the Pavlodar region is classified as Kastanozems [28] which may be expected to retard the rate of redistribution of contaminants. The region’s cold climate (average temperature of −15 °C in January) and heavy snow cover in winter would inhibit the seasonal atmospheric re-emission of Hg. In contrast, the dry and warm climate (average temperature of +20 °C in July) with strong winds during the summer period may be expected to facilitate Hg volatilization that provides a long transport opportunity on a global scale [21]. Hence, the sampling collection season might significantly affect the fate and distribution of contaminants within the media [29]. Due to a continuous discharge of the pollutants by the industrial companies concentrated in this region for extended periods, high concentrations of PTEs were reported by various studies [17,22,30].
During the collection of solid (soil and sediment) samples, plants, larger rocks, and debris were first removed from the surface; then, the soil in a homogeneous area of 15 cm × 15 cm (if heterogeneous, at corners and center of 1 m × 1 m area) at a depth of 0–10 cm was mixed using a stainless-steel soil shovel and collected into Whirl-Pak sampling bags. In order to avoid cross-contamination, the sampling shovel has been cleaned each time after the sampling. Sediment samples were collected 10 m from the shoreline at a depth of 0–5 cm via a standard surface grab collection with a scoop attached to a pole. Aqueous samples were collected from the surface waters of Lake Balkyldak, Sarymsak pond, Irtysh River, small ponds in the area, and groundwater monitoring wells. Water temperature and conductivity were measured in situ, and each sample was added to 15 mL and 50 mL Corning plastic tubes. Trace element grade HNO3 (70% v/v, Sigma Aldrich, St. Louis, MO, USA) was added to samples in 50 mL tubes for preservation purposes. All field samples were transported to the lab and stored in a freezer at −4 °C.

2.2. Sample Handling and Characterization

Approximately 15 g of each solid sample were unfrozen and then air-dried at room temperature for 24 h under a fume hood. The samples were crushed and then sieved to remove coarse aggregate and vegetation (2 mm sieves). Solid samples were characterized for pH, among which eight soil samples were characterized for their total carbon (TC), total organic carbon (TOC), and total nitrogen (TN). A fraction of each dry sample (5 ± 0.05 g) was mixed to form a slurry by adding 10 mL of deionized water (Millipore Milli-Q ultrapure, Burlington, MA, USA) and was shaken (5 min) in an ultrasonic water bath (FisherBrand FB 15055, Hampton, NH, USA), then pH was measured using pH meter (Mettler Toledo SevenCompact S210) in accordance with the established protocols [31]. For TOC and TC, approximately 10 g of sample was weighed and dried for 24 h by using an oven (Carbolite Gero 30–3000, Sheffield, UK). Soil TC was determined via a C/N dry combustion elemental analyzer (Multi analyzer HT 1300; Analytik Jena, Jena, Germany). For total inorganic carbon (TIC), the samples were pretreated by adding 8.1 mL of HCl (37% w/w) to prepare 100 mL 1 N solution to dissolve carbonates, after which they were dried in the ultrasonic bath overnight at 70 °C. TOC was determined by subtracting TIC from TC. TN was determined according to Dumas method (Dumas analyzer DuMaster D-480 Buchi, Flawil, Switzerland) based on quantitative combustion in excess oxygen.
The pH and conductivity measurements were carried out for 57 and 23 selected aqueous samples, respectively. Samples were collected from Lake Balkyldak, Sarymsak Pond, and Irtysh River in duplicates. Acid was added to one for preservation, and the other was used to conduct pH assessment. Measurement of pH of aqueous solutions was carried out [32] using a pH/conductivity-meter (Mettler Toledo, Columbus, OH, USA; SevenCompact™ S210) along with the conductivity.

2.3. Determination of Hg

Laboratory analyses of total Hg concentrations (THg) in solid and aqueous samples were carried out using RA-915M mercury analyzer coupled with RP-92 and PYRO-915+ attachments (Lumex: Carol Stream, IL, USA). The operation principle is based on differential Zeeman atomic absorption spectrometry using high-frequency modulation of light polarization (Zeeman AAS-HFM, Carol Stream, IL, USA) [33]. The equipment sensitivity allows the detection of volatile Hg compounds (i.e., 0.5 ng/L for aqueous samples and 0.5 µg/kg for solid samples) (ibid.). THg in soil and sediment samples were measured using the PYRO-915+ attachment operated at 520–580 °C (Mode 2, for concentration range between 0.005 and 2.000 mg/kg). 200 ± 15 mg sample was placed in a cuvette and burned in a chamber. Solid samples were analyzed twice (thrice if the difference between measured Hg levels exceeded 15%), and the average was reported (refer to Tables S1 and S2 (Supplementary Materials) for individual results for sediments and soils).
To measure THg in aqueous samples, the method based on bromide-bromate mineralization for the lower concentration range procedure was used. The digestion solution contained potassium bromate (KBrO3, 0.033 mol/L) and potassium bromide (KBr, 0.2 mol/L) solutions. The dilution solution for aqueous samples was prepared using potassium dichromate (K2Cr2O7) and concentrated nitric acid (HNO3). THg levels in the aqueous sample were measured using cold vapor method and involved using either the multi-path (for <1 µg/L) and single-path (for 0.5–5000 g/L) analytical cells of the RA-915 analyzer coupled with RP-92 attachment [33] (refer to Table S3 for individual results for groundwater samples, Table S4 for water samples).

2.4. Determination of Other Selected Potentially Toxic Elements (PTEs)

Soil samples collected during field trip in 2019 were first digested using a microwave acid digester (ETHOS UP Milestone) by using 3 mL HNO3 (70% w/w, Sigma Aldrich) and 9 mL HCl (37% w/w, Sigma Aldrich) at 140 °C. Subsequently, cooled samples were filtered using syringe filters (0.45 μm) and then diluted to 50 mL using deionized water (Millipore Milli-Q ultrapure). The total concentrations of selected PTEs were determined (Table S5) using inductively coupled plasma mass spectrometry (ICP-MS) (ThermoFisher iCAP RQ, Waltham, MA, USA). Before the analysis, the dilution method was chosen in proportion 1:1500, based on the sensitivity of the ICP-MS equipment to aqueous samples. Limits of detection were calculated based on the standard deviation of the analyzed blanks (3 × standard deviation) (Table S6).

2.5. QA/QC, Statistical Analyses

Quality assurance and quality control measures encompassed analysis of blanks and blind duplicates, the use of certified reference materials (CRMs) (Hg concentration: 1000 mg/kg, CRM provided by the manufacturer of RA-915M Hg analyzer; IV-ICPMS-71A for As, Ba, Cd, Co, Cu, Mn, Ni, Pb, Se, Zn, and ICP-MS-68A-B for Sb and Sn) with CRM test results presented in Table S7, and acid washing of glassware used in laboratories to avoid cross-contamination by trace elements. In order to obtain accurate results from the Hg analyzer, the calibration solutions (concentration range from 2 mg/kg to 100 mg/kg) were also prepared as well as a blank sample and have been analyzed after every ten consecutive measurements. Moreover, if the results exceeded the detection limit of the chosen operation mode for Hg analyzer, the samples were analyzed under different modes that allowed detecting a higher concentration range. To ensure the accuracy of the results obtained via ICP-MS analyses, the samples were spiked with the internal standard (Rh) prior to the procedure, which was regularly verified during the analyses.

3. Results and Discussion

3.1. Sample Physicochemical Properties

In order to predict the migration potential of PTEs associated with soils, it is important to take into consideration the soil solution chemistry, as metals associated with the soil solution are able to migrate to groundwaters through the vadose zone [34]. Soil pH affects its capacity to adsorb trace metals and the solubility of cationic PTEs within the media increases at lower pH [34]. In the present study, pH of soil and sediment samples ranged from 7.11 to 9.25. The majority (38 out of 59) of the analyzed samples were categorized as slightly alkaline (i.e., pH > 8), the rest had neutral pH (i.e., between 6 and 8). As the samples were alkaline or neutral, the mobility of trace metals is expected to be at the lower end, particularly for Hg that precipitates with carbonate and hydroxide in alkaline soils to form a stable solid phase (ibid.).
Other factors that affect the mobility and bioavailability of various elements are TOC and TC of soils as their elevated concentrations indicates the ability of elements to be bound into more complex structures and limits their mobility within the medium [20]. Due to the complexity of the Hg-soil system, Hg has a high affinity for organic matter in surface soils [35]. The amounts of TC and TOC in the selected samples (n = 8) were low to average (2.21–12.8 g/kg and 2.14–10.8 g/kg, respectively), showing the limited presence of organic matter in the soil around Lake Balkyldak. These soils could be classified as mineral soils. TN in selected solid samples ranged from 0.033% to 0.17%. Correspondingly, the obtained carbon-to-total nitrogen ratio was 8.96, in accordance with other Kastanozems e.g., 8.47 reported for Kastanozems soils in China [36] and could be considered in the range (<30) when humification and mineralization take place, indicating low accumulation [37].
The chemical form of Hg as well as some other PTEs in aquatic systems could be strongly related to pH as the pH of aqueous samples is generally inversely related to the mobility of the contaminants and their ability to dissolve in water, i.e., the lower the pH, the higher the solubility of the contaminant [38,39]. The average pH of the selected aqueous samples (n = 57) was 8.27 (Tables S3 and S4), slightly higher than the neutral pH range (between 6 and 8). Out of 57 tested samples, 41 were alkaline (pH > 8), with only two samples being acidic (pH < 6). Finally, the characterization of the aquatic system in the Pavlodar region included measuring the conductivity of 23 selected samples (Tables S3 and S4). Conductivity is related to the presence of dissolved substances in water and is also often used as an indicator of salinity (i.e., higher conductivity indicates greater dissolved salt levels) [40]. The average value of conductivity was 9.57 ± 9.13 mS/cm (ranged 1.32–43.4 mS/cm), which could be considered higher than the typical conductivity for freshwater surface streams (<1500 µS/cm) [41].

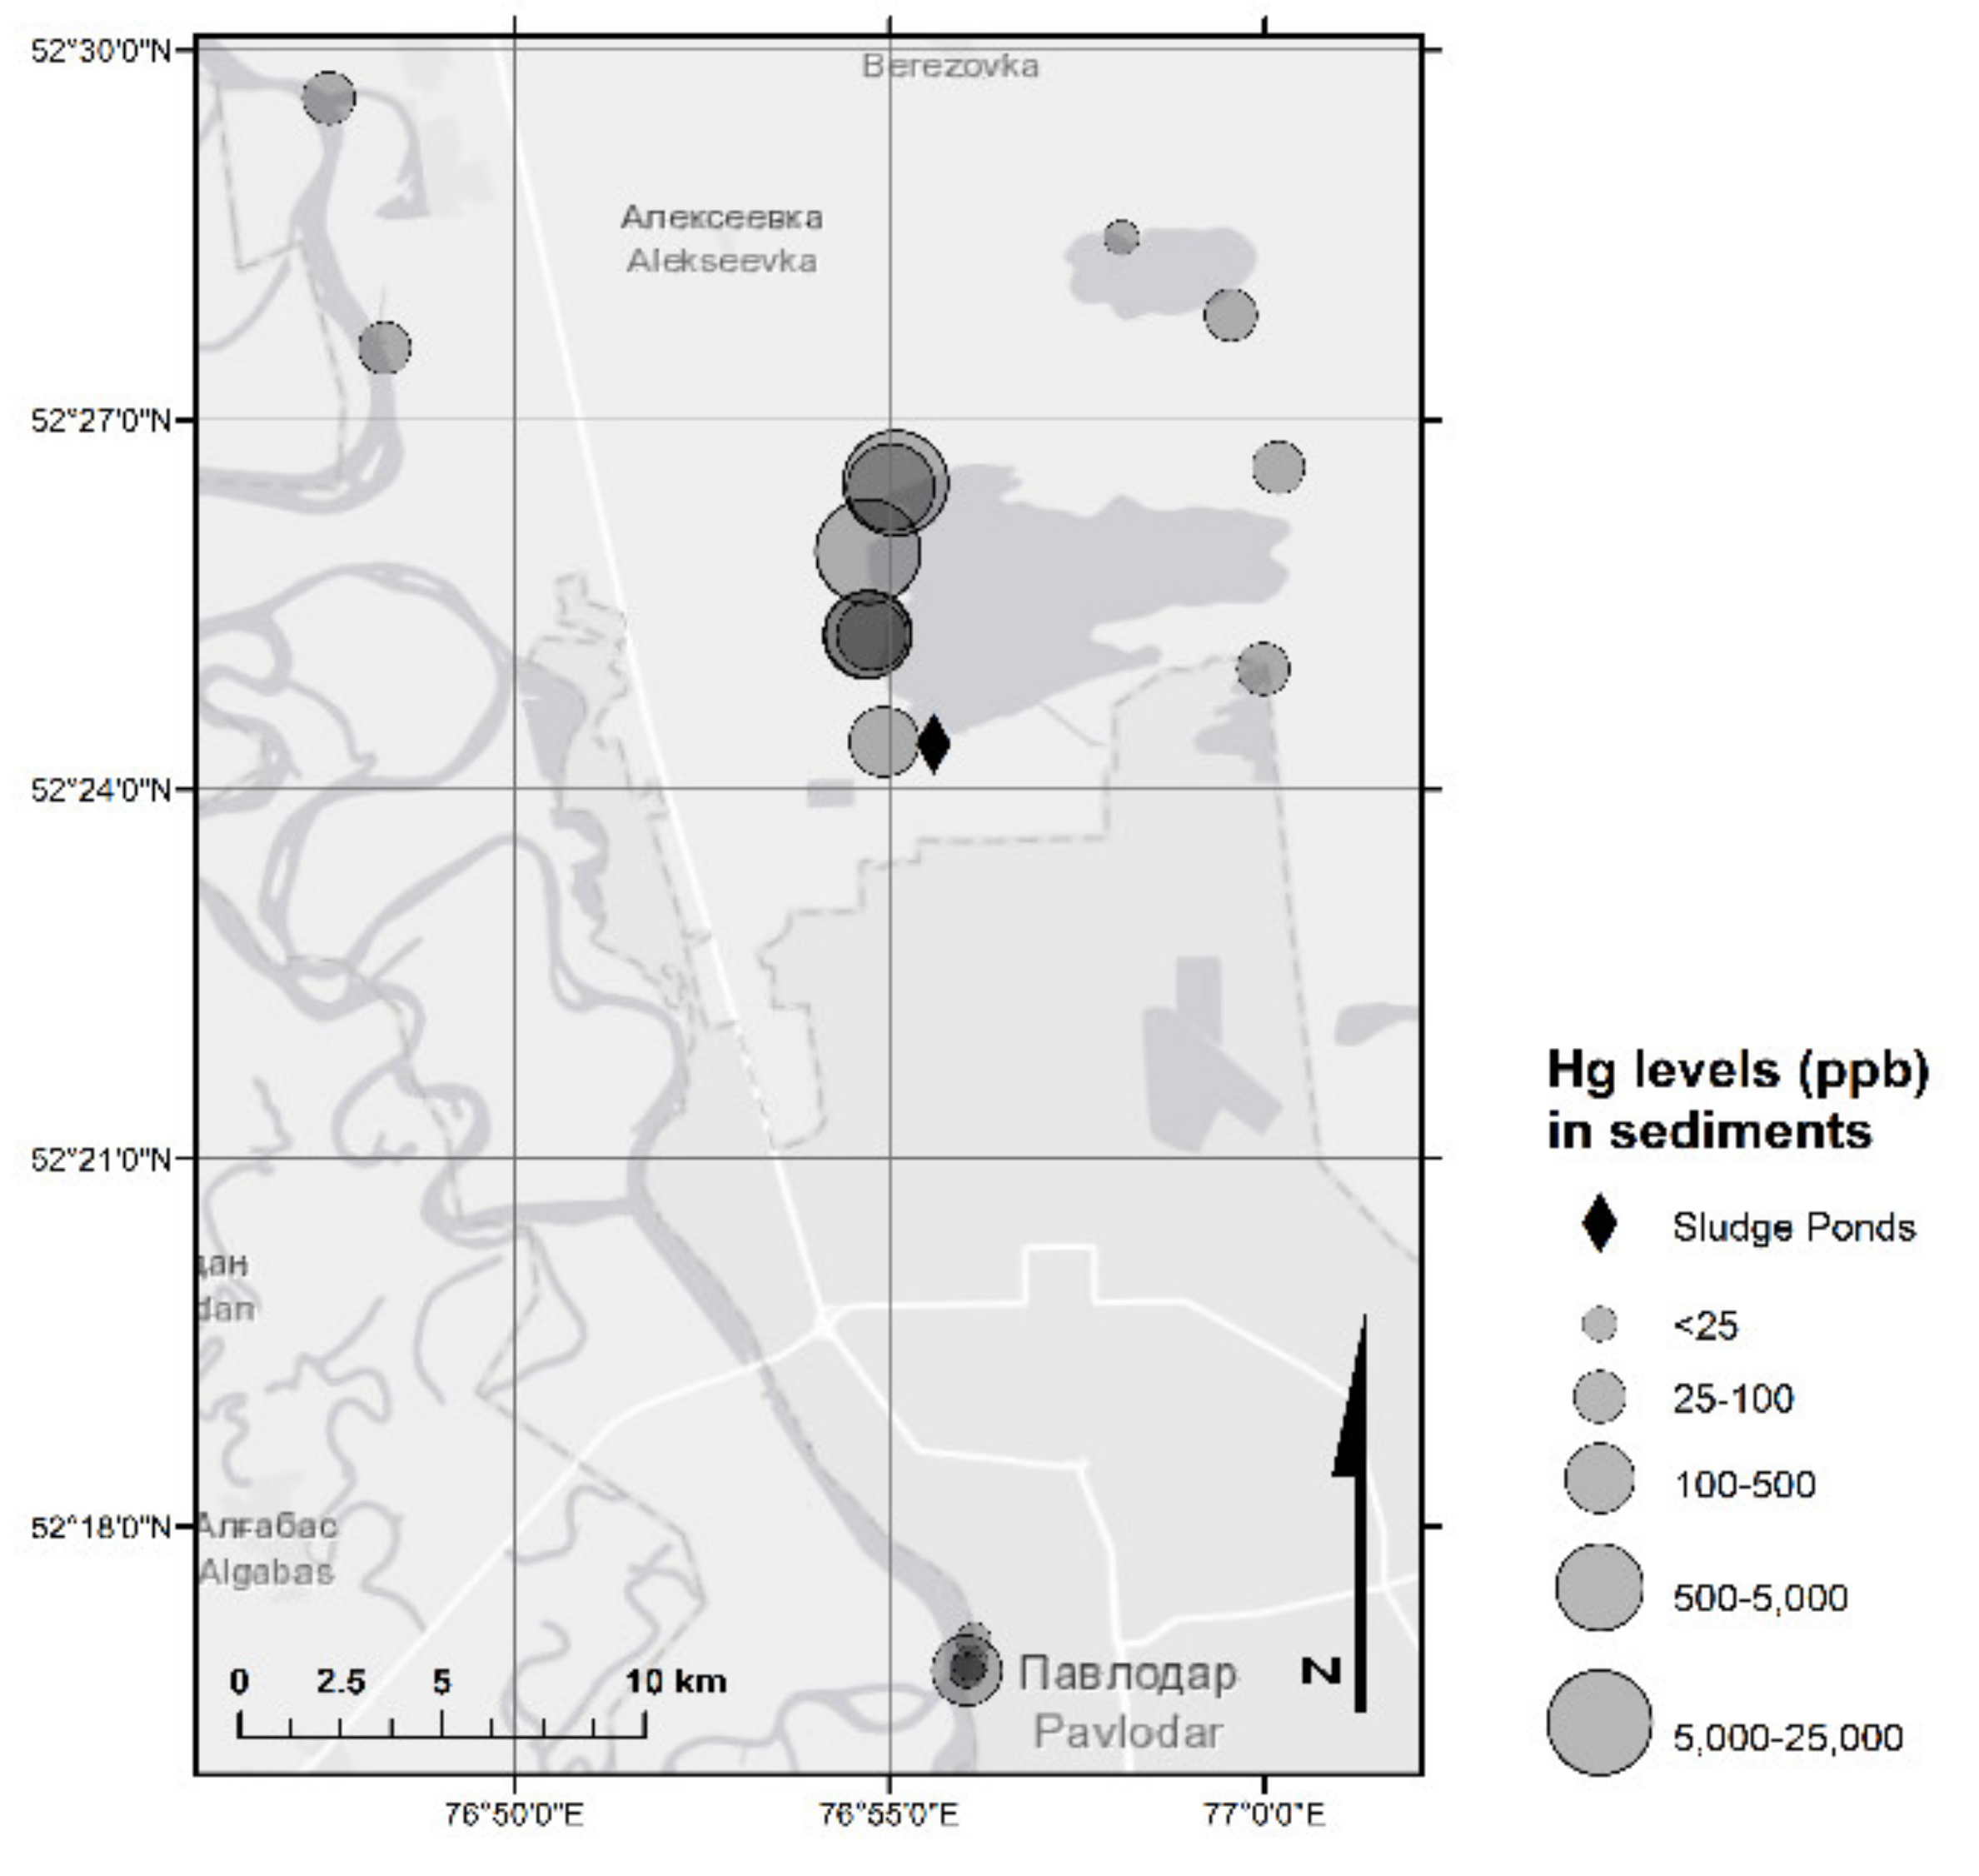
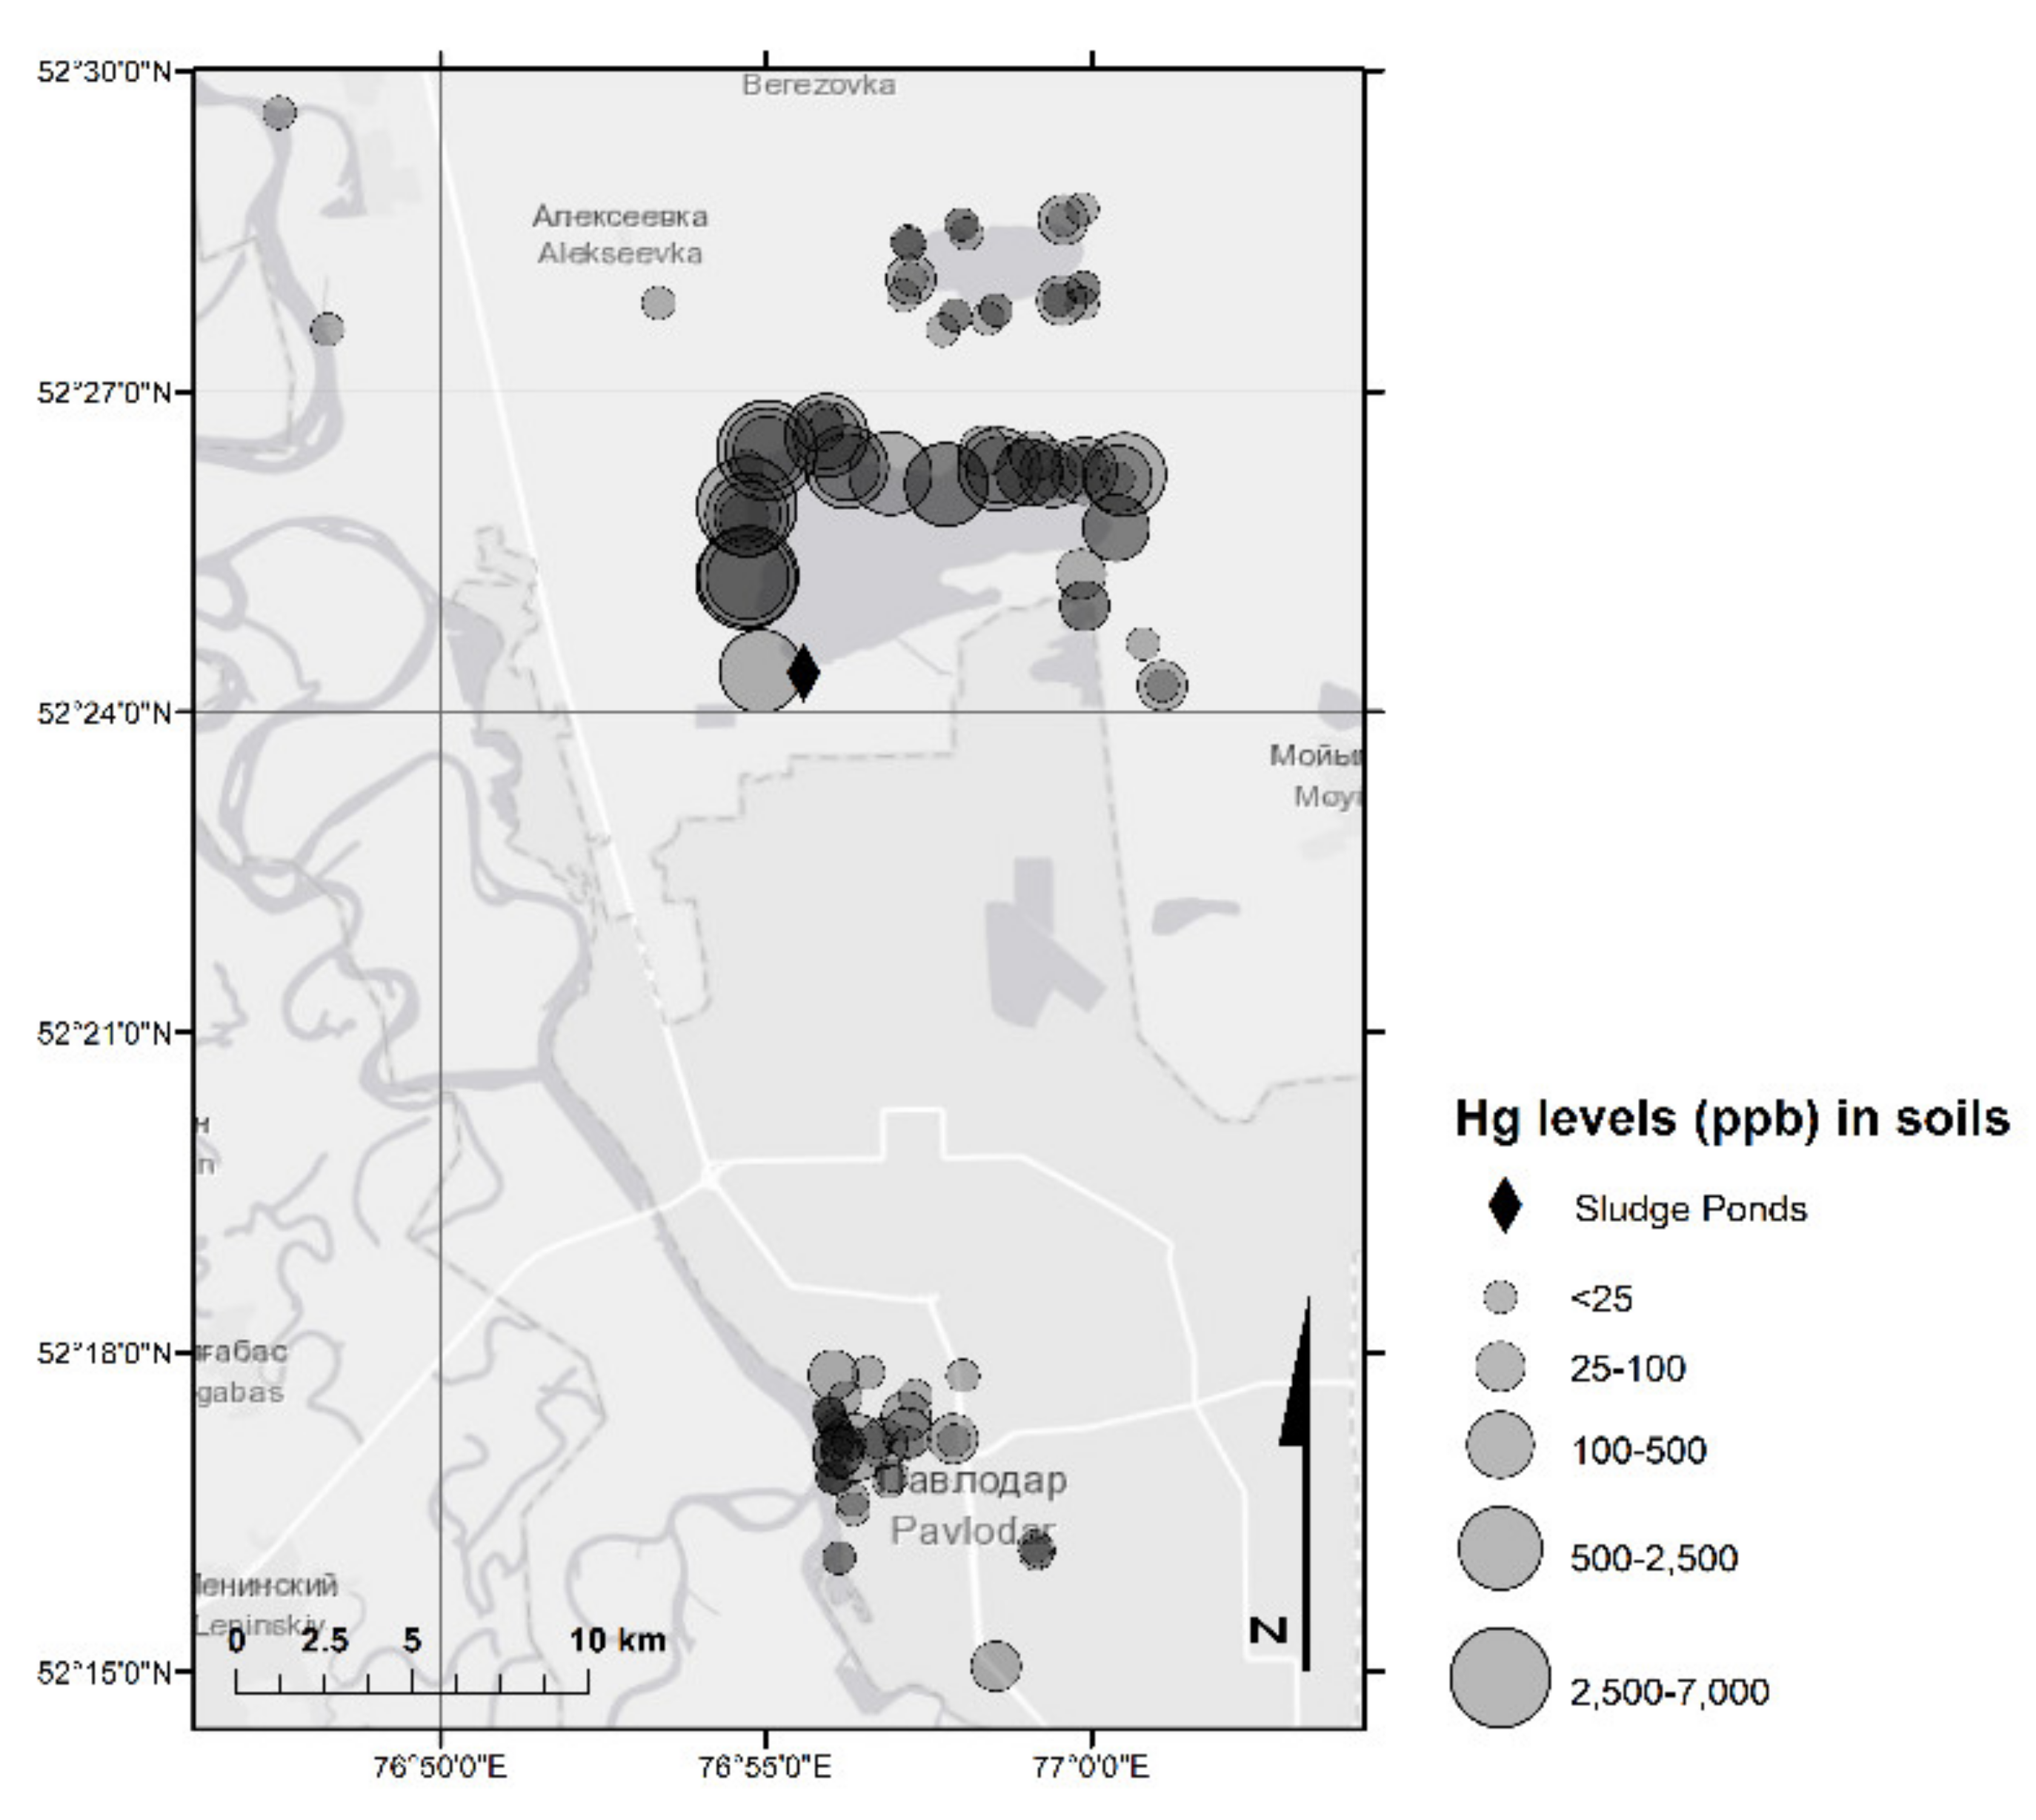
3.2. Hg in Soils and Sediments

In order to control the level of pollution by PTEs in various environmental compartments and to minimize human exposure to PTEs, maximum permissible concentrations (MPCs) have been established worldwide by various governments (e.g., Canada and Kazakhstan) and health agencies (e.g., World Health Organization (WHO)). In comparison to the limits for Hg proposed by WHO (2007, 1 µg/L in water) and Canada (MDDELCC, 2019; up to 10 mg/kg in soil), the national standards proposed by Kazakhstan (MEPRK 2004) are more stringent (0.5 µg/L in water, 2.1 mg/kg in soil) and aim to reduce Hg concentrations in the environment but not its emissions [20]. In the present study, the concentrations of Hg were first compared with the local national standards (Table 2) to identify the level of contamination in soils, sediments, and water in the Pavlodar region.
Hg concentrations in the soils sampled in CAP-affected and urban areas of the region ranged from 0.00063 mg/kg to 7.0 mg/kg, with an average of 0.32 mg/kg that is below the national MPC (2.1 mg/kg) (Table 3 and Table S2). Overall, four out of 111 soil samples contained concentrations of Hg exceeding the national MPC. As shown in Figure 5, the sampling points with the highest Hg concentrations in soil were located around Lake Balkyldak. Hg concentrations in the sediments ranged from 0.004 mg/kg to 24 mg/kg, with an average of 2.1 mg/kg, similar to the national MPC (2.1 mg/kg) (Table 3 and Table S1). In three out of 18 sediment samples, Hg levels exceeded the MPC (Figure 4). The pollution of sediments is more severe as sediments have higher concentrations than soils. Subsequently, the lake still seems to remain a Hg sink and may act as a pollution source long after it has been used to dispose of Hg-containing effluents during the operation period of the former CAP [20]. Slightly alkaline pH observed in most soil and sediment samples would be expected to reduce Hg mobility [34]. That being said, TOC measured in selected soils and sediments (Table S3) were not high (max: 10.6 g/kg for soils, 10.8 g/kg for sediments, n = 8), indicating a possibly limited potential of Hg retardation by organic matter.
In order to investigate the distribution of the data, Shapiro-Wilk’s normality test was employed to the dataset of Hg concentrations in the solid samples. Results (Table 4) showed that the null hypothesis has been rejected, indicating non-normal distribution (p = 0.007) which is typical of environmental samples. The Shapiro-Wilk test results, Q-Q plots, and histograms were used to reveal outliers that might indicate potential hotspots with high Hg concentrations in several soils and sediments samples. One such hotspot, a sediment sample (0910-P-Sed-04) with an extreme Hg concentration of 24 mg/kg was found west of Lake Balkyldak. The Pearson correlation analysis was applied to sample THg, pH, TOC, TC, and TN data (Table 5), and correlation between these parameters was evaluated. An inverse (but not significant) correlation between soil pH and THg (r = −0.454) within the medium. A significant positive correlation was found between the soil TOC (r = 0.731**), TN (r = 0.894**), and THg levels, indicating the retention of Hg by organic matter in the soil. Hg retention via sorption by organic matter reduces its mobility and thus may lead to lower ecotoxicity; however, changing environmental conditions may later remobilize Hg e.g., via decreasing pH leading to desorption and/or development of reducing conditions leading to transformation to elemental Hg [34], affirming the importance of long-term environmental monitoring for Hg-contaminated sites.

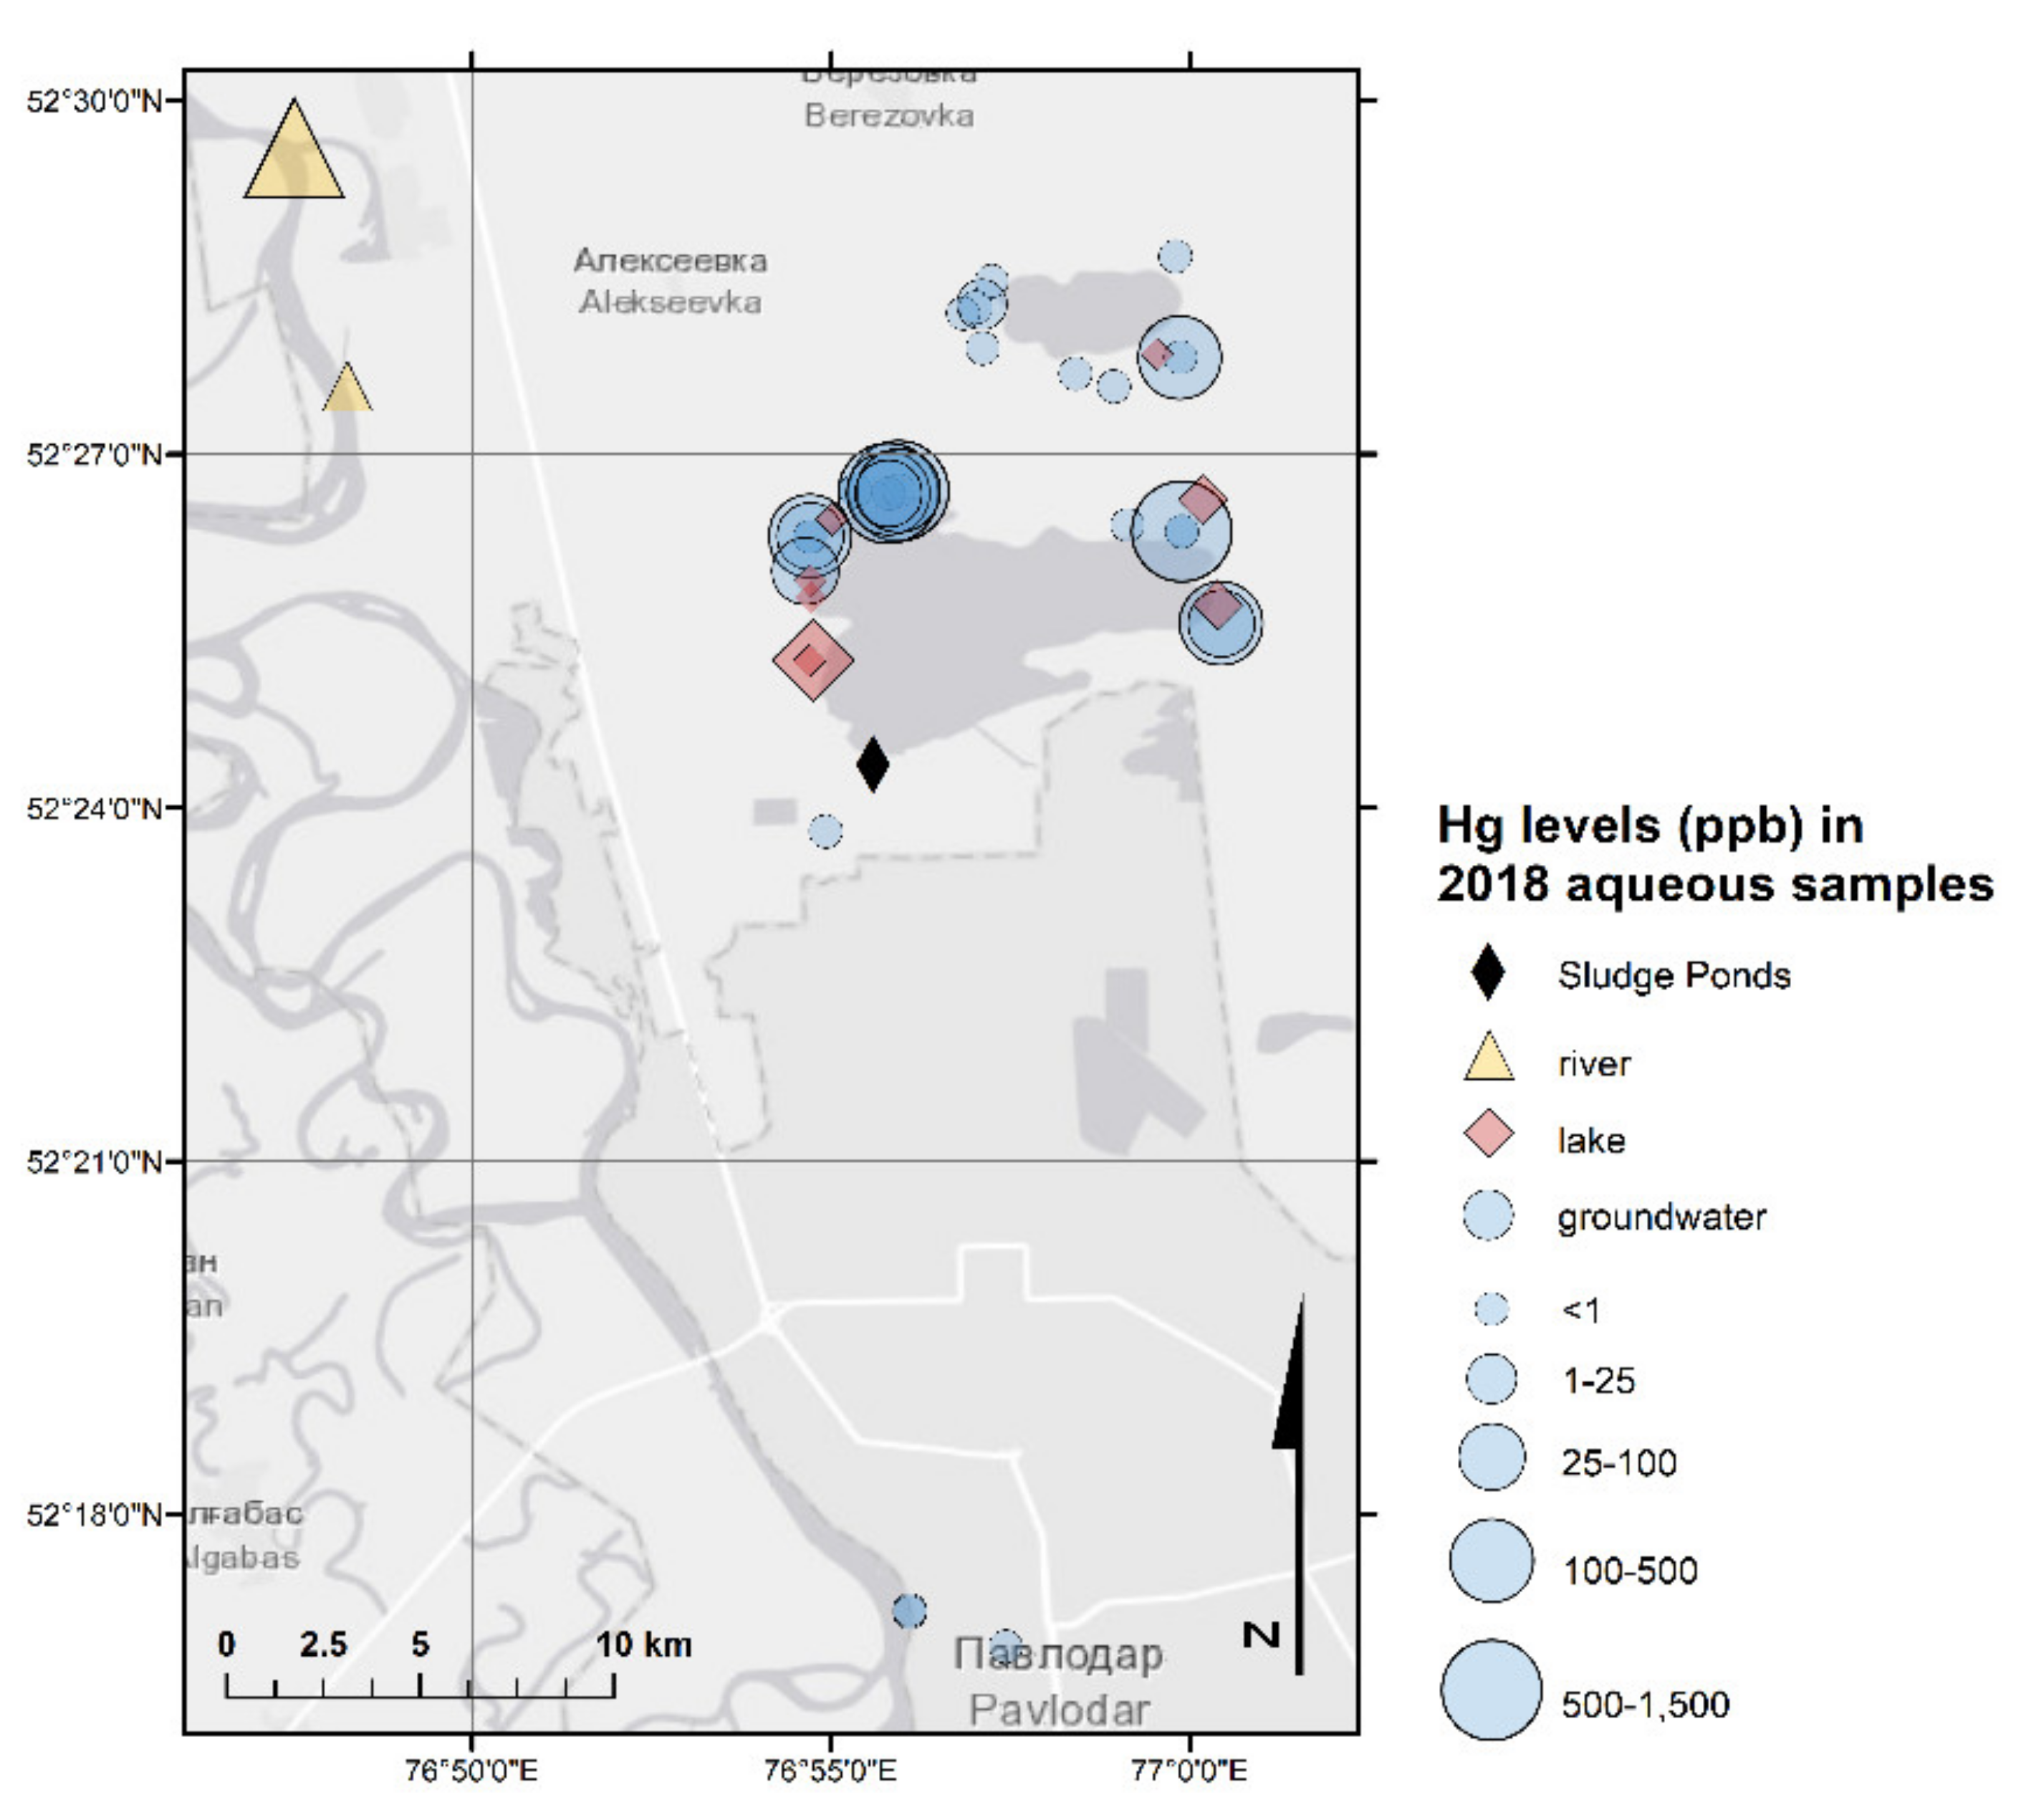
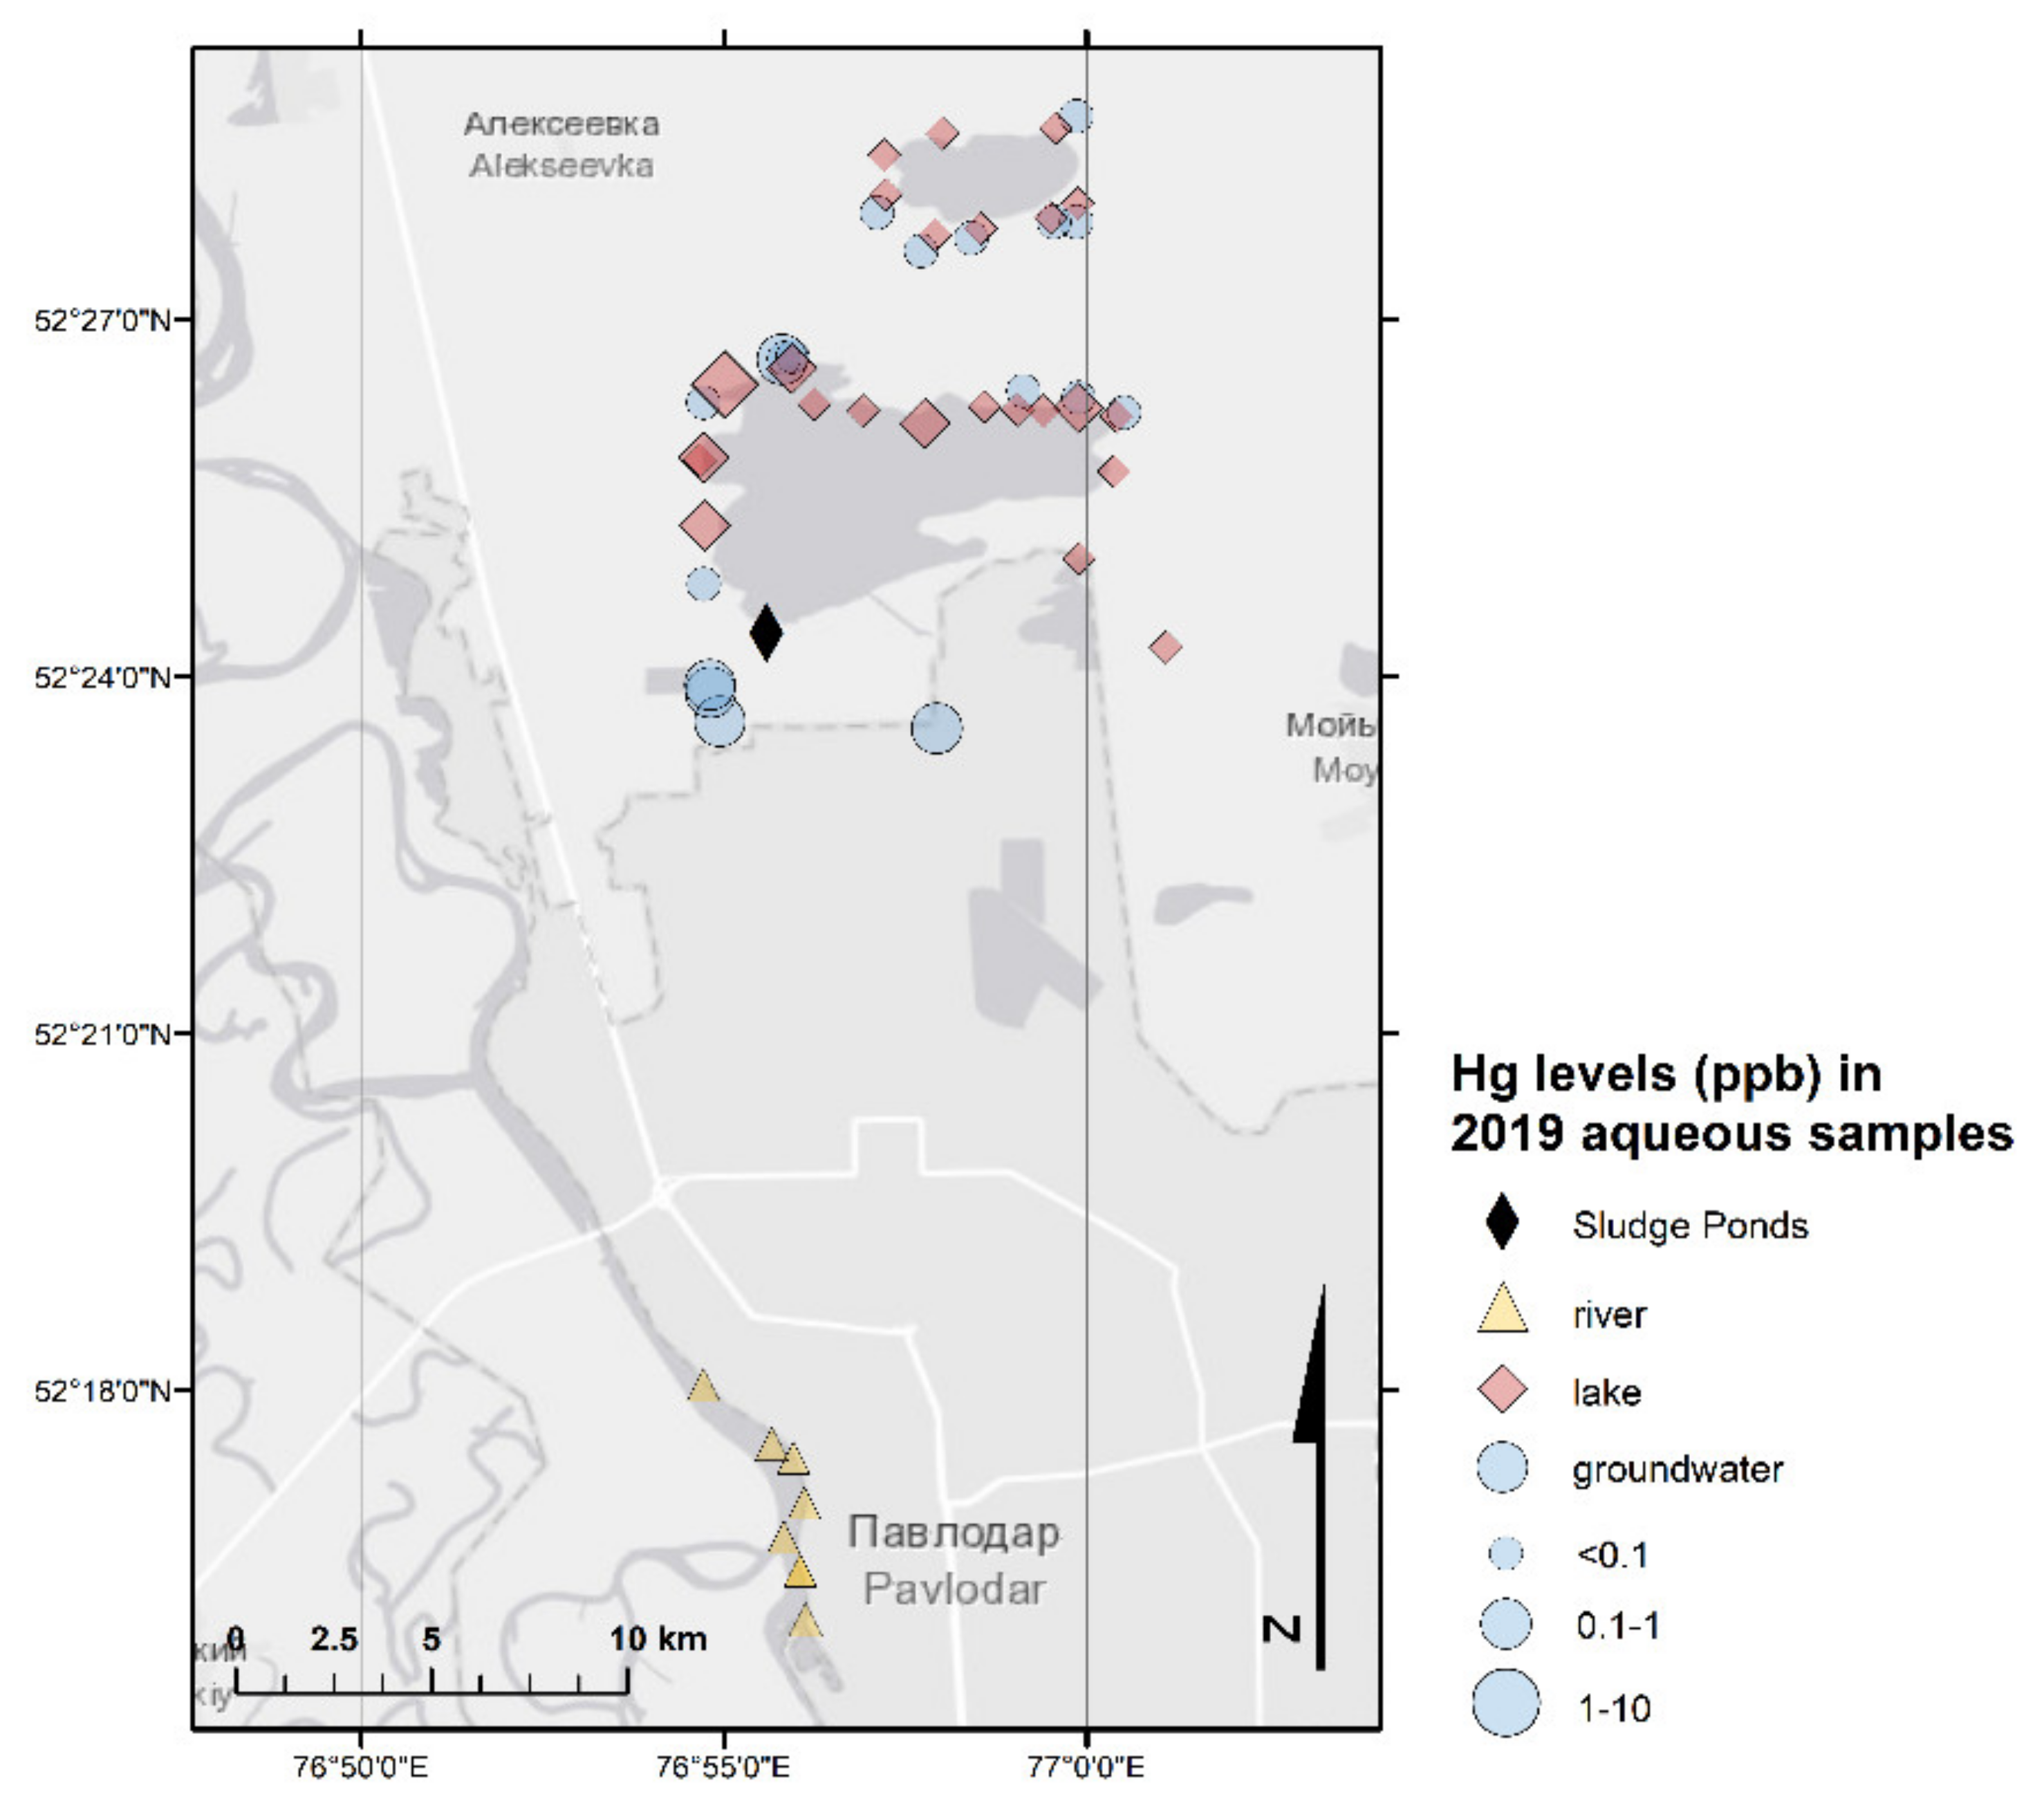
3.3. Hg in Surface Water and Groundwater

Groundwater is commonly extracted for agricultural, domestic, and drinking purposes; thus, it is essential to monitor its quality [44]. The Hg concentrations in the groundwater samples (n = 54) (Table 3 and Table S3) were acceptable in general: the majority of the groundwater samples did not exceed the national MPC for Hg in drinking water of 0.5 µg/L. However, Hg levels ranged from 0.004 µg/L to 1340 µg/L with an average concentration of 93 µg/L, which is 186 higher than the MPC. These were mostly 15 samples collected in the vicinity of Lake Balkyldak and Sarymsak Pond (Figure 2). These results indicated severe Hg pollution of the groundwater within the area of the former CAP, especially at locations previously directly impacted by the chlor-alkali production activities. Overall, this supports the idea the CAP-impacted zone acting as a pollution source long after the operations of CAP seized.
The total Hg concentrations in 44 surface water samples (Lake Balkyldak, Sarymsak Pond, and Irtysh River as well as three samples collected from the wells for water quality monitoring next to the river; Table 3 and Table S4) ranged from 0.004 µg/L to 720 µg/L with an average value of 26 µg/L. Similar to groundwater samples, a comparison of tested samples with the established MPC for drinking water showed that the majority of samples complied except for seven samples collected from Lake Balkyldak in the vicinity of the former CAP (Figure 2 and Figure 3). Although THg in most samples did not exceed the MPC, the average concentration of Hg (26 µg/L) in surface water samples was around 50 times greater than the regulatory value because of several extremely high values. The Hg contamination in surface water samples were less than that of in groundwater samples but nevertheless severe. The presence of Hg in high concentrations in surface water may pose a significant hazard to the population of the Pavlodar area and the local ecosystem system due to known severe toxicity of Hg species, particularly due to the potential formation of extremely toxic MeHg under anoxic conditions and its subsequent bioaccumulation.

3.4. PTEs in Soils and Sediments

In order to evaluate the level of contamination in the study area by other selected PTEs, total concentrations of PTEs were compared to MPCs from Canada (Table 2, [42]). The comparison of levels of selected PTEs with MPCs from Canada defined for residential zones showed PTE concentrations exceeding MPCs in some cases: specifically for As (5 of 70 samples), Ba (2 of 70 samples), Co (1 of 70 samples), Cu (5 of 70 samples), Mn (20 of 70 samples), Ni (2 of 70 samples), and Se (1 of 70 samples). In contrast, concentrations for Cd, Cr, Pb, Sb, and Zn were systematically lower than the MPCs of Canadian regulations for urban areas. The comparison of the results for the samples collected in the CAP impacted zone with MPCs from Canada for industrial areas showed PTE concentrations exceeding MPCs for: Cu (3 samples), Mn (1 sample), and Se (1 sample). Average PTEs concentrations in soil samples (mg/kg, Table 3), were also below the Canadian MPCs for urban and industrial areas for all PTEs. These results further support that there is no overall significant impact of past or ongoing anthropogenic activities on the level of selected PTEs in sampled soils. It should be noted that although MPCs from Kazakhstan soil regulations (Table 2 [43]) were presented, they were not used for comparison purposes as the stated limits are exceptionally low (e.g., 2 mg/kg for As, which is considerably lower than residential (30 mg/kg) and industrial (50 mg/kg) MPCs from Canada) and their supporting scientific basis could not be found.
An inter-elemental relationship between selected PTEs was investigated via Pearson correlation analysis (Table 6). The concentrations of 11 of 13 selected PTEs correlated with other (exceptions: Hg and Se). Taking into consideration the findings above, this correlation is possibly due to the common effect of certain soil properties (e.g., pH, OM, oxydo-reduction potential) on the retention and mobility of metals of geogenic origin as cations in soil. Hg and Se may be exceptions as Hg come from an anthropogenic source and Se species are anionic.
Shapiro-Wilk’s normality test along with Q-Q plots and histograms were used to reveal outliers to identify possible hotspots with excess concentrations of PTEs (Table 4). The data were not normally distributed and heavy-tailed relative to a normal distribution for all examined PTEs, as also supported by skewness and kurtosis (Table 3). This analysis identified several potential hotspots (1 for Hg as previously discussed, 2 for Cd, 3 for Cu, 1 for Mn, 1 for Ni, 3 for Pb, 1 for Se). These sampling locations are highly concerning in terms of their high PTE concentrations and thus should be later investigated for the potential presence of localized contamination.

3.5. Comparison of Hg Contamination with Literature

The comparison of the results presented in the current study with the literature on the area indicated that Hg contamination in the Pavlodar region is still a pressing issue. A thorough evaluation of the literature on Hg contamination in the Pavlodar region has been provided in our previous study [20] and is also summarized in Table 7. The range for soil Hg concentrations in the current study is close to the values reported by Ullrich et al. [19] (Hg concentrations in soil samples around Lake Balkyldak ranged from 0.22 to 5.7 mg/kg). However, the Hg content in sediments in the present study is lower than in the previous study, where sampling was conducted in August 2001, and Hg concentrations were up to 617 mg/kg in Lake Balkyldak sediments [19]. It is important to emphasize that for the present study, it was not possible to collect samples directly on the territory of the former CAP due to access limitations. Consequently, the results presented by the current study could be in average lower than those published by the others [23,38,45]. Regarding aqueous samples, the level of contamination in surface water and groundwater samples is higher in the current study (Table 7), possibly due to the effect of extremely high concentrations of Hg in some samples collected in October 2018 on average values.
Several studies worldwide have investigated the impact of CAPs with Hg-cell technology on the environmental compartments (e.g., on soil, sediments, water). Table 8 summarizes findings from selected relevant global Hg contamination cases caused by CAPs, including the current case. The discharge from the CAPs in the listed cases was lower than the case of Pavlodar (estimated total around 1000 t of Hg). Overall, the level of contamination in the current study seems more severe as indicated by generally higher Hg concentrations in the environmental compartments reviewed above. One interesting point was that operation of CAPs in Italy in 1958–2003 and Spain in 1949–2017 caused the main episodes of Hg pollution of the riverbed material. The THg in the sedimentary cores in Augusta Bay, Italy, reported by Falciglia et al. [46] and Romano et al. [47] were generally much higher than values obtained in the current study. Similarly, high concentration values of Hg were reported by Esbri et al. [48] and Palanques et al. [49] for soils (up to 640 mg/kg) and sediments in the vicinity of the former CAP located in Flix, Spain, exceeding the concentrations reported in the current study. Given the fact that resuspension of sediments (e.g., in spring) in rivers may lead to sediment transport and a subsequent decline in Hg concentrations over time, such high concentrations of Hg may be surprising. That being said, the aforementioned cases in Italy and Spain are newer contamination cases (i.e., CAPs seized their operation much more recently), which may explain larger concentrations. Furthermore, we didn’t employ core sediment sampling in the present study and only sampled from the surface, therefore sample types are different. Finally, the reviewed studies show that Hg from CAPs can accumulate in different species from biota (e.g., from lichens [48] and pine trees [50] to oysters [51] and fish [52]), which was not investigated in the present study but has been demonstrated by previous work on Pavlodar CAP area (see the review of Guney et al. [20]).
Regarding soils and sediments, in contrary to the cases mentioned above, the Hg concentrations (0.1–10.4 mg/kg in soils, 0.1–14.4 mg/kg in sediments) of the Botafogo River, Brazil reported by Araujo et al. [52,66] were generally lower than those in the present study. The operation of the CAP in the case of Brazil from 1963 to 1987 caused severe Hg contamination as a result of the uncontrolled discharge into the Botafogo River. Other reviewed Hg pollution episodes occurred in New Brunswick, Canada, and Rm Valcea, Romania. The Hg concentration values reported by Bravo et al. [8,62], Walker [63], and Garron et al. [64] in surface waters and sediments in the vicinity of the reservoir (Rm Valcea, Romania), and the former CAP (Canada) were generally lower than those reported in the current study, highlighting the severity of Hg contamination in the current case.

3.6. Contamination in CAP-Affected Area vs. Nearby Urban Zone

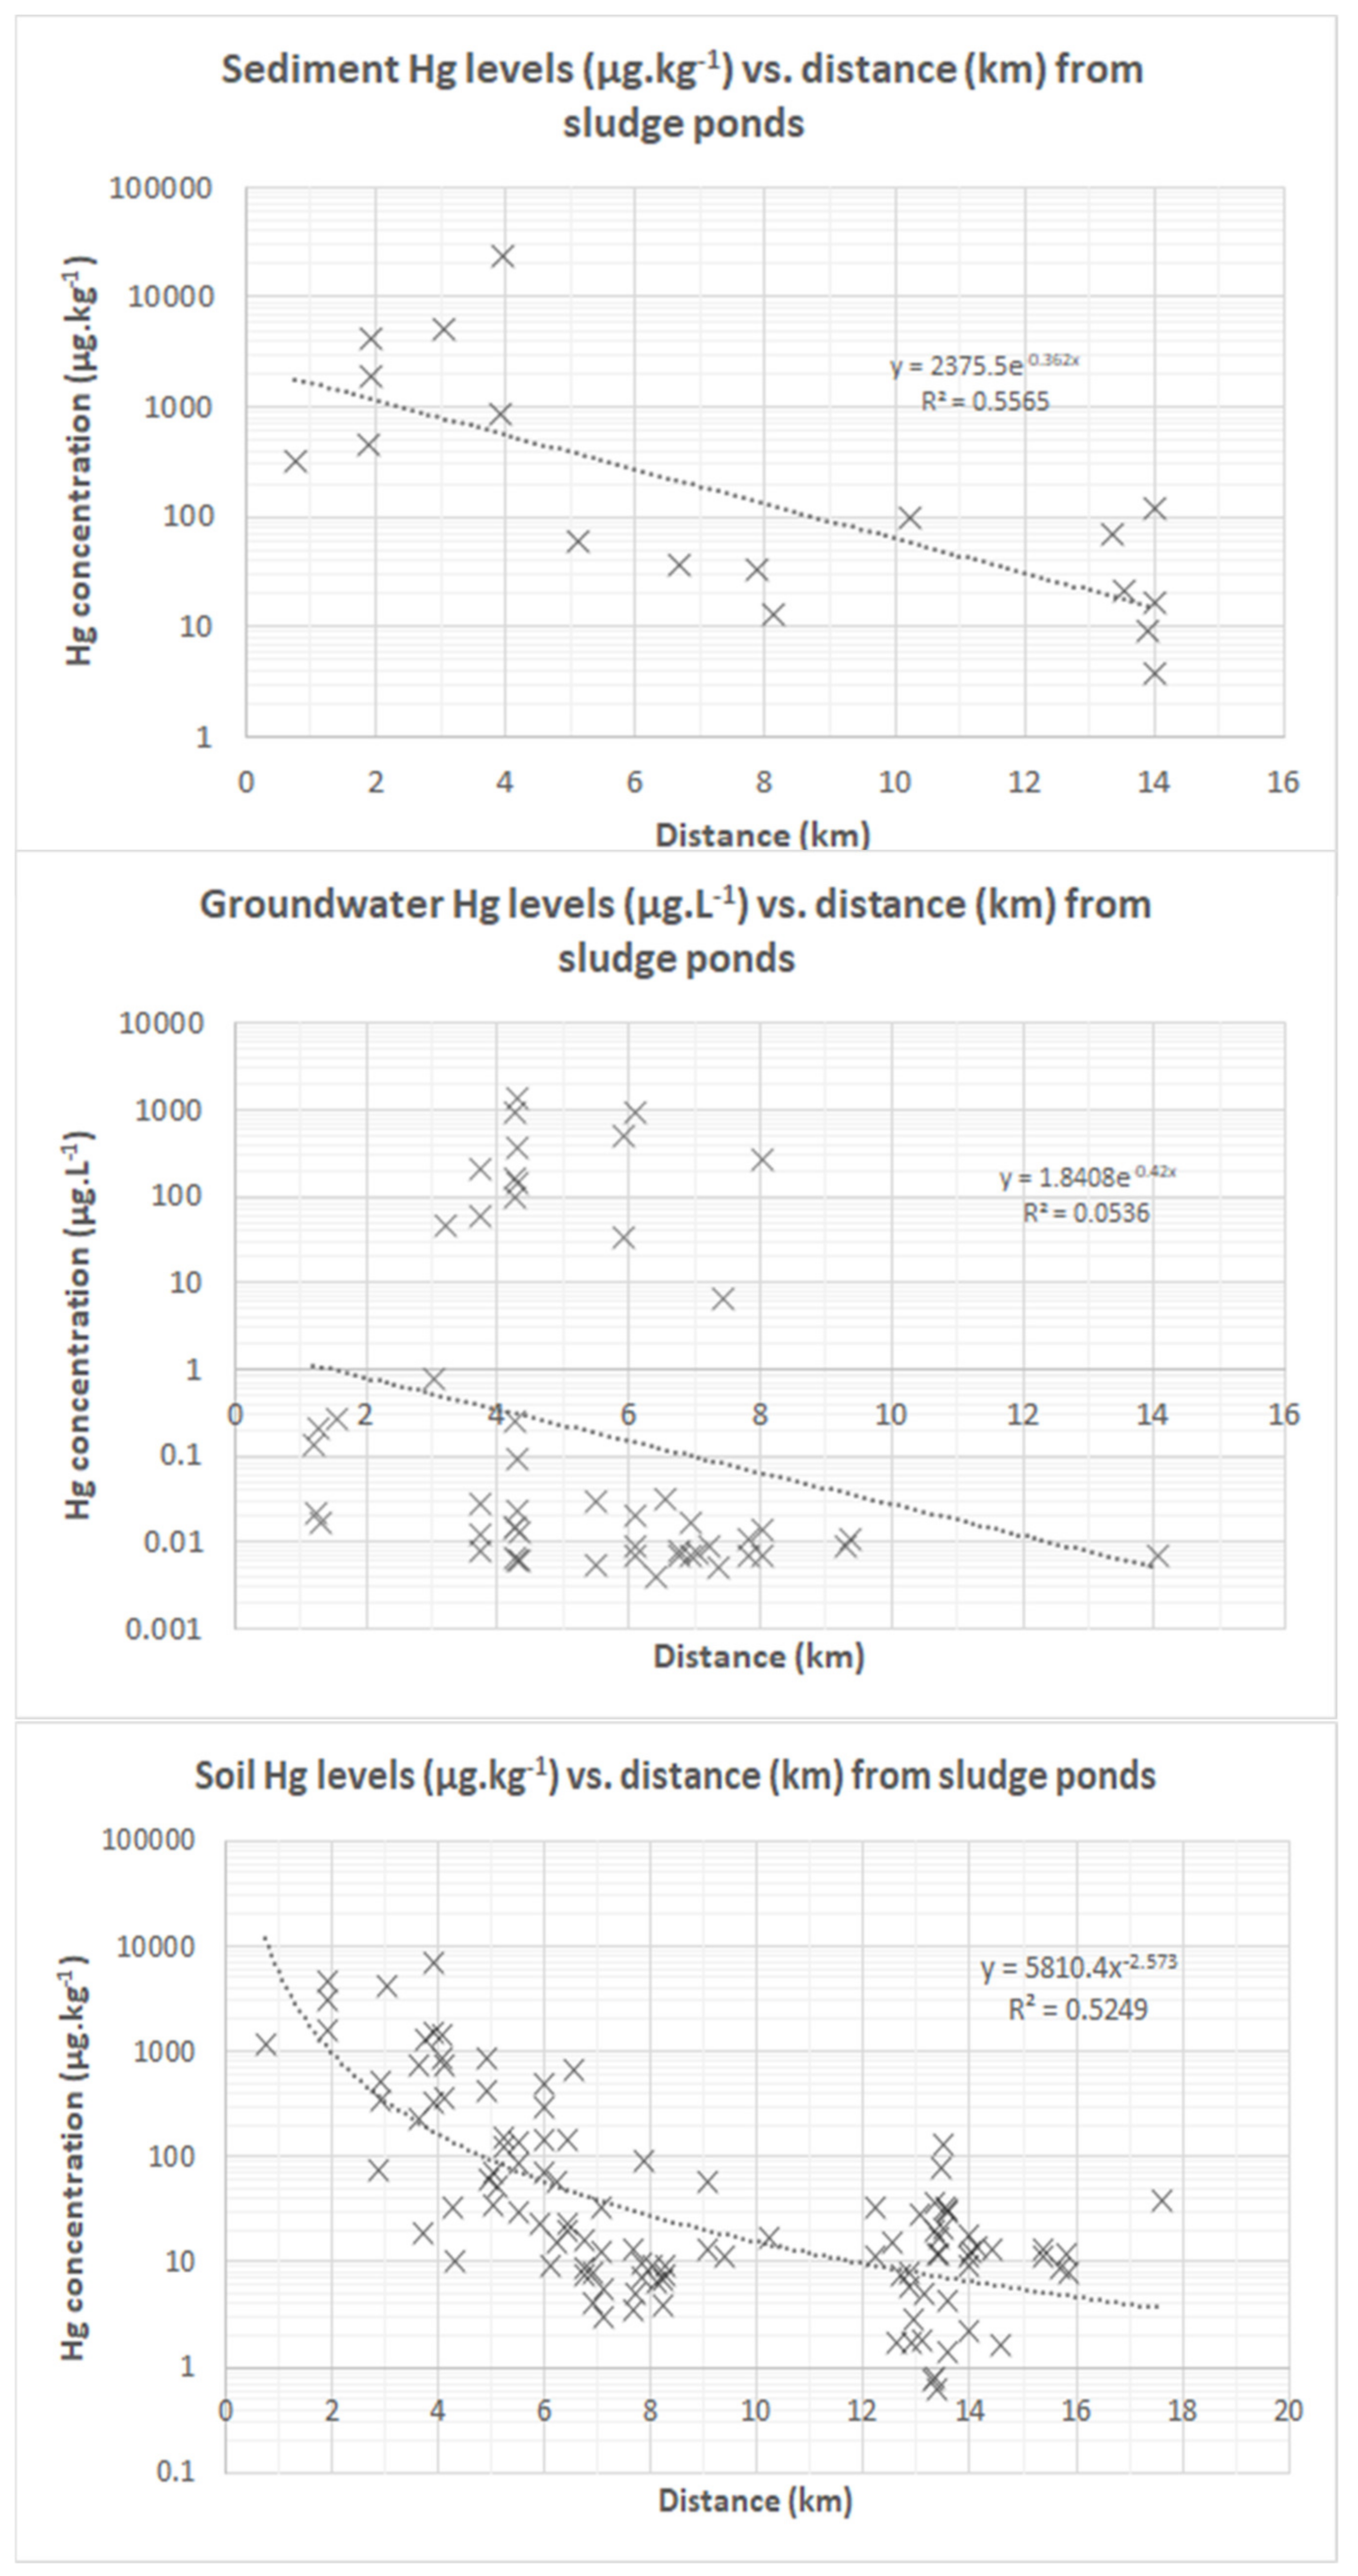
3.6.1. Effect of Distance from Source on Hg Contamination Level

For soils and sediments, it is reasonable to expect that higher Hg levels would be measured in samples collected closer to the source of Hg contamination. Figure 6 displays the relationship between Hg levels in different media and the distance of sampled locations from the sludge disposal ponds (at N 52.406157, E 76.926458). A negative correlation between Hg concentrations and distances from the source was found for both soils and sediments with power fit (R2 = 0.525) and exponential fit (R2 = 0.557) equations, respectively. The power fit equation for soil Hg levels yields a distance of 1.49 km when solved for the national MPC (2.1 mg/kg for soil), and the measured Hg concentration values fall below the MPC limit at around 4 km mark. National guidelines for Hg concentrations in sediments are not available, thus Hg levels were compared to Canada interim sediment quality guidelines for freshwater sediments: 0.17 mg/kg [67]. Solving the exponential equation for sediments for the Canadian limit yields a 7.29 km distance, whereas the measured Hg levels dip below the limit close to the 4 km mark. Finally, Hg levels in groundwater shows no significant relationship to distance (the best fit curve—exponential with R2 = 0.054).

3.6.2. Contamination by Hg and Other PTEs in Affected Area vs. Urban Zone

The closest settlement possibly affected by Hg emissions from the former CAP is Pavlodar city since the CAP site is located on the northern border of the city and is around 10 km away from the city center. To assess if Hg levels in the urban area are within the regulation limits, average Hg concentrations in soils, groundwater, and surface waters in locations south of the sludge disposal ponds were calculated. Moreover, the area within the 4 km buffer zone around the sludge ponds was excluded from urban Hg levels calculation. The average Hg concentrations in urban soils (n = 43, 18 μg/kg), groundwater (n = 1, 0.007 μg/L), and water samples from the city section of the Irtysh River (n = 7, 0.004 μg/L) were below the national standards. In contrast, the average Hg concentrations in soils, groundwater, and surface waters within the buffer zone of sludge ponds were as follows: 510 μg/kg in soils (n = 68), 97 μg/L in groundwater (n = 52), and 370 μg/L in river water (n = 2), which significantly exceeds the Hg levels in the samples collected in urban locations
Previously reported Hg levels in urban soils ranged 0.08–0.57 mg/kg, with Hg concentrations averaging 3.51 mg/kg and rising to 18.96 mg/kg in the northern industrial part of the region [45]. Moreover, Ullrich et al. [19] reported an average of 2.65 mg of Hg/kg (0.22–5.72 mg/kg) in the topsoil around Lake Balkyldak and 0.127–0.321 mg of Hg/kg in the topsoil of the river section located north of the city area. Although soil Hg concentrations in the city are below the national limit and significantly lower than those in the CAP-affected in both literature and this study, the previously reported average Hg levels substantially exceed the levels measured in this study. In contrast, Hg concentrations in groundwater (<5 ng/L) sampled in a village in the region and the Irtysh River water (<2 ng/L) [19] have been lower than the levels reported for CAP-affected area in the present study.
In order to evaluate the relationship between the distance from the former CAP and the level of contamination by selected PTEs, two-sample t-test with unequal variance has been used (Table 9). The two categories of samples according to the proximity to the area of the nearest settlement (Pavlodar region) were CAP impacted zone (n = 169) and urban (n = 57). The two-sample t-test revealed a significant difference between Hg concentrations in nearby urban area and the CAP impacted zone. The test revealed no significant difference between the concentrations of other PTEs in both areas except for Cd. This, in combination with the findings from Section 3.5, indicates that former and ongoing industrial activities seem not to exhibit an overall significant impact on the other selected PTE levels in the soils of the urban area, with the exception of Cd.

4. Conclusions and Recommendations

The present study investigated soil, sediment, surface water, and groundwater contamination by 13 selected PTEs including mercury (Hg) in Pavlodar region (North Kazakhstan) around a former Hg-cell chlor-alkali plant (CAP) operated in the second half of the 20th century. A comparison of the results with the maximum permissible concentration (MPC) for Hg indicated acceptable concentrations in the majority of samples along with very high concentrations in several soils and sediments from CAP impacted zone. Surface water and groundwater samples also had similar characteristics where the majority of samples complied with the national MPC for drinking water with the exception of numerous highly contaminated samples from the impacted zone. Groundwater was pollution was more problematic than the pollution in surface waters. These results indicated the ongoing presence of Hg long after the CAP seized its activities and remediation actions implemented on the territory of the former CAP, accompanied by potential ecological and human health risks. A comparison of other selected PTE concentrations in soils to MPCs indicated elevated concentrations of As, Ba, Co, Cu, Mn, Ni, and Se in some samples, although a large majority of samples complied with the regulatory values for both urban and industrial areas. These results indicated no overall significant impact of anthropogenic activities on the area, although some hotspots were identified which may need further investigation. Regarding the nearby urban zone, average Hg levels complied with the national MPCs and were lower than those in the CAP-impacted area. Similarly, other selected PTEs were mostly within acceptable limits in the urban zone. A comparison of the results of the present study with the literature on the region indicated that contamination being slightly lower than it was in the past. However, due to inaccessibility to the actual territory of the former CAP in the present study, the dynamics of PTEs contamination in the environment at the source of the pollution for the present is still incomplete. The findings presented in this study is an important record for contaminated sites history of the Central Asian region. The study limitations include the following: It was not possible to collect environmental samples directly from the former CAP territory, which has been previously reported to contain extreme Hg contamination hotspots and might be expected to still contain excess concentrations of Hg particularly in soil. Furthermore, the accumulation of Hg in biota was not investigated, which is expected to be another major concern. Further investigations in the region are highly recommended as there is still lack of relevant up-to-date follow-up studies in the CAP territory. Moreover, given the current contamination levels, a detailed human health risk assessment based on the comprehensive site characterization is highly recommended to properly identify potential human health risks.

Supplementary Materials

The following are available online at https://www.mdpi.com/article/10.3390/su132413829/s1, Table S1. Total concentrations of Hg (average [mg/kg] ± relative standard deviation (RSD) [%]) in soils and sediments; Table S2. Total concentration of Hg (average [mg/L]) and selected characteristics in soils and sediments; Table S3. Total concentration of Hg (average [mg/L]) and selected characteristics in groundwater; Table S4. Total concentration of Hg (average [mg/kg]) and selected characteristics in surface waters; Table S5. Total concentrations of selected PTEs (average [mg/kg] ± RSD [%]) in soils; Table S6. Limits of detection (DL, ppm) for collected samples for ICP-MS analyses; Table S7. Certified reference materials testing results for ICP-MS analyses.

Author Contributions

Conceptualization: M.G., A.K., F.K. and V.I.; Data curation, M.G., Z.A., A.K., S.K. and A.G.; Formal analysis, Z.A., A.K., S.K. and A.G.; Funding acquisition, M.G., F.K. and V.I.; Investigation, Z.A., A.K., S.K. and A.G.; Methodology, M.G., Z.A. and A.G.; Project administration, M.G. and F.K.; Resources, M.G. and V.I.; Supervision, V.I.; Validation, M.G.; Visualization, Z.A. and A.K.; Writing—original draft, Z.A., A.K. and S.K.; Writing—review & editing, M.G. and F.K. All authors have read and agreed to the published version of the manuscript.

Funding

The present research was supported by Nazarbayev University Faculty Development Competitive Research Grant Program (FDCRGP) (Funder Project Reference: 090118FD5319). The article processing charge was funded by Nazarbayev University Social Policy Grant (SPG) Program.

Conflicts of Interest

The authors declare that they have no known competing financial interest or personal relationship that could have appeared to influence the work reported in this paper.

References

  1. UNEP (United Nations Environment Programme). Study on the Possible Effects on Human Health and the Environment in Asia and the Pacific of the Trade of Products Containing Lead, Cadmium and Mercury; United Nations Environment Programme: Geneva, Switzerland, 2011. [Google Scholar]
  2. WHO (World Health Organization). Preventing Disease through Healthy Environments Exposure to Mercury: A Major Public Health Concern. 2007. Available online: https://apps.who.int/iris/handle/10665/340687 (accessed on 13 December 2021).
  3. Pirrone, N.; Cinnirella, S.; Feng, X.; Finkelman, R.B.; Friedli, H.R.; Leaner, J.; Mason, R.; Mukherjee, A.B.; Stracher, G.B.; Streets, D.G.; et al. Global mercury emissions to the atmosphere from anthropogenic and natural sources. Atmospheric Chem. Phys. Discuss. 2010, 10, 5951–5964. [Google Scholar] [CrossRef] [Green Version]
  4. Biester, H.; Müller, G.; Schöler, H. Estimating distribution and retention of mercury in three different soils contaminated by emissions from chlor-alkali plants: Part I. Sci. Total Environ. 2002, 284, 177–189. [Google Scholar] [CrossRef]
  5. Bose-O’Reilly, S.; McCarty, K.M.; Steckling, N.; Lettmeier, B. Mercury Exposure and Children’s Health. Curr. Probl. Pediatr. Adolesc. Health Care 2010, 40, 186–215. [Google Scholar] [CrossRef] [Green Version]
  6. USEPA (United States Environmental Protection Agency). Exposure Factors Handbook: 2011 Edition. 2001. Available online: https://cfpub.epa.gov/ncea/iris2/chemicalLanding.cfm?&substance_nmbr=73 (accessed on 13 December 2021).
  7. Guney, M.; Welfringer, B.; de Repentigny, C.; Zagury, G.J. Children’s Exposure to Mercury-Contaminated Soils: Exposure Assessment and Risk Characterization. Arch. Environ. Contam. Toxicol. 2013, 65, 345–355. [Google Scholar] [CrossRef]
  8. Bravo, A.G.; Cosio, C.; Amouroux, D.; Zopfi, J.; Chevalley, P.-A.; Spangenberg, J.E.; Ungureanu, V.-G.; Dominik, J. Extremely elevated methyl mercury levels in water, sediment and organisms in a Romanian reservoir affected by release of mercury from a chlor-alkali plant. Water Res. 2014, 49, 391–405. [Google Scholar] [CrossRef] [PubMed]
  9. Tang, Z.; Zhang, L.; Huang, Q.; Yang, Y.; Nie, Z.; Cheng, J.; Yang, J.; Wang, Y.; Chai, M. Contamination and risk of heavy metals in soils and sediments from a typical plastic waste recycling area in North China. Ecotoxicol. Environ. Saf. 2015, 122, 343–351. [Google Scholar] [CrossRef]
  10. Song, Z.; Li, P.; Ding, L.; Li, Z.; Zhu, W.; He, T.; Feng, X. Environmental mercury pollution by an abandoned chlor-alkali plant in Southwest China. J. Geochem. Explor. 2018, 194, 81–87. [Google Scholar] [CrossRef]
  11. Stewart, A.J.; Smith, J.G.; Loar, J.M. Long-Term Water-Quality Changes in East Fork Poplar Creek, Tennessee: Background, Trends, and Potential Biological Consequences. Environ. Manag. 2011, 47, 1021–1032. [Google Scholar] [CrossRef]
  12. Nieder, R.; Benbi, D.K.; Reichl, F.X. Role of Potentially Toxic Elements in Soils. In Soil Components and Human Health; Springer: Berlin/Heidelberg, Germany, 2018; pp. 375–450. [Google Scholar] [CrossRef]
  13. Ahmed, I.; Iqbal, H.M.N.; Dhama, K. Enzyme-Based Biodegradation of Hazardous Pollutants—An Overview. J. Exp. Biol. Agric. Sci. 2017, 5, 402–411. [Google Scholar] [CrossRef]
  14. Bilal, M.; Rasheed, T.; Iqbal, H.M.; Yan, Y. Peroxidases-assisted removal of environmentally-related hazardous pollutants with reference to the reaction mechanisms of industrial dyes. Sci. Total Environ. 2018, 644, 1272–1279. [Google Scholar] [CrossRef] [PubMed]
  15. UNEP. Global Mercury. Supply, Trade, and Demand; UNEP: Geneva, Switzerland, 2017. [Google Scholar]
  16. WCC (World Chlorine Council). Reporting On Mercury Use—World Chlorine Council; WCC: Brussels, Belgium, 2021. [Google Scholar]
  17. Kanibolotskaya, Y.; Listkov, W.; Shmidt, N. Heavy metals in soil and plants (Agropyron pectiniforme Roem. Et Schult.) of the Pavlodar region (Kazakhstan). In Proceedings of the IOP Conference Series: Earth and Environmental Science, Barnaul, Russia, 19–20 April 2019; Volume 395, p. 012037. [Google Scholar]
  18. Randall, P.; Ilyushchenko, M.; Lapshin, E.; Kuzmenko, L. Case Study: Mercury Pollution near a Chemical Plant in Northern Kazakhstan; EM: Air and Waste Management Association’s Magazine for Environmental Managers, (FEB): Pittsburgh, PA, USA, 2006. [Google Scholar]
  19. Ullrich, S.M.; Ilyushchenko, M.A.; Kamberov, I.M.; Tanton, T.W. Mercury contamination in the vicinity of a derelict chlor-alkali plant. Part I: Sediment and water contamination of Lake Balkyldak and the River Irtysh. Sci. Total Environ. 2007, 381, 1–16. [Google Scholar] [CrossRef] [PubMed]
  20. Guney, M.; Akimzhanova, Z.; Kumisbek, A.; Beisova, K.; Kismelyeva, S.; Satayeva, A.; Inglezakis, V.; Karaca, F. Mercury (Hg) Contaminated Sites in Kazakhstan: Review of Current Cases and Site Remediation Responses. Int. J. Environ. Res. Public Health 2020, 17, 8936. [Google Scholar] [CrossRef]
  21. Guney, M.; Kumisbek, A.; Akimzhanova, Z.; Kismelyeva, S.; Beisova, K.; Zhakiyenova, A.; Inglezakis, V.; Karaca, F. Environmental Partitioning, Spatial Distribution, and Transport of Atmospheric Mercury (Hg) Originating from a Site of Former Chlor-Alkali Plant. Atmosphere 2021, 12, 275. [Google Scholar] [CrossRef]
  22. Ilyushchenko, M.A.; Daukeyev, G.B.; Tanton, T.W. Post-containment Management and Monitoring of Mercury Pollution in Site of Former PO “Khimprom” and Assessment of Environmental Risk Posed by Contamination of Groundwater and Adjacent Water Bodies of the Northern Industrial Area of Pavlodar. Almaty. 2011. Available online: http://hgpavlodar.narod.ru/ (accessed on 13 December 2021).
  23. Woodruff, S.; Dack, S. Analysis of risk from mercury contamination at the Khimprom Plant in Kazakhstan. Land Contam. Reclam. 2004, 12, 213–218. [Google Scholar] [CrossRef]
  24. Goldman, L.R.; Shannon, M.W. The committee on environmental health technical report: Mercury in the environment: Implications for pediatricians. Pediatrics 2001, 108, 197–205. [Google Scholar] [CrossRef] [PubMed] [Green Version]
  25. Kajenthira, A.; Holmes, J.; McDonnell, R. The role of qualitative risk assessment in environmental management: A Kazakhstani case study. Sci. Total Environ. 2012, 420, 24–32. [Google Scholar] [CrossRef] [PubMed]
  26. Bureau of National Statistics. Agency for Strategic Planning and Reforms of the Republic of Kazakhstan Main Socio-Economic Indicators. 2021. Available online: https://stat.gov.kz/region/263009 (accessed on 13 December 2021).
  27. Peel, M.C.; Finlayson, B.L.; McMahon, T.A. Updated world map of the Köppen-Geiger climate classification. Hydrology and Earth System Sciences Discussions. Eur. Geosci. Union 2007, 11, 1633–1644. [Google Scholar] [CrossRef] [Green Version]
  28. FAO (Food and Agriculture Organization of the United Nations). FAO/UNESCO Soil Map of the World: Central Asia. 1992. Available online: http://www.fao.org/soils-portal/soil-survey/soilmaps-and-databases/faounesco-soil-map-of-the-world/en/ (accessed on 13 December 2021).
  29. Mitra, S.; Patnaik, P.; Kebbekus, B.B. Environmental Chemical Analysis, 2nd ed.; CRC Press: Boca Raton, FL, USA, 2005. [Google Scholar]
  30. Semenova, Y.; Zhunussov, Y.; Pivina, L.; Abisheva, A.; Tinkov, A.; Belikhina, T.; Skalny, A.; Zhanaspayev, M.; Bulegenov, T.; Glushkova, N.; et al. Trace element biomonitoring in hair and blood of occupationally unexposed population residing in polluted areas of East Kazakhstan and Pavlodar regions. J. Trace Elem. Med. Biol. 2019, 56, 31–37. [Google Scholar] [CrossRef]
  31. ASTM (American Society for Testing and Materials). Section D4972–95a, Standard Test Method for pH of Soils; ASTM (American Society for Testing and Materials): West Conshohocken, PA, USA, 1995. [Google Scholar]
  32. ASTM. Section D1293–99, Standard Test Method for pH of Water; ASTM: West Conshohocken, PA, USA, 2005. [Google Scholar]
  33. Lumex Marketing. RA-915M Mercury Analyzer. Operation Manual; “Lumex-Marketing” LLC: Saint Petersburg, Russia, 2005. [Google Scholar]
  34. McLean, J.E.; Bledsoe, B.E. Behavior of Metals in Soils; Office of Research and Development: Washington, DC, USA, 1992; EPA/540/S-92-018. [Google Scholar]
  35. O’Connor, D.; Hou, D.; Ok, Y.S.; Mulder, J.; Duan, L.; Wu, Q.; Wang, S.; Tack, F.M.G.; Rinklebe, J. Mercury speciation, transformation, and transportation in soils, atmospheric flux, and implications for risk management: A critical review. Environ. Int. 2019, 126, 747–761. [Google Scholar] [CrossRef]
  36. Wang, X.; Li, Y.; Chen, Y.; Lian, J.; Luo, Y.; Niu, Y.; Gong, X. Spatial pattern of soil organic carbon and total nitrogen, and analysis of related factors in an agro-pastoral zone in Northern China. PLoS ONE 2018, 13, e0197451. [Google Scholar] [CrossRef] [PubMed] [Green Version]
  37. Wyszkowski, M.; Kosiorek, M. Content of organic carbon, total nitrogen and available forms of macronutrients in soil contaminated with cobalt. J. Elem. 2012, 22, 1427–1437. [Google Scholar] [CrossRef]
  38. Panda, K.K.; Lenka, M.; Panda, B.B. Monitoring and assessment of mercury pollution in the vicinity of a chloralkali plant I. Distribution, availability and genotoxicity of sediment mercury in the Rushikulya estuary, India. Sci. Total Environ. 1990, 96, 281–296. [Google Scholar] [CrossRef]
  39. Basak, B.; Alagha, O. Trace metals solubility in rainwater: Evaluation of rainwater quality at a watershed area, Istanbul. Environ. Monit. Assess. 2009, 167, 493–503. [Google Scholar] [CrossRef] [PubMed]
  40. USEPA. Indicators: Conductivity. US EPA. 2016. Available online: https://www.epa.gov/national-aquatic-resource-surveys/indicators-conductivity (accessed on 13 December 2021).
  41. hrwc.org. Conductivity. 2013. Available online: https://www.hrwc.org/wp-content/uploads/2013/09/Conductivity.pdf (accessed on 13 December 2021).
  42. MDDELCC (Ministere du Developpement Durable, Environnement et Lutte Contre les Changements Climatiques du Quebec). Annex 2: Tableau 1: Politique Deprotection des Sols et de Réhabilitation des Terrains Contaminés. 2019. Available online: http://www.environnement.gouv.qc.ca/sol/terrains/guide-intervention/annexe2.pdf (accessed on 13 December 2021).
  43. MEPRK (Ministry of Environmental Protection of the Republic of Kazakhstan). The Norms of Maximum Permissible Concentrations of Hazardous Substances, Organisms and Other Biological Substances Polluting the Soil; Consignment Order No. 99 of the Ministry of Health of the Republic of Kazakhstan and No. 21 of the MEPRK, Astana, Kazakhstan; MEPRK (Ministry of Environmental Protection of the Republic of Kazakhstan): Astana, Kazakhstan, 2004. [Google Scholar]
  44. Vetrimurugan, E.; Brindha, K.; Elango, L.; Ndwandwe, O.M. Human exposure risk to heavy metals through groundwater used for drinking in an intensively irrigated river delta. Appl. Water Sci. 2017, 7, 3267–3280. [Google Scholar] [CrossRef] [Green Version]
  45. Panin, M.S.; Geldymamedova, E.A. Ecological and geochemical characteristics of the soils of Pavlodar of the Republic of Kazakhstan (Rus). Vestn. TSU 2006, 292, 171–177. [Google Scholar]
  46. Falciglia, P.P.; Malarbi, D.; Roccaro, P.; Vagliasindi, F. Innovative thermal and physico-chemical treatments for the clean-up of marine sediments dredged from the Augusta Bay (Southern Italy). Reg. Stud. Mar. Sci. 2020, 39, 101426. [Google Scholar] [CrossRef]
  47. Romano, E.; Bergamin, L.; Croudace, I.W.; Pierfrancheschi, G.; Sesta, G.; Ausili, A. Measuring anthropogenic impacts on an industrialised coastal marine area using chemical and textural signatures in sediments: A case study of Augusta Harbour (Sicily, Italy). Sci. Total Environ. 2020, 755, 142683. [Google Scholar] [CrossRef] [PubMed]
  48. Esbri, J.M.; Lopez-Berdonces, M.A.; Fernandez-Calderon, S.; Higueras, P.; Diez, S. Atmospheric mercury pollution around a chlor-alkali plant in Flix (NE Spain): An integrated analysis. Environ. Sci. Pollut. Res. 2014, 22, 4842–4850. [Google Scholar] [CrossRef] [PubMed]
  49. Palanques, A.; Grimalt, J.; Belzunces, M.; Estrada, F.; Puig, P.; Guillen, J. Massive accumulation of highly polluted sedimentary deposits by river damming. Sci. Total Environ. 2014, 497–498, 369–381. [Google Scholar] [CrossRef] [PubMed]
  50. Navrátil, T.; Nováková, T.; Shanley, J.B.; Rohovec, J.; Vaňková, M. Distribution and pools of mercury in forest soils near recent and historical mercury emission sources in the central Czech Republic. J. Geochem. Explor. 2021, 226, 106782. [Google Scholar] [CrossRef]
  51. Araujo, P.R.M.; Biondi, C.M.; Nascimento, C.W.A.; Silva, F.B.V. Bioavailability and sequential extraction of mercury in soils and organisms of a mangrove contaminated by a chlor-alkali plant. Ecotoxicol. Environ. Saf. 2019, 183, 109469. [Google Scholar] [CrossRef] [PubMed]
  52. Chen, L.; Zhang, X.; Cao, M.; Pan, Y.; Xiao, C.; Wang, P.; Liang, Y.; Liu, G.; Cai, Y. Release of legacy mercury and effect of aquaculture on mercury biogeochemical cycling in highly polluted Ya-Er Lake, China. Chemosphere 2021, 275, 130011. [Google Scholar] [CrossRef]
  53. Ilyushchenko, M.A.; Uskov, G.A.; Zyryanova, N.A. Mercury (Hg) contamination of fish fauna of Balkyldak technical pond. KazNU Sci. J. Environ. Ser. 2002, 11, 102–105. (In Russian) [Google Scholar]
  54. Ilyushchenko, M.A.; Randall, P.M.; Tanton, T.W.; Akhmetov, A.D.; Lapshin, E.V.; Kamberov, R.I. 99e Activities for Prevention the Threat of River Irtysh Mercury Pollution in. 2005. Available online: http://Hg-Pavlodar.narod.ru (accessed on 13 December 2021).
  55. Ullrich, S.M.; Ilyushchenko, M.A.; Tanton, T.W.; Uskov, G.A. Mercury contamination in the vicinity of a derelict chlor-alkali plant: Part II: Contamination of the aquatic and terrestrial food chain and potential risks to the local population. Sci. Total Environ. 2007, 381, 290–306. [Google Scholar] [CrossRef]
  56. Shaimardanova, B.H.; Korogod, N.P.; Bigaliyev, A.B.; Assylbekova, G.E. Heavy Metals Accumulation in Children Hair. Novosib. State Univ. Bulletin. Ser. Biol. Clin. Med. 2009, 8, 107–111. (In Russian) [Google Scholar]
  57. Shakhova, T.S.; Talovskaya, A.V.; Yazikov, E.G.; Filimonenko, E.A.; Lyapina, E.E. Evaluation of mercury contamination in the vicinity of enterprises of the petrochemical complex in the winter period (based on the example of Pavlodar, Republic of Kazakhstan). Bull. Tomsk. Polytech. University. Geo Assets Eng. 2016, 327, 16–25. (In Russian) [Google Scholar]
  58. Nilson, S.; Costa, M.F.; Akagi, H. Total and methylmercury levels of a coastal human population and of fish from the Brazilian northeast. Environ. Pollut. Sci. Res. 2001, 8, 280–284. [Google Scholar] [CrossRef]
  59. Tamburrino, S.; Passaro, S.; Barsanti, M.; Schirone, A.; Delbono, I.; Conte, F.; Delfanti, R.; Bonsignore, M.; Del Core, M.; Gherardi, S.; et al. Pathways of inorganic and organic contaminants from land to deep sea: The case study of the Gulf of Cagliari (W Tyrrhenian Sea). Sci. Total Environ. 2019, 647, 334–341. [Google Scholar] [CrossRef]
  60. Manta, D.S.; Bonsignore, M.; Oliveri, E.; Barra, M.; Tranchida, G.; Giaramita, L.; Mazzola, S.; Sprovieri, M. Fluxes and the mass balance of mercury in Augusta Bay (Sicily, southern Italy). Estuar. Coast. Shelf Sci. 2016, 181, 134–143. [Google Scholar] [CrossRef]
  61. Fernandez-Martinez, R.; Esbri, J.M.; Higueras, P.; Rucandio, I. Comparison of mercury distribution and mobility in soils affected by anthropogenic pollution around chloralkali plants and ancient mining sites. Sci. Total Environ. 2019, 671, 1066–1076. [Google Scholar] [CrossRef]
  62. Bravo, A.G.; Loizeau, J.L.; Ancey, L.; Ungureanu, V.G.; Dominik, J. Historical record of mercury contamination in sediments from the Babeni Reservoir in the Olt River, Romania. Environ. Sci. Pollut. Res. 2009, 16, S66–S75. [Google Scholar] [CrossRef] [PubMed]
  63. Walker, T.R. Mercury concentrations in marine sediments near a former mercury cell chlor-alkali plant in eastern Canada. Mar. Pollut. Bull. 2016, 107, 398–401. [Google Scholar] [CrossRef] [PubMed]
  64. Garron, C.; Gagne, F.; Ernst, W.; Julien, G.; Bernier, M.; Caldwell, C. Mercury Contamination of Marine Sediments and Blue Mussels (Mytilus edulis) in the Vicinity of a Mercury Cell Chlor-Alkali Plant in Dalhousie, New Brunswick, Canada. Water Qual. Res. J. 2005, 40, 1–15. [Google Scholar] [CrossRef] [Green Version]
  65. Du, R.; Luo, X.; Huang, Y.; Chen, L.; Huang, Z.; Mao, X.; Liang, Y.; Zhang, Q.; Wang, P. Polychlorinated dibenzo-p-dioxins and dibenzofurans in lotus from a lake historically polluted by the chlor-alkali industry: Occurrence, organ distribution and health risk from dietary intake. Environ. Pollut. 2021, 292, 118395. [Google Scholar] [CrossRef]
  66. Araujo, P.R.M.; Biondi, C.M.; Nascimento, C.W.A.; Silva, F.B.V. Assessing the spatial distribution and ecologic and human health risks in mangrove soils polluted by Hg in northeastern Brazil. Chemosphere 2020, 266, 129019. [Google Scholar] [CrossRef] [PubMed]
  67. CCME (Canadian Council of Ministers of the Environment). Canadian soil quality guidelines for the protection of environmental and human health: Mercury (inorganic). In Canadian Environmental Quality Guidelines; Canadian Council of Ministers of the Environment: Winnipeg, MB, Canada, 1999. [Google Scholar]
Figure 1. Study area.
Sustainability 13 13829 g001
Figure 2. Hg in aqueous samples (2018 sampling campaign).
Sustainability 13 13829 g002
Figure 3. Hg in aqueous samples (2019 sampling campaign).
Sustainability 13 13829 g003
Figure 4. Hg in sediment samples (2018 sampling campaign).
Sustainability 13 13829 g004
Figure 5. Hg in soil samples (2018 and 2019 sampling campaigns).
Sustainability 13 13829 g005
Figure 6. Hg concentrations (sediments, groundwater, soils) vs. distance from sludge ponds.
Sustainability 13 13829 g006
Table 1. Sources, toxicity, and adverse health effects of different forms of Hg [20,24,25].
Hg FormNotesMajor SourcesToxicityAdverse
Health Effects
Elemental, Hg0Liquid or vapor at room T
(> 25 ℃)
Burning fossil fuels, chlor-alkali production, mining and smelting, incinerators, volcanoesHas little toxicity, when ingested (<0.1% is absorbed from the GI tract).
Dermal absorption—minimal exposure.
Absorbed by inhalation
Respiratory diseases.
Toxic to central and peripheral nervous system.
Toxic to nervous, digestive, and immune system.
Inorganic or IonicSalts
Hg+, Hg2+
Mercurous chloride (calomel), mercuric oxideExtremely caustic; 10% absorbedAbsorption is fatal.
Corrosive to skin, eyes, and GI system.
OrganicMeHg+, MeHg2+, EtHg+, phenylHgIndustrial compounds
Biological processes
Lipid soluble, 90–100% absorbed by GI tractHighly toxic to fetus.
Neurodevelopmental problems
Table 2. Ranges (present study) along with permissible concentrations of selected potentially toxic elements (PTEs) in soils (mg/kg) according to regulations of Canada [42] and of Kazakhstan [43].
PTERange in the Present StudyResidential Limits (Quebec, Canada)Non-Residential Limits (Quebec, Canada)National Standards (Kazakhstan)
Hg0.00063–242102.1
0.000004–1.4 *--0.0005 *
As0.22–3730502
Ba77–5405002000-
Cd0.0012–2.55200.5
Co7.2–57503005
Cr0.61–1502508006
Cu13–139010050033
Mn93–8170100022001500
Ni0.096–1201005004
Pb11–280500100032
Sb1.1–1.131-4.5
Se0.60–21310-
Zn1.5–290500150023
* Permissible concentrations of Hg in water and groundwater (mg/L).
Table 3. Summary of concentrations of Hg (soils, sediments, and water) and other PTEs (soils and sediments) with selected descriptive statistics (mg/kg).
PTEMediumAverageStandard DeviationMin25th Percentile50th Percentile75th Percentile90th PercentileMaxSkewnessKurtosis
Hgsoils, sediments0.562.30.000630.00920.0210.141.2248.381
Hgsurface water, groundwater0.0930.264.00 × 10−67.00 × 10−61.70 × 10−50.00030.171.33.415
Assoils, sediments12130.220.220.222430370.36−1.6
Basoils, sediments270110771802503604205400.25−0.69
Cdsoils, sediments0.30.320.00120.140.240.410.562.54.832
Cosoils, sediments217.97.216202429571.85.8
Crsoils, sediments69470.610.6481100120150−0.311.9
Cusoils, sediments94240132836457713904.520
Mnsoils, sediments870980934306901070147081706.347
Nisoils, sediments50220.096394961741200.391.5
Pbsoils, sediments364711192431552804.117
Sbsoils, sediments1.10.021.11.11.11.11.11.10.76−0.085
Sesoils, sediments0.60.010.60.60.60.60.60.60.210.04
Znsoils, sediments77911.51.41.51302202900.77−0.69
Table 4. Results for Shapiro-Wilk test and outlier points with PTE concentrations in soils and Hg concentrations in sediments.
PTEp-ValueWDistributionOutlier Points (Concentration in mg/kg)
Hg0.0070.235Non-normalP-Sed-04 (24.1)
As0.0000.779Non-normal-
Ba0.1640.975Non-normal-
Cd0.0000.598Non-normal52(1) (2.50)
Co0.0000.885Non-normal-
Cr0.0000.897Non-normal-
Cu0.0000.298Non-normal17 (1100), 16 (1110), 18 (1390)
Mn0.0000.452Non-normal8 (1) (8170)
Ni0.0540.966Non-normal42 (120)
Pb0.0000.442Non-normal17 (188), 16 (252), 18 (280)
Sb0.0000.931Non-normal-
Se0.0000.101Non-normal39(10) (21.3)
Zn0.0000.782Non-normal-
Table 5. Pearson correlations matrix between total Hg (THg) and sample physicochemical characteristics (pH, total carbon (TC), total organic carbon (TOC), and total nitrogen (TN)).
THgpHTCTOCTN
THg1.000−0.4540.720 *0.731 *0.894 **
pH 1.000−0.488−0.341−0.345
TC 1.0000.932 **0.837 **
TOC 1.0000.920 **
TN 1.000
** Correlation significant at 0.01 level (2-tailed). * Correlation significant at 0.05 level (2-tailed).
Table 6. Pearson correlation matrix between Hg and other selected PTEs.
HgAsBaCdCoCrCuMnNiPbSbSeZn
Hg1.0000.264 *−0.130−0.099−0.1750.036−0.067−0.098−0.134−0.078−0.264 *−0.054−0.058
As 1.0000.371 **−0.0590.1450.425 **−0.1700.313 **0.373 **−0.1190.439 **−0.003−0.167
Ba 1.0000.305 *0.618 **0.759 **0.1980.412 **0.596 **0.330 **0.155−0.0770.214
Cd 1.0000.333 **0.1900.0650.270 *0.336 **0.1710.044−0.0730.368 **
Co 1.0000.580 **0.405 **0.335 **0.471 **0.500 **−0.026−0.1230.258 *
Cr 1.0000.2230.288 *0.447 **0.310 **0.232−0.0430.094
Cu 1.000−0.147−0.451 **0.953 **0.167−0.027−0.128
Mn 1.0000.461 **−0.0660.132−0.0620.015
Ni 1.000−0.325 **−0.191−0.0320.432 **
Pb 1.0000.182−0.037−0.036
Sb 1.000−0.068−0.302 *
Se 1.0000.004
Zn 1.000
** Correlation significant at 0.01 level (2-tailed). * Correlation significant at 0.05 level (2-tailed).
Table 7. Summary of conducted studies in Pavlodar region on Hg contamination due to impact of CAP.
StudyTitleAnalysis MethodHg
[53]Mercury (Hg) contamination of fish fauna of Balkyldak technical pondAcid, bromide-bromate digestion + CV-AFS (PSA 10.025 Millenium-Merlin)Biota (Lake Balkyldak): 0.16–2.20 mg/kg
[23]Analysis of risk from mercury contamination at the Khimprom Plant in Kazakhstan(1) UK Contaminated Land Exposure Assessment (CLEA) model; (2) the Netherlands, Van Hall Institute Risk-Human Model Version 3.0On-site: 835.9 mg/kg (mean, surface soils), 18 mg/L (mean, groundwater); Urban zone: 1.5 mg/kg (mean, surface soils), 0.005 mg/L (mean, groundwater)
[54]Activities for prevention of the threat of river Irtysh mercury pollution in Pavlodar, Kazakhstan-Max. value in groundwater: 150 µg/L; surface water: 3–30 µg/L; biota: 0.075–0.16 mg/kg
[45]Ecological and geochemical characteristics of soils in Pavlodar, Republic of KazakhstanAcid digestion + AAS (Perkin Elmer 403 + HGA-74)Soils (n = 609): 0.08–18.96 mg/kg
[19]Mercury contamination in the vicinity of a derelict chlor-alkali plant. Part I: Sediment and water contamination of Lake Balkyldak and the River IrtyshAcid digestion + CV-AAS, CV-AFSSediments–lake Balkyldak (n = 55): 0.11–617 mg/kg; sediments–Irtysh river (n = 38): 0.001–0.046 mg/kg; sediments from oxbow lakes (n = 18): 0.010–0.360 mg/kg; surface water from Balkyldak (n = 38): 0.11–1.39 µg/L; surface water from Irtysh river: < 2 ng/L; surface water from oxbow lakes: < 2–8.5 ng/L; soil around Balkyldak: 0.22–5.72 mg/kg; soil around Irtysh river: 0.106–4.300 mg/kg
[55]Mercury contamination in the vicinity of a derelict chlor-alkali plant. Part II: Contamination of the aquatic and terrestrial food chain and potential risks to the local populationAcid digestion + CV-AFSFish from Lake Balkyldak (n = 55): 0.16–2.20 mg/kg; fish from Irtysh river (n = 30): 0.075–0.159 mg/kg; soil (n = 24): 0.10–3.30 mg/kg; groundwater from drinking wells (n = 30): <5 ng/L; kidney: 10.96 µg/kg, liver: 5.74 µg/kg; bovine milk: <2 µg/kg
[56]Heavy Metals Accumulation in Children HairInstrumental neutron activation analysis (INAA)Children’s hair (n = 100): 0.20–0.70 mg/kg
[22]Final technical reportAAS (Lumex RA 915+), AFS (PS Analytical Millenium Merlin System)soil (n = 610): 2.1–95.1 mg/kg; gramma grass (mean value, n = 4): <0.2 mg/kg; bottom sediments in Lake Balkyldak (n = 334): 135336 kg of Hg; biota (n = 132): 1.0–1.5 mg/kg
[57]Evaluation of mercury contamination in the vicinity of enterprises of the petrochemical complex in the winter period (based on the example of Pavlodar, Republic of Kazakhstan)AAS (Lumex RA 915+ and PYRO 915)Snow samples (n = 17): >0.15 mg/kg (background level) by 1.5–7 times; daily mean Hg deposited on snow cover: 4.9–221 mg/(km2 × day)
The present studyAssessment of distribution of potentially toxic elements in different environmental media impacted by a former chlor-alkali plantAAS (Lumex RA 915+ and PYRO 915)soil: 0.006–7.0 mg/kg; sediments: 0.004–24 mg/kg; groundwater: 0.004–1340 µg/L; surface water: 0.003–720 µg/L
Table 8. Comparison of selected international cases with CAP impact with present study.
LocationOperation PeriodEstimated DischargeSoilsSedimentsWaterOther PollutantsMain Remarks
Botafogo River, Brazil1963–198722–35 t of THg [51]0.1–14.4 mg/kg [50]1.2–2.5 t in Santa Cruz Channel [51];
0.13–10.44 mg/kg [51]
Not reported in reviewed referencesNot reported in reviewed referencesTHg in human hair samples: 0.1–12.5 ng/mg < MPC [58];
THg in biota samples: 4.5–167.0 ng/mg < MPC [58];
Preferential accumulation of elemental Hg in soils and sediments was confirmed [51];
Hg in oysters: 0.804–1.644 mg/kg, implying with Brazil’s food security agency standards [51];
Hg in plants: 0.019–0.081 mg/kg [51];
Direct correlation between the Hg concentration values and proximity to the former CAP has been reported [50]
Augusta Bay, Italy1958–2003500 t of Hg [47]Not reported in reviewed references0.3 × 3 mg/kg [59];
max = 680.10 mg/kg [47];
0.42–43.2 mg/kg [46]
Not reported in reviewed referencesBa: max = 7199 mg/kg (sediments) [47];
PAHs, PCBs, As, Cd, Co, Cr, Cu, Ni, Pb, V, Zn [59];
PCBs: ~0.0–0.386 mg/kg [47];
HCBs: ~0.0–0.0007 mg/kg [47]
Hg benthic fluxes: 1.3 kmol/yr, outflowing bottom fluxes: 0.54 kmol/yr [60];
Southernmost area considered highly contaminated area, acting as a secondary source of contamination due to reworking, resuspension, and transport [47]
Flix, Spain1949–2017Not reported in reviewed references44.0–12900 ng/g [48];
0.4–61.6 µg/g [61]
98.0–495000 ng/g [48];
up to 640 mg/kg [49]
Not reported in reviewed referencesCd: max = 12.15 mg/kg, Cr: max = 749.05 mg/kg, Zn: max = 394.32 mg/kg, Ni: max = 159.31 mg/kg, Cu: max = 106.01 mg/kg, As = 37.87 mg/kg, Pb: max = 52.06 mg/kg, Se: max = 42.78 mg/kg, Mn: max = 1406.86 mg/kg, P: max = 31.3 g/kg, S: max = 13.98 g/kg, Ti: max = 2.92 g/kg, Al: max = 69.94 g/kg, Ca: max = 380.81g/kg, Fe: max = 34.22 g/kg (sediments) [49]Hg in biota: 4.49 ± 0.65, Cd in biota: 0.04 ± 0.02, As in biota: 17.53 ± 1.95, Se in biota: 1.4 ± 0.5, Zn in biota: 23.2 ± 5.6, Cu in biota: 2.0 ± 0.2, Cr in biota: 23.1 ± 6.2, Pb in biota: 0.06 ± 0.03 [Soto et al., 2011];
Hg in lichens: 387–3750 ng/g [48];
PTEs including Hg tend to accumulate in finer fractions rather than in medium and coarse soils [61]
Rm Valcea, Romania1968–present36–53 t [62]Not reported in reviewed references0.01–0.08 mg/kg [62]9–88 ng/L [8]Cd in sediments: 0.5 ± 0.24, Cu in sediments: 46 ± 5, Pb in sediments: 23 ± 3, Zn in sediments: 127 ± 16 [62]Increased concentrations of MMHg (0.7 ng/L) in the reservoir [8]
Dalhousie, NB Canada1963–2008
1970–1992
141–163 t (discharge from 2 CAPs)Not reported in reviewed references0.04–0.28 µg/g [63];
0.02–1.96 mg/kg [64]
0.84–4.32 µg/L [64]Not reported in reviewed referencesHg in biota: 0.02–1.40 mg/kg (level decreases with distance), Hg concentrations in sediments decrease with distance from the former CAP [64]
Neratovice, Czech Republic1941–2017 77 kg/yr in 2007–2017 [50]O horizon: 479 µg/kg, mineral soil: 15 µg/kg [50]Not reported in reviewed referencesNot reported in reviewed referencesAl0 in O horizon: 1259 mg/kg, min. soil: 438 mg/kg;
Fe0 in O horizon: 1833 mg/kg, min. soil: 687 mg/kg [50]
Hg in bark and needles (Pinus sylvestris): 158 and 30 µg/kg, respectively [50]
Ya-Er Lake, Hubei Province China1962–1987 [65]Not reported in reviewed referencesNot reported in reviewed referencesTHg: 44–2766 ng/g
MeHg: ND–2.6 ng/g [52]
Surface water THg: 6.2–48.6 ng/;
MeHg: ND–0.41 ng/L;
PorewaterTHg: 2.3–317.7, MeHg: 0.22–3.62 ng/L [52]
Se in fish: 388.6–1502.3 µg/kg THg and MeHg in fish: 0.05–0.44 and 0.01–0.29 mg/kg, respectively [52]
Pavlodar, Kazakhstan1975–19931000–1300 t of Hg0.006–7.0 mg/kg0.004–24 mg/kg0.003–1340 µg/LSelected PTEs in soils (mg/kg): As: 0.22–37, Ba: 77–540, Cd: 0.0012–2.5, Co: 7.2–57, Cr: 0.61–160, Cu: 13–1390, Mn: 92–8170, Ni: 0.10–120, Pb: 11–280, Sb: <1.1, Se: <0.60, Zn: 1.5–290Hg concentrations in CAP impacted zone significantly higher than in nearby urban area. Concentrations of other selected PTEs don’t differ except for Cd. Refer to Table 7 for more remarks on Hg levels.
Table 9. Results for two-sample t-test between urban and chlor-alkali plant (CAP)-impacted sampling points.
ElementsAverage Concentration for Urban AreaAverage Concentration for CAP−Impacted Areap-Valuet-StatisticNull Hypothesis at α = 0.050
Hg (soils, sediments)0.0190.870.008812.68Rejected
Hg (surface water, groundwater)5.4 × 10−50.0720.003742.98Rejected
As (soils)4.8130.0761.80Accepted
Ba (soils)2702700.847−0.19Accepted
Cd (soils)0.400.240.000−4.49Rejected
Co (soils)23200.371−0.90Accepted
Cr (soils)47720.1421.49Accepted
Cu (soils)471000.5330.63Accepted
Mn (soils)10408400.574−0.57Accepted
Ni (soils)57490.355−0.93Accepted
Pb (soils)42360.700−0.39Accepted
Sb (soils)1.11.10.515−0.66Accepted
Publisher’s Note: MDPI stays neutral with regard to jurisdictional claims in published maps and institutional affiliations.

