
Teachers in the Top Management Team and Corporate Social Responsibility


Abstract
:1. Introduction
2. Theoretical Background and Hypotheses
2.1. Past Experiences and Individual’s Behavior
2.2. TMT Heterogeneity and Corporate Outcomes
2.3. Top Managers and Corporate Social Responsibility
2.4. Characteristics of Teachers and Teachers in Business
3. Data and Methods
3.1. Data Sources
3.2. Dependent Variables
3.3. Independent Variables
3.4. Control Variables
3.4.1. TMT-Level
3.4.2. Firm-Level
3.5. Distribution of Sample
3.6. Empirical Models
4. Results
4.1. Descriptive Statistics
4.2. Main Results
4.3. Top Managers on the Board/Not on the Board
4.4. CEO with Teaching Experience and CSR
5. Robustness Check and Further Discussion
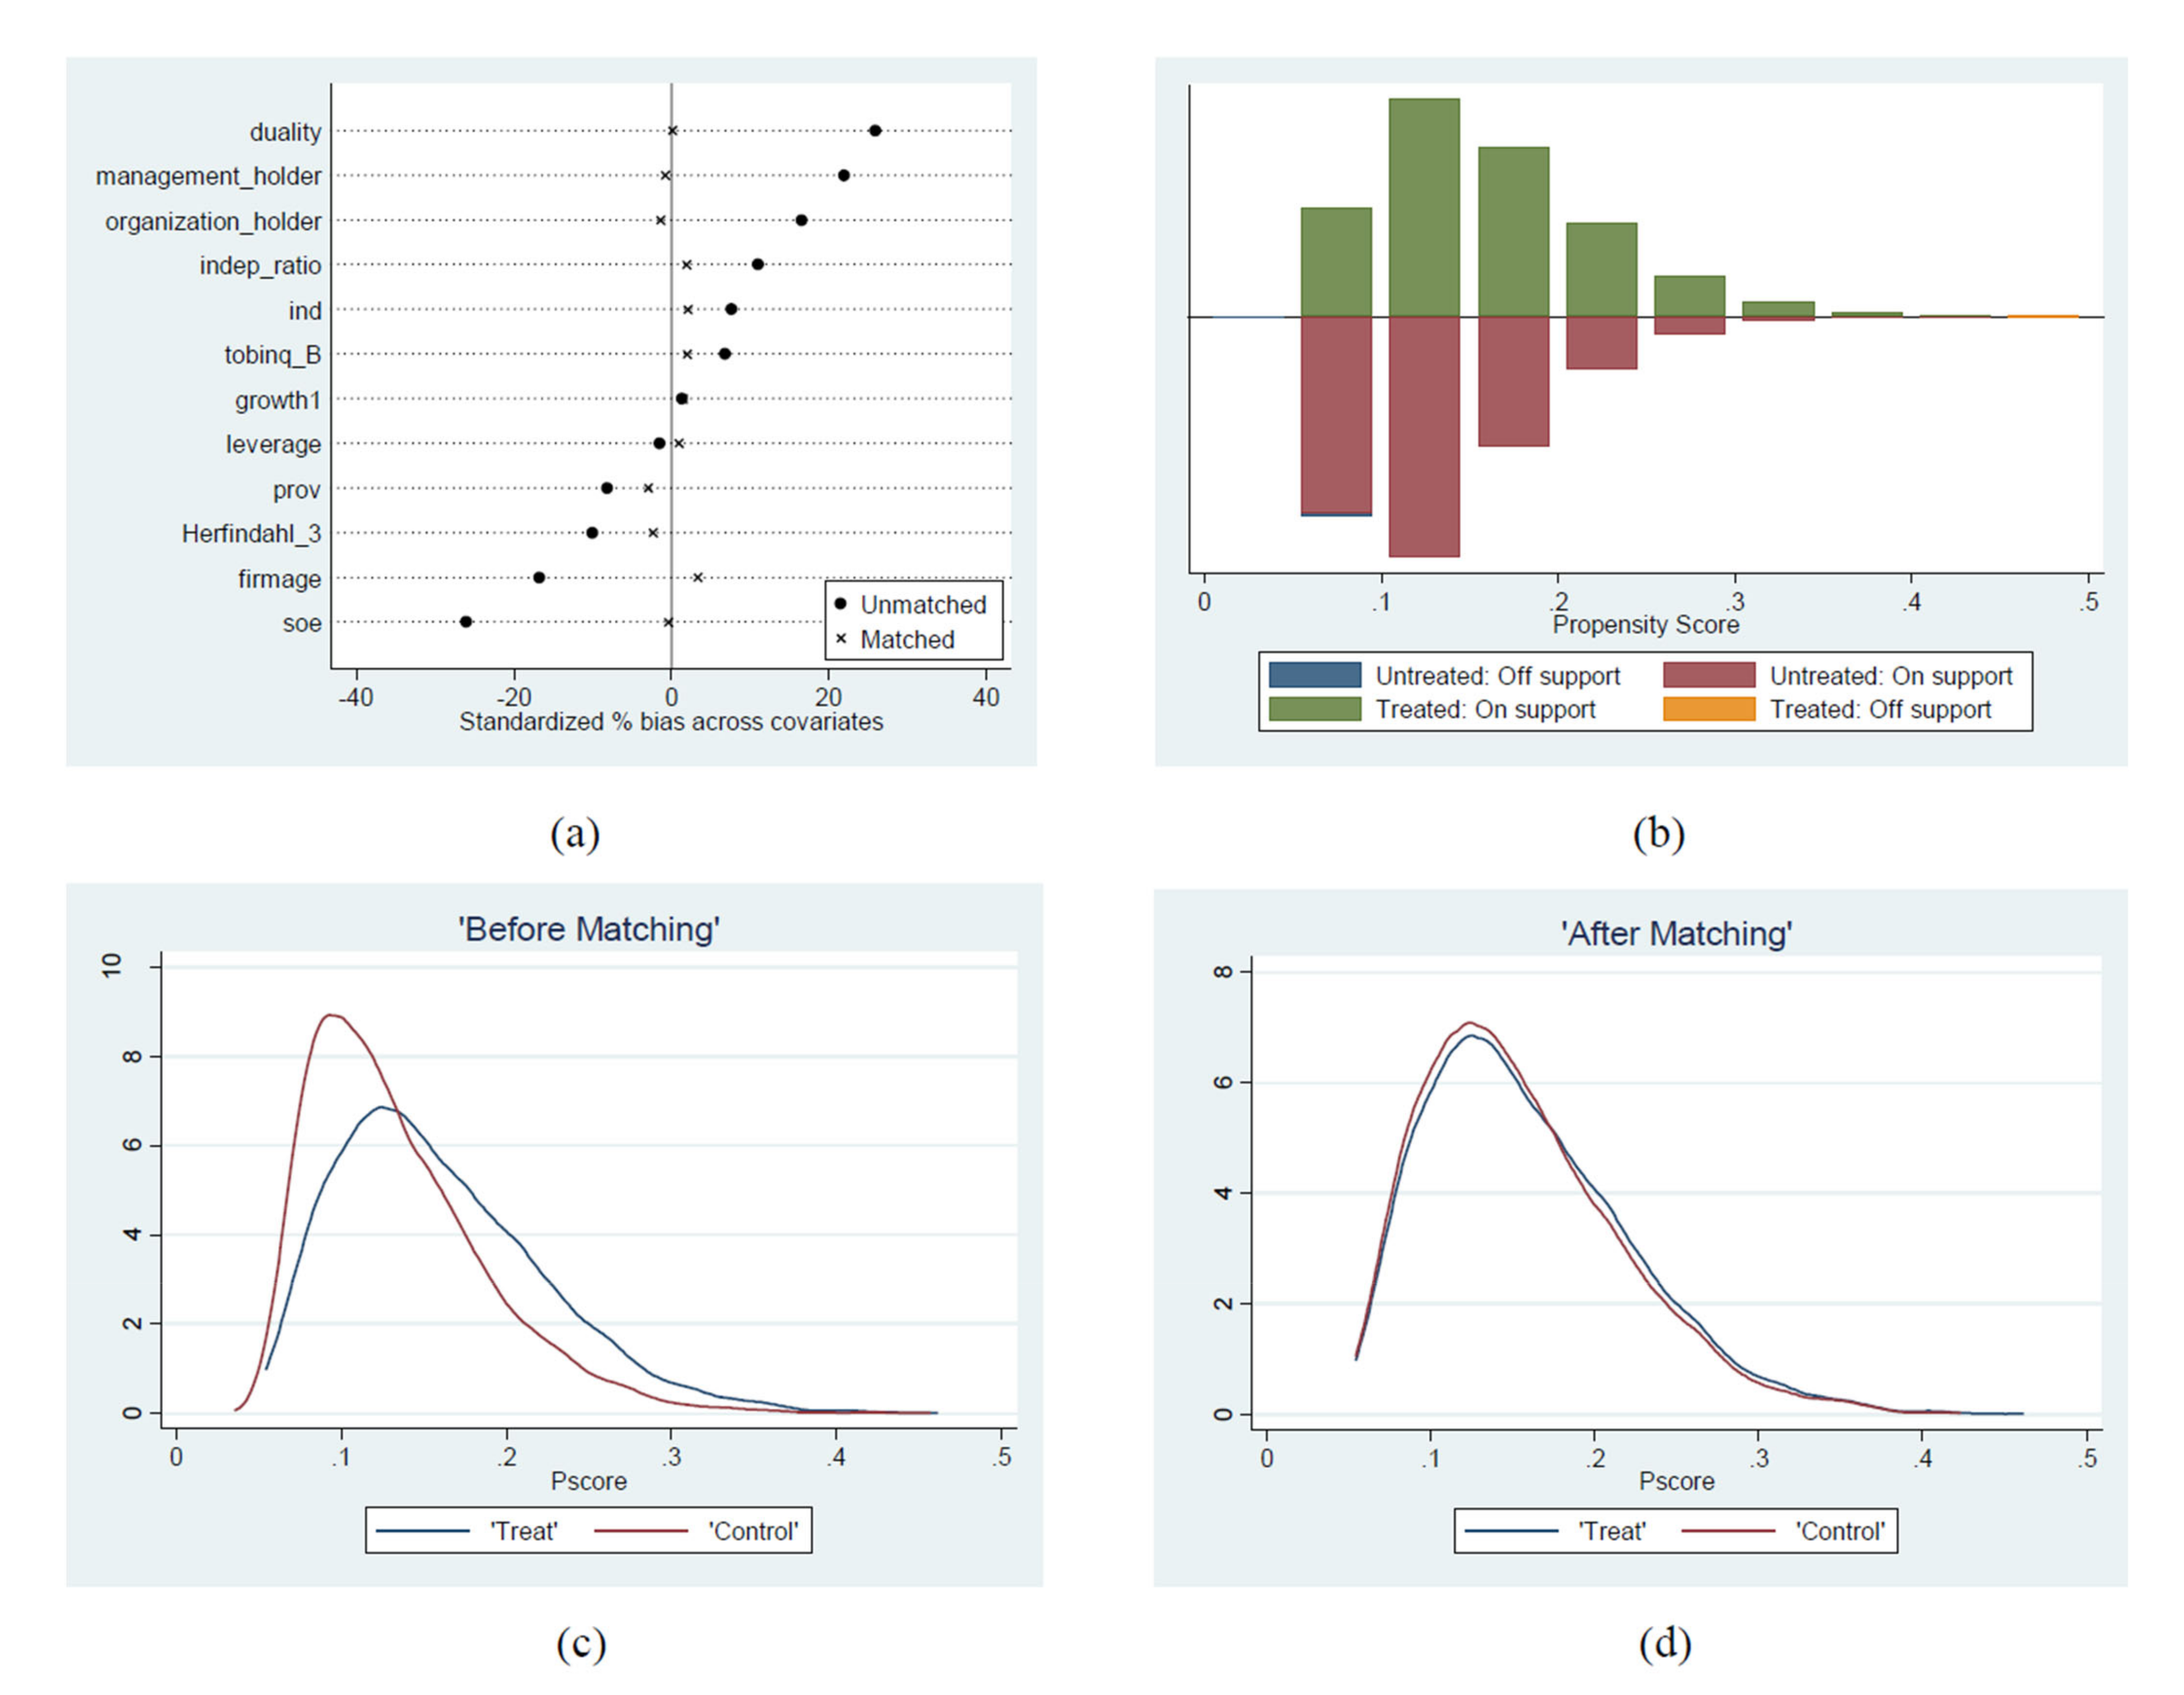
5.1. Alleviation of Endogeneity Problem
5.2. Directors on the Board and CSR
6. Conclusions
Author Contributions
Funding
Institutional Review Board Statement
Informed Consent Statement
Data Availability Statement
Conflicts of Interest
References
- Hambrick, D.C.; Mason, P.A. Upper echelons: The organization as a reflection of its top managers. Acad. Manag. Rev. 1984, 9, 193–206. [Google Scholar] [CrossRef]
- Cho, C.H.; Jung, J.H.; Kwak, B.; Lee, J.; Yoo, C.-Y. Professors on the board: Do they contribute to society outside the classroom? J. Bus. Ethics 2017, 141, 393–409. [Google Scholar] [CrossRef]
- Francis, B.; Hasan, I.; Wu, Q. Professors in the boardroom and their impact on corporate governance and firm performance. Financ. Manag. 2015, 44, 547–581. [Google Scholar] [CrossRef]
- Gray, R.; Kouhy, R.; Lavers, S. Corporate social and environmental reporting: A review of the literature and a longitudinal study of UK disclosure. Account. Audit. Account. J. 1995, 31, 47–77. [Google Scholar] [CrossRef]
- Neu, D.; Warsame, H.; Pedwell, K. Managing public impressions: Environmental disclosures in annual reports. Account. Organ. Soc. 1998, 23, 265–282. [Google Scholar] [CrossRef]
- Zimmerman, M.A.; Zeitz, G.J. Beyond survival: Achieving new venture growth by building legitimacy. Acad. Manag. Rev. 2002, 27, 414–431. [Google Scholar] [CrossRef]
- Deephouse, D.L.; Carter, S.M. An examination of differences between organizational legitimacy and organizational reputation. J. Manag. Stud. 2005, 42, 329–360. [Google Scholar] [CrossRef]
- Sen, S.; Bhattacharya, C.B. Does doing good always lead to doing better? Consumer reactions to corporate social responsibility. J. Mark. Res. 2001, 38, 225–243. [Google Scholar] [CrossRef]
- Schuler, D.A.; Cording, M. A corporate social performance–corporate financial performance behavioral model for consumers. Acad. Manag. Rev. 2006, 31, 540–558. [Google Scholar] [CrossRef]
- Miles, R.H. Managing the Corporate Social Environment: A Grounded Theory; Prentice-Hall: Hoboken, NJ, USA, 1987. [Google Scholar]
- Benmelech, E.; Frydman, C. Military ceos. J. Financ. Econ. 2015, 117, 43–59. [Google Scholar] [CrossRef]
- Giannetti, M.; Liao, G.; Yu, X. The brain gain of corporate boards: Evidence from China. J. Financ. 2015, 70, 1629–1682. [Google Scholar] [CrossRef]
- Elder, G.H. Military times and turning points in men’s lives. Dev. Psychol. 1986, 22, 233. [Google Scholar] [CrossRef]
- Elder Jr, G.H.; Clipp, E.C. Combat experience and emotional health: Impairment and resilience in later life. J. Personal. 1989, 57, 311–341. [Google Scholar] [CrossRef] [PubMed]
- Killgore, W.D.; Cotting, D.I.; Thomas, J.L.; Cox, A.L.; McGurk, D.; Vo, A.H.; Castro, C.A.; Hoge, C.W. Post-combat invincibility: Violent combat experiences are associated with increased risk-taking propensity following deployment. J. Psychiatr. Res. 2008, 42, 1112–1121. [Google Scholar] [CrossRef] [PubMed]
- Nolen-Hoeksema, S.; Morrow, J. A prospective study of depression and posttraumatic stress symptoms after a natural disaster: The 1989 Loma Prieta Earthquake. J. Personal. Soc. Psychol. 1991, 61, 115. [Google Scholar] [CrossRef]
- Cameron, L.; Shah, M. Risk-taking behavior in the wake of natural disasters. J. Hum. Resour. 2015, 50, 484–515. [Google Scholar] [CrossRef]
- Malmendier, U.; Nagel, S. Depression babies: Do macroeconomic experiences affect risk taking? Qarterly J. Econ. 2011, 126, 373–416. [Google Scholar] [CrossRef] [Green Version]
- Graham, J.R.; Narasimhan, K. Corporate Survival and Managerial Experiences during the Great Depression. Available online: http://citeseerx.ist.psu.edu/viewdoc/summary?doi=10.1.1.217.8670 (accessed on 13 December 2021).
- Malmendier, U.; Tate, G.; Yan, J. Overconfidence and early-life experiences: The effect of managerial traits on corporate financial policies. J. Financ. 2011, 66, 1687–1733. [Google Scholar] [CrossRef] [Green Version]
- McGowen, K.R.; Hart, L.E. Still different after all these years: Gender differences in professional identity formation. Prof. Psychol. Res. Pract. 1990, 21, 118. [Google Scholar] [CrossRef]
- Larson, M.S.; Larson, M.S. The Rise of Professionalism: A Sociological Analysis; University of California Press: Berkeley, CA, USA, 1977; Volume 233. [Google Scholar]
- DiMaggio, P.J.; Powell, W.W. The iron cage revisited: Institutional isomorphism and collective rationality in organizational fields. Am. Sociol. Rev. 1983, 48, 147–160. [Google Scholar] [CrossRef] [Green Version]
- Ren, T.; Hamann, D.J. Employee value congruence and job attitudes: The role of occupational status. Pers. Rev. 2015, 44, 550–566. [Google Scholar] [CrossRef]
- Marquis, C.; Tilcsik, A. Imprinting: Toward a multilevel theory. Acad. Manag. Ann. 2013, 7, 195–245. [Google Scholar] [CrossRef]
- Azoulay, P.; Liu, C.C.; Stuart, T.E. Social influence given (partially) deliberate matching: Career imprints in the creation of academic entrepreneurs. Am. J. Sociol. 2017, 122, 1223–1271. [Google Scholar] [CrossRef]
- Tilcsik, A. Remembrance of Things Past: Individual Imprinting in Organizations; Harvard University: Cambridge, MA, USA, 2012. [Google Scholar]
- Higgins, M.C. Career Imprints: Creating Leaders across an Industry; John Wiley & Sons: San Francisco, CA, USA, 2005. [Google Scholar]
- McEvily, B.; Jaffee, J.; Tortoriello, M. Not all bridging ties are equal: Network imprinting and firm growth in the Nashville legal industry, 1933–1978. Organ. Sci. 2012, 23, 547–563. [Google Scholar] [CrossRef]
- Georgakakis, D.; Greve, P.; Ruigrok, W. Top management team faultlines and firm performance: Examining the CEO-TMT interface. Leadersh. Q. 2017, 28, 741–758. [Google Scholar] [CrossRef]
- Chen, W.-H.; Kang, M.-P.; Butler, B. How does top management team composition matter for continual growth? Reinvestigating Penrose’s growth theory through the lens of upper echelons theory. Manag. Decis. 2018, 57, 41–70. [Google Scholar] [CrossRef]
- Boone, C.; Lokshin, B.; Guenter, H.; Belderbos, R. Top management team nationality diversity, corporate entrepreneurship, and innovation in multinational firms. Strateg. Manag. J. 2019, 40, 277–302. [Google Scholar] [CrossRef] [Green Version]
- Mehrabi, H.; Coviello, N.; Ranaweera, C. When is top management team heterogeneity beneficial for product exploration? Understanding the role of institutional pressures. J. Bus. Res. 2021, 132, 775–786. [Google Scholar] [CrossRef]
- Zhang, D. Top management team characteristics and financial reporting quality. Account. Rev. 2019, 94, 349–375. [Google Scholar] [CrossRef]
- Henry, L.A.; Buyl, T.; Jansen, R.J. Leading corporate sustainability: The role of top management team composition for triple bottom line performance. Bus. Strategy Environ. 2019, 28, 173–184. [Google Scholar] [CrossRef] [Green Version]
- Reimer, M.; Van Doorn, S.; Heyden, M.L. Unpacking functional experience complementarities in senior leaders’ influences on CSR strategy: A CEO–Top management team approach. J. Bus. Ethics 2018, 151, 977–995. [Google Scholar] [CrossRef]
- Carpenter, M.A.; Geletkanycz, M.A.; Sanders, W.G. Upper echelons research revisited: Antecedents, elements, and consequences of top management team composition. J. Manag. 2004, 30, 749–778. [Google Scholar] [CrossRef]
- Spisak, B.R.; Grabo, A.E.; Arvey, R.D.; Van Vugt, M. The age of exploration and exploitation: Younger-looking leaders endorsed for change and older-looking leaders endorsed for stability. Leadersh. Q. 2014, 25, 805–816. [Google Scholar] [CrossRef]
- Abebe, M.A.; Tangpong, C. Founder-CEOs and corporate turnaround among declining firms. Corp. Gov. Int. Rev. 2018, 26, 45–57. [Google Scholar] [CrossRef] [Green Version]
- Dixon, S.E.; Meyer, K.E.; Day, M. Exploitation and exploration learning and the development of organizational capabilities: A cross-case analysis of the Russian oil industry. Hum. Relat. 2007, 60, 1493–1523. [Google Scholar] [CrossRef]
- Jansen, J.J.; Vera, D.; Crossan, M. Strategic leadership for exploration and exploitation: The moderating role of environmental dynamism. Leadersh. Q. 2009, 20, 5–18. [Google Scholar] [CrossRef]
- Laureiro-Martínez, D.; Canessa, N.; Brusoni, S.; Zollo, M.; Hare, T.; Alemanno, F.; Cappa, S.F. Frontopolar cortex and decision-making efficiency: Comparing brain activity of experts with different professional background during an exploration-exploitation task. Front. Hum. Neurosci. 2014, 7, 927. [Google Scholar] [CrossRef] [Green Version]
- Hambrick, D.C.; Cho, T.S.; Chen, M.-J. The influence of top management team heterogeneity on firms’ competitive moves. Adm. Sci. Q. 1996, 41, 659–684. [Google Scholar] [CrossRef]
- Bantel, K.A.; Jackson, S.E. Top management and innovations in banking: Does the composition of the top team make a difference? Strateg. Manag. J. 1989, 10, 107–124. [Google Scholar] [CrossRef]
- Kimberly, J.R.; Evanisko, M.J. Organizational innovation: The influence of individual, organizational, and contextual factors on hospital adoption of technological and administrative innovations. Acad. Manag. J. 1981, 24, 689–713. [Google Scholar]
- Faccio, M. Politically connected firms. Am. Econ. Rev. 2006, 96, 369–386. [Google Scholar] [CrossRef] [Green Version]
- Fan, J.P.; Wong, T.J.; Zhang, T. Politically connected CEOs, corporate governance, and post-IPO performance of China’s newly partially privatized firms. J. Financ. Econ. 2007, 84, 330–357. [Google Scholar] [CrossRef]
- Bertrand, M.; Hallock, K.F. The gender gap in top corporate jobs. ILR Rev. 2001, 55, 3–21. [Google Scholar] [CrossRef]
- Kanner, B. Pocketbook Power: How to Reach the Hearts and Minds of Today’s Most Coveted Consumers-Women; McGraw Hill Professional: New York, NY, USA, 2004. [Google Scholar]
- Clarkson, M.B. A Stakeholder Framework for Analysing and Evaluating Corporate Social Performance. Acad. Manag. Rev. 1995, 20, 1. [Google Scholar] [CrossRef]
- Jamali, D.; Karam, C. Corporate social responsibility in developing countries as an emerging field of study. Int. J. Manag. Rev. 2018, 20, 32–61. [Google Scholar] [CrossRef]
- Sharma, E. A review of corporate social responsibility in developed and developing nations. Corp. Soc. Responsib. Environ. Manag. 2019, 26, 712–720. [Google Scholar] [CrossRef]
- Lone, E.J.; Ali, A.; Khan, I. Corporate governance and corporate social responsibility disclosure: Evidence from Pakistan. Corp. Gov. Int. J. Bus. Soc. 2016, 16, 785–797. [Google Scholar]
- Romano, M.; Cirillo, A.; Favino, C.; Netti, A. ESG (Environmental, Social and Governance) Performance and Board Gender Diversity: The Moderating Role of CEO Duality. Sustainability 2020, 12, 9298. [Google Scholar] [CrossRef]
- Tamimi, N.; Sebastianelli, R. Transparency among S&P 500 companies: An analysis of ESG disclosure scores. Manag. Decis. 2017, 55, 1660–1680. [Google Scholar]
- Tibiletti, V.; Marchini, P.L.; Furlotti, K.; Medioli, A. Does corporate governance matter in corporate social responsibility disclosure? Evidence from Italy in the “era of sustainability”. Corp. Soc. Responsib. Environ. Manag. 2021, 28, 896–907. [Google Scholar] [CrossRef]
- Naciti, V. Corporate governance and board of directors: The effect of a board composition on firm sustainability performance. J. Clean. Prod. 2019, 237, 117727. [Google Scholar] [CrossRef]
- Pucheta-Martínez, M.C.; Gallego-Álvarez, I. An international approach of the relationship between board attributes and the disclosure of corporate social responsibility issues. Corp. Soc. Responsib. Environ. Manag. 2019, 26, 612–627. [Google Scholar] [CrossRef]
- Shaukat, A.; Qiu, Y.; Trojanowski, G. Board attributes, corporate social responsibility strategy, and corporate environmental and social performance. J. Bus. Ethics 2016, 135, 569–585. [Google Scholar] [CrossRef] [Green Version]
- Wiersema, M.F.; Bantel, K.A. Top management team demography and corporate strategic change. Acad. Manag. J. 1992, 35, 91–121. [Google Scholar]
- Mcguinness, P.B.; Vieito, J.P.; Wang, M. CSR performance in China: The role of board gender and foreign ownership. J. Corp. Financ. 2017, 42, 72–99. [Google Scholar] [CrossRef] [Green Version]
- Manner, M.H. The impact of CEO characteristics on corporate social performance. J. Bus. Ethics 2010, 93, 53–72. [Google Scholar] [CrossRef]
- Swanson, D.L. Addressing a theoretical problem by reorienting the corporate social performance model. Acad. Manag. Rev. 1995, 20, 43–64. [Google Scholar] [CrossRef]
- Hemingway, C.A.; Maclagan, P.W. Managers’ personal values as drivers of corporate social responsibility. J. Bus. Ethics 2004, 50, 33–44. [Google Scholar] [CrossRef]
- Tang, Y.; Qian, C.; Chen, G.; Shen, R. How CEO hubris affects corporate social (ir)responsibility. Strateg. Manag. J. 2015, 36, 1338–1357. [Google Scholar] [CrossRef]
- Sturdivant, F.D.; Ginter, J.L. Corporate social responsiveness: Management attitudes and economic performance. Calif. Manag. Rev. 1977, 19, 30–39. [Google Scholar] [CrossRef]
- Ullmann, A.A. Data in search of a theory: A critical examination of the relationships among social performance, social disclosure, and economic performance of US firms. Acad. Manag. Rev. 1985, 10, 540–557. [Google Scholar]
- Holland, J.L. A theory of vocational choice. J. Couns. Psychol. 1959, 6, 35. [Google Scholar] [CrossRef]
- Tschannen-Moran, M.; Hoy, A.W.; Hoy, W.K. Teacher efficacy: Its meaning and measure. Rev. Educ. Res. 1998, 68, 202–248. [Google Scholar] [CrossRef]
- Darling-Hammond, L. Teacher quality and student achievement. Educ. Policy Anal. Arch. 2000, 8, 1. [Google Scholar] [CrossRef] [Green Version]
- Yamamura, E.; Managi, S.; Tsutsui, Y. Male pupils taught by female homeroom teachers show a higher preference for Corporate Social Responsibility in adulthood. J. Jpn. Int. Econ. 2019, 54, 101048. [Google Scholar] [CrossRef] [Green Version]
- Soltis, J.F. Teaching professional ethics. J. Teach. Educ. 1986, 37, 2–4. [Google Scholar] [CrossRef]
- Karaköse, T. High school teachers’ perceptions regarding principals’ ethical leadership in Turkey. Asia Pac. Educ. Rev. 2007, 8, 464–477. [Google Scholar] [CrossRef]
- Podsakoff, N.P.; Podsakoff, P.M.; MacKenzie, S.B.; Maynes, T.D.; Spoelma, T.M. Consequences of unit-level organizational citizenship behaviors: A review and recommendations for future research. J. Organ. Behav. 2014, 35, S87–S119. [Google Scholar] [CrossRef]
- Cek, K.; Eyupoglu, S.Z. Does teachers’ perceived corporate social responsibility lead to organisational citizenship behaviour? The mediating roles of job satisfaction and organisational identification. South. Afr. J. Bus. Manag. 2019, 50, 1–11. [Google Scholar] [CrossRef]
- Gong, G.; Huang, X.; Wu, S.; Tian, H.; Li, W. Punishment by securities regulators, corporate social responsibility and the cost of debt. J. Bus. Ethics 2021, 171, 337–356. [Google Scholar] [CrossRef]
- Han, S.; You, W.; Nan, S. Zombie firms, external support and corporate environmental responsibility: Evidence from China. J. Clean. Prod. 2019, 212, 1499–1517. [Google Scholar] [CrossRef]
- Hu, Y.; Chen, S.; Wang, J. Managerial humanistic attention and CSR: Do firm characteristics matter? Sustainability 2018, 10, 4029. [Google Scholar] [CrossRef] [Green Version]
- Wang, F.; Sun, J.; Liu, Y.S. Institutional pressure, ultimate ownership, and corporate carbon reduction engagement: Evidence from China. J. Bus. Res. 2019, 104, 14–26. [Google Scholar] [CrossRef]
- Wen, W.; Cui, H.; Ke, Y. Directors with foreign experience and corporate tax avoidance. J. Corp. Financ. 2020, 62, 101624. [Google Scholar] [CrossRef]
- Borghesi, R.; Houston, J.F.; Naranjo, A. Corporate socially responsible investments: CEO altruism, reputation, and shareholder interests. J. Corp. Financ. 2014, 26, 164–181. [Google Scholar] [CrossRef]
- Daboub, A.J.; Rasheed, A.M.; Priem, R.L.; Gray, D. Top management team characteristics and corporate illegal activity. Acad. Manag. Rev. 1995, 20, 138–170. [Google Scholar] [CrossRef]
- Pfeffer, J.; Salancik, G.R. Organizational context and the characteristics and tenure of hospital administrators. Acad. Manag. J. 1977, 20, 74–88. [Google Scholar]
- Judge, W.Q.; Naoumova, I.; Koutzevol, N. Corporate governance and firm performance in Russia: An empirical study. J. World Bus. 2003, 38, 385–396. [Google Scholar] [CrossRef]
- Webb, E. An examination of socially responsible firms’ board structure. J. Manag. Gov. 2004, 8, 255–277. [Google Scholar] [CrossRef]
- Withisuphakorn, P.; Jiraporn, P. The effect of firm maturity on corporate social responsibility (CSR): Do older firms invest more in CSR? Appl. Econ. Lett. 2016, 23, 298–301. [Google Scholar] [CrossRef]
- Ren, T.; Feng, Y.; Xiao, Y.; Yang, H.; Liu, W. Firm Ownership and Corporate Social Responsibility in China: From a Multiple Stakeholder Perspective. In Corporate Social Responsibility in Developing and Emerging Markets: Institutions, Actors and Sustainable Development; Cambridge University Press: Cambridge, UK, 2019; pp. 133–167. [Google Scholar] [CrossRef]
- Consolandi, C.; Nascenzi, P.; Jaiswal-Dale, A. Ownership Concentration and Corporate Social Performance: An Empirical Evidence for European Firms. Available online: https://www.semanticscholar.org/paper/Ownership-Concentration-and-Corporate-Social-an-for-Consolandi-Nascenzi/0eb3ecb5ee42df3043986f25b52515e130793c15 (accessed on 13 December 2021).
- Van der Walt, N.; Ingley, C. Board dynamics and the influence of professional background, gender and ethnic diversity of directors. Corp. Gov. Int. Rev. 2003, 11, 218–234. [Google Scholar] [CrossRef]
- Titman, S. The effect of capital structure on a firm’s liquidation decision. J. Financ. Econ. 1984, 13, 137–151. [Google Scholar] [CrossRef]
- Margolis, J.D.; Walsh, J.P. Misery loves companies: Rethinking social initiatives by business. Adm. Sci. Q. 2003, 48, 268–305. [Google Scholar] [CrossRef] [Green Version]
- Oh, W.Y.; Chang, Y.K.; Martynov, A. The effect of ownership structure on corporate social responsibility: Empirical evidence from Korea. J. Bus. Ethics 2011, 104, 283–297. [Google Scholar] [CrossRef]
- Neubaum, D.O.; Zahra, S.A. Institutional ownership and corporate social performance: The moderating effects of investment horizon, activism, and coordination. J. Manag. 2006, 32, 108–131. [Google Scholar] [CrossRef]
- Khan, A.; Muttakin, M.B.; Siddiqui, J. Corporate governance and corporate social responsibility disclosures: Evidence from an emerging economy. J. Bus. Ethics 2013, 114, 207–223. [Google Scholar] [CrossRef]
- Wangrow, D.B.; Schepker, D.J.; Barker III, V.L. Managerial discretion: An empirical review and focus on future research directions. J. Manag. 2015, 41, 99–135. [Google Scholar] [CrossRef]
- Cannella, S.F.B.; Hambrick, D.C.; Finkelstein, S.; Cannella, A.A. Strategic Leadership: Theory and Research on Executives, Top Management Teams, and Boards; Oxford University Press: Oxford, UK, 2009. [Google Scholar] [CrossRef]


| Variable | Description |
|---|---|
| CSR | Overall CSR performance rated by a full score of 100 points from Hexun. |
| CSR Rank | The ranking of CSR rated by a five-point scale, 5 indicating the company’s CSR above 80 points, and 1 indicating CSR below 20 points. |
| CSR Holder | Sub-indicator: shareholder equity responsibility. |
| CSR Employ | Sub-indicator: employee responsibility. |
| CSR Customer | Sub-indicator: supplier, customer, and consumer rights responsibility. |
| CSR Envir | Sub-indicator: environmental responsibility. |
| CSR Social | Sub-indicator: social responsibility contribution. |
| TMTTE | 1 if a firm has top managers with teaching experience in the TMT, and 0 otherwise. |
| TMTTEratio | The percentage of top managers with teaching experience in the TMT. |
| TMTmale | The percentage of males in the TMT. |
| TMTage | The average age of top managers in the TMT. |
| TMTtenure | The average number of months top managers serve in their position. |
| TMTTEratio (on the board) | The percentage of top managers with teaching experience who are also on the board. |
| TMTTEratio (not on the board) | The percentage of top managers with teaching experience who are not on the board. |
| CEOTE | 1 if a firm has a CEO with teaching experience, and 0 otherwise. |
| CEOmale | 1 if CEO is male, and 0 if CEO is female. |
| CEOage | The age of CEO. |
| CEOtenure | The number of months CEO serves in the position. |
| BoardTE | 1 if a firm has directors on the board excluding the independent directors. |
| BoardTEratio | The percentage of directors on the board excluding the independent directors. |
| BoardMale | The percentage of males on the board excluding the independent directors. |
| BoardAge | The average age of directors on the board excluding the independent directors. |
| BoardTenure | The average number of months directors serve in their position. |
| Duality | 1 if the CEO and the chairman of the board are the same person, and 0 otherwise. |
| FirmAge | The number of years since the firm was established. |
| SOE | 1 if a firm is state-owned, and 0 otherwise. |
| HI | Herfindahl Index that measures the equity concentration, specifically the sum of squares of the shareholding ratio of the three largest shareholders. |
| Indep | The percentage of independent directors on the board. |
| Board | The number of directors on the board excluding the independent directors. |
| Leverage | The total liabilities divided by the total assets, measured at the fiscal year end. |
| Growth | The year-to-year growth rate of the firm gross operating income, measured at the fiscal year end. |
| Tobinq | Tobin’s Q. The market value of the firm divided by the asset replacement cost, measure at the fiscal year end. |
| IR | The institutional shareholding ratio measured by the percentage of shares held by institutional investors at the fiscal year end. |
| MR | Management shareholding ratio measured by the percentage of shares held by the management at the fiscal year end. |
| Province | The registration location of a company, including 22 provinces, 4 municipalities, and 5 autonomous regions. |
| Industry | The industry classification for listed companies published by China Securities Regulatory Commission (CSRC) in 2012. |
| Year | The year, from 2010 to 2019. |
| Panel A: Distribution of Sample Firms by Year | |||||
|---|---|---|---|---|---|
| Year | # of Firms | # of Firms Having Top Managers with Teaching Experience in the TMT | % of Firms Having Top Managers with Teaching Experience in the TMT | # of Firms Having Top Managers with Teaching Experience in the TMT (>1) | Mean % of Teachers in the TMT Conditional on the Teacher Occurrence |
| 2010 | 1112 | 139 | 12.50 | 92 | 19.55 |
| 2011 | 1456 | 195 | 13.39 | 131 | 19.47 |
| 2012 | 1668 | 233 | 13.97 | 149 | 17.55 |
| 2013 | 1667 | 234 | 14.04 | 148 | 16.90 |
| 2014 | 1658 | 246 | 14.84 | 159 | 16.80 |
| 2015 | 1744 | 281 | 16.11 | 179 | 16.26 |
| 2016 | 1912 | 287 | 15.01 | 191 | 16.36 |
| 2017 | 1983 | 302 | 15.23 | 208 | 17.13 |
| 2018 | 2237 | 223 | 9.97 | 157 | 17.44 |
| 2019 | 244 | 16 | 6.56 | 12 | 17.38 |
| Total | 15,681 | 2156 | 13.75 | 1426 | 17.30 |
| Panel B: Distribution of Sample Firms by Industry | |||||
| Industry | # of Firm-Years | # of Firm-Years Having Top Managers with Teaching Experience in the TMT | % of Firm- Years Having Top Managers with Teaching Experience in the TMT | Mean % of Teachers in the TMT Conditional on the Teacher Occurrence | |
| Agriculture, forestry, animal husbandry, and fishery | 221 | 31 | 14.03 | 12.03 | |
| Mining | 430 | 39 | 9.07 | 14.45 | |
| Manufacturing | 9952 | 1376 | 13.83 | 17.53 | |
| Production and supply of electric power, heat, gas, and water | 627 | 63 | 10.05 | 18.84 | |
| Construction | 459 | 84 | 18.30 | 16.07 | |
| Wholesale and retail trade | 1026 | 100 | 9.75 | 17.75 | |
| Transportation, warehousing, and postal services | 577 | 52 | 9.01 | 16.64 | |
| Accommodation and restaurants | 71 | 12 | 16.90 | 23.49 | |
| Information transmission, software, and information technology services | 608 | 139 | 22.86 | 17.00 | |
| Real estate | 887 | 115 | 12.97 | 16.43 | |
| Leasing and business services | 191 | 34 | 17.80 | 14.30 | |
| Scientific research and technical services | 90 | 22 | 24.44 | 15.23 | |
| Water conservancy, environment, and public facilities management industry | 159 | 14 | 8.81 | 13.29 | |
| Residential services, repair, and other services | 13 | 2 | 15.38 | 5.84 | |
| Education | 13 | 4 | 30.77 | 26.69 | |
| Health and public services | 15 | 2 | 13.33 | 15.88 | |
| Arts, sports, and entertainment | 159 | 32 | 20.13 | 19.19 | |
| Generals | 183 | 35 | 19.13 | 21.55 | |
| Total | 15,681 | 2156 | 13.75 | 17.30 | |
| Panel A: Summary Statistics | ||||||
|---|---|---|---|---|---|---|
| Variable | Obs | Mean | Std. Dev. | Min | Median | Max |
| CSR performance | ||||||
| CSR | 15,681 | 26.23 | 17.58 | −4.09 | 22.47 | 75.29 |
| CSR Rank | 15,681 | 2.22 | 0.66 | 1 | 2 | 5 |
| CSR Holder | 15,681 | 13.84 | 6.25 | −3.14 | 14.35 | 24.84 |
| CSR Employ | 15,681 | 3.03 | 3.48 | 0 | 1.71 | 15 |
| CSR Customer | 15,681 | 2.14 | 5.12 | 0 | 0 | 19 |
| CSR Envir | 15,681 | 2.23 | 5.55 | 0 | 0 | 23 |
| CSR Social | 15,681 | 4.97 | 4.38 | −8.1 | 4.58 | 17.4 |
| TMT characteristics | ||||||
| TMTTE | 15,681 | 0.14 | 0.34 | 0 | 0 | 1 |
| TMTTEratio | 15,681 | 0.02 | 0.07 | 0 | 0 | 0.36 |
| TMTmale | 15,681 | 0.85 | 0.16 | 0 | 0.89 | 1 |
| TMTage | 15,681 | 47.41 | 3.66 | 33.27 | 47.5 | 60.6 |
| TMTtenure | 15,681 | 47.92 | 23.36 | 0 | 44.38 | 200.8 |
| CEO characteristics | ||||||
| CEOTE | 15,681 | 0.04 | 0.19 | 0 | 0 | 1 |
| CEOmale | 15,681 | 0.94 | 0.24 | 0 | 1 | 1 |
| CEOage | 15,681 | 49.58 | 6.49 | 25 | 50 | 81 |
| CEOtenure | 15,681 | 50.62 | 40.56 | 0 | 40 | 255 |
| Board characteristics | ||||||
| BoardTE | 15,681 | 0.19 | 0.39 | 0 | 0 | 1 |
| BoardTEratio | 15,681 | 0.03 | 0.08 | 0 | 0 | 0.43 |
| BoardMale | 15,681 | 0.88 | 0.15 | 0 | 0.94 | 1 |
| BoardAge | 15,681 | 49.54 | 3.95 | 34.29 | 49.67 | 65.17 |
| BoardTenure | 15,681 | 50.23 | 25.21 | 0 | 46.11 | 185.5 |
| Firm characteristics | ||||||
| Duality | 15,681 | 0.23 | 0.42 | 0 | 0 | 1 |
| FirmAge | 15,681 | 16.92 | 5.7 | 1 | 17 | 51 |
| SOE | 15,681 | 0.44 | 0.5 | 0 | 0 | 1 |
| HI | 15,681 | 0.17 | 0.12 | 0.01 | 0.14 | 0.56 |
| Indep | 15,681 | 0.37 | 0.05 | 0.29 | 0.33 | 0.57 |
| Board | 15,681 | 9.59 | 2.9 | 3 | 9 | 19 |
| Leverage | 15,681 | 0.46 | 0.21 | 0.05 | 0.46 | 1.23 |
| Growth | 15,681 | 0.2 | 0.52 | −0.69 | 0.11 | 4.09 |
| TobinQ | 15,681 | 2.21 | 1.55 | 0.93 | 1.71 | 10.71 |
| IR | 15,681 | 6.54 | 7.1 | 0 | 4.11 | 35.66 |
| MR | 15,681 | 0.1 | 0.18 | 0 | 0 | 0.69 |
| Year | 15,681 | 2015 | 2.58 | 2010 | 2015 | 2019 |
| Industry | 15,681 | 4.75 | 3.46 | 1 | 3 | 19 |
| Province | 15,681 | 13.75 | 7.74 | 1 | 13 | 31 |
| Panel B: Differences in Firms with and without Teaching Experience of Top Managers | ||||||
| Variables | Without Teachers in the TMT (N = 13,525) | With Teachers in the TMT (N = 2156) | MeanDiff | |||
| CSR | 26.04 | 27.4 | −1.360 *** | |||
| −17.41 | −18.58 | |||||
| CSR Rank | 2.209 | 2.26 | −0.050 *** | |||
| −0.65 | −0.71 | |||||
| CSR Holder | 13.76 | 14.34 | −0.582 *** | |||
| −6.25 | −6.25 | |||||
| CSR Employ | 3 | 3.25 | −0.250 *** | |||
| −3.46 | −3.58 | |||||
| CSR Customer | 2.093 | 2.462 | −0.368 *** | |||
| −5.06 | −5.49 | |||||
| CSR Envir | 2.194 | 2.459 | −0.265 ** | |||
| −5.52 | −5.76 | |||||
| CSR Social | 4.987 | 4.856 | 0.131 | |||
| −4.37 | −4.44 | |||||
| Duality | 0.219 | 0.334 | −0.115 *** | |||
| −0.41 | −0.47 | |||||
| FirmAge | 17.05 | 16.09 | 0.966 *** | |||
| −5.67 | −5.86 | |||||
| SOE | 0.462 | 0.336 | 0.126 *** | |||
| −0.5 | −0.47 | |||||
| HI | 0.168 | 0.156 | 0.012 *** | |||
| −0.12 | −0.12 | |||||
| Indep | 0.371 | 0.377 | −0.006 *** | |||
| −0.05 | −0.06 | |||||
| Board | 9.559 | 9.753 | −0.193 *** | |||
| −2.88 | −3.01 | |||||
| Leverage | 0.457 | 0.454 | 0.003 | |||
| −0.21 | −0.21 | |||||
| Growth | 0.199 | 0.206 | −0.00700 | |||
| −0.53 | −0.5 | |||||
| TobinQ | 2.195 | 2.302 | −0.108 *** | |||
| −1.54 | −1.6 | |||||
| IR | 6.372 | 7.576 | −1.204 *** | |||
| −7.03 | −7.48 | |||||
| MR | 0.091 | 0.131 | −0.040 *** | |||
| −0.17 | −0.19 | |||||
| Panel A: Teaching Experience of Top Managers and CSR Score and Rank | ||||||||||
|---|---|---|---|---|---|---|---|---|---|---|
| CSR | CSR Rank | |||||||||
| (1) | (2) | (3) | (4) | |||||||
| TMTTE | 1.270 *** (0.390) | 0.049 *** (0.015) | ||||||||
| TMTTEratio | 5.606 *** (2.033) | 0.217 *** (0.078) | ||||||||
| TMTmale | 1.719 ** (0.803) | 1.721 ** (0.802) | 0.085 *** (0.031) | 0.085 *** (0.031) | ||||||
| TMTage | 0.162 *** (0.039) | 0.162 *** (0.039) | 0.003 ** (0.001) | 0.003 ** (0.001) | ||||||
| TMTtenure | 0.040 *** (0.006) | 0.040 *** (0.006) | 0.001 *** (0.000) | 0.001 *** (0.000) | ||||||
| Duality | −1.101 *** (0.299) | −1.095 *** (0.298) | −0.036 *** (0.011) | −0.036 *** (0.011) | ||||||
| FirmAge | 0.094 *** (0.026) | 0.093 *** (0.026) | 0.002 ** (0.001) | 0.002 ** (0.001) | ||||||
| SOE | 2.328 *** (0.337) | 2.317 *** (0.337) | 0.098 *** (0.013) | 0.097 *** (0.013) | ||||||
| HI | 19.590 *** (1.189) | 19.551 *** (1.189) | 0.431 *** (0.046) | 0.429 *** (0.046) | ||||||
| Indep | 7.224 *** (2.794) | 7.350 *** (2.797) | 0.430 *** (0.108) | 0.435 *** (0.108) | ||||||
| Board | 0.057 (0.049) | 0.061 (0.049) | 0.003 * (0.002) | 0.003 * (0.002) | ||||||
| Leverage | −9.304 *** (0.696) | −9.295 *** (0.695) | −0.114 *** (0.027) | −0.113 *** (0.027) | ||||||
| Growth | 1.310 *** (0.224) | 1.314 *** (0.224) | 0.020 *** (0.008) | 0.020 *** (0.008) | ||||||
| TobinQ | −1.201 *** (0.087) | −1.203*** (0.087) | −0.030 *** (0.003) | -0.030 *** (0.003) | ||||||
| IR | 0.501 *** (0.020) | 0.502 *** (0.020) | 0.014 *** (0.001) | 0.014 *** (0.001) | ||||||
| MR | 1.041 (0.752) | 1.035 (0.752) | −0.087 *** (0.028) | −0.087 *** (0.028) | ||||||
| Constant | 9.407 *** (2.279) | 9.399 *** (2.281) | 1.622 *** (0.087) | 1.622 *** (0.087) | ||||||
| Province Fixed Effect | Yes | Yes | Yes | Yes | ||||||
| Industry Fixed Effect | Yes | Yes | Yes | Yes | ||||||
| Year Fixed Effect | Yes | Yes | Yes | Yes | ||||||
| N | 15,681 | 15,681 | 15,681 | 15,681 | ||||||
| Adj. R2 | 0.206 | 0.206 | 0.171 | 0.171 | ||||||
| F−Statistics | 97.507 | 97.397 | 49.355 | 49.343 | ||||||
| Panel B: Teaching Experience of Top Managers and Sub−Indicators of CSR | ||||||||||
| CSR Holder | CSR Employ | CSR Customer | CSR Envir | CSR Social | ||||||
| (5) | (6) | (7) | (8) | (9) | (10) | (11) | (12) | (13) | (14) | |
| TMTTE | 0.313 ** (0.129) | 0.262 *** (0.074) | 0.363 *** (0.116) | 0.364 *** (0.122) | −0.059 (0.094) | |||||
| TMTTEratio | 0.943 (0.666) | 0.848 ** (0.356) | 2.048 *** (0.628) | 1.662 *** (0.621) | 0.033 (0.467) | |||||
| TMTmale | 0.443 (0.284) | 0.441 (0.284) | 0.818 *** (0.154) | 0.817 *** (0.154) | 0.525 ** (0.242) | 0.528 ** (0.241) | 0.877 *** (0.244) | 0.878 *** (0.244) | −0.853 *** (0.214) | −0.852 *** (0.214) |
| TMTage | 0.102 *** (0.014) | 0.102 *** (0.014) | 0.023 *** (0.008) | 0.023 *** (0.008) | 0.015 (0.012) | 0.015 (0.012) | 0.031 * (0.012) | 0.031 ** (0.012) | −0.009 (0.010) | −0.009 (0.010) |
| TMTtenure | 0.011 *** (0.002) | 0.011 *** (0.002) | 0.004 ** (0.001) | 0.004 *** (0.001) | 0.010 *** (0.002) | 0.009 *** (0.002) | 0.008 *** (0.002) | 0.008 ** (0.002) | 0.008 *** (0.002) | 0.008 *** (0.002) |
| Duality | −0.189 * (0.109) | −0.183 * (0.109) | −0.231 *** (0.057) | −0.227 *** (0.057) | −0.264 *** (0.087) | −0.267 *** (0.087) | −0.302 *** (0.092) | −0.301 *** (0.092) | −0.132 * (0.079) | −0.135 * (0.079) |
| FirmAge | −0.001 (0.009) | −0.002 (0.009) | 0.011 ** (0.005) | 0.010 * (0.005) | 0.019 ** (0.008) | 0.018 ** (0.008) | 0.010 (0.008) | 0.010 (0.008) | 0.056 *** (0.006) | 0.056 *** (0.006) |
| SOE | −0.076 (0.113) | −0.082 (0.113) | 0.819 *** (0.067) | 0.815 *** (0.068) | 0.574 *** (0.102) | 0.575 *** (0.102) | 0.871 *** (0.104) | 0.869 *** (0.104) | 0.148 * (0.086) | 0.151 * (0.086) |
| HI | 11.033 *** (0.392) | 11.019 *** (0.392) | 1.806 *** (0.236) | 1.795 *** (0.236) | 2.093 *** (0.357) | 2.086 *** (0.357) | 2.494 *** (0.385) | 2.484 *** (0.385) | 2.172 ** (0.281) | 2.177 *** (0.281) |
| Indep | −5.702 *** (0.918) | −5.657 *** (0.918) | 2.751 *** (0.552) | 2.787 *** (0.553) | 4.241 *** (0.822) | 4.264 *** (0.823) | 4.198 *** (0.903) | 4.233 *** (0.904) | 1.493 ** (0.687) | 1.478 ** (0.687) |
| Board | −0.069 *** (0.017) | −0.068 *** (0.017) | 0.019 * (0.010) | 0.020 ** (0.010) | 0.06 1 *** (0.014) | 0.062 *** (0.014) | 0.046 *** (0.016) | 0.047 *** (0.016) | −0.000 (0.012) | −0.000 (0.012) |
| Leverage | −10.694 *** (0.258) | −10.686 *** (0.257) | 0.842 *** (0.135) | 0.847 *** (0.135) | 0.498 ** (0.199) | 0.494 ** (0.198) | 1.235 *** (0.216) | 1.236 *** (0.216) | −1.199 *** (0.189) | −1.203 *** (0.189) |
| Growth | 1.107 *** (0.095) | 1.107 *** (0.095) | 0.060 (0.043) | 0.060 (0.043) | −0.138 ** (0.058) | −0.136 ** (0.058) | −0.073 (0.064) | −0.072 (0.064) | 0.359 *** (0.073) | 0.359 *** (0.073) |
| TobinQ | −0.581 *** (0.036) | −0.581 *** (0.036) | −0.070 *** (0.016) | −0.071 *** (0.016) | −0.163 *** (0.025) | −0.164 *** (0.025) | −0.188 *** (0.024) | −0.188 *** (0.024) | −0.199 *** (0.028) | −0.199 *** (0.028) |
| IR | 0.239 *** (0.006) | 0.239 *** (0.006) | 0.052 *** (0.004) | 0.052 *** (0.004) | 0.087 *** (0.006) | 0.087 *** (0.006) | 0.065 *** (0.006) | 0.066 *** (0.006) | 0.056 *** (0.005) | 0.056 *** (0.005) |
| MR | 3.736 *** (0.288) | 3.741 *** (0.288) | −0.710 *** (0.144) | −0.706 *** (0.144) | −1.120 *** (0.217) | −1.129 *** (0.218) | −0.864 *** (0.238) | −0.867 *** (0.238) | −0.007 (0.189) | −0.012 (0.189) |
| Constant | 13.124 *** (0.780) | 13.106 *** (0.780) | −1.476 *** (0.455) | −1.489 *** (0.456) | −2.862 *** (0.678) | −2.847 *** (0.678) | −3.794 *** (0.743) | −3.794 *** (0.744) | 4.391 *** (0.581) | 4.402 *** (0.581) |
| Province Fixed Effect | Yes | Yes | Yes | Yes | Yes | Yes | Yes | Yes | Yes | Yes |
| Industry Fixed Effect | Yes | Yes | Yes | Yes | Yes | Yes | Yes | Yes | Yes | Yes |
| Year Fixed Effect | Yes | Yes | Yes | Yes | Yes | Yes | Yes | Yes | Yes | Yes |
| N | 15,681 | 15,681 | 15,681 | 15,681 | 15,681 | 15,681 | 15,681 | 15,681 | 15,681 | 15,681 |
| Adj. R2 | 0.283 | 0.283 | 0.188 | 0.188 | 0.171 | 0.171 | 0.172 | 0.172 | 0.221 | 0.221 |
| F−Statistics | 314.271 | 313.551 | 64.138 | 63.944 | 41.760 | 41.851 | 43.110 | 43.243 | 26.504 | 26.468 |
| (1) CSR | (2) CSR Rank | (3) CSR Holder | (4) CSR Employ | (5) CSR Customer | (6) CSR Envir | (7) CSR Social | |
|---|---|---|---|---|---|---|---|
| TMTTEratio (on the board) | 4.638 *** (1.332) | 0.179 *** (0.051) | 0.448 (0.421) | 0.820 *** (0.238) | 1.644 *** (0.405) | 1.574 *** (0.434) | 0.121 (0.293) |
| TMTTEratio (not on the board) | 1.363 (2.046) | 0.057 (0.076) | 1.025 (0.681) | 0.122 (0.358) | 0.437 (0.625) | 0.121 (0.600) | −0.349 (0.504) |
| TMTmale | 1.746 ** (0.801) | 0.086 *** (0.030) | 0.441 (0.284) | 0.822 *** (0.154) | 0.537 ** (0.241) | 0.888 *** (0.243) | −0.850 *** (0.214) |
| TMTage | 0.162 *** (0.039) | 0.003 ** (0.001) | 0.102 *** (0.014) | 0.023 *** (0.008) | 0.015 (0.012) | 0.031 ** (0.012) | −0.009 (0.010) |
| TMTtenure | 0.040 *** (0.006) | 0.001 *** (0.000) | 0.011 *** (0.002) | 0.004 *** (0.001) | 0.009 *** (0.002) | 0.008 *** (0.002) | 0.008 *** (0.002) |
| Duality | −1.116 *** (0.299) | −0.037 *** (0.011) | −0.183 * (0.109) | −0.232 *** (0.057) | −0.273 *** (0.087) | −0.310 *** (0.092) | −0.136 * (0.079) |
| FirmAge | 0.093 *** (0.026) | 0.002 ** (0.001) | −0.002 (0.009) | 0.010 ** (0.005) | 0.018 ** (0.008) | 0.010 (0.008) | 0.056 *** (0.006) |
| SOE | 2.330 *** (0.337) | 0.098 *** (0.013) | −0.081 (0.113) | 0.818 *** (0.068) | 0.579 *** (0.102) | 0.873 *** (0.104) | 0.151 * (0.085) |
| HI | 19.556 *** (1.189) | 0.429 *** (0.046) | 11.029 *** (0.392) | 1.796 *** (0.236) | 2.086 *** (0.357) | 2.482 *** (0.385) | 2.172 *** (0.282) |
| Indep | 7.296 *** (2.796) | 0.433 *** (0.108) | −5.660 *** (0.918) | 2.775 *** (0.553) | 4.247 *** (0.822) | 4.211 *** (0.905) | 1.477 ** (0.687) |
| Board | 0.059 (0.049) | 0.003 * (0.002) | −0.067 *** (0.017) | 0.019 ** (0.010) | 0.062 *** (0.014) | 0.046 *** (0.016) | −0.001 (0.012) |
| Leverage | −9.326 *** (0.695) | −0.114 *** (0.027) | −10.69 *** (0.257) | 0.841 *** (0.135) | 0.484 ** (0.198) | 1.225 *** (0.216) | −1.202 *** (0.189) |
| Growth | 1.313 *** (0.224) | 0.020 *** (0.008) | 1.107 *** (0.095) | 0.060 (0.043) | −0.136 ** (0.058) | −0.071 (0.064) | 0.359 *** (0.073) |
| TobinQ | −1.203 *** (0.087) | −0.030 *** (0.003) | −0.581 *** (0.036) | −0.071 *** (0.016) | −0.164 *** (0.025) | −0.188 *** (0.024) | −0.199 *** (0.028) |
| IR | 0.501 *** (0.020) | 0.014 *** (0.001) | 0.239*** (0.006) | 0.052 *** (0.004) | 0.087 *** (0.006) | 0.065 *** (0.006) | 0.056 *** (0.005) |
| MR | 1.052 (0.752) | −0.086 *** (0.028) | 3.741*** (0.288) | −0.704 *** (0.144) | −1.122 *** (0.217) | −0.862 *** (0.238) | −0.010 (0.189) |
| Constant | 9.430 *** (2.280) | 1.623 *** (0.087) | 13.111 *** (0.780) | −1.480 *** (0.456) | −2.839 *** (0.678) | −3.781 *** (0.744) | 4.400 *** (0.581) |
| Province Fixed Effect | Yes | Yes | Yes | Yes | Yes | Yes | Yes |
| Industry Fixed Effect | Yes | Yes | Yes | Yes | Yes | Yes | Yes |
| Year Fixed Effect | Yes | Yes | Yes | Yes | Yes | Yes | Yes |
| N | 15,681 | 15,681 | 15,681 | 15,681 | 15,681 | 15,681 | 15,681 |
| Adj. R2 | 0.206 | 0.171 | 0.283 | 0.188 | 0.171 | 0.172 | 0.221 |
| F-Statistics | 91.928 | 46.703 | 294.301 | 60.745 | 39.651 | 41.360 | 24.867 |
| (1) CSR | (2) CSR Rank | (3) CSR Holder | (4) CSR Employ | (5) CSR Customer | (6) CSR Envir | (7) CSR Social | |
|---|---|---|---|---|---|---|---|
| CEOTE | 1.540 ** (0.693) | 0.066 ** (0.026) | 0.254 (0.240) | 0.508 *** (0.135) | 0.494 ** (0.201) | 0.593 *** (0.221) | −0.357 ** (0.157) |
| CEOmale | −0.026 (0.533) | −0.011 (0.021) | 0.143 (0.187) | 0.160 (0.103) | −0.105 (0.163) | 0.030 (0.159) | −0.252 * (0.132) |
| CEOage | 0.048 ** (0.020) | 0.001 (0.001) | 0.041 *** (0.007) | 0.005 (0.004) | 0.000 (0.006) | 0.006 (0.006) | −0.005 (0.005) |
| CEOtenure | 0.025 *** (0.003) | 0.001 *** (0.000) | 0.006 *** (0.001) | 0.004 *** (0.001) | 0.007 *** (0.001) | 0.006 *** (0.001) | 0.002 *** (0.001) |
| Duality | −1.357 *** (0.303) | −0.043 *** (0.011) | −0.319 *** (0.111) | −0.276 *** (0.058) | −0.305 *** (0.088) | −0.361 *** (0.093) | −0.112 (0.082) |
| FirmAge | 0.093 *** (0.026) | 0.002 ** (0.001) | −0.001 (0.009) | 0.010 * (0.005) | 0.018 ** (0.008) | 0.009 (0.008) | 0.057 *** (0.006) |
| SOE | 2.821 *** (0.331) | 0.113 *** (0.013) | 0.118 (0.111) | 0.906 *** (0.066) | 0.676 *** (0.099) | 0.996 *** (0.103) | 0.142 * (0.084) |
| HI | 19.464 *** (1.188) | 0.428 *** (0.046) | 10.978 *** (0.390) | 1.837 *** (0.235) | 2.085 *** (0.356) | 2.517 *** (0.386) | 2.051 *** (0.279) |
| Indep | 7.247 *** (2.808) | 0.427 *** (0.108) | −5.590 *** (0.923) | 2.790 *** (0.554) | 4.205 *** (0.824) | 4.214 *** (0.907) | 1.379 ** (0.688) |
| Board | 0.062 (0.049) | 0.004 * (0.002) | −0.067 *** (0.017) | 0.022 ** (0.010) | 0.063 *** (0.014) | 0.049 *** (0.016) | −0.006 (0.012) |
| Leverage | −9.367 *** (0.695) | −0.114 *** (0.027) | −10.719 *** (0.257) | 0.870 *** (0.134) | 0.495 ** (0.199) | 1.256 *** (0.216) | −1.282 *** (0.189) |
| Growth | 1.251 *** (0.223) | 0.018 ** (0.008) | 1.086 *** (0.095) | 0.054 (0.043) | −0.149 ** (0.058) | −0.083 (0.064) | 0.347 *** (0.073) |
| TobinQ | −1.233 *** (0.087) | −0.031 *** (0.003) | −0.595 *** (0.036) | −0.077 *** (0.016) | −0.169 *** (0.025) | −0.196 *** (0.024) | −0.196 *** (0.028) |
| IR | 0.502 *** (0.020) | 0.014 *** (0.001) | 0.239 *** (0.006) | 0.052 *** (0.004) | 0.087 *** (0.006) | 0.065 *** (0.006) | 0.057 *** (0.005) |
| MR | 0.504 (0.744) | −0.103 *** (0.028) | 3.537 *** (0.286) | −0.775 *** (0.142) | −1.228 *** (0.215) | −0.976 *** (0.235) | −0.074 (0.188) |
| Constant | 16.952 *** (1.792) | 1.847 *** (0.068) | 16.379 *** (0.606) | −0.116 (0.353) | −1.448 *** (0.520) | −1.869 *** (0.572) | 4.131 *** (0.455) |
| Province Fixed Effect | Yes | Yes | Yes | Yes | Yes | Yes | Yes |
| Industry Fixed Effect | Yes | Yes | Yes | Yes | Yes | Yes | Yes |
| Year Fixed Effect | Yes | Yes | Yes | Yes | Yes | Yes | Yes |
| N | 15,681 | 15,681 | 15,681 | 15,681 | 15,681 | 15,681 | 15,681 |
| Adj. R2 | 0.205 | 0.171 | 0.281 | 0.188 | 0.171 | 0.171 | 0.220 |
| F-Statistics | 93.966 | 48.115 | 308.589 | 62.509 | 41.402 | 42.078 | 24.781 |
| Panel A: PSM Results | ||||||||
|---|---|---|---|---|---|---|---|---|
| (1) | (2) | |||||||
| CSR | CSR Rank | |||||||
| ATT | 1.303 ** (0.646) | 0.054 ** (0.025) | ||||||
| ATU | 1.794 *** (0.604) | 0.074 *** (0.022) | ||||||
| ATE | 1.726 *** (0.552) | 0.071 *** (0.020) | ||||||
| Observations | 15,681 | 15,681 | ||||||
| Panel B: Covariate Imbalance Testing | ||||||||
| Variable | Sample | Treatment Group | Control Group | %Bias | |Bias| | t-Value | p-Value | V(t)/V(c) |
| Duality | Pre-matching | 0.334 | 0.219 | 25.9 | 11.74 | 0 | ||
| Post-matching | 0.334 | 0.333 | 0.1 | 99.6 | 0.03 | 0.974 | ||
| FirmAge | Pre-matching | 16.087 | 17.053 | −16.7 | −7.31 | 0 | 1.07 | |
| Post-matching | 16.086 | 15.89 | 3.4 | 79.8 | 1.11 | 0.265 | 1.08 | |
| SOE | Pre-matching | 0.336 | 0.462 | −26 | −11 | 0 | ||
| Post-matching | 0.336 | 0.338 | −0.4 | 98.5 | −0.13 | 0.897 | ||
| HI | Pre-matching | 0.156 | 0.168 | −10 | −4.31 | 0 | 0.99 | |
| Post-matching | 0.156 | 0.159 | −2.3 | 76.6 | −0.78 | 0.436 | 1.04 | |
| Indep | Pre-matching | 0.377 | 0.371 | 11 | 4.93 | 0 | 1.22 * | |
| Post-matching | 0.377 | 0.375 | 1.9 | 82.7 | 0.6 | 0.546 | 1.05 | |
| Leverage | Pre-matching | 0.454 | 0.457 | −1.4 | −0.62 | 0.533 | 1.01 | |
| Post-matching | 0.454 | 0.452 | 1 | 32.4 | 0.32 | 0.749 | 0.99 | |
| Growth | Pre-matching | 0.206 | 0.199 | 1.4 | 0.58 | 0.559 | 0.90 * | |
| Post-matching | 0.206 | 0.198 | 1.5 | −6.6 | 0.49 | 0.627 | 0.92 | |
| TobinQ | Pre-matching | 2.303 | 2.195 | 6.8 | 2.99 | 0.003 | 1.08 | |
| Post-matching | 2.303 | 2.271 | 2 | 70.3 | 0.66 | 0.511 | 1.01 | |
| IR | Pre-matching | 7.576 | 6.372 | 16.6 | 7.32 | 0 | 1.13 * | |
| Post-matching | 7.567 | 7.666 | −1.4 | 91.8 | −0.41 | 0.679 | 0.83 * | |
| MR | Pre-matching | 0.131 | 0.091 | 22 | 9.84 | 0 | 1.22 * | |
| Post-matching | 0.131 | 0.133 | −0.8 | 96.5 | −0.23 | 0.815 | 0.89 * | |
| Industry | Pre-matching | 4.983 | 4.708 | 7.7 | 3.43 | 0.001 | 1.22 * | |
| Post-matching | 4.981 | 4.906 | 2.1 | 72.9 | 0.67 | 0.503 | 1.13 * | |
| Province | Pre-matching | 13.225 | 13.832 | −8.1 | −3.38 | 0.001 | 0.82 * | |
| Post-matching | 13.229 | 13.446 | −2.9 | 64.3 | −0.97 | 0.33 | 0.88 * | |
| Panel A: Teaching Experience of Directors and CSR Score and Rank | ||||||||||
|---|---|---|---|---|---|---|---|---|---|---|
| CSR | CSR Rank | |||||||||
| (1) | (2) | (3) | (4) | |||||||
| BoardTE | −0.345 (0.364) | −0.017 (0.014) | ||||||||
| BoardTEratio | 0.204 (1.952) | −0.019 (0.076) | ||||||||
| TMTTE | 1.374 *** (0.434) | 1.171 ** (0.476) | 0.056 *** (0.017) | 0.050 *** (0.018) | ||||||
| BoardMale | 0.672 (1.076) | 0.662 (1.076) | 0.012 (0.041) | 0.011 (0.041) | ||||||
| BoardAge | 0.299 *** (0.050) | 0.293 *** (0.050) | 0.008 *** (0.002) | 0.008 *** (0.002) | ||||||
| BoardTenure | 0.044 *** (0.009) | 0.044 *** (0.009) | 0.001 *** (0.000) | 0.001 *** (0.000) | ||||||
| TMTmale | 1.562 (1.059) | 1.570 (1.059) | 0.084 ** (0.040) | 0.084 ** (0.040) | ||||||
| TMTage | −0.058 (0.056) | −0.053 (0.056) | −0.003 (0.002) | −0.002 (0.002) | ||||||
| TMTtenure | 0.002 (0.010) | 0.002 (0.010) | 0.000 (0.000) | 0.000 (0.000) | ||||||
| Duality | −0.949 *** (0.299) | −0.952 *** (0.299) | −0.032 *** (0.011) | −0.032 *** (0.011) | ||||||
| FirmAge | 0.094 *** (0.026) | 0.094 *** (0.026) | 0.002 ** (0.001) | 0.002 ** (0.001) | ||||||
| SOE | 2.501 *** (0.341) | 2.504 *** (0.341) | 0.102 *** (0.013) | 0.102 *** (0.013) | ||||||
| HI | 19.516 *** (1.185) | 19.513 *** (1.185) | 0.429 *** (0.046) | 0.429 *** (0.046) | ||||||
| Indep | 7.047 ** (2.787) | 7.124 ** (2.785) | 0.423 *** (0.108) | 0.427 *** (0.108) | ||||||
| Board | 0.121 ** (0.049) | 0.118 ** (0.049) | 0.005 *** (0.002) | 0.005 *** (0.002) | ||||||
| Leverage | −9.319 *** (0.694) | −9.329 *** (0.694) | −0.114 *** (0.027) | −0.114 *** (0.027) | ||||||
| Growth | 1.369 *** (0.224) | 1.366 *** (0.223) | 0.021 *** (0.008) | 0.021 *** (0.008) | ||||||
| TobinQ | −1.150 *** (0.087) | −1.152 *** (0.087) | −0.028 *** (0.003) | −0.029 *** (0.003) | ||||||
| IR | 0.492 *** (0.020) | 0.492 *** (0.020) | 0.013 *** (0.001) | 0.013 *** (0.001) | ||||||
| MR | 1.346 * (0.752) | 1.320* (0.752) | −0.078 *** (0.028) | −0.080 *** (0.028) | ||||||
| Constant | 3.518 (2.406) | 3.543 (2.408) | 1.472 *** (0.092) | 1.473 *** (0.092) | ||||||
| Province Fixed Effect | Yes | Yes | Yes | Yes | ||||||
| Industry Fixed Effect | Yes | Yes | Yes | Yes | ||||||
| Year Fixed Effect | Yes | Yes | Yes | Yes | ||||||
| N | 15,681 | 15,681 | 15,681 | 15,681 | ||||||
| Adj. R2 | 0.210 | 0.210 | 0.173 | 0.173 | ||||||
| F-Statistics | 81.324 | 81.311 | 40.535 | 40.412 | ||||||
| Panel B: Teaching Experience of Directors and Sub-Indicators of CSR | ||||||||||
| CSR Holder | CSR Employ | CSR Customer | CSR Environment | CSR Social | ||||||
| (5) | (6) | (7) | (8) | (9) | (10) | (11) | (12) | (13) | (14) | |
| BoardTE | 0.027 (0.125) | −0.087 (0.072) | −0.150 (0.109) | −0.207 * (0.117) | 0.076 (0.089) | |||||
| BoardTEratio | 0.197 (0.629) | −0.284 (0.373) | 0.127 (0.599) | −0.325 (0.636) | 0.462 (0.445) | |||||
| TMTTE | 0.256 * (0.143) | 0.242 (0.155) | 0.306 *** (0.084) | 0.301 *** (0.093) | 0.428 *** (0.129) | 0.334 ** (0.140) | 0.460 *** (0.139) | 0.399 *** (0.153) | −0.106 (0.104) | −0.131 (0.114) |
| BoardMale | −0.312 (0.373) | −0.310 (0.373) | 0.650 *** (0.209) | 0.645 *** (0.209) | 0.113 (0.327) | 0.109 (0.327) | 0.326 (0.332) | 0.317 (0.332) | −0.174 (0.286) | −0.168 (0.286) |
| BoardAge | 0.158 *** (0.017) | 0.158 *** (0.017) | 0.057 *** (0.010) | 0.057 *** (0.010) | 0.036 ** (0.015) | 0.034 ** (0.015) | 0.054 *** (0.016) | 0.052 *** (0.016) | −0.001 (0.013) | −0.002 (0.013) |
| BoardTenure | 0.015 *** (0.003) | 0.015 *** (0.003) | 0.004 * (0.002) | 0.004 * (0.002) | 0.009 *** (0.003) | 0.009 *** (0.003) | 0.009 *** (0.003) | 0.009 *** (0.003) | 0.006 ** (0.002) | 0.006 ** (0.002) |
| TMTmale | 0.753 ** (0.363) | 0.752 ** (0.363) | 0.460 ** (0.205) | 0.463 ** (0.205) | 0.494 (0.319) | 0.498 (0.319) | 0.725 ** (0.325) | 0.730 ** (0.325) | −0.735 *** (0.282) | −0.737 *** (0.282) |
| TMTage | −0.016 (0.019) | −0.016 (0.019) | −0.021 * (0.011) | −0.020 * (0.011) | −0.010 (0.017) | −0.008 (0.017) | −0.008 (0.018) | −0.006 (0.018) | −0.006 (0.014) | −0.006 (0.015) |
| TMTtenure | −0.002 (0.004) | −0.002 (0.004) | 0.001 (0.002) | 0.001 (0.002) | 0.002 (0.003) | 0.001 (0.003) | −0.000 (0.003) | −0.000 (0.003) | 0.003 (0.003) | 0.003 (0.003) |
| Duality | −0.117 (0.109) | −0.117 (0.109) | −0.205 *** (0.058) | −0.205 *** (0.057) | −0.242 *** (0.087) | −0.243 *** (0.087) | −0.273 *** (0.092) | −0.274 *** (0.092) | −0.128 (0.079) | −0.129 (0.079) |
| FirmAge | −0.001 (0.009) | −0.001 (0.009) | 0.010 ** (0.005) | 0.010 ** (0.005) | 0.019 ** (0.008) | 0.019 ** (0.008) | 0.010 (0.008) | 0.010 (0.008) | 0.056 *** (0.006) | 0.056 *** (0.006) |
| SOE | −0.011 (0.114) | −0.010 (0.114) | 0.817 *** (0.068) | 0.817 *** (0.068) | 0.615 *** (0.104) | 0.617 *** (0.104) | 0.904 *** (0.106) | 0.905 *** (0.106) | 0.182 ** (0.087) | 0.183 ** (0.087) |
| HI | 10.953 *** (0.390) | 10.952 *** (0.390) | 1.781 *** (0.235) | 1.783 *** (0.235) | 2.101 *** (0.357) | 2.099 *** (0.357) | 2.491 *** (0.386) | 2.492 *** (0.386) | 2.191 *** (0.281) | 2.188 *** (0.281) |
| Indep | −5.683 *** (0.915) | −5.689 *** (0.914) | 2.767 *** (0.550) | 2.786 *** (0.550) | 4.157 *** (0.822) | 4.191 *** (0.821) | 4.123 *** (0.902) | 4.168 *** (0.902) | 1.452 ** (0.688) | 1.437 ** (0.688) |
| Board | −0.042 ** (0.017) | −0.041 ** (0.017) | 0.030 *** (0.010) | 0.029 *** (0.010) | 0.072 *** (0.014) | 0.070 *** (0.014) | 0.059 *** (0.016) | 0.057 *** (0.016) | 0.001 (0.013) | 0.002 (0.013) |
| Leverage | −10.675 *** (0.257) | −10.675 *** (0.257) | 0.851 *** (0.135) | 0.849 *** (0.135) | 0.484 ** (0.199) | 0.480 ** (0.199) | 1.228 *** (0.216) | 1.224 *** (0.216) | −1.218 *** (0.189) | −1.217 *** (0.189) |
| Growth | 1.133 *** (0.095) | 1.133 *** (0.095) | 0.066 (0.043) | 0.066 (0.043) | −0.127 ** (0.058) | −0.128 ** (0.058) | −0.060 (0.064) | −0.062 (0.064) | 0.363 *** (0.073) | 0.363 *** (0.073) |
| TobinQ | −0.558 *** (0.035) | −0.559 *** (0.035) | −0.064 *** (0.016) | −0.064 *** (0.016) | −0.154 *** (0.025) | −0.155 *** (0.025) | −0.177 *** (0.024) | −0.178 *** (0.024) | −0.196 *** (0.028) | −0.196 *** (0.028) |
| IR | 0.235 *** (0.006) | 0.235 *** (0.006) | 0.051 *** (0.004) | 0.051 *** (0.004) | 0.085 *** (0.006) | 0.085 *** (0.006) | 0.064 *** (0.006) | 0.064 *** (0.006) | 0.055 *** (0.005) | 0.055 *** (0.005) |
| MR | 3.842 *** (0.287) | 3.842 *** (0.287) | −0.623 *** (0.144) | −0.626 *** (0.144) | −1.073 *** (0.217) | −1.085 *** (0.218) | −0.789 *** (0.239) | −0.800 *** (0.239) | −0.019 (0.190) | −0.019 (0.190) |
| Constant | 10.460 *** (0.820) | 10.463 *** (0.820) | −2.680 *** (0.481) | −2.682 *** (0.482) | −3.681 *** (0.716) | −3.669 *** (0.717) | −4.943 *** (0.774) | −4.939 *** (0.775) | 4.310 *** (0.621) | 4.317 *** (0.621) |
| Province Fixed Effect | Yes | Yes | Yes | Yes | Yes | Yes | Yes | Yes | Yes | Yes |
| Industry Fixed Effect | Yes | Yes | Yes | Yes | Yes | Yes | Yes | Yes | Yes | Yes |
| Year Fixed Effect | Yes | Yes | Yes | Yes | Yes | Yes | Yes | Yes | Yes | Yes |
| N | 15,681 | 15,681 | 15,681 | 15,681 | 15,681 | 15,681 | 15,681 | 15,681 | 15,681 | 15,681 |
| Adj. R2 | 0.290 | 0.290 | 0.191 | 0.191 | 0.172 | 0.172 | 0.173 | 0.173 | 0.222 | 0.222 |
| F-Statistics | 257.974 | 257.965 | 53.513 | 53.450 | 34.485 | 34.330 | 35.890 | 35.743 | 21.509 | 21.522 |
Publisher’s Note: MDPI stays neutral with regard to jurisdictional claims in published maps and institutional affiliations. |
© 2021 by the authors. Licensee MDPI, Basel, Switzerland. This article is an open access article distributed under the terms and conditions of the Creative Commons Attribution (CC BY) license (https://creativecommons.org/licenses/by/4.0/).
Share and Cite
Liu, W.; Ren, T.; Tang, W. Teachers in the Top Management Team and Corporate Social Responsibility. Sustainability 2021, 13, 13795. https://doi.org/10.3390/su132413795
Liu W, Ren T, Tang W. Teachers in the Top Management Team and Corporate Social Responsibility. Sustainability. 2021; 13(24):13795. https://doi.org/10.3390/su132413795
Chicago/Turabian StyleLiu, Wenyuan, Ting Ren, and Weishan Tang. 2021. "Teachers in the Top Management Team and Corporate Social Responsibility" Sustainability 13, no. 24: 13795. https://doi.org/10.3390/su132413795
APA StyleLiu, W., Ren, T., & Tang, W. (2021). Teachers in the Top Management Team and Corporate Social Responsibility. Sustainability, 13(24), 13795. https://doi.org/10.3390/su132413795