1. Introduction
In the Mediterranean,
Posidonia oceanica (PO) is one of the most important seagrass carbon sink species for the variety and extension of its meadows, but it is increasingly at risk and sometimes in decline, with the frequent reduction of its extent and an increase in meadow fragmentation [
1,
2,
3]. This arises from the variations in sea water parameters (i.e., turbidity, temperature, acidity and salinity) linked to climate change and impacts from anthropogenic activities (fishing, traffic of ships and oil tankers and new coastal infrastructures) with coastal habitat modifications even favorable to tropical alien species invasion [
4,
5,
6,
7]. Like other seagrasses, PO plays a role of paramount importance in coastal habitats worldwide, providing ecological goods and ecosystem services that contribute to human welfare and shoreline protection [
8]. To evaluate the ecological status of PO meadows, different approaches have been developed using the relationship between their genetic/genotypic diversity [
9,
10] and the main biophysical parameters (i.e., shoot density and LAI) that, today, can be effectively monitored and mapped using integrated approaches based on remote sensing techniques [
11].
The recent advances in Earth Observation (EO) applications, based on satellite and airborne platforms [
12], provide operative tools for supporting extensive monitoring needs for sustainable management of sea/inland waters [
13,
14] and agri-ecosystems, natural and managed [
15,
16], in various environments of the Earth’s surface [
17,
18]. However, EO based monitoring of shallow waters and seabed of the coastal environment characterized by anthropogenic impacts, still represents a challenge, due to coastal water turbidity often associated with various atmospheric effects and noises, combined with the difficulties of in situ sampling for collecting sea truth calibration data of submerged plants on the seabed by means of scuba diving. These are important limiting factors to useful exploitation of EO high resolution (HR) data for extensive mapping of PO and coastal seabed and water quality parameters [
14,
19], especially where the coastal sea currents are significant, as in the Southern Mediterranean islands, with consequent additional signal degradations from increased water turbidity from sediment resuspension and sun-glint presence [
20,
21,
22].
The Italian islands of the southern Mediterranean, such as Pantelleria and Lampedusa, generally present transparent coastal waters and PO meadows, with seabed habitats that still exhibit significant levels of biodiversity and specific adaptation to the accentuated energy levels of sea waves that characterize this area of the Sicily Channel [
2,
20]. This aspect has favored the installation of the first Italian Inertial Sea Wave Energy Converter (ISWEC) there, choosing Pantelleria as a representative of many small-islands in the Mediterranean Sea, whose energetic independence through eco-compatible innovative solutions can improve life of the isolated coastal communities while safeguarding their coastal fragile ecosystems from the perspective of global sustainability [
23].
Despite their shallow water wealth and natural heritage, often safeguarded in protected areas, the actual increase in anthropogenic activities, linked to tourism and fishing, negatively impacts on these natural ecosystems, with consequent potential damage and a need for more effective monitoring to support their sustainable management. Other threats derive from the difficulties of supplying potable water and electrical power to many islands not connected to the national electricity grid, where additional factors of environmental impacts come from the traffic of boats carrying fossil fuels for local electricity production, also used for desalinization of sea water [
24].
In order to provide eco-compliant electricity power from renewable resources, in 2015, the ISWEC prototype was installed for testing purposes in the coastal area offshore of Pantelleria. Even designed to minimize the impacts, the prototype installation and operation involved interactions with local PO and seagrass meadows, with possible plant damage and water transparency decreasing due to seabed sediment resuspension [
25].
Thus, the effective monitoring of the local PO ecosystems in the two islands is recommended in order to allow the detection of potential stress and damage linked to the in-crease in anthropogenic activities mentioned above and/or other natural factors. In the 2015 and 2016 years, two measurement campaigns were carried out in the vicinity of the ISWEC prototype for collecting sea truth data on PO meadows [
24,
26].
Satellite EO-based approaches for PO and seagrass monitoring can be very effective, but they must be based on suitable HR sensors, as well as effective atmospheric preprocessing and calibration using appropriate in situ measurements. Once suitably corrected for atmospheric noise, the satellite HR EO techniques can provide effective multiscale tools for monitoring marine ecosystems on shallow water seabeds. However, the basic requirements for characterizing the PO meadow and sub-merged habitats of shallow waters as well as their distribution patches at the “land-sea” inter-face area, in optically complex coastal waters, first focus mainly on remote HR sensors within the 30–10 m of ground resolution (a.g.r.) and suitable radiometry, sensible to weak signals coming from the coastal seabed [
20,
21]. In recent years, various satellite sensors have started to provide EO data with these features for EO applications, such as multispectral Landsat 8 OLI by NASA and Sentinel 2 MSI (of the Copernicus ESA EU program), or the most recent hyper-spectral PRISMA, implemented by the Italian space agency (ASI), having different additional capabilities based on its 240 narrow acquisition bands, to be checked for these specific coastal monitoring applications. These sensors, compared to previous ones of the same family, in addition to the increase in the acquisition bands in the visible and NIR, present improvement in their radiometry that offers greater capacity in different EO applications [
27], in particular, for operational monitoring of coastal ecosystems previously unavailable [
19,
20]. In particular, the PRISMA sensor makes available the opportunity to test this satellite EO hyperspectral technique in this specific sector, where airborne remote sensing techniques have been mostly used.
Since atmospheric noise can greatly affect the useful reflectance signals exiting from the water surfaces, the radiometric preprocessing must include an effective atmospheric correction to remove the significant contribution from the aerosol load and other factors typical of the water column and sea-land interface [
28,
29]. In addition, the necessary sea truth measurements, devoted to quantitative PO characterization, are expensive and labor-intensive due to human and instrumental resources needed to operate during diving for sample collection and subsequent laboratory analyses.
Considering these limiting factors, in this work, original EO-based monitoring/mapping methods for the useful exploitation of information extracted from the exiguous number of available in situ measurement stations, were implemented. The developed approach allowed us to exploit the radiometric variability related to EO data of the entire sampling area (~50 m
2) of Pantelleria measurement stations used in the previous campaigns. The sea truth data of the ISWEC campaigns were then exploited within a calibration/validation schema for the regression models, based on some machine learning regression algorithms (MLRA), designed to be robust against possible outliers and incomplete/limited samples [
30,
31,
32].
Recently, machine learning/artificial intelligence (AI) computer applications have increasingly gained popularity, especially in sectors where there is a need to make effective predictions or trends calculations in the presence of limited/incomplete calibration/training data, statistical noise or collinearity presence, taking advantage of the so-called increasing Big Data availability and robust statistical modelling advances. One of them refers to remote sensing EO applications, where the increase in spectral/spatial capabilities of the new sensors on board of the operative satellite platforms provides an unprecedented amount of EO data, continuously upgraded and made available online to the users [
33,
34]. On the other hand, in EO based monitoring and modelling applications, the frequent necessity to face growing costs and resources to collect expensive in situ data reduces the possibility to plan a calibration as ample and complete as needed and desired. Machine learning algorithms (MLAs) and schemas were developed to more effectively exploit this kind of incomplete information through their self-adapting and learning capacities for useful predictive modeling with suitable assessment of mapping functions from inputs to outputs, optimized function approximation or classification [
33]. In particular, they focus on two typical main usages of EO data processing, involving the classification and regression approaches [
31]. The classification aims at predicting a discrete class of output labels from input data (typically, EO data as atmospherically corrected multi/hyperspectral reflectance responses), after a learning phase termed training. The regression is instead aimed at predicting continuous quantities on the basis of input (the EO data) and a function model obtained from a calibration set of input/output data. To support the development of a methodology for monitoring and mapping the PO habitats in these islands, various typical MLA were preliminarily considered for regression (MLRA) modeling and supervised classification (MLCA) of the multi/hyperspectral data, taking into account their different capabilities and performance in various situations of noise, limited class samples and outlier presence in input data that frequently occurs in EO applications for coastal marine monitoring [
34,
35,
36].
These satellite remote sensing HR techniques were combined with in situ point measurements of biophysical parameter to monitor and map the PO meadows and benthic habitats in the shallow coastal waters of the Pantelleria and Lampedusa islands [
24,
26].
Starting from the in situ measurements of the density and Leaf Area Index (LAI) of PO, estimated for the sampling station areas in proximity of the ISWEC installation, various distributions of these important biophysical parameters were assessed in the coastal shallow waters of Pantelleria, using regression models based on different MLRA algorithms and the original calibration/validation schema with Sentinel 2 MSI multispectral data [
37,
38].
According to Pergent [
39], the developed methodology included the assessment of the health distribution of PO located along the entire coast of Pantelleria island, using bathymetry and the EO-derived PO density distribution.
The distribution of PO meadows and other seabed classes of the Lampedusa coast were estimated through PRISMA hyperspectral data by means of an advanced MLCA and supervised classification scheme, using the side scan sonar and preexisting data, available for the western part of the coastal seabed [
40,
41], as training/validation set [
42,
43].
The Environmental Mapping and Analysis Program (ENMAP) software box package was used for both regression and classification tasks, based on learning machine algorithms [
38]. This software is integrated into the free and open-source widely distributed QGIS. It was developed in the framework of the German hyperspectral EO HR mission, with the launch of the satellite mission expected in the next few months and a sensor similar to the operative PRISMA of ASI. The PRISMA data, distributed as hdf5 format files, was decoded using the PRISMAREAD package, working in the R statistic environment [
44].
2. Materials and Methods
2.1. Methodology
In the developed methodology, the S2 and PRISMA EO data have been preprocessed using different atmospheric correction options, available through the packages considered (ACOLITE, ICOR, System Preprocessors of EO Data Provider). They were then exploited for assessing regression/classification models, based on sea truth independent data and MLA, whose effectiveness was assessed by means of a performance metric using various statistical parameters. In such a way, at the same time, both the atmospheric correction effectiveness and algorithm suitability were evaluated. The most performant models were then used for the production of the final thematic maps of seabed classes and biophysical parameter distributions of PO, on which are based the intercomparisons and considerations at different scales, referring to the anthropogenic and natural impact factors.
As reported in the methodology scheme (
Figure 1), each of the visually selected (based on cloud cover and water turbidity patterns) frames (S2 or PRISMA), was corrected using the three atmospheric correction preprocessing options available in the two packages, obtaining three different corrected products: Adjacency corrected bottom of atmosphere reflectance (BOA), BOA (without adjacency correction) and water leaving reflectance (see
Section 2.4.1). These atmospherically corrected products were used to estimate the regression or classification models through MLA, for the areas of interest of Pantelleria and Lampedusa, using the sea truth information available as calibration/validation data. The model performance was then evaluated using an error/correlation metric for MLRA and an accuracy metric for MLCA. The final maps were finally produced by means of the best models found.
2.2. Areas of Interest and EO Data
In 2015, ESA (European Space Agency) launched on board of Sentinel 2 (S2) A polar satellite, the MultiSpectral Instrument (MSI) sensor, able to acquire data at 10 m of a.g.r., and providing EO data with improved radiometry and revisiting capability of 5 day, based on the twin platform, Sentinel 2 B, that became operational shortly after the first one. These spectral-spatial characteristics of S2, with visible channels and NIR at 10 of a.g.r., provide a useful tool to effectively support the extensive monitoring of shallow coastal waters and their seabed. In the 2019, the hyperspectral sensor PRISMA (240 acquisition bands) by ASI, became operational and with its capability of many acquisition channels in the visible range, at 30 m of a.g.r., currently represents an unprecedented opportunity even for the applications in the coastal monitoring sectors.
The 10-m multispectral HR data, provided by the S2 MSI satellite sensor, including the entire coastal areas of interest, were acquired and preprocessed, with the objective of testing their improved monitoring capabilities of PO distribution with the related LAI and other biophysical parameters. Furthermore, the hyperspectral data in the VIS-NIR (visible—near infrared) range (470–970 nm) at 30 m of a.g.r., provided by PRISMA, has been tested for mapping the PO meadows and seabed in the coastal shallow waters of Lampedusa.
Figure 2 shows the Pantelleria island image in true color acquired by S2 on 20 August 2015 (upper part), with the detailed area of interest (lower part) including the sampling station areas indication and global localization map (lower right corner). The ISWEC prototype is visible in the area of sampling station n. 1. The detailed image also shows the sea waves perturbing the water surface with sun-glint and sediment suspension that introduce noise to the useful EO reflectance signals from the seabed and shallow water.
The monitoring activities in Pantelleria were primarily focused on the area of the ISWEC installation but with the perspective of testing the spatial extensibility of calibration, carried out in the proximity of the converter (visible within the sampling station 1 borders in
Figure 2) and then over the remaining coastal areas of the island. The position of the converter was chosen on the basis of the energy distribution of wave motion along the coasts of the island, evaluated through oceanographic modeling and multi-temporal data appropriately acquired at adequate resolution. It is located within areas where there are sparse PO meadows that need to be monitored to highlight any consequent potential threats. According to coordinate system used for the sea truth data, the UTM WGS 84 zone 33 N metric cartographic projection was adopted.
Taking into account Lampedusa’s smaller size (
Figure 3), an EO derived map of its PO meadows and other seabed main classes was created for the entire island’s coasts, using the partial distribution obtained through side-scan sonar data as training/validation set.
2.3. Sea Truth
In general, the sea truth surveys for the assessment of PO focus mainly on the characterization of meadows with continuous distributions (cover > 60–80%), without any optimization aimed at providing an area-based effective calibration for modelling based on EO data. In the case of discontinuous, fragmented and patchy distributions of PO meadows, the in situ calibration for the extensive distribution estimate of their biophysical parameters through EO data, should require the assessment of the entire local area of interest, including the sub-areas lacking plants, with a mean cover percentage lower than 20% that must be accounted for. To address this limiting factor, an original methodology has been exploited here for the sea truth acquisition of calibration measurements on the fragmented PO meadows near the ISWEC installation in Pantelleria based on a systematic sampling scheme (
Figure 4). To better deal with PO patchy distribution, an on-purpose implemented sampling method was exploited that allowed the estimation of a percent cover parameter using a semiautomatic digital procedure, from digital images of measurement plots acquired by scuba. The estimated cover parameter was then exploited for refining the in situ LAI distribution assessment, more area than meadow oriented, with the specific objective of improving EO calibration [
24,
26].
The ISWEC prototype was installed in late July-early August 2015, and the first sea truth campaign was carried out in the second half of August, while the second one started in the middle of October of the following year. During the campaigns, various measurements of several biophysical parameters related to PO phenology have been acquired, in correspondence with sampling stations distributed along the bathymetric negative gradient, starting from the converter prototype location, at 31 m. of depth (
Figure 4). Three measurement stations in 2016 were located at the same coordinates as those exploited in 2015, while the fourth was positioned between the last two, at about 30 m. of bathymetry. Some GPS techniques and other auxiliary instrumentation (i.e., compass, underwater digital photo camera and containers for plant samples), used in diving supported information collection of in situ biometric measurements which were completed with the subsequent laboratory analyses for the assessment of the biophysical parameters of interest (biomass, shoot density, cover and LAI). The work in the field, consisting mainly of the underwater activities using the 1 m
2 sampling frame (
Figure 5) and auxiliary instrumentation, took place in the second half of last August and in the middle of October, respectively, according to logistic and organization constraints and weather/sea conditions. From the perspective of EO based regression model calibration and in accordance with the most popular protocols, for each measurement station, a systematic sampling scheme based on 1 m
2 plots was exploited (
Figure 5). The measurement stations are identified by their respective GPS center coordinates on the surface and are associated with the related plots, each of 1 m
2, where the biophysical measurements and samples were collected using an oriented frame with the objective of allowing the characterization of an area compatible with the a.g.r. of satellite images. The station coordinates coincide with those of plot n. 1 center, while the d parameter of the plot scheme was set at 25 m, in order to cover a square area of about 50 m
2, corresponding to the 5 × 5 pixel of the S2 MSI sensor. In addition, RGB digital images of plots, taken with a special underwater camera, including approximately the frame with a defined orientation, were acquired to support the development of a robust, innovative and semi-automatic procedure for the estimation of more reliable coverage/density values (see below). Various phenology parameters of PO were visually assessed within each plot identified by a North-oriented white frame (
Figure 3), whose photograph image was taken preliminary to other diving measurement activities. The density was appraised by visually counting the number of shoots (shoot/m
2) in the North-West quadrant of the sampling frame. Some PO plant samples (3–5 shoots) were then collected from the North-West quadrant of the frame and properly stored for the successive laboratory analyses. Consequently, by applying the conventional protocol, the average density was calculated and expressed as the number of shoots/m
2 for the whole station area. The laboratory analyses provided the characterization of phenology (i.e., LAI) and physiological parameters of PO samples, such as biomass (fresh and dry weight) and biometry, together with genetic polymorphism for the determination of the genetic structure of the meadows (these genetic and other aspects will be widely discussed in another ongoing paper). The most common protocols for estimating the coverage of the PO meadows in diving are based on the visual evaluation of the percentage coverage of PO within a plot sample area. This estimate is likely always affected by approximations due to the subjectivity of the operator, further worsened by uneven lighting situations and various limitations related to underwater operating modes. The use of digital images of the area of interest at adequate resolution, duly oriented and preprocessed, allows areal assessment through semiautomatic operating procedures aimed at increasing repetitiveness and the reliability of the assessed cover values. Some digital preprocessing procedures, on purpose developed for both radiometric (normalization for illumination unevenness) and geometric (perspective and frame rectification/overlay) corrections of the acquired image of the station plots (
Figure 4), were applied before we proceeded with a supervised segmentation/classification algorithm. Ultimately, since the inhomogeneity in the illumination was mainly between the left and right side of the images, a normalization based on the polynomial model of the RGB intensity averaged over the column was adopted for the correction. The perspective correction was carried out using a first order geometric transformation of the input image calibrated to the 1 m
2 sampling frame (included in the picture), to obtain the resampled output at 0.2 cm of pixel resolution. The true color corrected image was then classified using a maximum likelihood (ML) supervised schema with three classes (seabed, PO and frame) whose relative surface measure was easily quantified after clipping the frame area.
The classification output, without subjective photointerpretation, allowed us to appropriately segment the preprocessed image into three classes consisting of PO (green), sea bottom (blue) and frame (
Figure 5 bottom right), from which it is possible to easily derive the coverage percentage of the PO. The procedure developed was then applied to the entire set of plot images acquired for each sampling station.
At the ENEA Casaccia laboratory, Biomass and Biotechnology for Energy, the biometry of each plant (number, length and width of the collected leaves) was also estimated, and the biomass was calculated in both fresh and dry weight after drying at 70 °C for 72 h, both in the epigeal (foliar) and rhizome. After being removed from the plants, the young leaves were washed in distilled water to remove the epiphytes before being placed in liquid nitrogen and stored at −80° for the subsequent analyses. The density distribution of the PO (shoots/m2) at station level was derived by averaging the values assessed in diving on its plots.
Following the consolidated methods, the LAI and other parameters, at the level of the single stations, were calculated by averaging the laboratory biometric measurements of samples collected at plot level (i.e., PO leave areas and number of leaves per shoot, wet/dry specific weight) and related density values, with final normalization accounting for plot surface. The percent cover, obtained from digital processing of frame imagery taken while diving, was then introduced as a multiplying correction factor aimed at the optimization of the calibration of the regression modelling approaches based on EO data (see next chapter).
In 2016, the PO meadows of Lampedusa (western part) were preliminarily mapped using side-scan sonar on board a ship with the goal to update the preexisting data [
40,
41]. In addition to the seabed classes of PO, some others related to differently grained sand and rock were also discriminated against (
Figure 6). Given the scarce sonar detection capability of low-density seabed vegetation, in addition to suitably detected PO, a sparse (potential) PO class was introduced too. The three classes of differently grained sand and dunes, discriminated by sonar acoustic waves due to their textures not easily detectable in EO data, were grouped into just two. According to the historical maps, the most reliable part of this achieved data was used for the training/validation of MLCA (see next chapter), in the form of stratified randomly selected points extracted for the seven seabed classes.
2.4. EO Data Processing and Calibration
The available EO frames, compatible with the sea truth data, were first selected on the basis of visual inspection, checking the presence of cloud cover and water turbidity patterns in the areas of interest. The selected data, atmospherically corrected using the different options, was then exploited in the MLRA and MLCA modelling approaches based on the sea truth calibration/training sets and using the various MLA algorithms. In the end, the final choice in terms of frame, preprocessing options and MLA combinations, was accomplished on the basis of the performance parameters assessed in the model validation/accuracy assessment steps.
2.4.1. Atmospheric Pre-Processing
The general approach to water applications, based on the near infrared (NIR) reflectance channels for characterization of atmospheric aerosol parameters (i.e., aerosol optical depth as AOD) distributions, in the case of shallow water, typical of oligotrophic open oceans, has proven to be less effective for monitoring shallow-water environments and seabed, including seagrass and PO coastal ecosystems [
45]. In fact, coastal waters are rarely oligotrophic due to their frequent optical complexity, with high concentrations of various optically active substances (case II waters), which is often accentuated by sediment suspension dispersed in the water column, in the form of total suspended matter (TSM) concentration, which is increased by sea waves and currents. To properly address these difficulties in coastal water remote sensing, our approach includes atmospheric correction, mainly accomplished using the current version of the ACOLITE package, specifically designed for atmospheric correction of multispectral remote sensing data at decameter resolution, for monitoring applications in coastal or inland waters, even with non-negligible turbidity [
43]. It preliminarily starts with aerosol DSF fitting and system correction to produce a BOA reflectance distribution (without taking into account the detailed distribution of aerosol effects), then the corresponding WLR (water leaving radiance/reflectance) is assessed (taking into account the detailed aerosol effect distribution), if the retrieved aerosol distribution (AOD) reaches a sufficient noise level to degrade the water reflectance responses [
46,
47]. The package also provides the subset function of the area of interest, automatic selection of water surfaces (WLR option), and sun-glint removal from the processed multispectral data. This capability is remarkably favorable if we also consider the turbidity of the waters due to the accentuated hydrodynamics of the marine area of Pantelleria, caused both by the morphology of its coastal seabed and by the relevant intensity of the sea current field, which, especially in summer, characterizes this area of the Strait of Sicily. This aspect constitutes a limiting factor in the selection of exploitable satellite acquisition frames for the monitoring of its shallow waters, which, in summer, are considerably few, due to the presence of excessive diffuse turbidity and significant sun-glint effects (
Figure 2).
The radiometric correction for quantitative monitoring of the coastal seabed where the PO plants grow, in addition to atmospheric AOD, must take into account additional noise contributions from other factors, such as water column and adjacency effects [
48,
49]. Given the normal situation of water limpidity along these islands’ coasts in case of current minima, the selection of the few frames without visible turbidity pattern affecting the areas of interest is assumed to guarantee negligible water column attenuation noises. Adjacency effects result from contamination of water reflectance signals of interface pixels (frequently including useful signals from PO plants) from contiguous land areas, depending on atmospheric scattering and AOD [
49]. Thus, for intercomparison purposes, another atmospheric correction package, named ICOR [
50], not specifically devoted to water applications, is also exploited. The code is able to produce BOA distribution, including this radiometric correction, not performed by ACOLITE (i.e., adjacency). The ACOLITE code is based on the dark spectrum fitting (DSF) algorithm for the optimized estimation of the reflectance of coastal and inland waters, even with non-negligible turbidity, with optional correction for sun-glint effects. In essence, DSF, instead of assuming a negligible signal over water in predefined NIR or SWIR bands, and some spatial extent of aerosol type and concentration, aims to achieve spatial-spectral modelling by choosing the optimal bands for a given image or subset of images. Recent studies have found good performance of the DSF algorithm in optically complex coastal or estuarine waters [
46].
To test the capabilities of the S2 MSI satellite sensor for mapping the PO meadows in the shallow waters of the island of Pantelleria, various multispectral frames taken in 2015 and 2016, at different levels of preprocessing, referring to different seasonal periods, have been first selected on the basis of both cloud coverage and turbidity patterns from sea current intensity.
For the atmospheric correction, the used approach was the so-called “image-based” one, which exploits the specific information contained in the same multispectral image to be corrected and does not require further in situ measurements in the field, simultaneous with the satellite passage. Moreover, being easy to apply, it is suitable for our operational use.
In general, the S2 frames are available at two atmospheric basic preprocessing levels, termed TOA (top of atmosphere) and standard atmospheric correction (performed through the Sen2Cor default processor), which is used for retrieving bottom atmosphere surface reflectance (BOA), without any refinement specifically devoted to suitably retrieving WLR. The latter includes both the contribution of optically active components in the water column, mainly including sediments (TSM) and CDOM (colored dissolved organic matter), in addition to phytoplankton, as well as that relating to the coverage of the shallow seabed, coming from seagrass, macro-algae and various benthic substrates. To provide WLR distribution, more appropriate for our application, the ACOLITE package, recently made available in its last version among the open-source scientific codes, was introduced. The ACOLITE code was designed to be specifically applied for atmospheric correction in coastal and inland water EO monitoring applications and provides corrections for sun-glint with the production of both BOA and WLR corrected reflectance distributions (only in case of aerosol presence), with automatic detection of water surface, but it does not include the adjacency effect removal.
Therefore, the radiometric correction of the selected frames for atmospheric effects was carried out also through the ICOR code integrated into the SNAP ESA (European Space Agency) package, which was not specifically conceived for preprocessing water surface imagery but is able to correct reflectance signals for adjacency effects. This last correction could be very important for the effective monitoring of the coastal shallow waters at the land-sea interface, due to the possible contamination of the upper reflection values by the contiguous earth zones. In this context, given the unavailability of processing tools able to perform all the radiometric corrections cited above, it was introduced to allow a comparison of the relative weights of the different noise effects.
Considering the spectral ranges useful for water penetration and land-water dis-crimination, the PRISMA hyperspectral data in the 411–708 nm range (38 bands) has been selected preliminarily from its VIS-NIR dataset (66 bands) for the modelling step. Then they were used as they had been provided, directly under the form of BOA, without any water surface optimization and adjacency/sun-glint effects removal, due to the unavailability of devoted processing packages. The classification carried out using the MLCA and the information from the multiple PRISMA bands, in addition to the distribution of the seabed classes, allowed a reliable estimate of the relative probabilities and levels of confidence of the result, with the possibility of using a threshold for the effective selection of the unclassified areas.
2.4.2. Modelling and Classification
The preprocessed S2 multispectral images were first exploited for assessing the distribution of PO biophysical parameters near the ISWEC converter of Pantelleria, using different MLRA and sea truth calibration data collected in correspondence with the measurement stations.
The objective of regression is to forecast a target value based on independent predictors under the hypothesis of a cause/effect relationship function model between variables, to be estimated using suitable known input-output values as a calibration data set. Regression techniques mostly differ based on the number of independent variables and the type of relationship between the independent and dependent variables. The widely diffused linear regression works well in the case of linear relationships and an optimal calibration set, but in the case of model functions not known, and different from linear dependence with a lacking calibration set, the results can be unsatisfactory. This situation is typical of EO based monitoring applications, especially in shallow waters and coastal seabed habitats, where the non-linearity of model functions and non-optimal and lacking calibration sets deriving from sea truth collection difficulties often occur. This is mainly linked to the complexity of radiative light interactions involved, coupled with the expensiveness in terms of cost and resources needed for sampling and measurements in scuba diving activities.
In general, regression models, based on field measurements (independent variables and responses), are usually implemented through a well-established calibration and validation (CV) schema, in order to provide better predictive power. The calibration delivers the function model parameters by optimal fitting the responses of interest (i.e., LAI) using physically or statistically based function models of independent variables (the spectral reflectance EO data) for a subset of the available measurements. In validation, the remaining measurements, different from those of calibration, provide a realistic predictive capability of the estimated model using independent data. In such a way, a more realistic evaluation of performance and expected errors may be available for the successive running of the calibrated model. In this framework, a sufficient number of measurements, likely greater than the few available at the station level, is required to apply such a scheme to suitably calibrate and validate models assessed, while also providing reliable insights into their robustness in terms of statistical significance and predictive power. In order to try to lower this negative impact linked to sea truth calibration incompleteness, we used both advanced machine learning algorithms, possibly robust against this unfavorable aspect, coupled with the partial expansion of the calibration data based on the radiometric variability in the area of the sampling stations, as explained in the following. For each station, the sea truth data of PO biophysical parameter variables was derived from in situ and laboratory measurement protocols as averages of plot systematic point sampling in a 50 × 50 m area around the station center coordinates (
Figure 4), while their resulting standard deviation was assumed as station measurement error. Therefore, an area of equivalent dimensions compatible with that seen by the S2 MSI satellite sensor, approximately equal to 5 × 5 pixels (window), centered on the single station, was used for the extraction of the corresponding point spectral signatures at pixel level. These different spectral signatures of the pixels crossing the areas of every measurement station were singularly used to suitably support the calibration/validation steps in the selected regression modelling approaches. In addition, considering the low number of stations sampled, a virtual station (station 0) was introduced in the vicinity of others where the bathymetry is incompatible with the presence of PO, in order to better constrain the models.
Preliminarily, various S2 MSI frames, including the area of interest (AOI), were selected on the basis of cloud coverage and other noise (sun-glint and current turbidity patterns) minimization. Then, the sea truth data with the corresponding spectral signatures extracted from station areas on the atmospherically pre-processed AOI images in the selected frames, were preliminarily tested using the MLRA approaches, available within the ENMAP toolbox running in the QGIS environment [
38].
During the preliminary phase, in addition to the usual linear regression, the machine learning regression algorithms tested were: Gaussian process regressor (GP), kernel ridge (KR), linear support vector machine regressor (LSVR), partial least square (PLS), random forest tree (RF) and support vector machine (SVR). Most of these approaches can provide effective and efficient solutions for regression and classification supervised tasks in EO data applications [
30,
33,
34], using the preventive and effective transformation of the raw variables into higher dimensional representations of feature space, via different kernel functions, with the capability to suitably handle non-linearity of models with collinearity and other weaknesses in calibration/training data. The support vector machine algorithms (LSVR and SVR) are based on the non-parametric supervised statistical learning technique, with robustness against outliers and limited training. They are able to estimate a hyperplane in the feature space that minimizes misclassifications. The RF consists of a group of decision trees induced by different sub-sets of the training data. Each tree in the forest casts a vote for the class with which a given analysis unit (in this case, a given segment) should be associated. The class with the most votes is the one associated with the segment [
33]. Various statistical performance indicators were considered, starting from those of different error metrics arising from the difference between modelled/measured values under the form of mean error (ME), mean absolute error (MAE), root mean square error (RMSE), mean square error (MSE) and median absolute error (MedAE). In addition, others, linked to correlation between variables, such as ratio of performance to Deviation (RPD), squared Pearson’s (r
2), explained variance score and coefficient of determination (R
2) were also included. For the parameters of the first group based on different error metrics, minimization of their absolute values is required, while for others, linked to the correlation between calibration measurements, absolute maximum values are the best ones when superior to one for RPD and close to 1 for the absolute values of the others.
The supervised classification of the PO meadows and seabed covers in the coastal shallow waters of Lampedusa was implemented using the GP, LSVC, RF and SVR MLCA, introduced above [
34,
35]. The training/validation set was obtained from point samples randomly extracted (stratified scheme) from various areas of the side scan sonar map, previously verified on available historical maps and georeferenced in order to guarantee its satisfying overlay with the PRISMA and S2 frames (RMS 1.5 pix). The relative performance of classifiers was evaluated via different accuracy metrics based on overall accuracy (OA), K-statistics (k) and mean-F1 accuracy parameters, derived from the related confusion matrices [
26], with the best results linked to the maximization of values.
All the EO multi/hyperspectral data, extracted from images (previously selected by visual inspection of quick look) and subsequently corrected atmospherically using the available preprocessing options, was used for modeling through MLA in the regression and classification procedures. The selection of the best combination of frames, preprocessing option, and MLA, in terms of global performance was accomplished based on results obtained in the validation step implemented through a 3-fold cross-validation method. This latter includes a random selection into three groups of the available sea truth data and related spectral signatures, and then one of them is used for calibration/training and the remaining two for validation/accuracy assessment. This step is repeated twice using the other two group combinations, and then the final values of the performance indicators are obtained as averages of the three partial outputs. Consequently, the final output choice was then performed, based on the performance parameters obtained in the modeling phase, for each frame and related atmospheric preprocessing option and specific MLA algorithm used. The thematic maps of the LAI-c and density continuous distributions of Pantelleria PO meadows and the seabed classes, including PO, of Lampedusa, were produced using the best combination previously found.
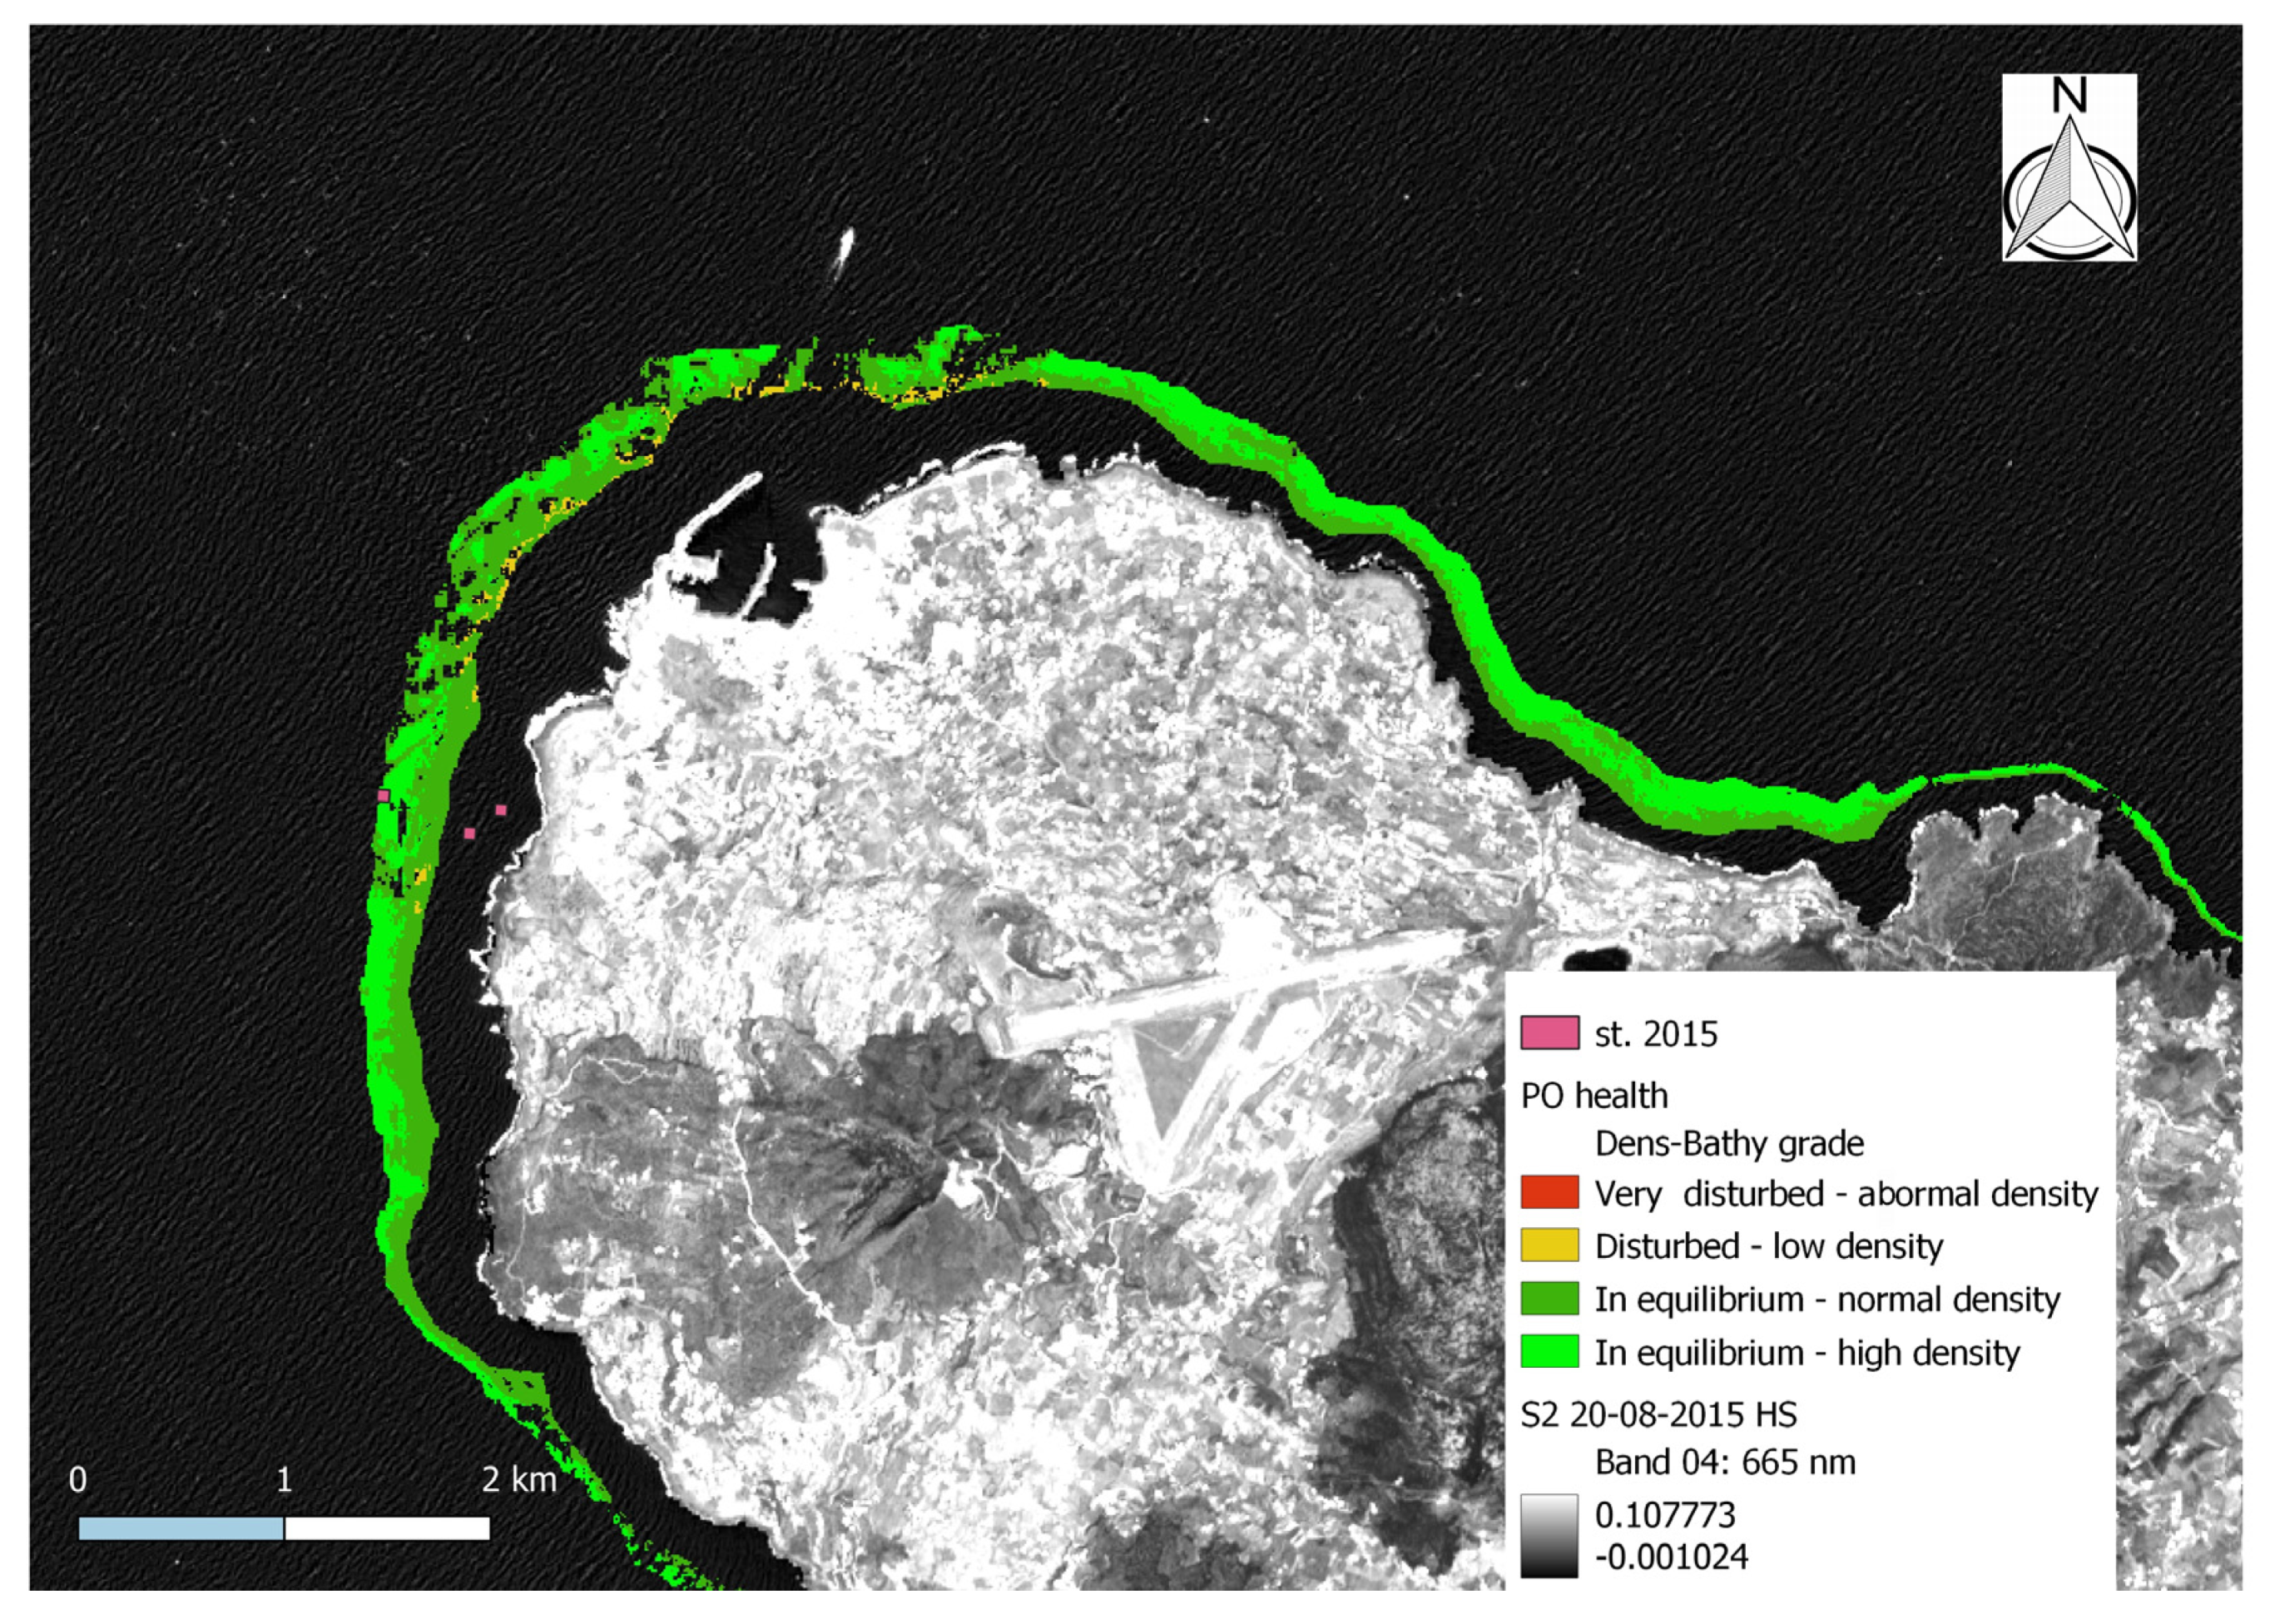
The PO density distribution so obtained, coupled with the related bathymetry, allowed us to assess a four-class map of the health of PO meadows along the entire coast of Pantelleria island on the basis of the model first proposed by Pergent [
39] and here suitably coded in the ERDAS-Imagine spatial modeler software environment. The model was developed several years ago with the support of an ample data set of sea truth observations and on the basis of the standard PO density distributions within a bathymetric range of 20 to 30 m. It includes 4 PO health classes, where the first two are disturbed meadows with a decreasing level of degradation, and the last two are healthy ones.
3. Results
Table 1 includes LAI, shoot density (Den) and related cover (c) data, assessed from laboratory and in situ measurements collected on PO meadows during the 2015 and 2016 campaigns. The calculated uncertainties of each biophysical parameter were indicated in the right columns of the main values with the same label, starting with a capital D. The cover values, produced by the on-purpose developed semiautomatic procedure using the digital underwater imagery of PO plots, were exploited to obtain refined values of the LAI (LAI-c). These refined values are lower compared to uncorrected ones and could be considered as a spatial density of LAI(m
2/m
2)], more oriented to EO data calibration, than usual LAI evaluations at meadow level. In fact, they showed a better correlation with EO spectral reflectance responses of the reference area. The graph in
Figure 7, displays the corrected (using % cover) and uncorrected LAI values, obtained from the data collected during the two sea truth campaigns.
Due to patchy and fragmented distributions, the LAI-c data is all lower than the corresponding uncorrected ones, while the values measured in 2016 are significantly less than those acquired in 2015 at the same station. The sea truth campaigns were carried out respectively in the early/middle of August 2015 and in late October 2016.
At the beginning of autumn, the PO, such as terrestrial photosynthetic plants, loses both the old leaves and the ends of the younger ones often damaged by the first storms, which we find on the beaches as biodegradable waste material. Therefore, the decrease in LAI and biomass observed in the measurements relating to the two campaigns may likely be due to the different seasonal vegetative stage linked to the dates on which they were conducted. According to the light attenuation with bathymetry, the LAI parameters both decrease as depth increases from sampling station 1 to 4 (
Figure 7). The PO density trend instead does not show an inverse dependence on the bathymetry, but it evidences the decreases linked to the different seasonal stage of PO plants in the two campaigns. The measured biomass shows a decrease in the middle stations in 2015, while in 2016 the measurements consistently rise with the bathymetry, but both with the related uncertainties that reduce their reliability (
Table 2).
Referring to EO data, the visual selection of the potentially exploitable imagery was carried out by discharging those affected by clouds over the interest area and water turbidity patterns from sea currents on the water surfaces to be monitored.
The removal of atmospheric noise (mainly from aerosol variable distribution over the water surfaces of interest) from the multispectral frames acquired by the S2 MSI sensor was first accomplished through the abovementioned ACOLITE operational tool. The S2 multispectral images selected for Pantelleria were acquired on 30 August 2015 and 21 November 2016, based on the previously described criteria. Similarly, the frames identified for Lampedusa have been acquired on 21 August 2016 and 01 August 2020 respectively, for S2 and PRISMA sensors.
Figure 8 shows the results of the ACOLITE DSF modelling for the S2 frames acquired on 30 August 2015 (a) and 14 August 2016 (b), while
Figure 9 displays the results of atmospheric correction steps performed using the different tools/options available, including those provided by the ICOR code for adjacency effects removal.
In the previous
Figure 6, a combination of system corrected (BOA) PRISMA VIS channels is displayed as the background of the distribution of seabed training classes derived from the s. s. sonar map. In
Figure 10, a different false color image of atmospherically corrected (BOA) hyper-spectral PRISMA components, in the blue-green range, is reported.
The point-pixel spectral signatures, extracted from the atmospherically preprocessed images of the areas of sampling stations of Pantelleria, were coupled with the related LAI-c values derived from sea truth measurements in order to assess the regression models using the different MLRA algorithms.
Given the high water penetration of the blue-green light made exploitable through the various PRISMA bands, in
Figure 10, many costal seabed features can be better identified as the bluish areas on the left-lower coast of the island, corresponding to thin sand cover.
The graphs in
Figure 11 show the best regression models assessed from the 30 August 2015 and 22 November 2016 S2 WLR distributions provided by the ACOLITE code. These best models were estimated using respectively the KR and LSVR MLRA.
In the graphs, each dot represents a different pixel-point spectral signature extracted from the preprocessed multispectral data of the corresponding sampling station areas. The graphs also shows statistic parameters tables including p-values (Prob < |t|) and p-values (F) of F-statistic (as Prob < F), highlighting the significant confidence levels of the assessed models.
Table 3 includes the list of the best combinations found at the level of S2 frames, pre-processing options, and MLRA, with the related performance parameters for the models of PO LAI-c distribution on the Pantelleria coasts for the 2015 and 2016 years. The ATM column of
Table 3 embraces different radiometric preprocessing options. In particular, ACO + the suffixes HW and HS refer respectively to WLR and BOA (with sun-glint removal and without adjacency correction), while ICOR indicates BOA with adjacency correction and without sun-glint removal.
A subset of values obtained for the most relevant regression performance parameters were also reported with the indication of the exploited MLRA. The best results for the years 2015 and 2016 were obtained using respectively the frames of 30-08 and 22-11, preprocessed with ACOLITE for WLR retrieval. For these frames, the regression models with the highest performance were those provided by KR and LSVR MLRA, with R2 values of 0.81 and 0.84. The inferior results for both years, in terms of error and correlation performance parameters, of the BOA distribution provided by ACOLITE and ICOR, preliminarily suggest that the WLR retrieved by ACOLITE is the most effective atmospheric preprocessing method to allow seagrass mapping. The most effective MLRA with the 2015 frames following the KR were SVR and RF, while for 2016, the best were LSVR and PLS. The differences between the ranges of absolute values of calibration measurements acquired in the two campaigns and the internal variation within each dataset may involve the diverse capacity of a specific MLRA to better model the required trends.
As stressed before, due to different campaign dates, the 2015 LAI calibration values are significantly higher than the related values measured in 2016, with less discriminability of measurement stations and consequently different MLRA effectiveness in distribution modelling. In any case, the regression global performance, in terms of both error and correlation parameters, achieved the best result using the preprocessed frame of 22 November 2016 with the LSVR model, followed by that of 2015 provided by the KR MLRA (
Table 3). The local distributions, assessed using the best 2015 and 2016 models, are reported in
Figure 12. Their PO patch distributions were also in satisfactory accordance with the preexisting information and maps available, even though they were not updated (i.e., M.A.T.T.M.-SiDiMar. GIS-Geodatabase, 2008). Since the latter are mainly based on observations of the summer period, the agreement of the 2016 autumn distribution (more affected by thin cloud presence at the upper corner of the area of interest) is less strong. Furthermore, from a qualitative comparison with this auxiliary GIS information (SidiMar), it happens that the model estimated for PO distribution in 2015 through the KR MLRA is less stable spatially at global level and less effective for the correct mapping of the PO of the entire island than that derived from the RF (
Table 3,
Figure 13), although the latter is less performant with sea truth point data.
Due to different seasonal development periods of PO in the sea truth campaign dates, a direct comparison between the LAI-c distributions is useless for assessing the potential impact of the ISWEC prototype, but in any case, the LAI-c map of 2016 does not show a significant discontinuity and reduction in the proximity of the converter plant. This sug-gests that the installation of the prototype, thanks to its technical solution to minimize the interaction with the seabed beneath (i.e., floating mooring), did not significantly impact the nearby PO meadows.
The PO density (shoots/m
2) distribution was assessed using the WLR derived from the 30 August 2015 S2 frame through SVR, which has been found to be the most performant MLRA, although with poor parameter values (r
2 = 0.401, R
2 = 0.316). The PO health map based on the Pergent model, obtained from these EO derived density and bathymetry distributions, is shown in
Figure 14. In general, from the health map, you can see that most of the PO meadows on the Pantelleria coast are in equilibrium with normal or high density and there are not areas of abnormal density, with highly disturbed meadows. Small areas of stressed PO (disturbed—low dens.) meadows were detected in proximity to the harbor, probably linked to the concentration of anthropogenic activities and ship traffic.
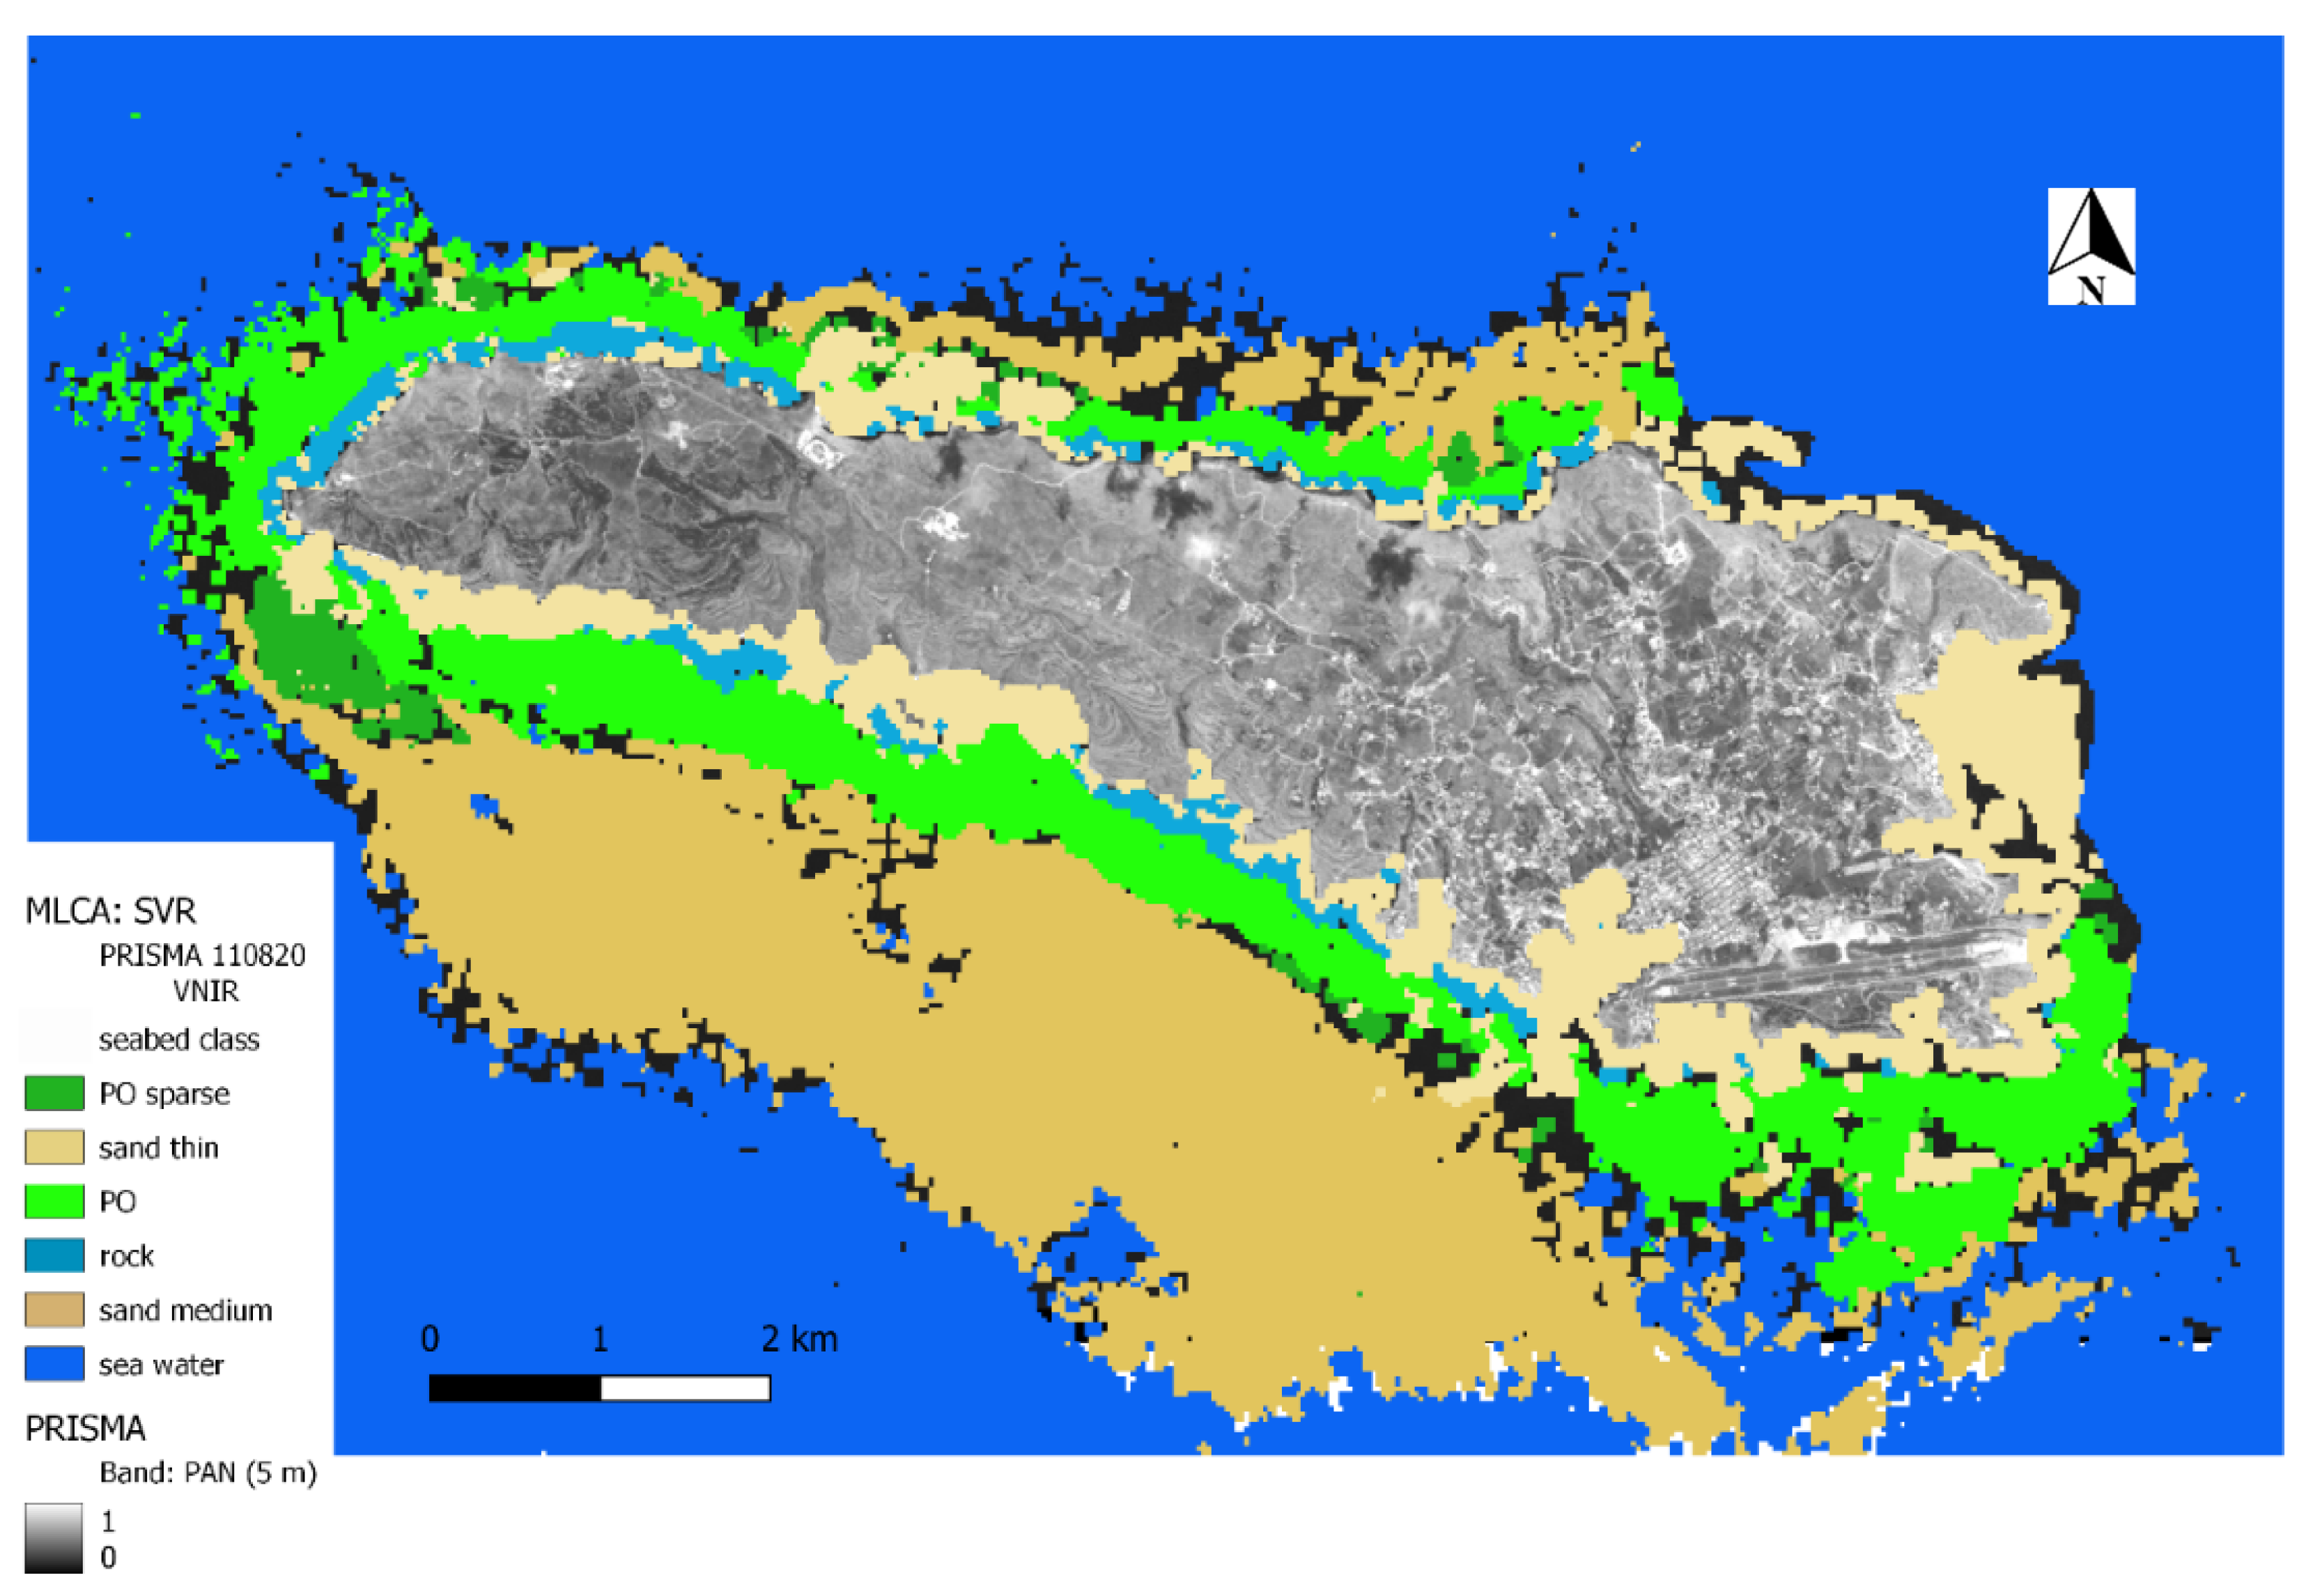
Table 4 includes the performance parameters evaluated for classification maps obtained through different MLCA using the BOA hyperspectral data of Lampedusa, ac-quired by the PRISMA sensor on 11 August 2020. The results obtained through SVC and LSVC were the two best (evaluated O.A. respectively, 82.64 and 78.46) while those related to RF and GP ranked correspondingly at intermediate and worst levels.
Table 5, lists the best of accuracy parameters for classification of PRISMA hyperspectral data coupled with those obtained for S2 MSI multispectral data, preprocessed through the different radiometric preprocessing options (BOA and WLR water-oriented atmospheric with sun-glint and adjacency effects removal) under the ATM column. Here the accuracy metric shows that, in general, the water oriented ACOLITE preprocessing (prefix ACO) of S2 data performs better than that of ICOR (BOA and adjacency effect removal). Moreover, the ACOLITE BOA, including sun-glint (ACO-HS), is less effective than WLR ACOLITE (ACO-HW). The following figures display the thematic maps obtained using the SVC MLCA, with data from PRISMA hyperspectral BOA VIS (
Figure 15) and S2 multispectral WLR (
Figure 16), acquired on the dates indicated (
Table 5).
The retrieved seabed class distribution, in addition to the high accuracy metric referring to sea truth (side-scan sonar map), shows good agreement with each other and with historical data (SiDi MAR). As regards the PO meadows distribution. As regards the distribution of other seabed classes, there is a slight difference in the percentage of rock coastal areas compared to those with fine sand in the two thematic EO derived products.
The PRISMA thematic product shows a better capacity to detect rocks and intermediate-coarse sand areas and a poorer PO patch geometric characterization, probably due to its geometric resolution (30 m), lower than that of S2 (10 m). In both the PRISMA and S2 thematic maps, the PO areas are in agreement with test data (side scan sonar) but tend to be overestimated respect to the older distribution (SidiMar), with a different detection of the coarse sand dunes area in the southern part of the island. Ultimately, although the PRISMA sensor with its multiple narrow bands in the visible with basic atmospheric preprocessing has demonstrated the best thematic accuracy metric (O.A. = 82.64), the results of the S2 sensor, suitably preprocessed using water surface options, are slightly lower (O.A. = 82.22), with a difference of less than 5%.
4. Conclusions
The PO meadows and seabeds of Pantelleria and Lampedusa islands were serviceably monitored and mapped through the developed methodology based on the EO data provided by the last generation of the S2 MSI and PRISMA multi/hyperspectral HR sensors, with their ampler selection of suitable frames and acquisition channels coupled with effective radiometric preprocessing for removing the different atmospheric noises from captured frames. Various approaches for coastal atmospheric preprocessing of EO data were integrated with different machine learning algorithms to properly support the regression/classification advanced modelling, calibrated/validated through sea truth data, collected and processed by means of original methods.
The distribution of density and LAI of PO meadows on the Pantelleria coast were estimated through S2 EO data, focusing on the location of the ISWEC energy converter prototype on the north-east coast, where the sea truth calibration data was collected in 2015 and 2016. The LAI (m2/m2) and density (shoots/m2) distributions of PO meadows were effectively assessed by means of preprocessed EO multispectral data using the most performant MLRAs (R2 = 0.81, R2 = 0.84). In this context, the S2 WLR data, atmospherically corrected using the advanced ACOLITE package, have been found to be the most effective for monitoring and modelling the PO and seagrass biophysical parameter distributions.
The PO health distribution map, derived from estimated density according to the Pergent model, highlighted the satisfactory condition of meadows in the vicinity of the ISWEC and throughout the island, except in small areas near the harbor, which are likely more subjected to anthropogenic impacts.
The preprocessed S2 and PRISMA EO data were successfully exploited for mapping the seabed and PO of Lampedusa’s shallow waters using different MLA classification approaches based on supervised schemes. The accuracy metric of the classification map obtained from the PRISMA hyperspectral data (BOA atmospherically corrected without sun-glint and adjacency effects removal) was the best. The results, in terms of the accuracy metric of the classification based on S2 WLR data and the most performant MLCA, were a bit lower (O.A. = 82.22), while the others, corresponding to different processing options follow.
The results above described may provide a preliminary indication of the suitability of the last generation multispectral S2 MSI and hyperspectral PRISMA sensors for coastal ecosystems and shallow water monitoring, specifically for PO mapping purposes, strongly dependent on the radiometric preprocessing procedure for atmospheric noise removal. The integration of atmospheric preprocessing packages for EO HR multi/hyperspectral data to couple the WLR retrieval with the removal of the sun-glint and adjacency effects is required, also for the ongoing hyperspectral missions (i.e., ENMAP), in the perspective of further improvement of the developed methodology. The results achieved demonstrate that the integrated use of these recent satellite HR remote sensing multi/hyperspectral techniques through advanced MLA, even supported by limited on-site surveys, represents an effective and extensive mapping tool for supporting the sustainable management of island coastal environments and PO habitats in shallow waters. This is also guaranteed in the case of island coasts with high dynamic of sea currents, where it is of interest to assess the impact of the introduction of advanced systems for the exploitation of sea wave renewable energy on marine ecosystems and coastal environments, characterized by high biodiversity but significantly vulnerable to the pressure of anthropic activities and to climate change effects.


 ,
, 


