Article

Performance Optimization and Economic Evaluation of CO2 Heat Pump Heating System Coupled with Thermal Energy Storage

School of Human Settlements and Civil Engineering, Xi’an Jiaotong University, Xi’an 710049, China
*
Authors to whom correspondence should be addressed.
Sustainability 2021, 13(24), 13683; https://doi.org/10.3390/su132413683
Submission received: 5 November 2021 / Revised: 29 November 2021 / Accepted: 4 December 2021 / Published: 10 December 2021
(This article belongs to the Special Issue Advanced Heat System for Sustainable Energy Usage in Winter Condition)

Abstract

:
CO2 air source heat pump (ASHP), as a kind of clean and efficient heating equipment, is a promising solution for domestic hot water and clean heating. However, the promotion of CO2 ASHP encounters a great resistance when it is used for space heating; namely, the return water temperature is too high that cased higher throttle loss, which decreases the COP of the CO2 ASHP unit. To solve this problem, a heating system of CO2 ASHP coupled with thermal energy storage (TES) is developed in this work. The simulation model of the studied system is established using TRNSYS software, and the model is verified by experimental data. Additionally, the performance of the studied system is optimized, and its economy is analyzed by life cycle cost (LCC). The results showed that, compared with the system before optimization, the cost of the optimized system increased, the annual operating cost of the system was reduced, and the COP of the system (COPsys) increased by 7.4%. This research is helpful in improving the application of the CO2 ASHP unit in cold server and cold areas.

1. Introduction

With the development of human living standards, the energy demand is also increasing. The huge energy consumption and unreasonable energy utilization not only cause energy shortage but also cause environmental problems, including haze, global warming, droughts, and flooding [1,2,3]. During the past decade, building energy consumption has become one of the most energy demands [4,5], with water heating, space heating, and cooling accounting for 32% of global energy consumption. [6]. In order to reduce energy consumption and environmental pollution caused by space heating, clean heating technology has received more and more attention. The “coal-to-electricity” policy, applied in rural areas in northern China [7], aims to adopt heating devices driven by electrical energy instead of conventional heat source like coal-fired boiler, which produces many harmful gases.
Air source heat pump (ASHP), clean and efficient, is promising heating equipment for domestic hot water and clean heating [8,9,10,11]. However, ASHP with synthetic refrigerants, including chlorofluorocarbons (CFCs) and hydrofluorocarbons (HFCs), has the problems of excessive global warming potential (GWP) and high ozone depletion potential (ODP) [12], which is harmful to the environment. In addition, the conventional ASHP has insufficient heating capacity when the ambient temperature is low, which cannot meet the heating demand. Therefore, it is urgent to find alternative refrigerants, and natural refrigerants have attracted wide attention. Among various natural refrigerants like air, water, hydrocarbons, ammonia, and CO2, CO2 (ASHRAE safety class A1 [13]) is the only one with all the properties of non-toxic, non-flammable, zero ODP, low GWP of 1, low cost [14], high latent heat and low dynamic viscosity [15] and contributes to high efficiency at low temperature [16].
Due to its special physical characteristics of low critical temperature at 31.1 °C and high critical pressure at 7.38 MPa, a high exothermal temperature glide occurs during the transcritical cycle, first proposed by Lorentzen in 1990 [17], which is well-suited for heating water [14] and contributes to higher energy efficiency. In addition, owing to its high density and operation pressure, CO2 is helpful to promote the compact ASHP system fabrication with a given pumping power, although high operation pressure brings greater challenges to the manufacture of ASHP components [18].
CO2 has the potential to be the final solution in refrigeration systems, but the promotion of CO2 ASHP encounters great resistance, causing that it has not been used widely. One of the most significant reasons is that throttling losses and superheated vapor horns result in high irreversibility, which decreases the COP of CO2 ASHP [19,20]. In order to overcome the above problems, more research has been devoted to improving the thermal performance of CO2 ASHP, and various solutions of the components or the system have been proposed, including internal heat exchange (IHX) [21,22], subcooling [23,24], thermal energy storage (TES) [6], two or multi-stage compression [25], and cascade system, etc. [26].
Jiang et al. [21] took experiments of the transcritical CO2 water-water heat pump system with a double-tube copper IHX. The results illustrated that the COP of the system with IHX was 3.5–8% higher than that without IHX, with the temperature of hot water varying from 45 °C to 70 °C and the temperature of inlet water in gas cooler being 15 °C, 20 °C, and 25 °C, respectively. Qin [22] investigated the effect of IHX on the CO2 ASHP system with a novel evaluation method. Salajeghe and Ameri [23] investigated the subcooling through the absorption device. They drew a conclusion that, compared with a traditional steam compression system, this system was conducive to reducing the optimum operating pressure, improving energy efficiency, and reducing power consumption. Binbin et al. [24] theoretically investigated the thermal behavior of automobile CO2 air conditioning systems with propane mechanical subcooling cycle. They found that the COP and cooling capacity increased by up to 12.97% and 17.89%, respectively, when the subcooling degree was fixed at 5 °C. Boccardi et al. [25] carried out experiments to study the advantages of the transcritical CO2 cycle integrated with a multi-ejector for heating applications. It was conducted that the throttling loss decreased by 46% with the multi-ejector at optimal condition, thereby improving the performance of the transcritical CO2 cycle by 30%. Furthermore, Bai et al. [26] investigated the benefits of the dual temperature transcritical CO2 system with two cascaded ejectors, which showed better performance than the basic system. Moreover, compared to the system with one ejector, the exergy efficiency and COP of the system with cascaded ejectors increased by 25% and 28%, respectively, as a result of its high pressure-boost and improved pre-compression. Li et al. [27] put forward a transcritical CO2 refrigeration system with a vortex tube, in which superheated vapor stream and saturated fluid stream were left from the hot and cold side of the vortex tube, respectively. Then, the superheated vapor was cooled by flowing through the internal heat exchanger and mixed with the saturated fluid. Compared to the traditional system, the efficiency of this system increased by 37% when the gas-liquid separation efficiency was assumed to be 100% and increased by 20% with the separation efficiency of 50%. Pérez-Garcia et al. [28] investigated the effect of the expander on the CO2 system in theory. The results indicated that the COP of the CO2 system using an expander was 27.2% higher than the system without any expander when the evaporating temperature was −10 °C, and the outlet water temperature was 35 °C. Wang et al. [29,30] put forward a CO2 ASHP heating system combined with TES and then conducted experiments to investigate its performance in cold areas. They concluded that the COP decreased by 18.8%; the throttle loss increased by 47.5%, with the inlet water temperature of the gas cooler increasing from 35 to 45 °C. In addition, the COP of the studied system increased by 17% than the system without adopting thermal storage methods.
Due to the thermodynamics analysis, the two-stage compression had the ability to greatly improve the performance of transcritical CO2 ASHP because of the high operating pressure. It was concluded by Cecchinato et al. [31] that the energy efficiency of a two-stage double-throttling system could increase by 70% compared to the traditional single-stage single-throttling system with the severe evaporating temperature of −30 °C. In addition, the COP and heating capacity of the injection throttling two-stage system were higher than the system with an IHX. Pitarch et al. [32] obtained similar results that the COP of the two-stage transcritical CO2 cycle system was 11% higher than the single-stage system adopted for water heating. According to the numerical study by Sarkar and Agrawal [33], carried out with the evaporation temperature ranging from −45 °C to 5 °C and the outlet temperature of gas cooler ranging from 30 °C to 60 °C, it was concluded that parallel compression had a great influence on the CO2 cycle, especially when the evaporation temperature was low. The COP increased by up to 47% of the system involving parallel compression. They also established the equation for the optimum discharge pressure of the parallel compression system, taking the evaporation temperature and the outlet water temperature as parameters. Dai et al. [34] put forward a mechanical subcooling transcritical CO2 ASHP, with zeotropic-mixture as the working fluid. The conclusion was drawn that the temperature glide of the zeotropic mixture had a great influence. Based on the improvement of COP and the reduction of discharge pressure, theoretical studies of more than ten kinds of systems with pure fluids or mixtures were carried out, and the R32/R1234ze (Z) (55/45) was considered as the best choice for the combined system. Nebot-Andres et al. [35] took theoretical and experimental studies to compare the performance of two kinds of two-stage CO2 refrigeration cycles, the mechanical subcooling CO2 refrigeration system, and the cascade refrigeration system. The results indicated that the mechanical subcooling CO2 refrigeration system showed the best performance under the analyzed operating conditions, and its cost was lower than the cascade system. However, when the temperature rise between the cold and heat source was higher than 28.5 K, the cascade refrigeration system performed better and occupied the subsystem with high temperature as the main heat provider.
According to the above presentation, when CO2 ASHP is adopted for space heating, the return water temperature is too high that cased the throttle loss too large and the energy efficiency of the system is reduced. To solve this problem, a heating system of transcritical CO2 ASHP coupled with TES is proposed in this work. Firstly, the work principle of the coupled heating system is presented. Secondly, the model of the studied system is constructed by TRNSYS and verified by experimental data. Thirdly, the dynamic characteristics of the coupled heating system are investigated under the typical day. Finally, some main conclusions are given. This research is helpful in improving the application of CO2 ASHP units in cold areas.

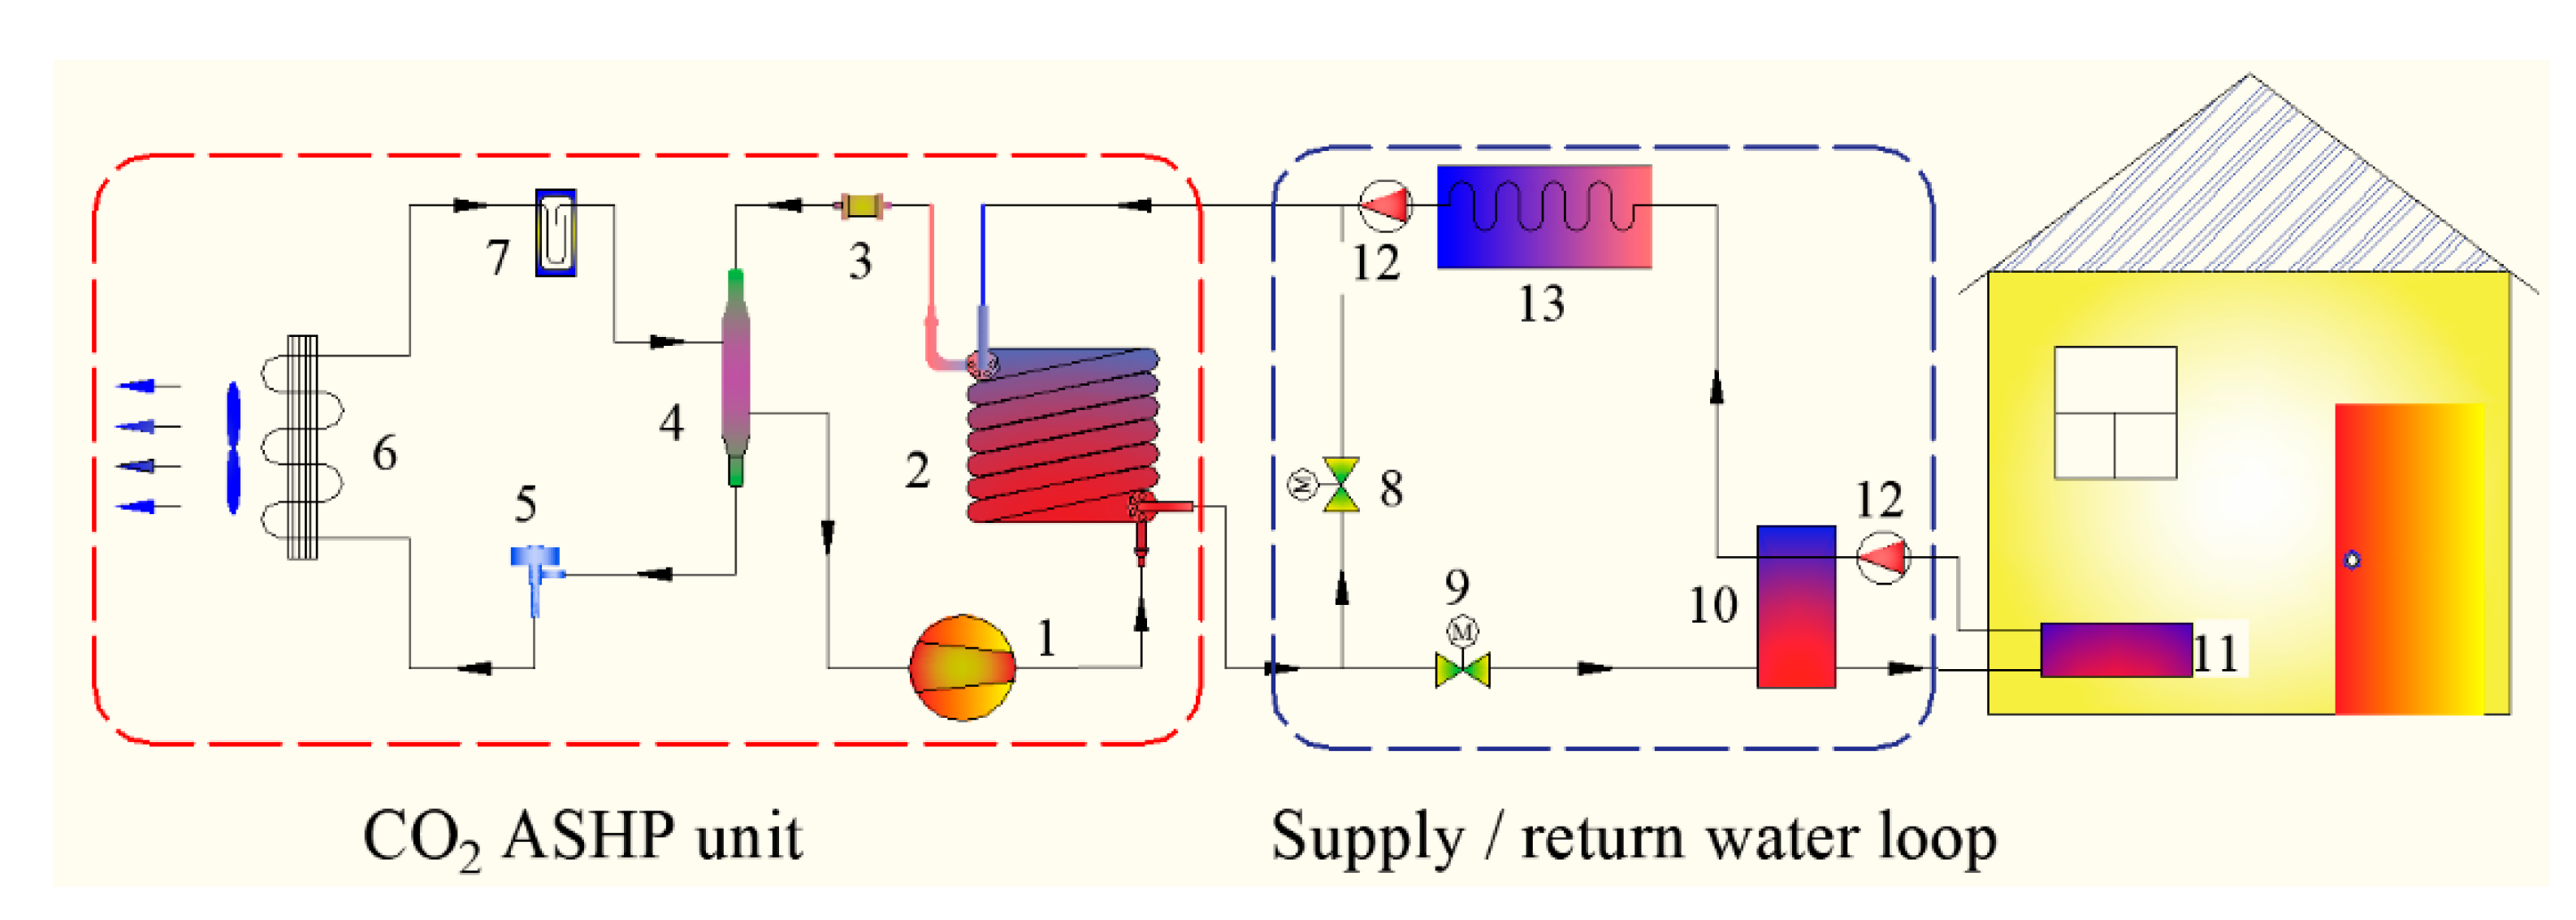
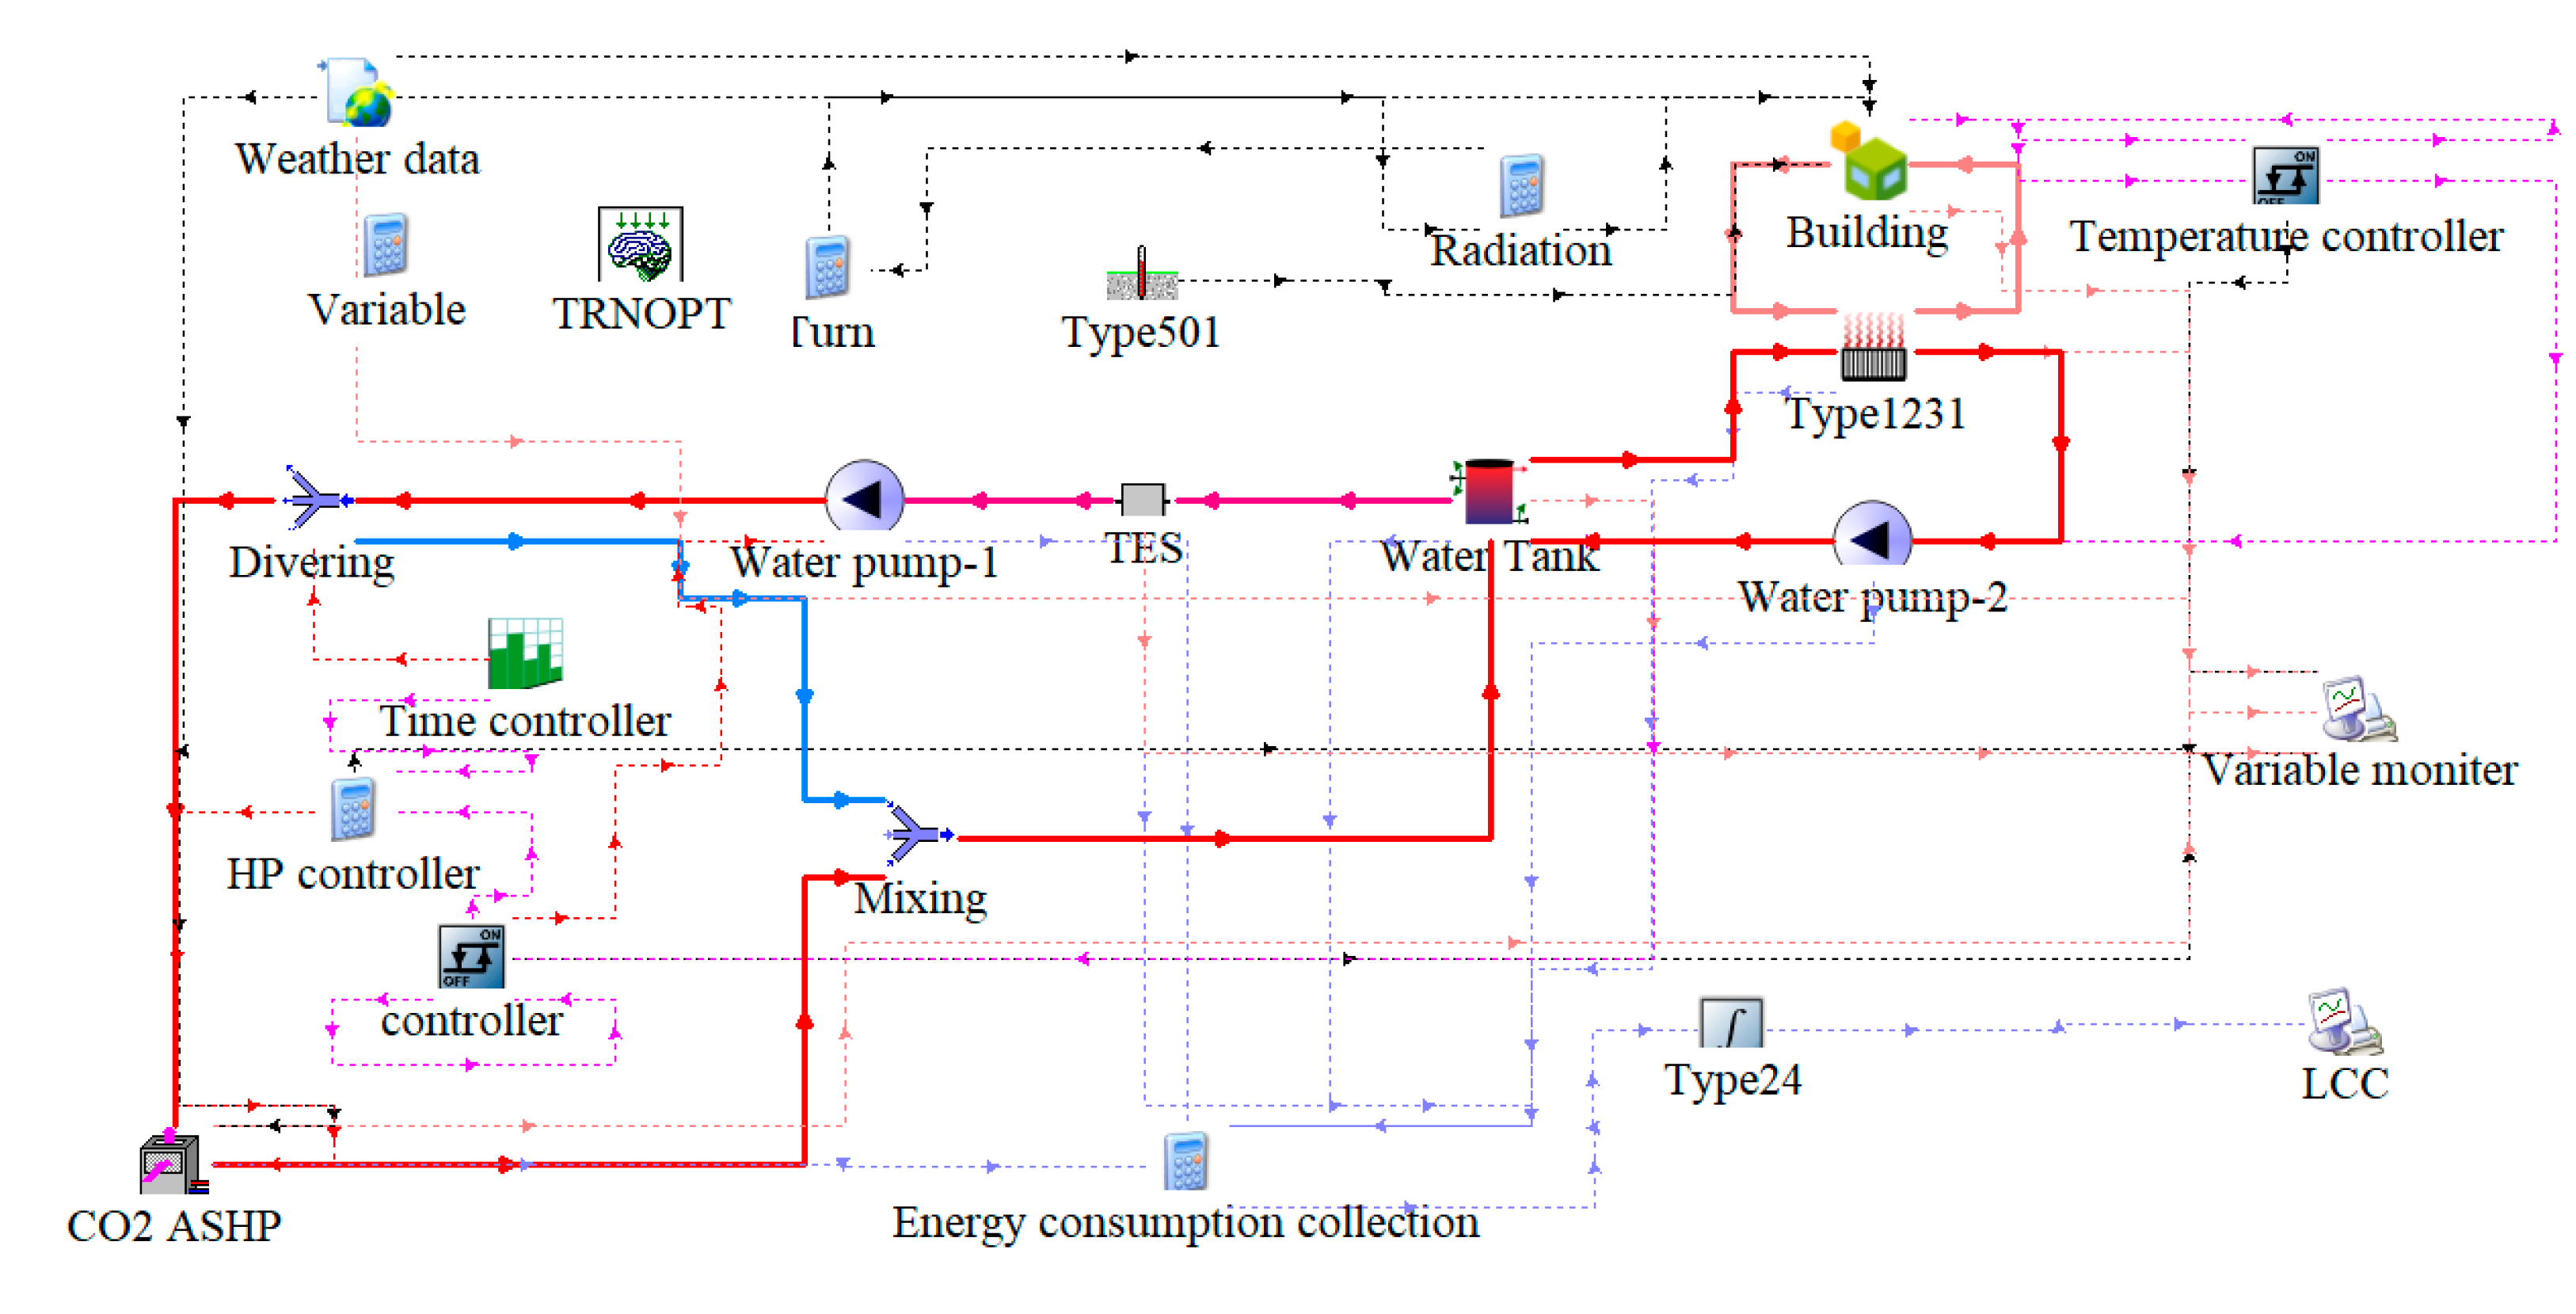
2. System Description

The studied heating system consists of two parts: a CO2 heat pump unit and a supply/return water loop, with two heating modes: heat storage mode (HSM) and heat release mode (HRM). Figure 1 is the schematic diagram of the CO2 ASHP with TES.
During the heat storage mode, the CO2 heat pump unit provides heat, and TES stores heat, with the solenoid valve (8) closed and the solenoid valve (9) opened.
CO2 heat pump unit side: CO2 vapor with low temperature and low pressure is isentropically compressed by the compressor (1) to high temperature and high pressure state. After releasing heat from gas cooler (2), it is subcooled by intermediate heat exchanger (4) and enters EEV (5) to become low temperature liquid, which absorbs air energy and becomes gas through the evaporator (6) and then enters reservoir (7). Then, the saturated steam is overheated by IHX (4) and returns to compressor (1), completing the cycle.
Supply/return water loop side: the high temperature hot water produced by the CO2 heat pump is sent to the radiator through the solenoid valve (9) for heating. The heating return water enters the TES (13), and the surplus heat is stored in the TES (13). After its temperature decreases, the return water returns to the CO2 heat pump to complete the cycle.
During the heat release mode, the TES (13) releases heat for spacing heating. The CO2 heat pump is shut down, only the solenoid valves (8) and (9) are opened. The return water from the heating terminal enters the TES (13), which releases heat for heating water; it finally returns to the user end for heating.

3. Model and Boundary Conditions
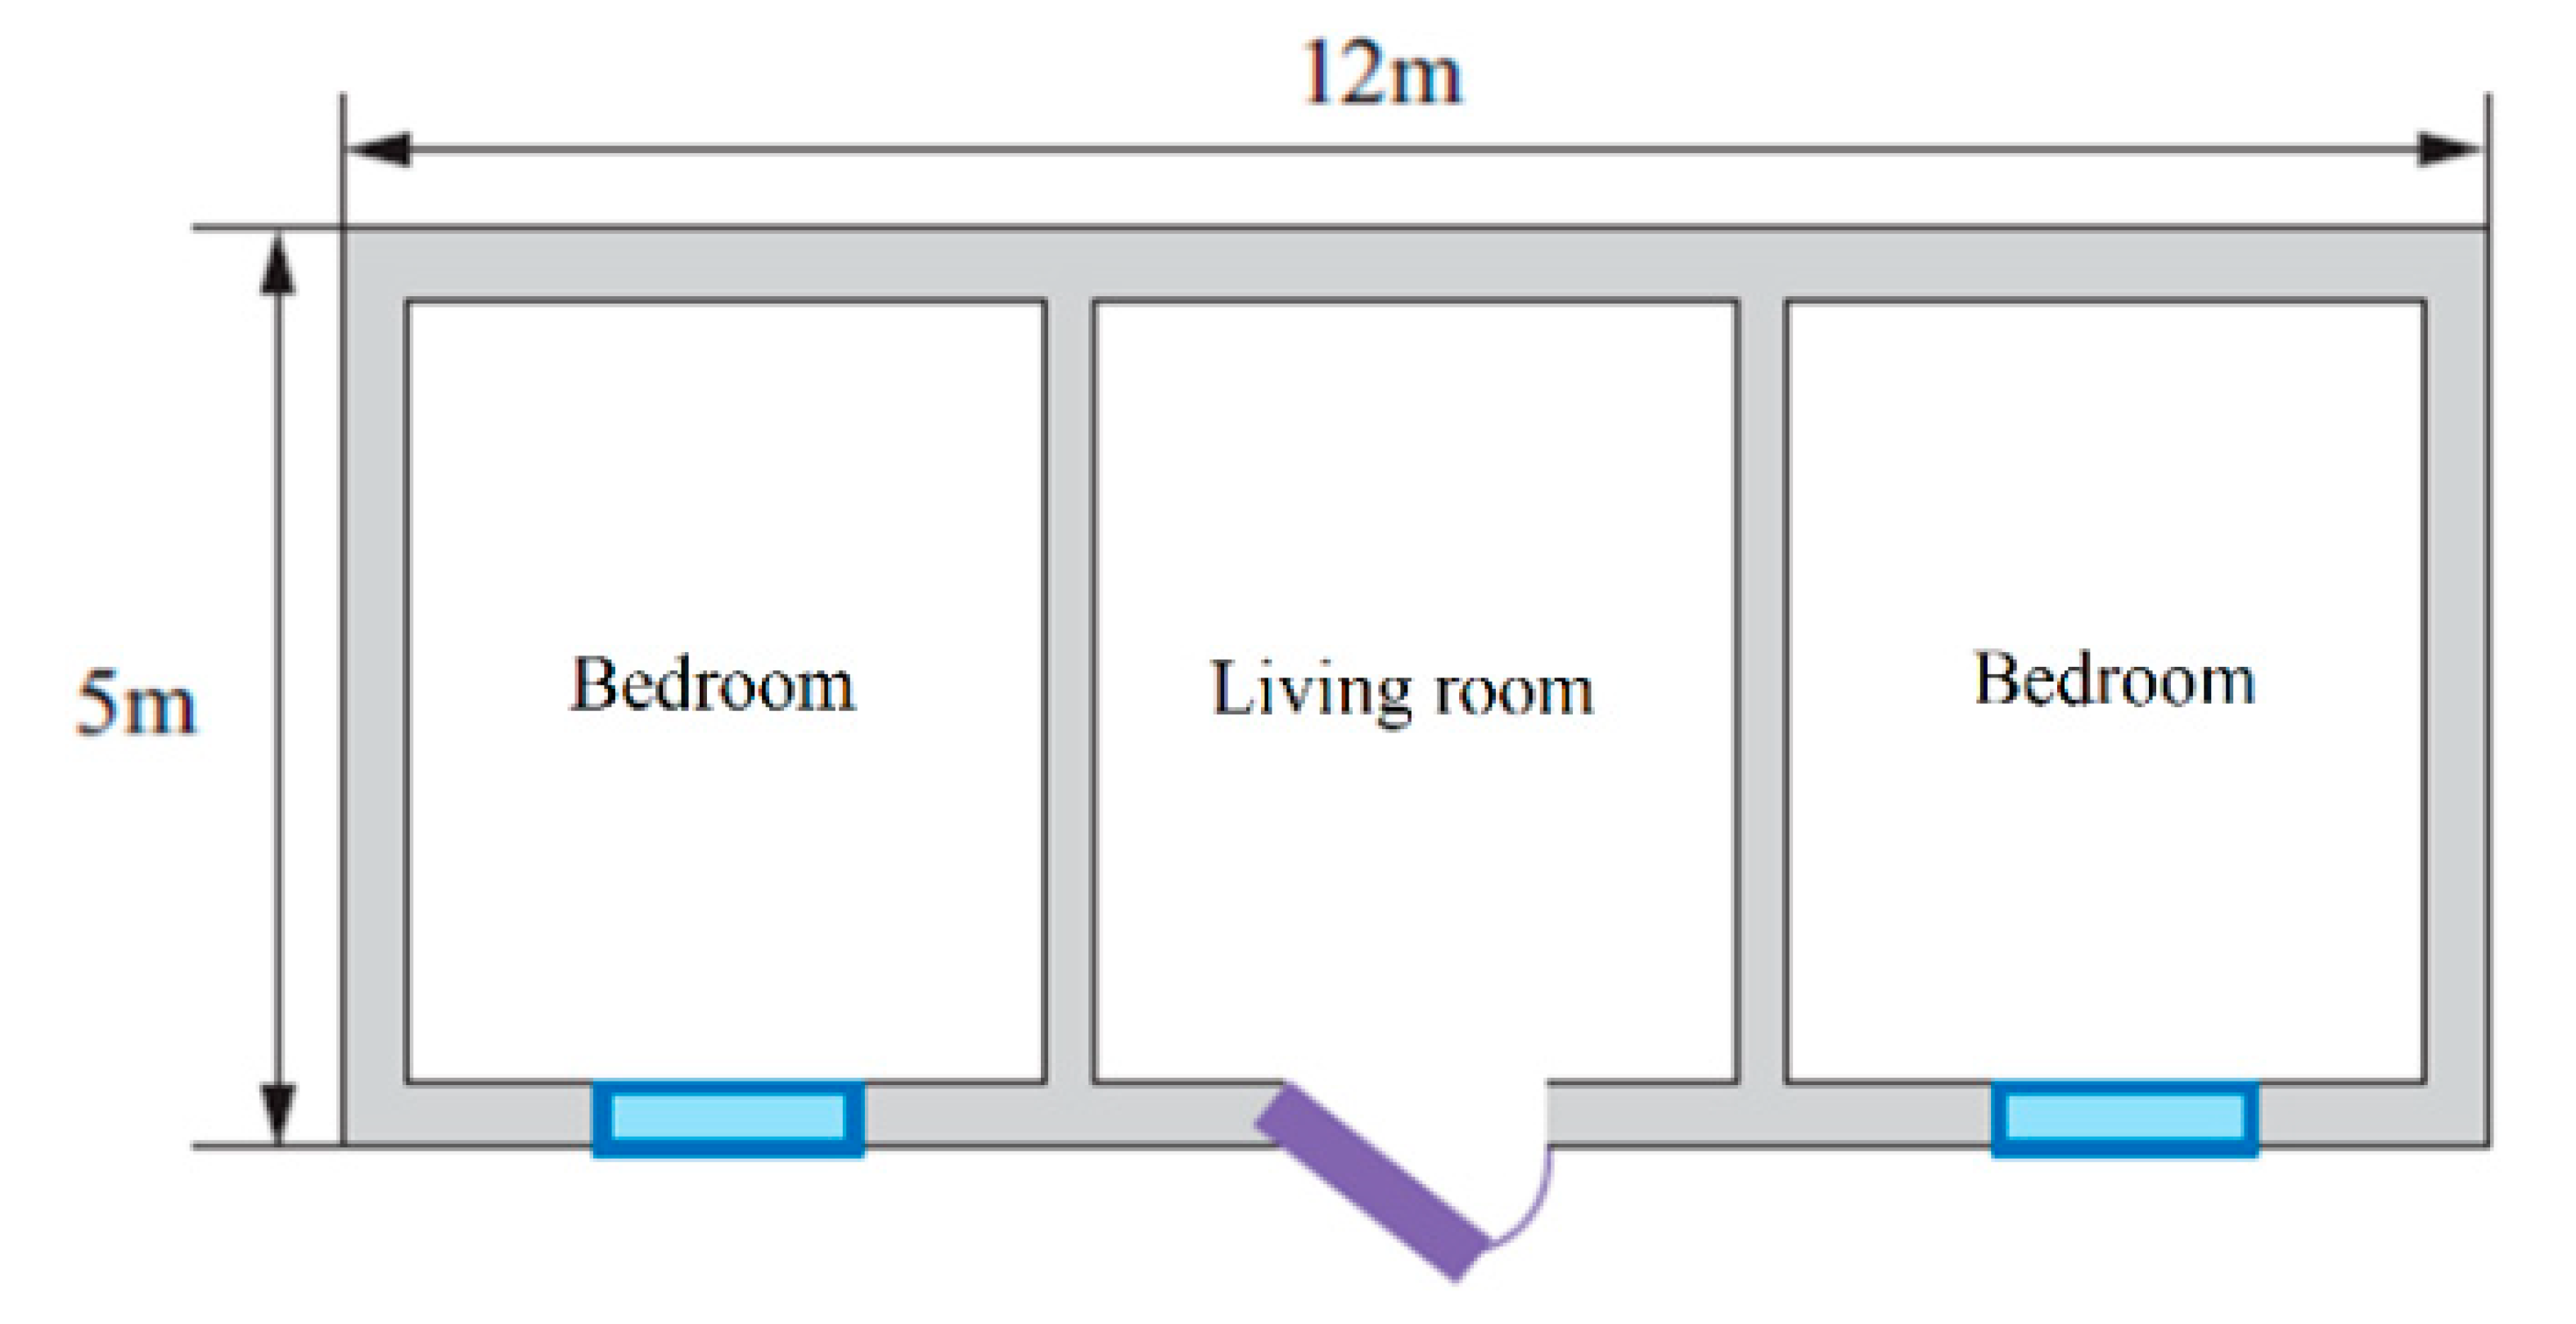
3.1. Building Model

Figure 2 shows the plan of a typical building in Xi’an. The heating time is from 15 November of the current year to 15 March of the following year. The house is north–south oriented with three rooms. The bedrooms are located on the east and west sides, and the living room is in the middle. The height, length, and width of this building are 3 m, 12 m, and 5 m, respectively. The total heating area is 60 m2. Table 1 shows detailed parameters of the building envelope.

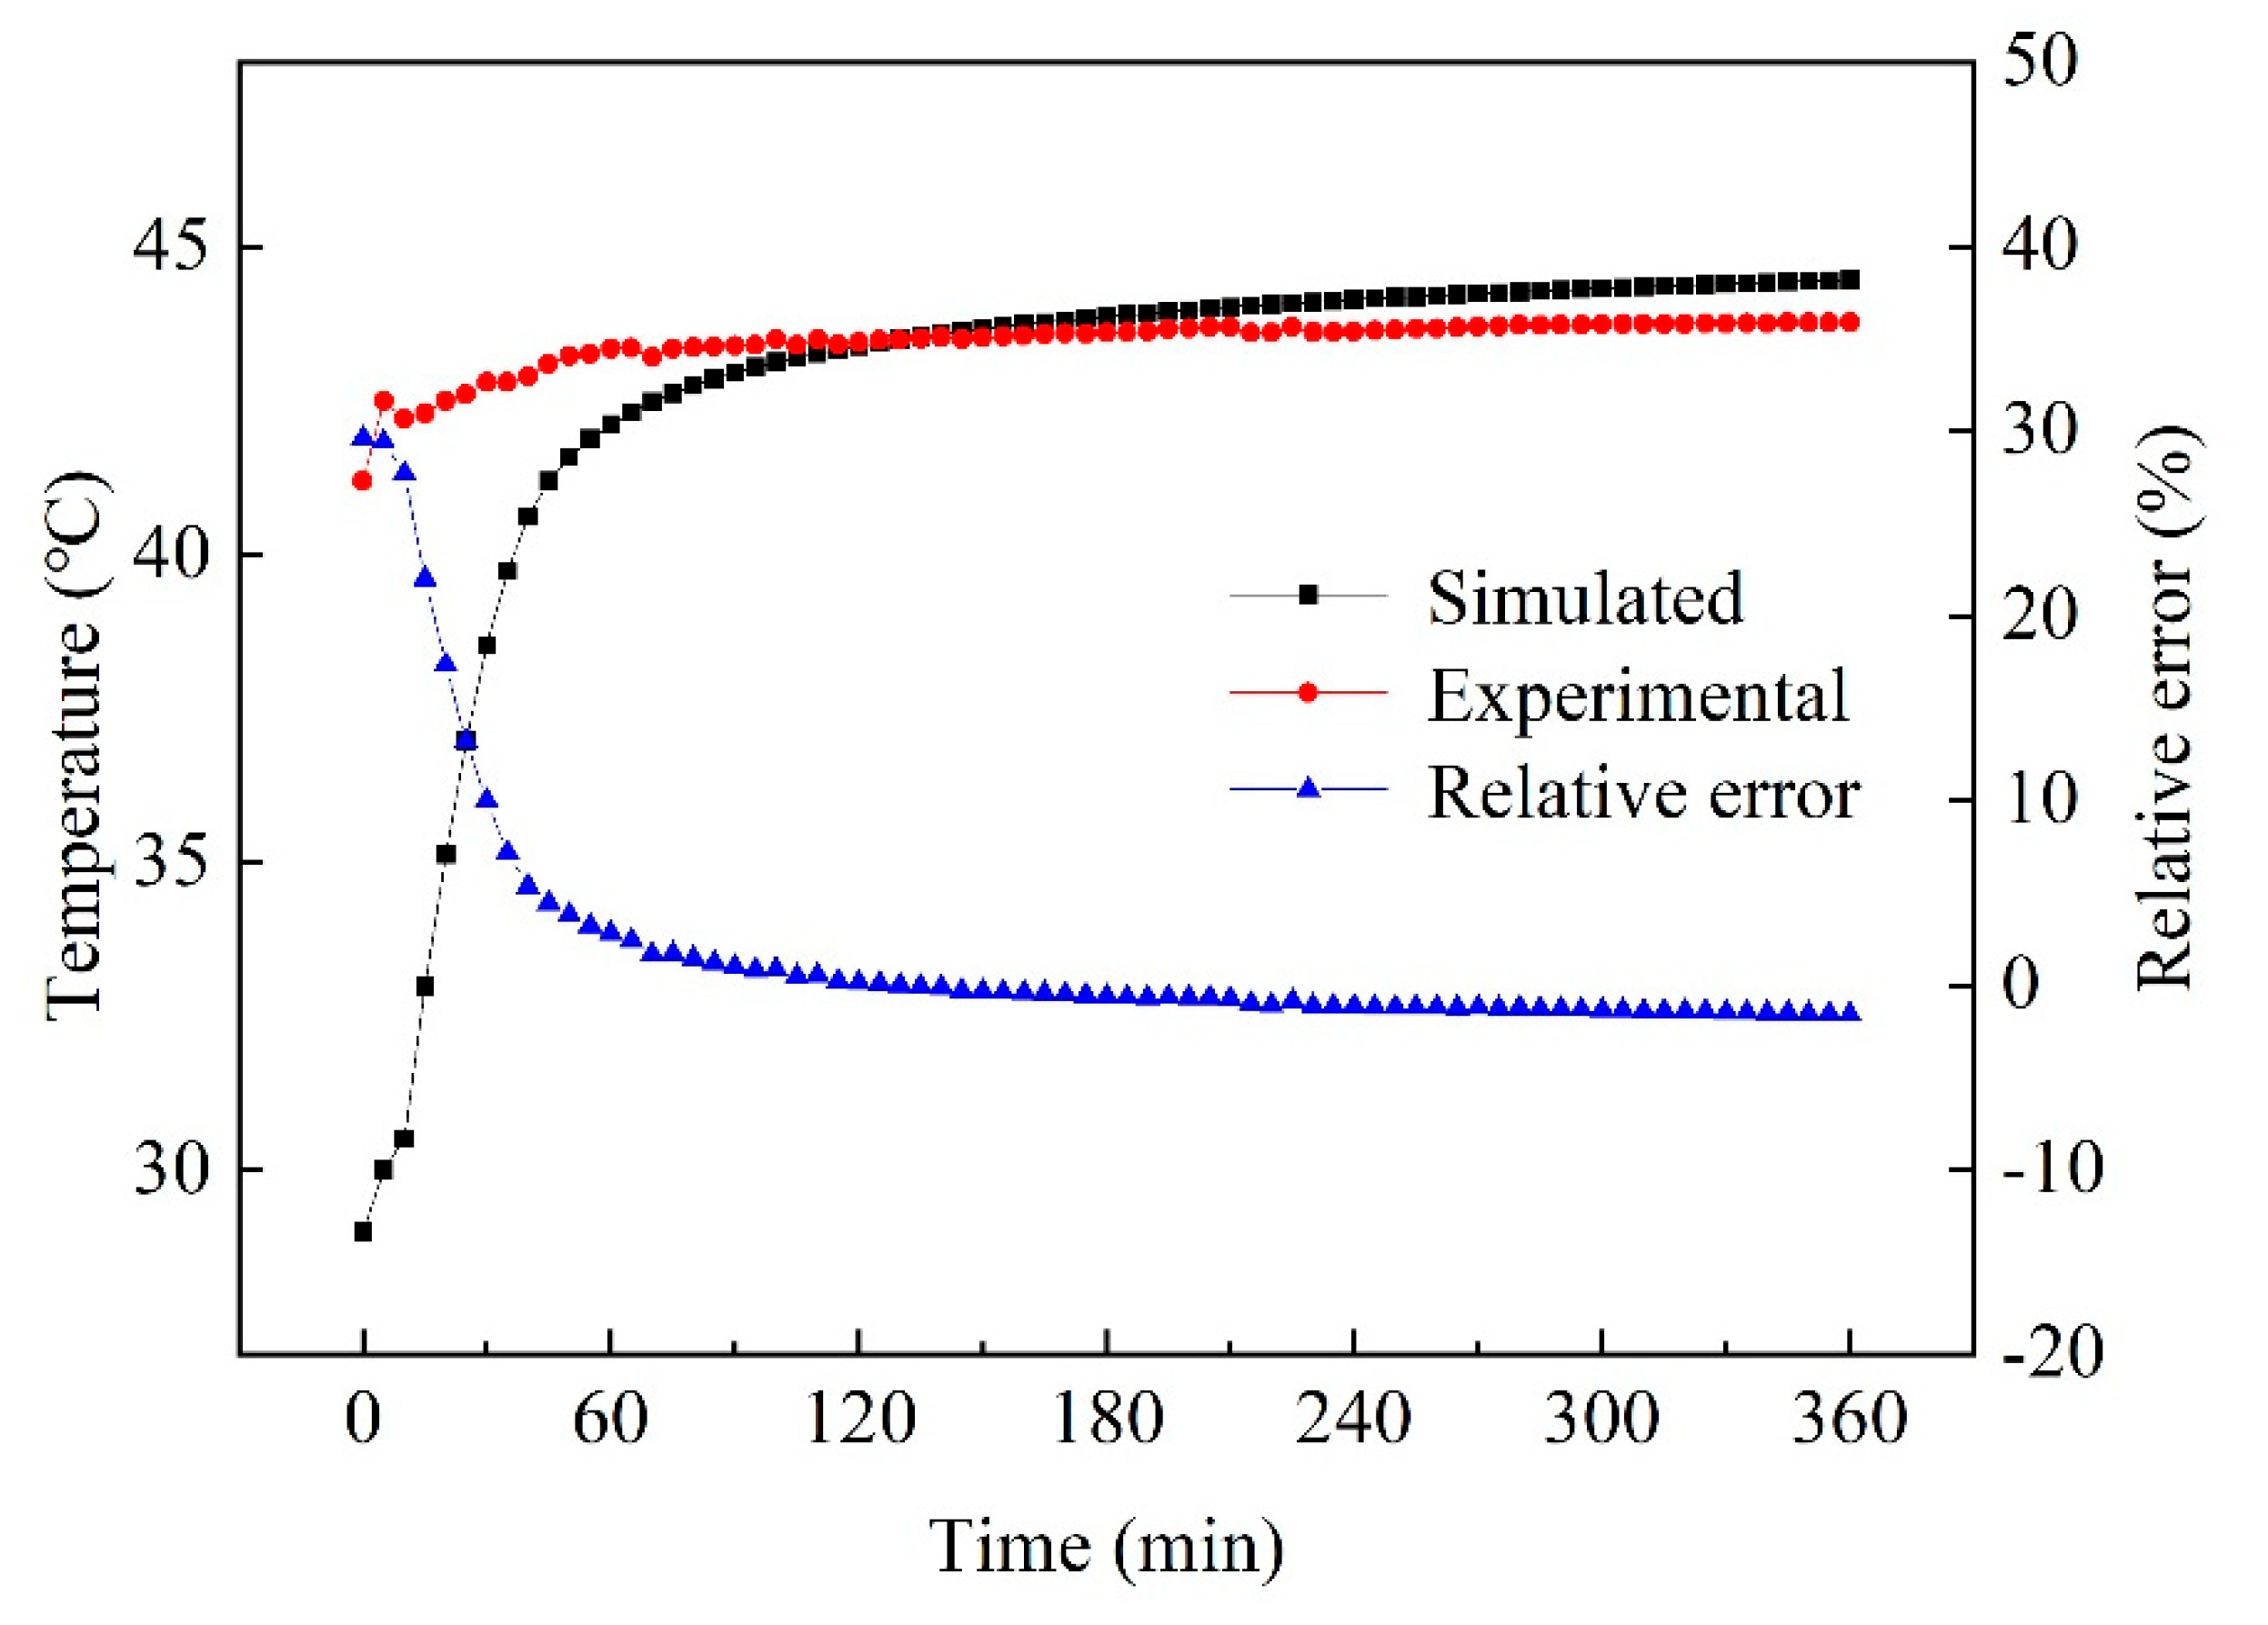
3.2. Mathematical Model of CO2 ASHP

In the TRNSYS software, the ASHP model primarily uses the interpolation calculation of external files to realize the component functions. The data files of heat pump performance offered by users include the heat capacity variation of the heat pump unit, the energy consumption of the heat pump unit under different outdoor temperatures, and the inlet water temperature of the gas cooler in heating mode.
According to the experimental results of the performance of the CO2 ASHP manufacturer, the correction COP and corrected heating capacity of the unit can be calculated as follows,
C O P * = C O P A H P C O P r a t e d
C O P * = 0.037 t d b 0.032 t w + 2.728
Q * = Q A H P Q r a t e d
Q * = 0.037 t d b 0.032 t w + 2.728

3.3. TES Model

Since there is no TES module in the TRNSYS component library, a new module based on the heat transfer mechanism is written in this paper. In this component, the tubular heat exchanger is used as the TES. The phase change material (PCM) is filled outside the pipe, and the heat exchange fluid flows through the pipe. In this paper, the ε-NTU method is used to establish the mathematical model of TES. The assumptions of the component model are as follows.
The solid and liquid states of PCM are regarded as constant physical properties.
In the melting process of PCM, the natural convection is ignored.
The inlet section effect of working fluid flow and heat transfer in the tube is ignored.
During the melting process of the PCM, the instantaneous efficiency of the heat exchanger can be expressed as:
ε = T in T out T in T pcm
The overall average efficiency of heat exchanger in 0~t time can be expressed as follows:
ε ¯ = 0 t ε d t
The ε -NTU empirical equation established by Tay et al. [36] is as follows. It is found that the type of PCM has little effect on the heat transfer equation. This formula is used in this paper:
ε = 1 exp ( N T U )
where NTU expression is:
N T U = k A m · C P = 1 R T m · C P
It can get the following results:
ε = 1 exp ( 1 R T m · C P )
The total heat transfer resistance is composed of heat transfer resistance between thermal fluid and wall (RHTF), heat conduction resistance of tube wall (RWALL), and PCM heat conduction and convection heat transfer (RPCM):
R T = R HTF + R WALL + R PCM
According to the theory of heat transfer, the equivalent thermal resistance is as follows:
R T = 1 2 π R i L h f + ln R o R i 2 π λ w + 1 S λ PCM
The definition of the shape coefficient is shown in the following formula. It is worth noting that the shape coefficient changes with time in the process of phase change. This is because the change of phase-change degree of PCM leads to the change of solid–liquid state in PCM, which affects the shape coefficient.
S = 2 π L ln R R o
Therefore, the calculation formula of total thermal resistance can be simplified as follows:
R T = 1 2 π R i L h f + ln R o R i 2 π λ w L + ln R R o 2 π λ PCM L
The liquid fraction of phase change materials is defined as:
x = A r A o A max A o = R 2 R o 2 R max 2 R o 2
By combining the above two formulas, the final expression of the total thermal resistance is obtained as follows:
R T = 1 2 π R i L h f + ln R o R i 2 π λ w L + ln x R max 2 R o 2 + R o 2 R o 2 π λ PCM L
The convective heat transfer coefficient of fluid is calculated as follows.
Firstly, the Reynolds number is calculated to judge the flow pattern
R e = m d i A c μ f
Secondly, the Prandtl number is calculated:
P r = μ f c p λ f
The convective heat transfer coefficient in the tube is as follows:
h f = N u λ f d i
For the flow in pipe, the calculation formula of the Nusselt number is different under different flow conditions.
Laminar flow:
N u = 3.66 + 0.0668 R e P r d i L 1 + 0.04 ( R e P r d i L ) 2 3
Turbulence:
N u = 0.023 R e 0.8 P r n
With the development of the heat transfer process, the phase transition rate and efficiency are constantly changing. We need to calculate the average efficiency:
ε ¯ = x = 0 x = 1 ε d x
ε ¯ = x = 0 x = 1 1 exp ( 1 R T m C P ) d x
In the actual calculation process, the accumulation is used to replace the integral, and the final average efficiency calculation formula is as follows:
ε ¯ = x = 0.005 0.995 x ( 0.01 )
To investigate the correctness of the model, the simulated results are compared with the experimental values. The supply temperature of water in the constant temperature water tank (equivalent to the return water temperature of load side) is set at 47 °C, the water supply flow is 0.17 m3/h, and the mass of PCM is 200 kg. The results showed that the trend of the simulation results is consistent with the measured results (Figure 3), with the relative error controlled within 10%, proving that the mathematical model is in good agreement. It is also found that the simulated results are relatively different from the measured value at the beginning of the time, which is about 30%. The possible reason for the difference is that the assumption adopted by the mathematical model for the convenience of calculation has a certain influence on the heat transfer of PCM at the beginning of time. In addition, the water supply temperature has a small range of changes in the experimental process, and there are also some errors.
x = T e T c T e

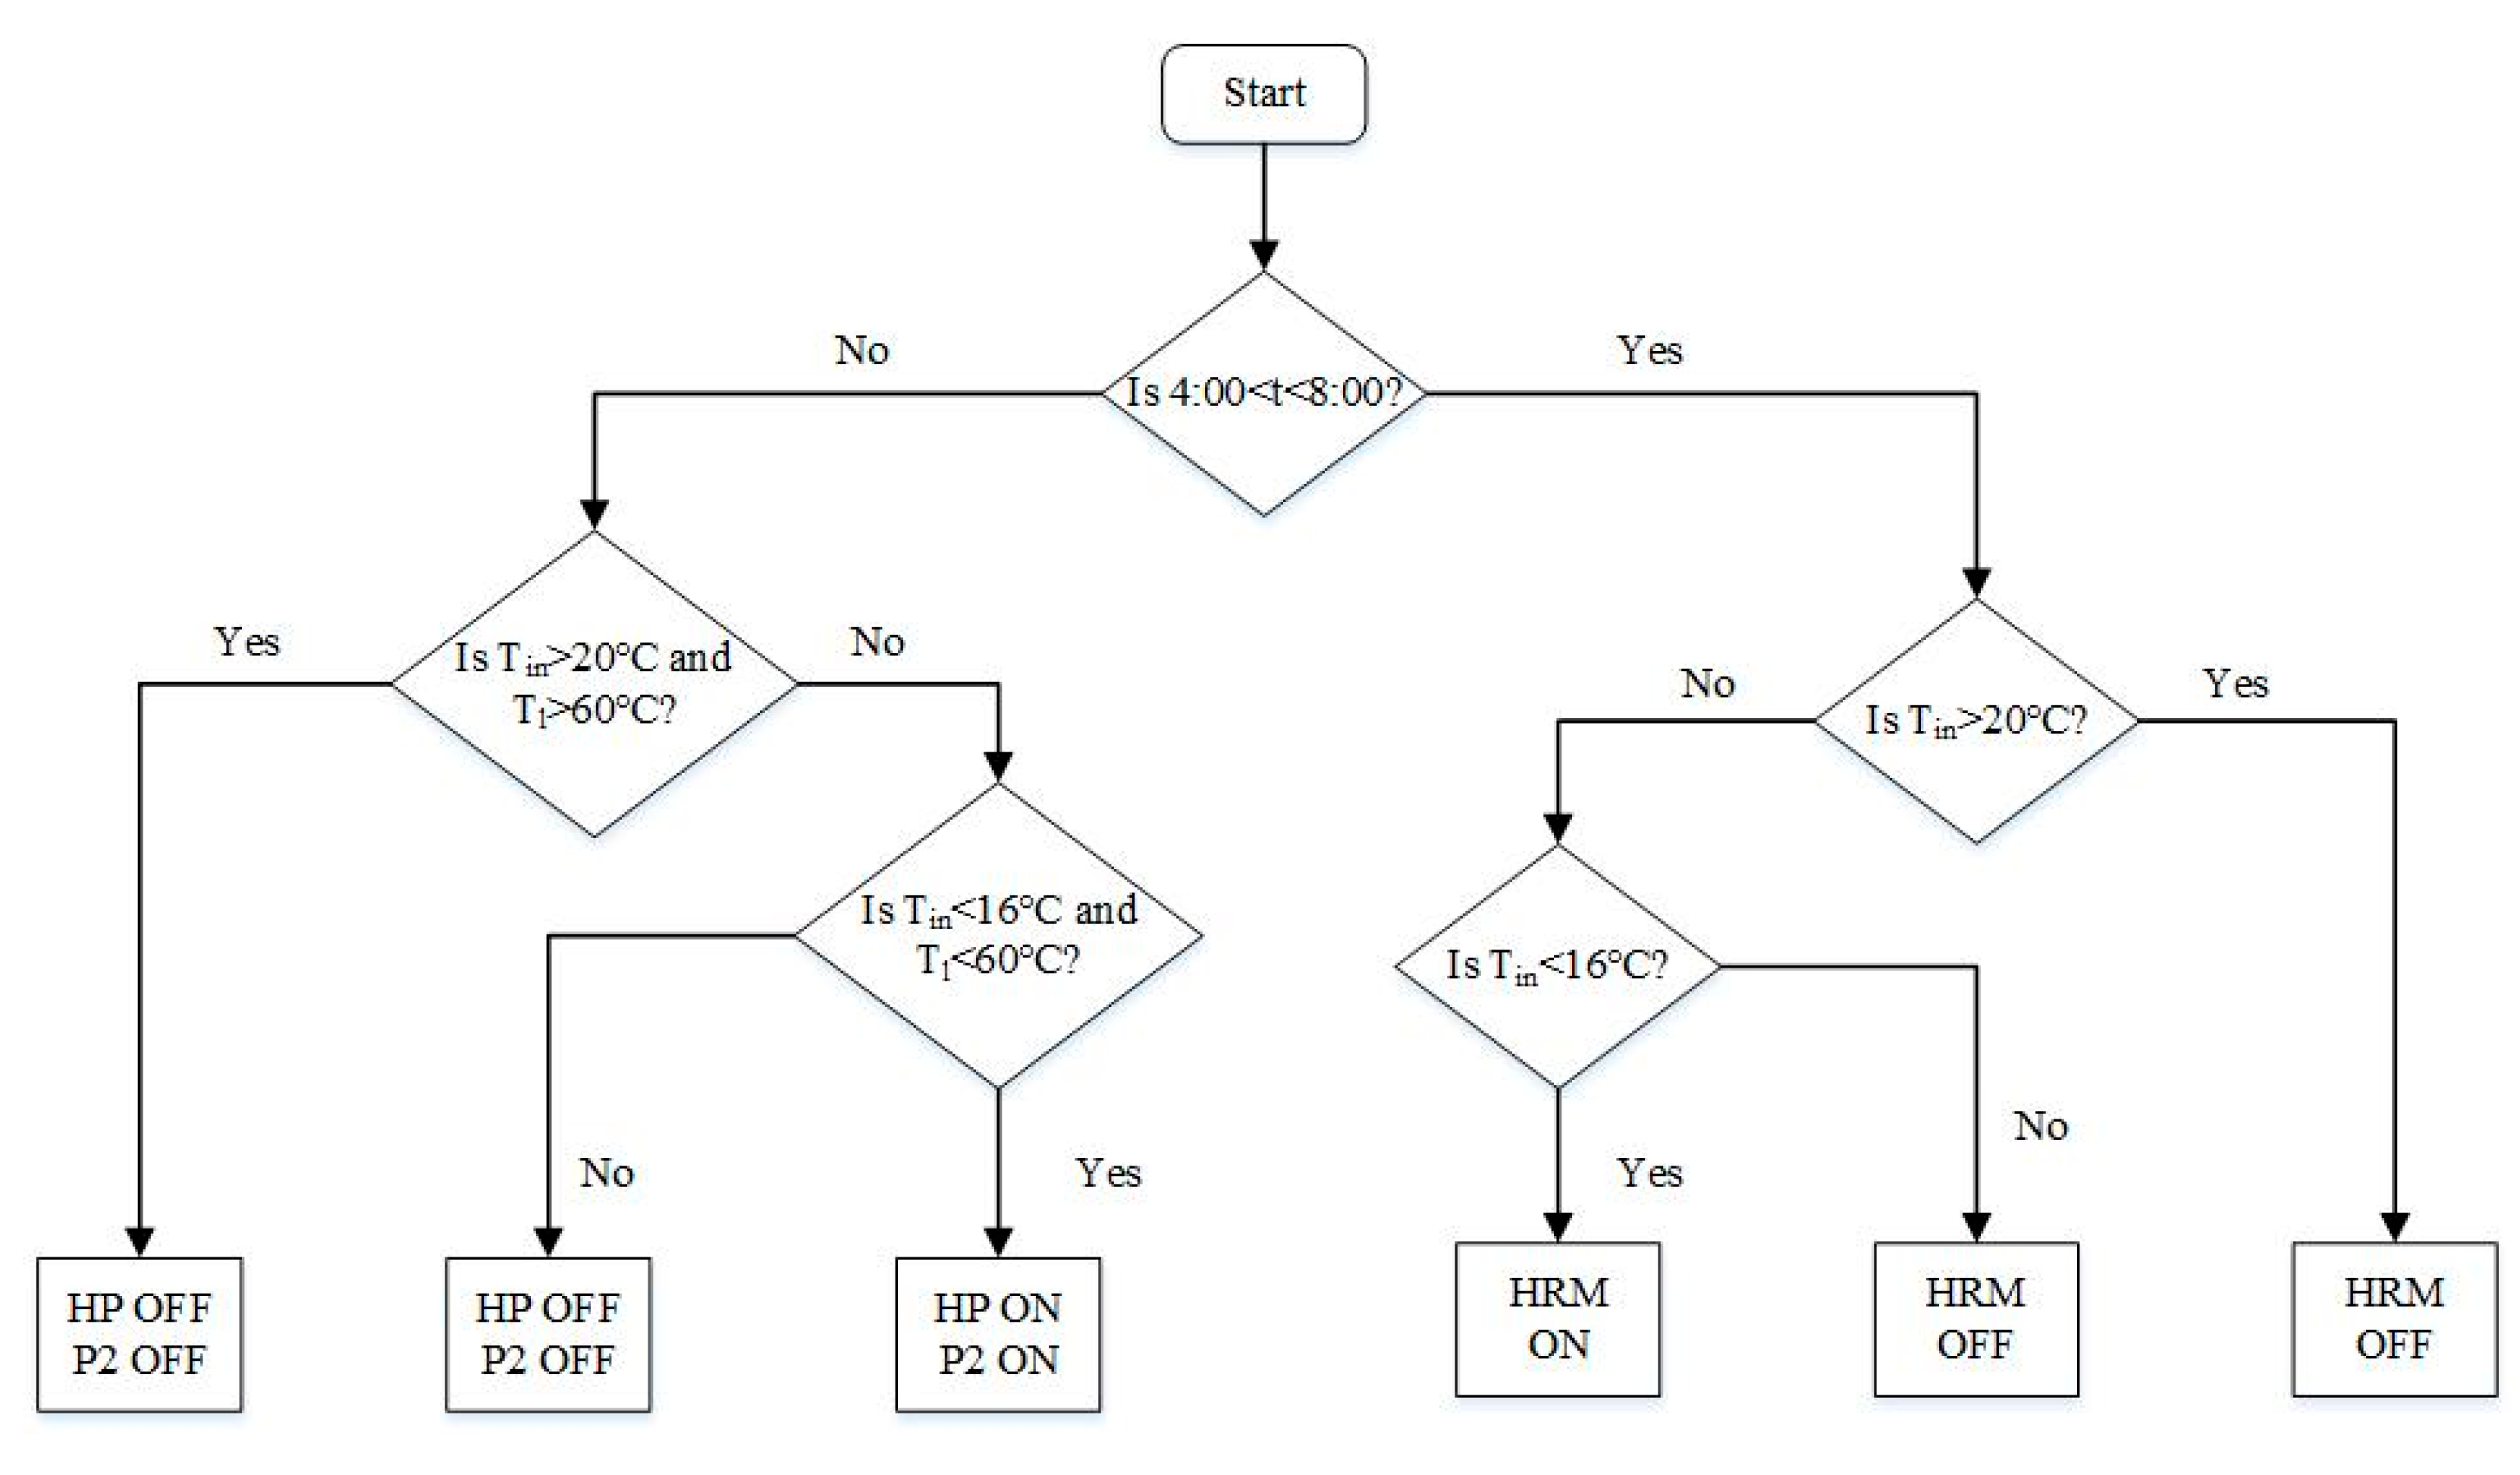
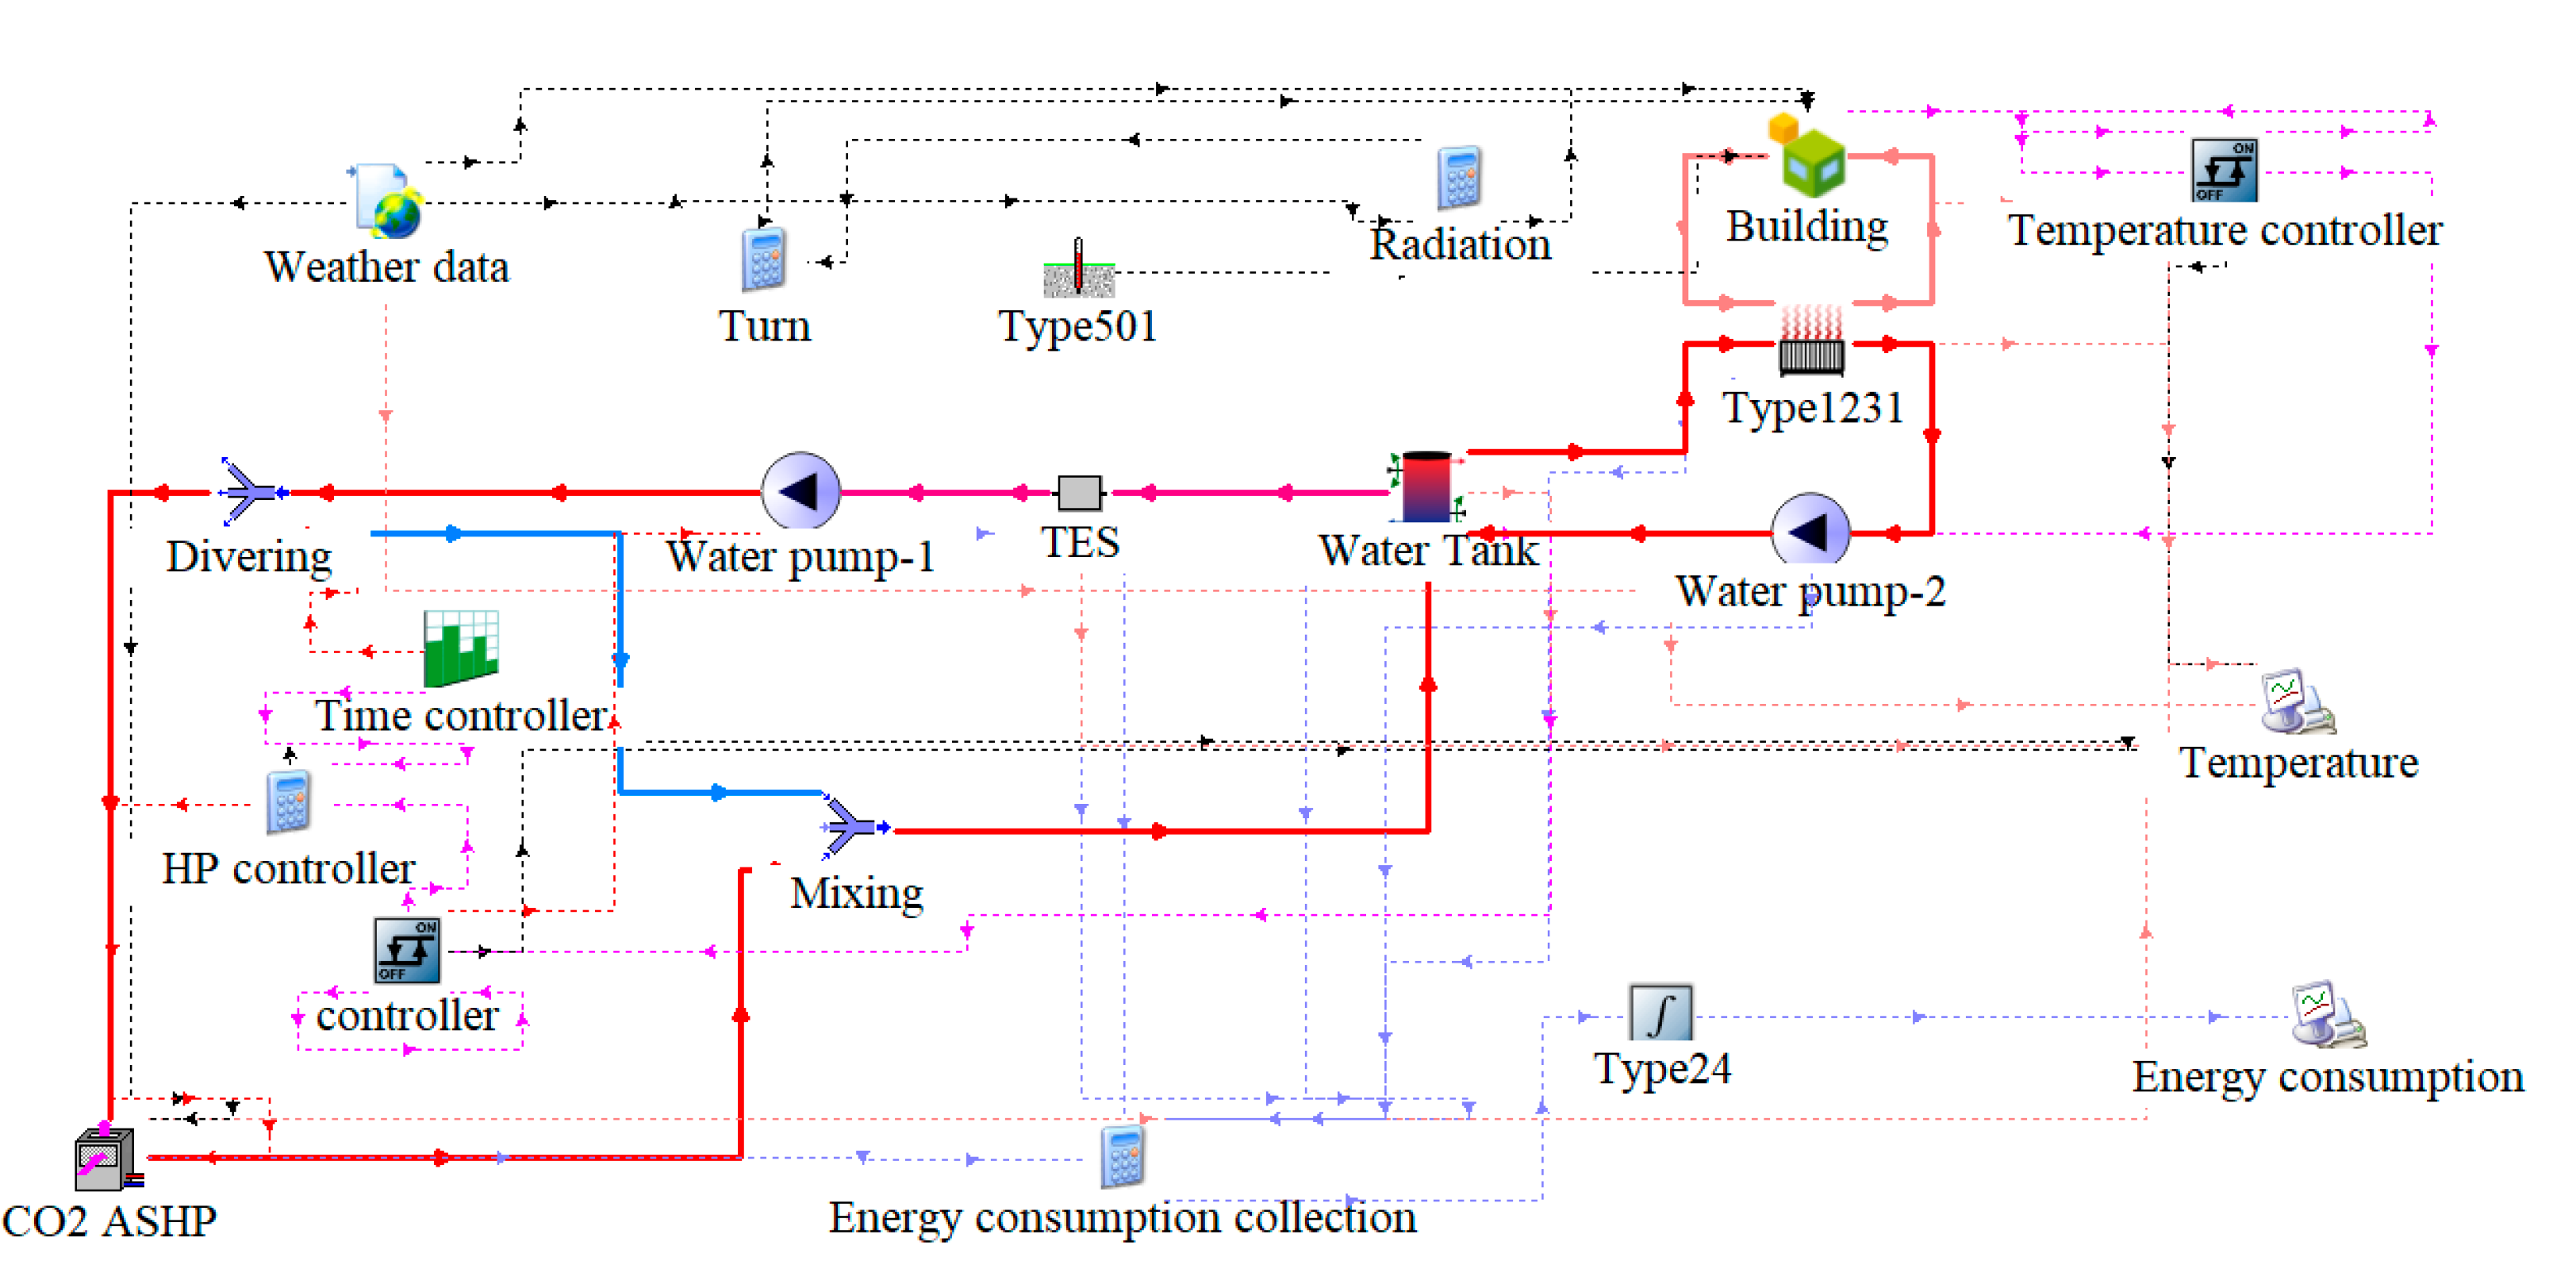
3.4. Other Components Mode and System Control Strategy

Buffer water tank and water pump are the other two major components. A buffer water tank can reduce the frequent start and stop of the heating system and enhance its performance. The water pump provides the power for the heating system; it is a constant flow system in this work. The detailed mathematical model of the components of the heating system can be seen in the reference [6].
In order to ensure indoor thermal comfort, the room temperature is set at 18 ± 2 °C.
The control logic and the TRNSYS simulation model of the studied system are shown in Figure 4 and Figure 5, respectively. The detailed components parameters can be seen in Table 2.

4. Results and Discussion

In this section, the effect of the main factors, such as the weight of PCMs, the phase change temperature of PCMs, and water tank volume, on the characteristics of the system are discussed. In addition, an economic evaluation of this system is carried out, which includes the initial investment and life-cycle costs (LCC) of operating costs incurred during use to analyze the adaptability of the system applied to heating in the cold area.
The expenses present value of cost method is used in economic calculation, which mainly includes the initial cost and the annual operating cost. The initial cost of the system includes the cost of heat sources and the auxiliary equipment, the transportation system of indoor and outer pipe networks, and the cost of the terminal system. The water storage tank of the water supply system costs 1000 RMB/m3, and the initial cost of the CO2 ASHP is 2000 RMB/kW, the cost of the PCM is 10 RMB/kg, water pumps and pipe accessories cost 2000 RMB. The initial cost (IC) can be expressed as follows:
I C = 1000 + V w + 2000 Q h p e + 10 m s + 2000
The annual operating cost (OTC) of the system, including the electricity cost (EC), the maintenance cost (RC), and the labor cost (LC) is calculated as follows:
OTC = EC + RC + LC
Among these, the electricity cost includes the heat pump, water pump, and electric auxiliary heater. The maintenance costs RC can be calculated as follows:
RC = 0.02IC
The total expenses present value of the system except the labor and water cost is as follows (PC):
P C = ( 0.02 I C + E C ) [ ( 1 + i ) n 1 i ( 1 + i ) n ] + I C
where n is the work life of the system, [n = 15 years]; i is the bench discount rate, [ i = 8.5%].

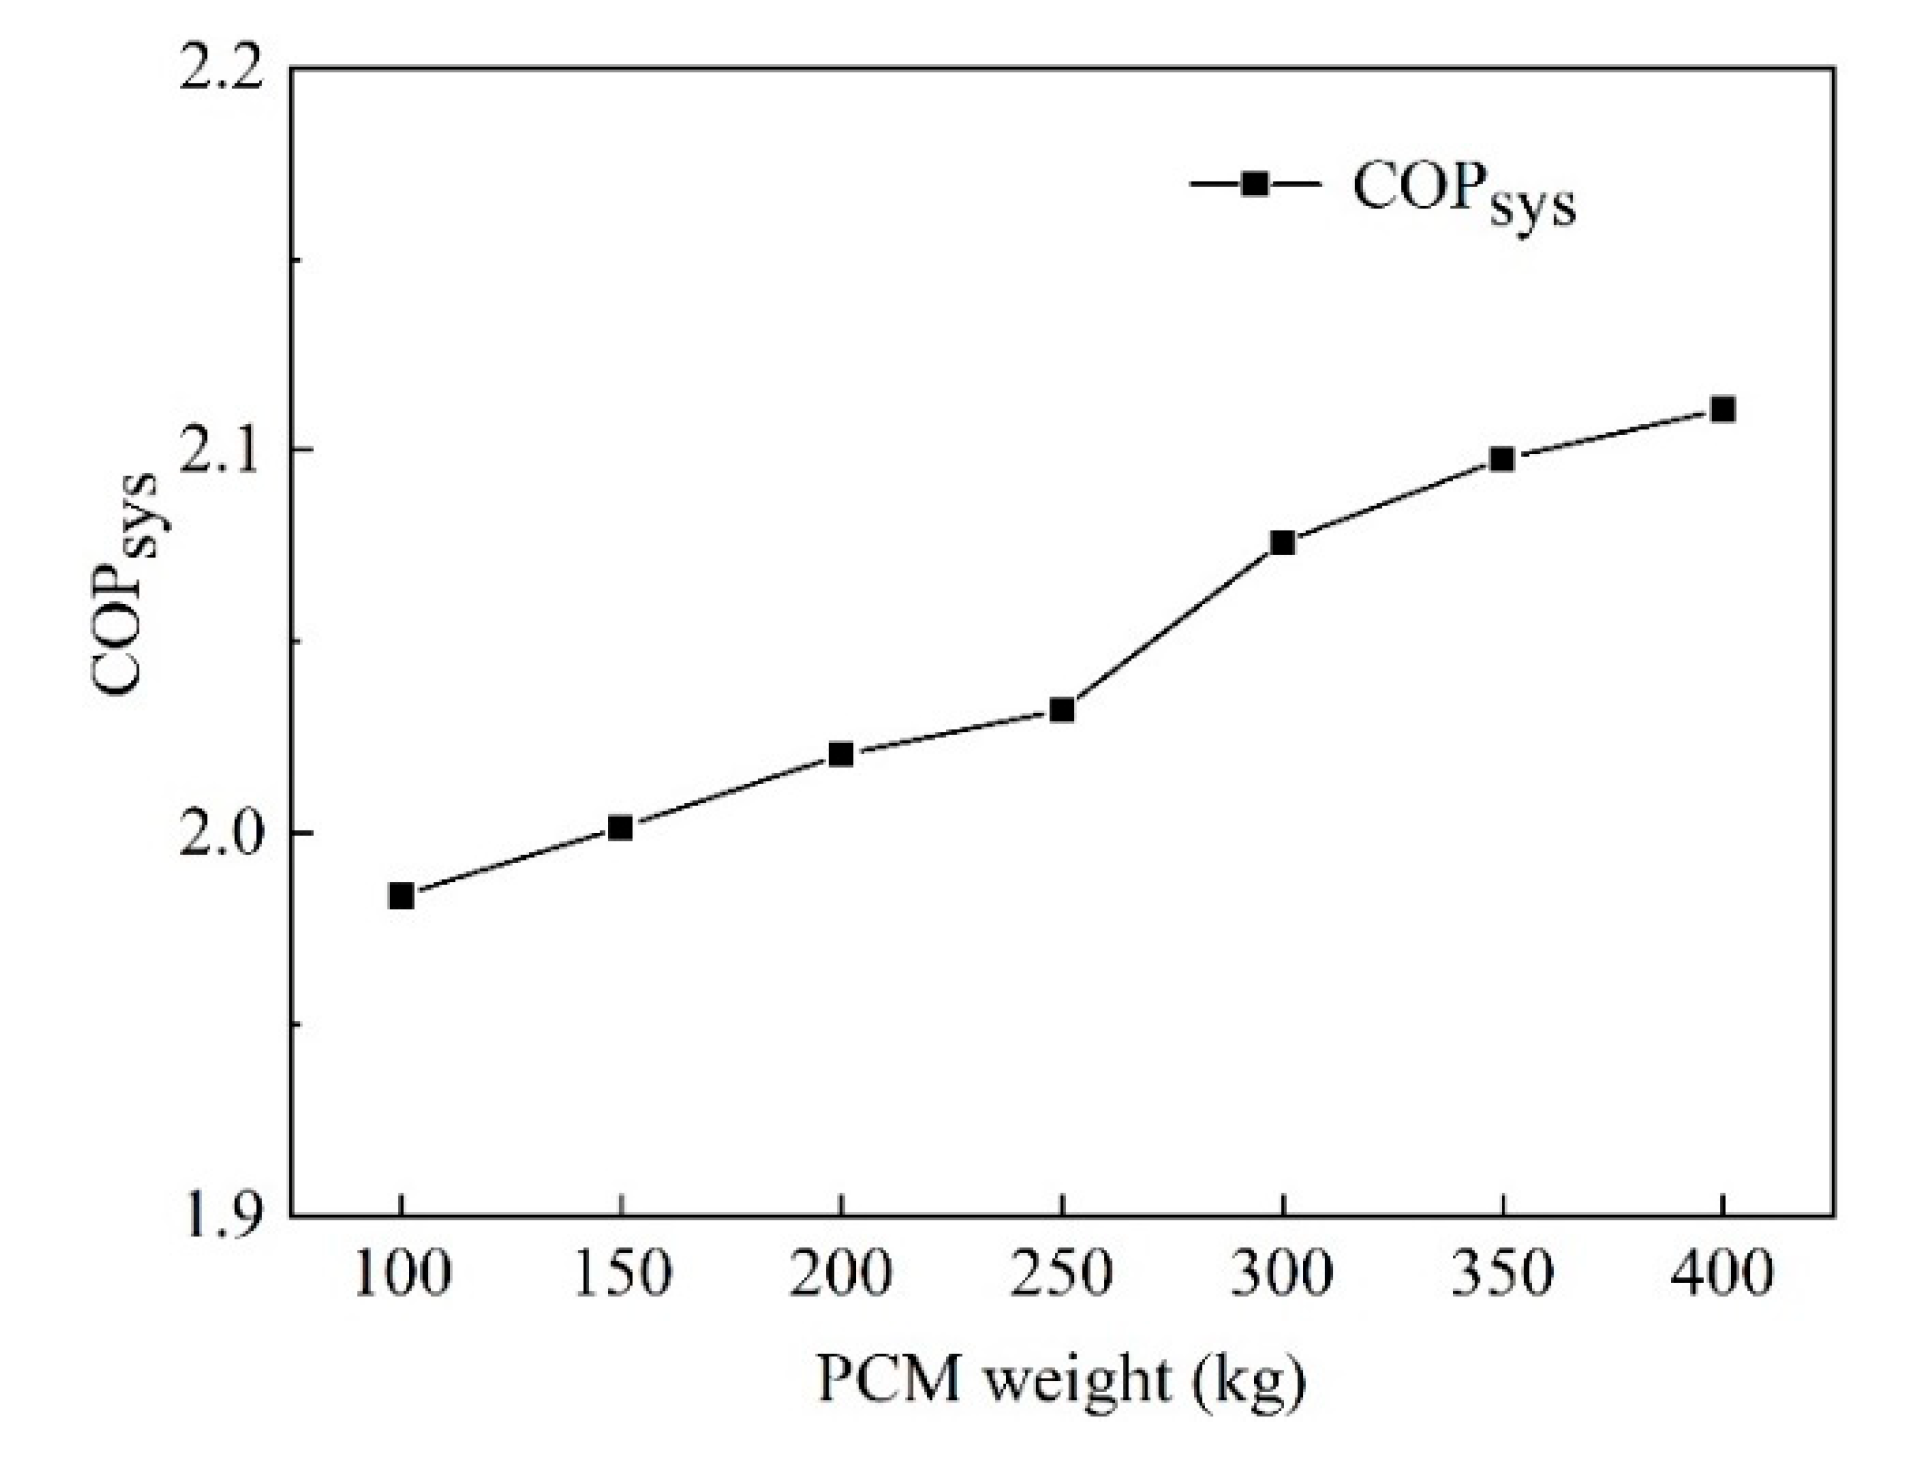
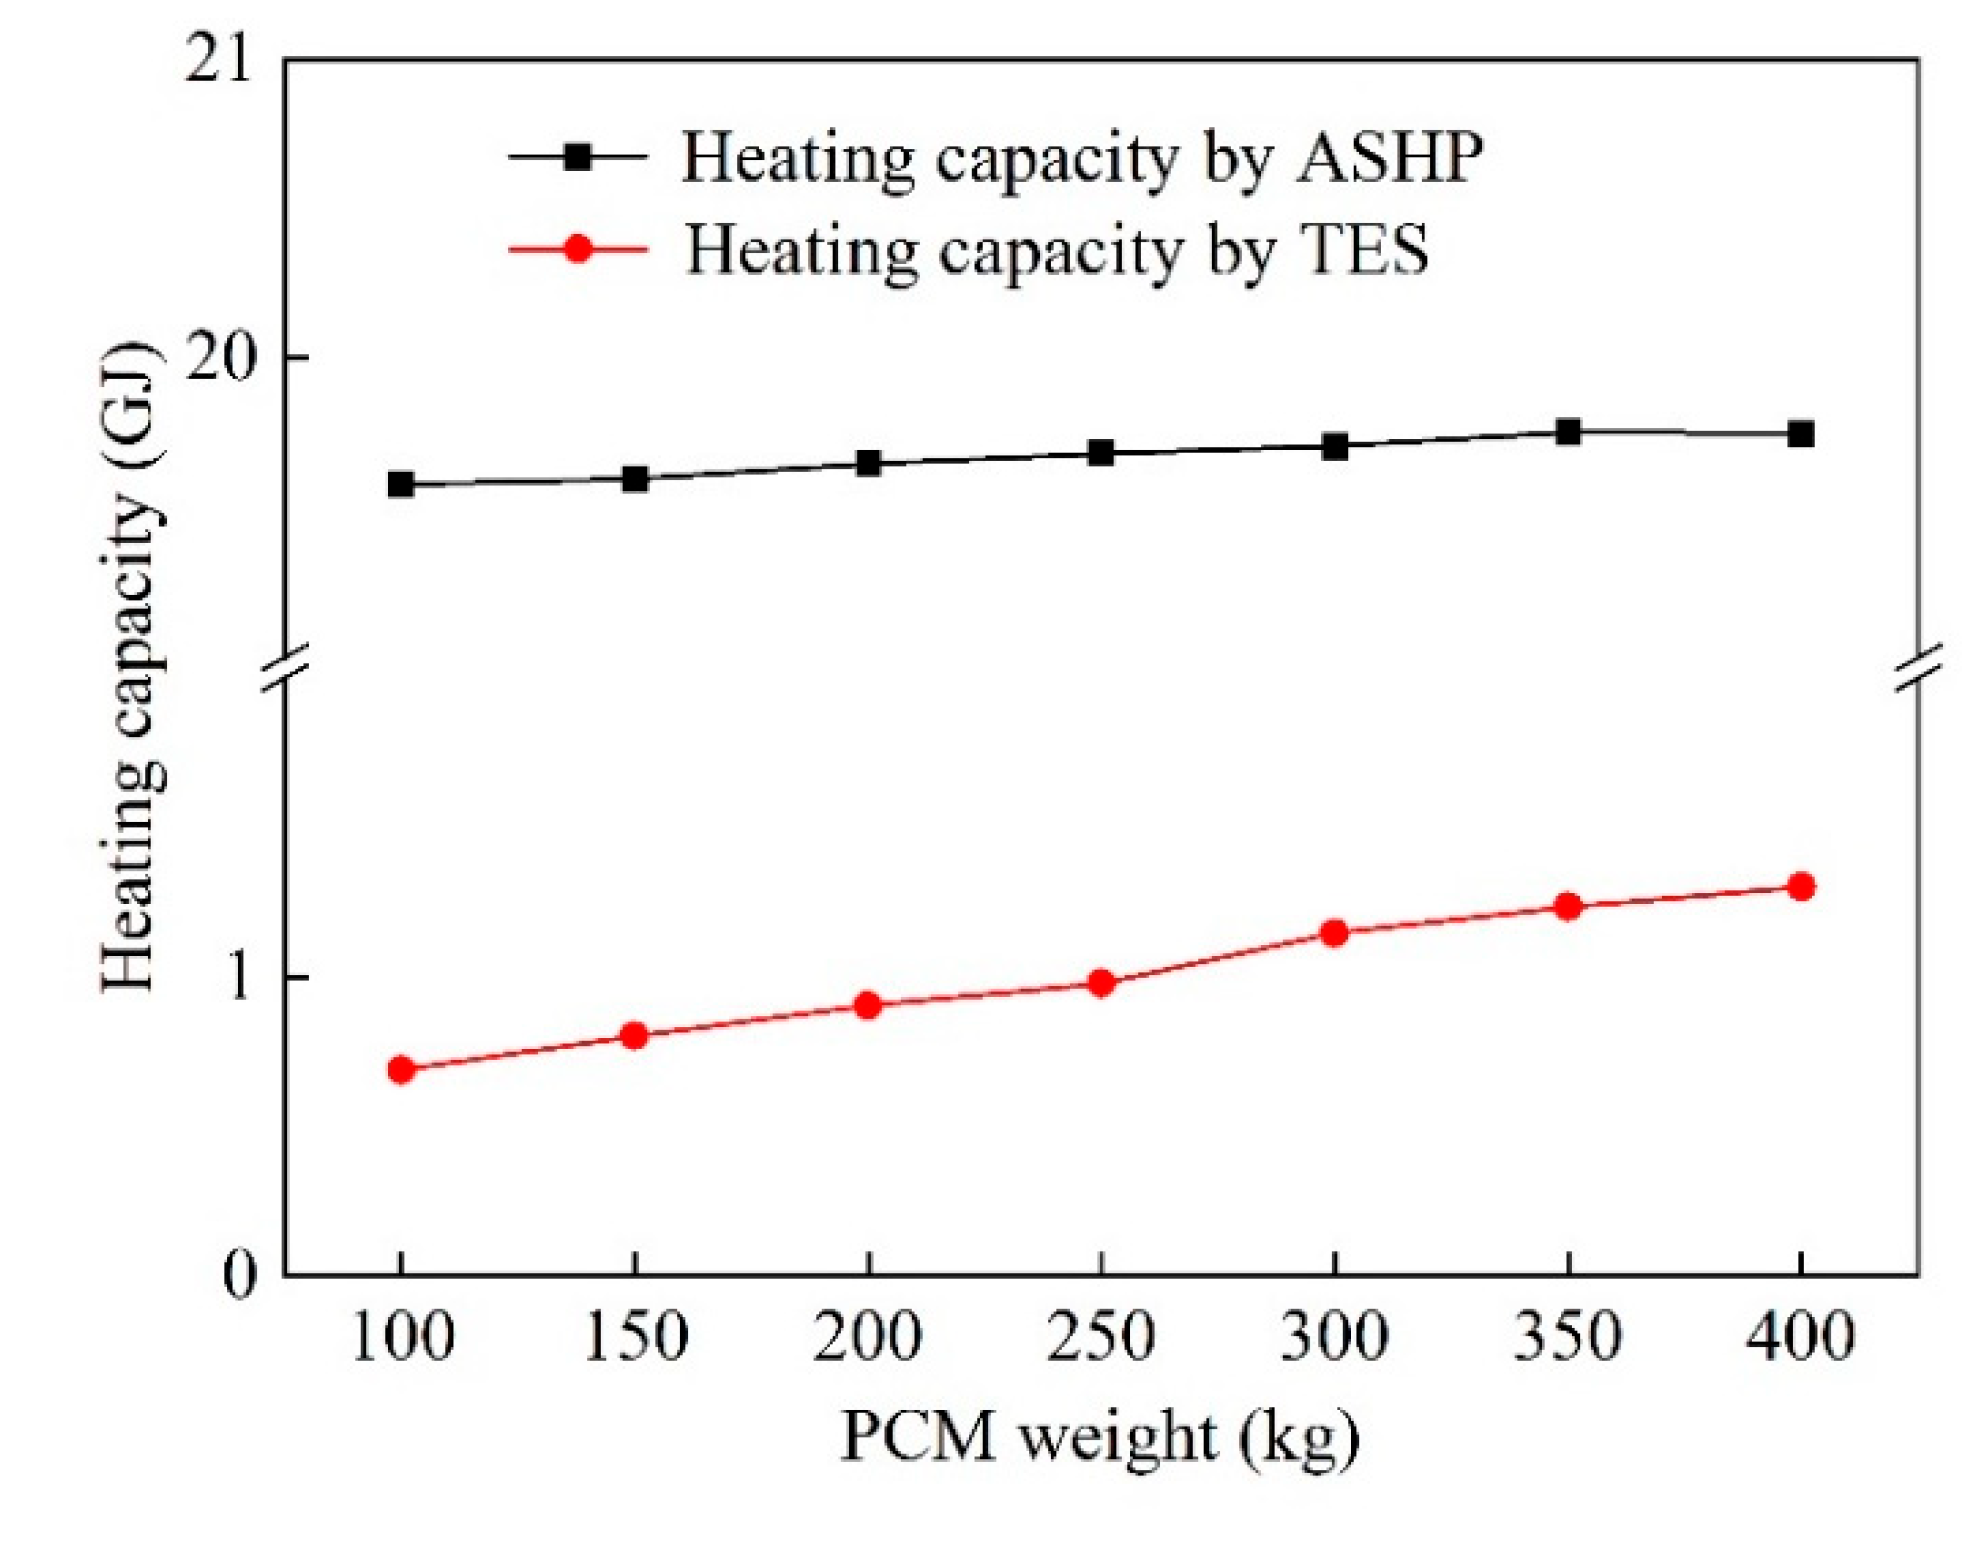
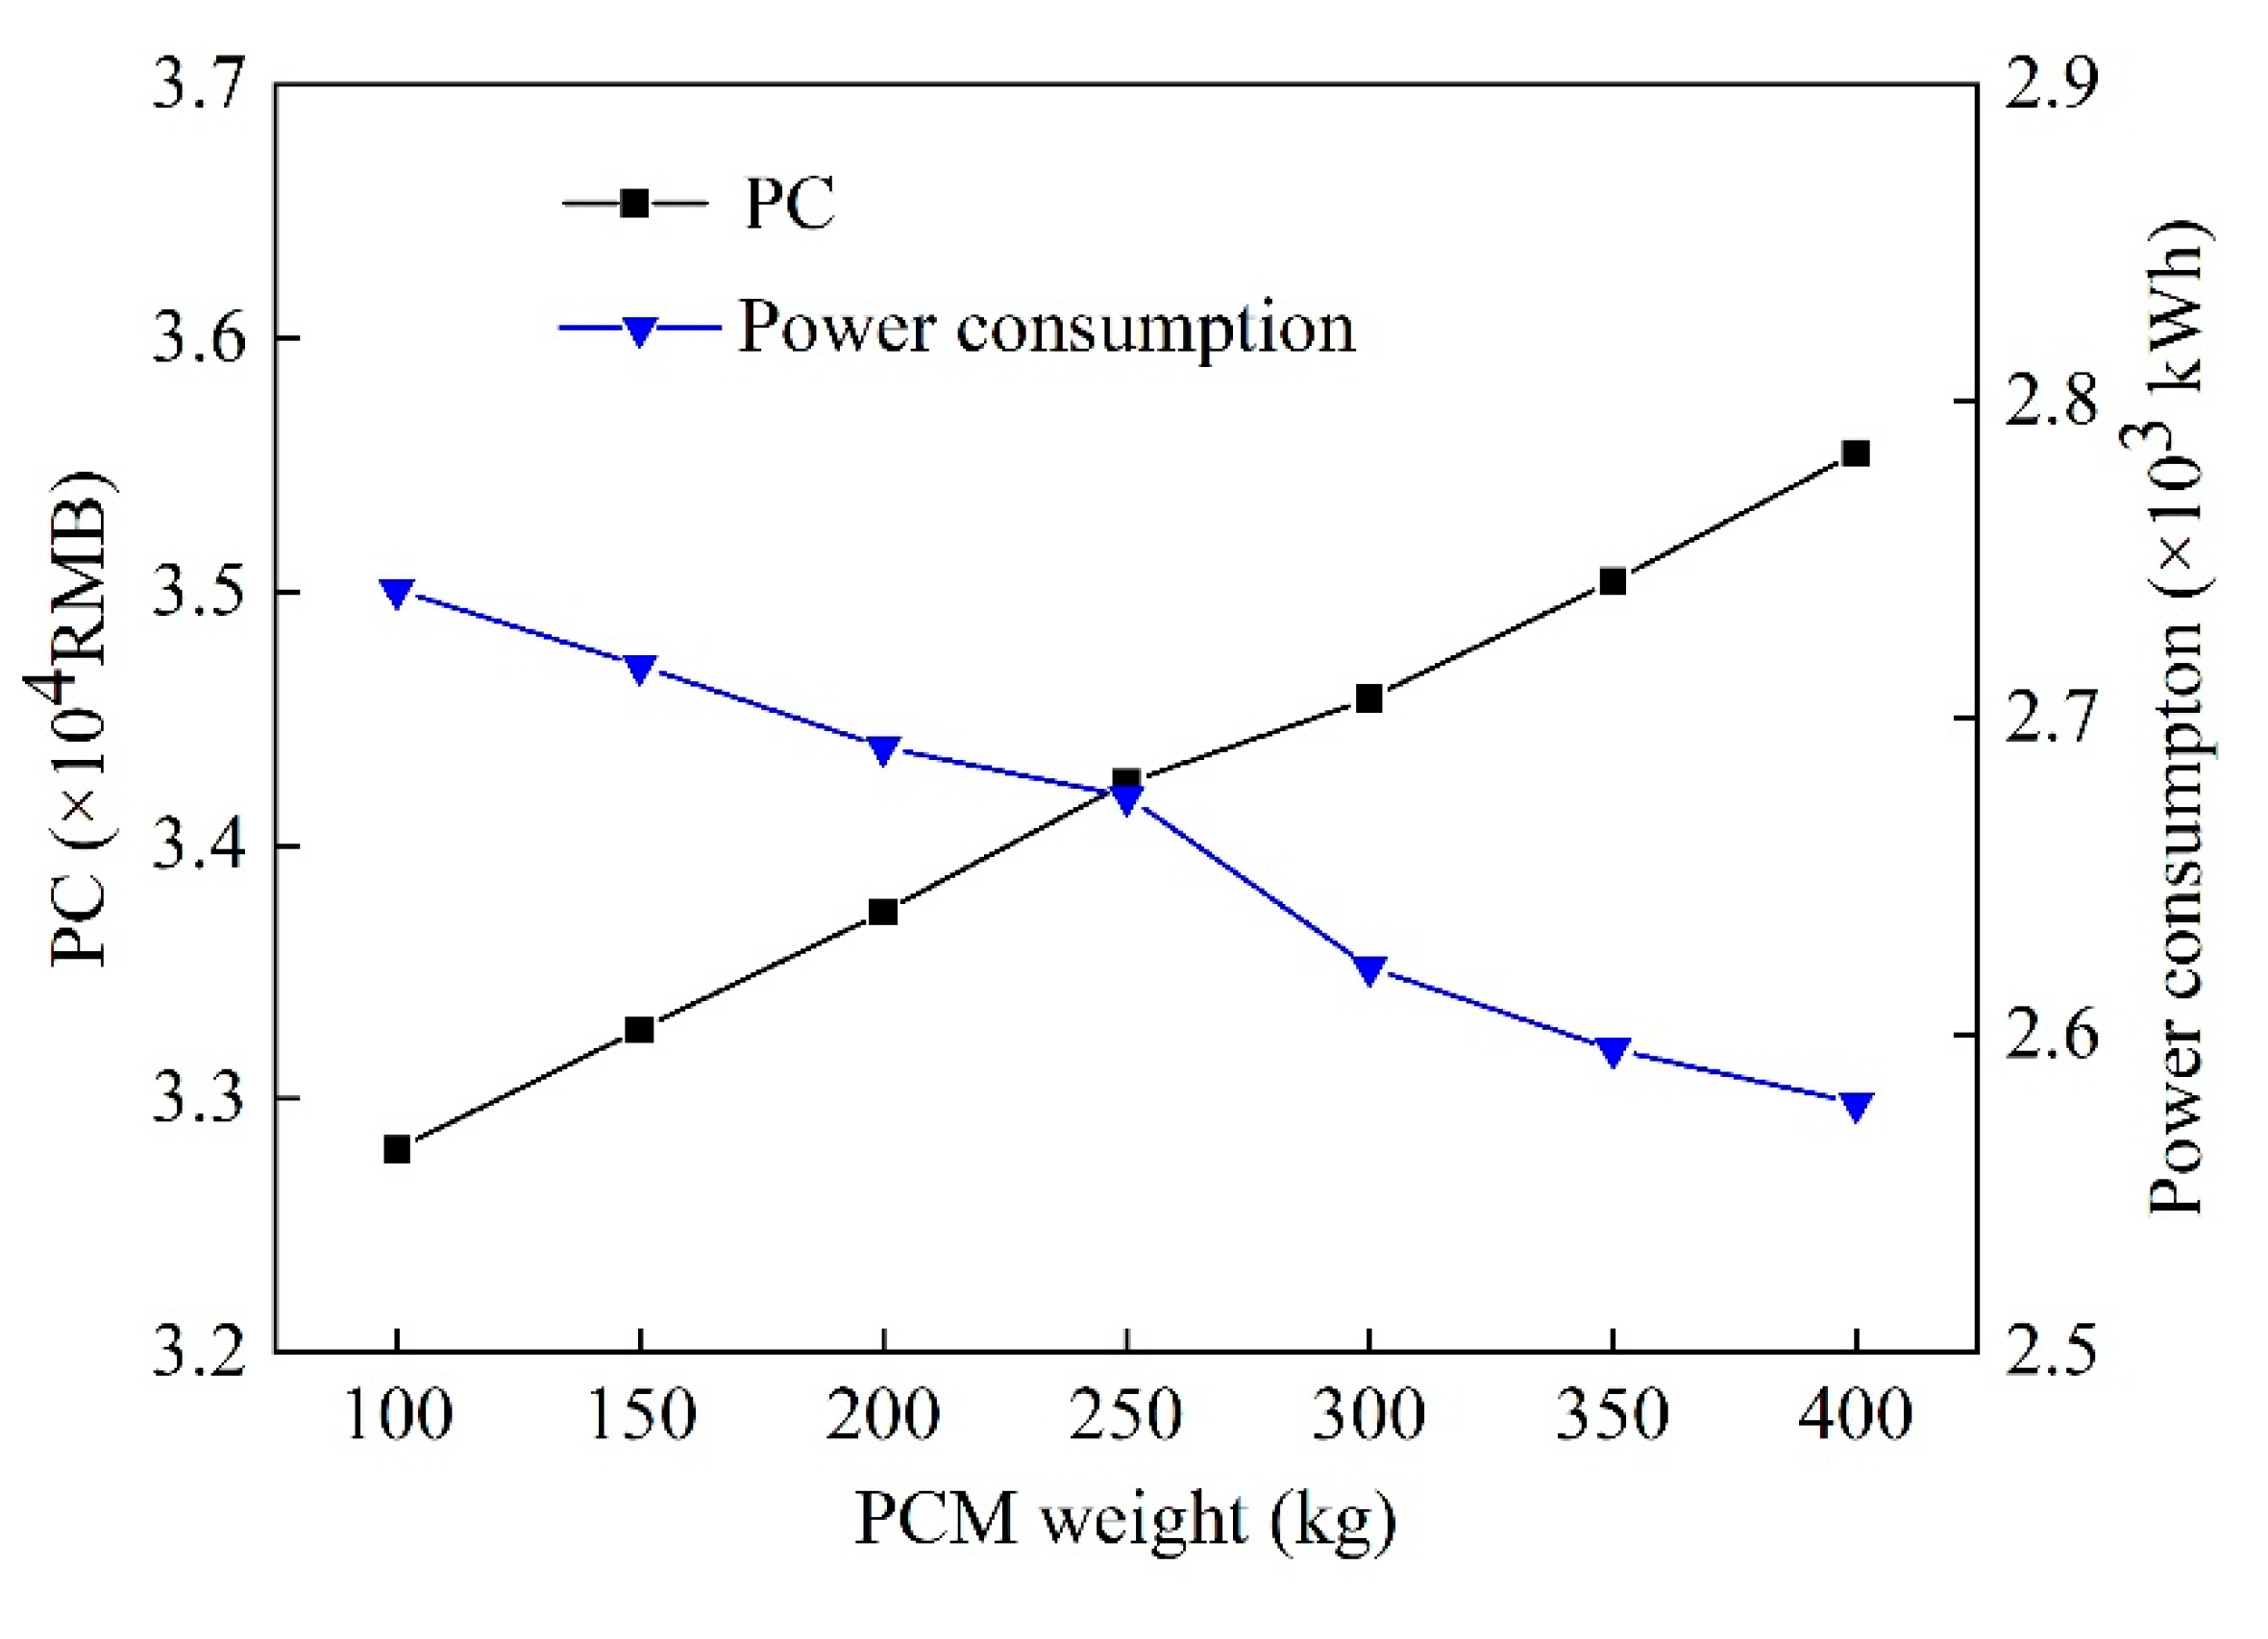
4.1. Effect of PCMs Weight on the System Characteristics

The effect of PCMs weight on the coupled heating system is shown in Figure 6 and Figure 7. The system COP increases as the weight of PCM increases. It can be explained that as the weight of PCM increases, more energy is stored in the PCM under the heat storage mode, thus can release the more heat under heat release mode and reduce the auxiliary heating power consumption of the system, which eventually lead to the increase of the coupling system COP. The coupling system COP is 1.98 when the weight of PCMs is 100 kg, while the COP is 2.11 when the quality increases to 400 kg, and the COP of coupled heating system is improved by 6.6%.
The power consumption and the expenses present value of the coupling system are analyzed as shown in Figure 8. The power consumption of the system decreases with the increase of the weight of PCM. This is because the more energy stores in TES under the heat storage mode with the increase of the weight of the PCM, it can release more heat under the heat release mode and reduce the auxiliary heating power consumption of the system. With the increase of the weight of PCM, the initial investment of the coupled heating system increases linearly. Although the reduction of the power consumption reduces the operating cost of the system, the effect of the reduction of electricity consumption on the present value of the system cost is less than that of the increase of the PCM weight, so the expenses present value of the coupling system still shows a monotonous increasing trend.

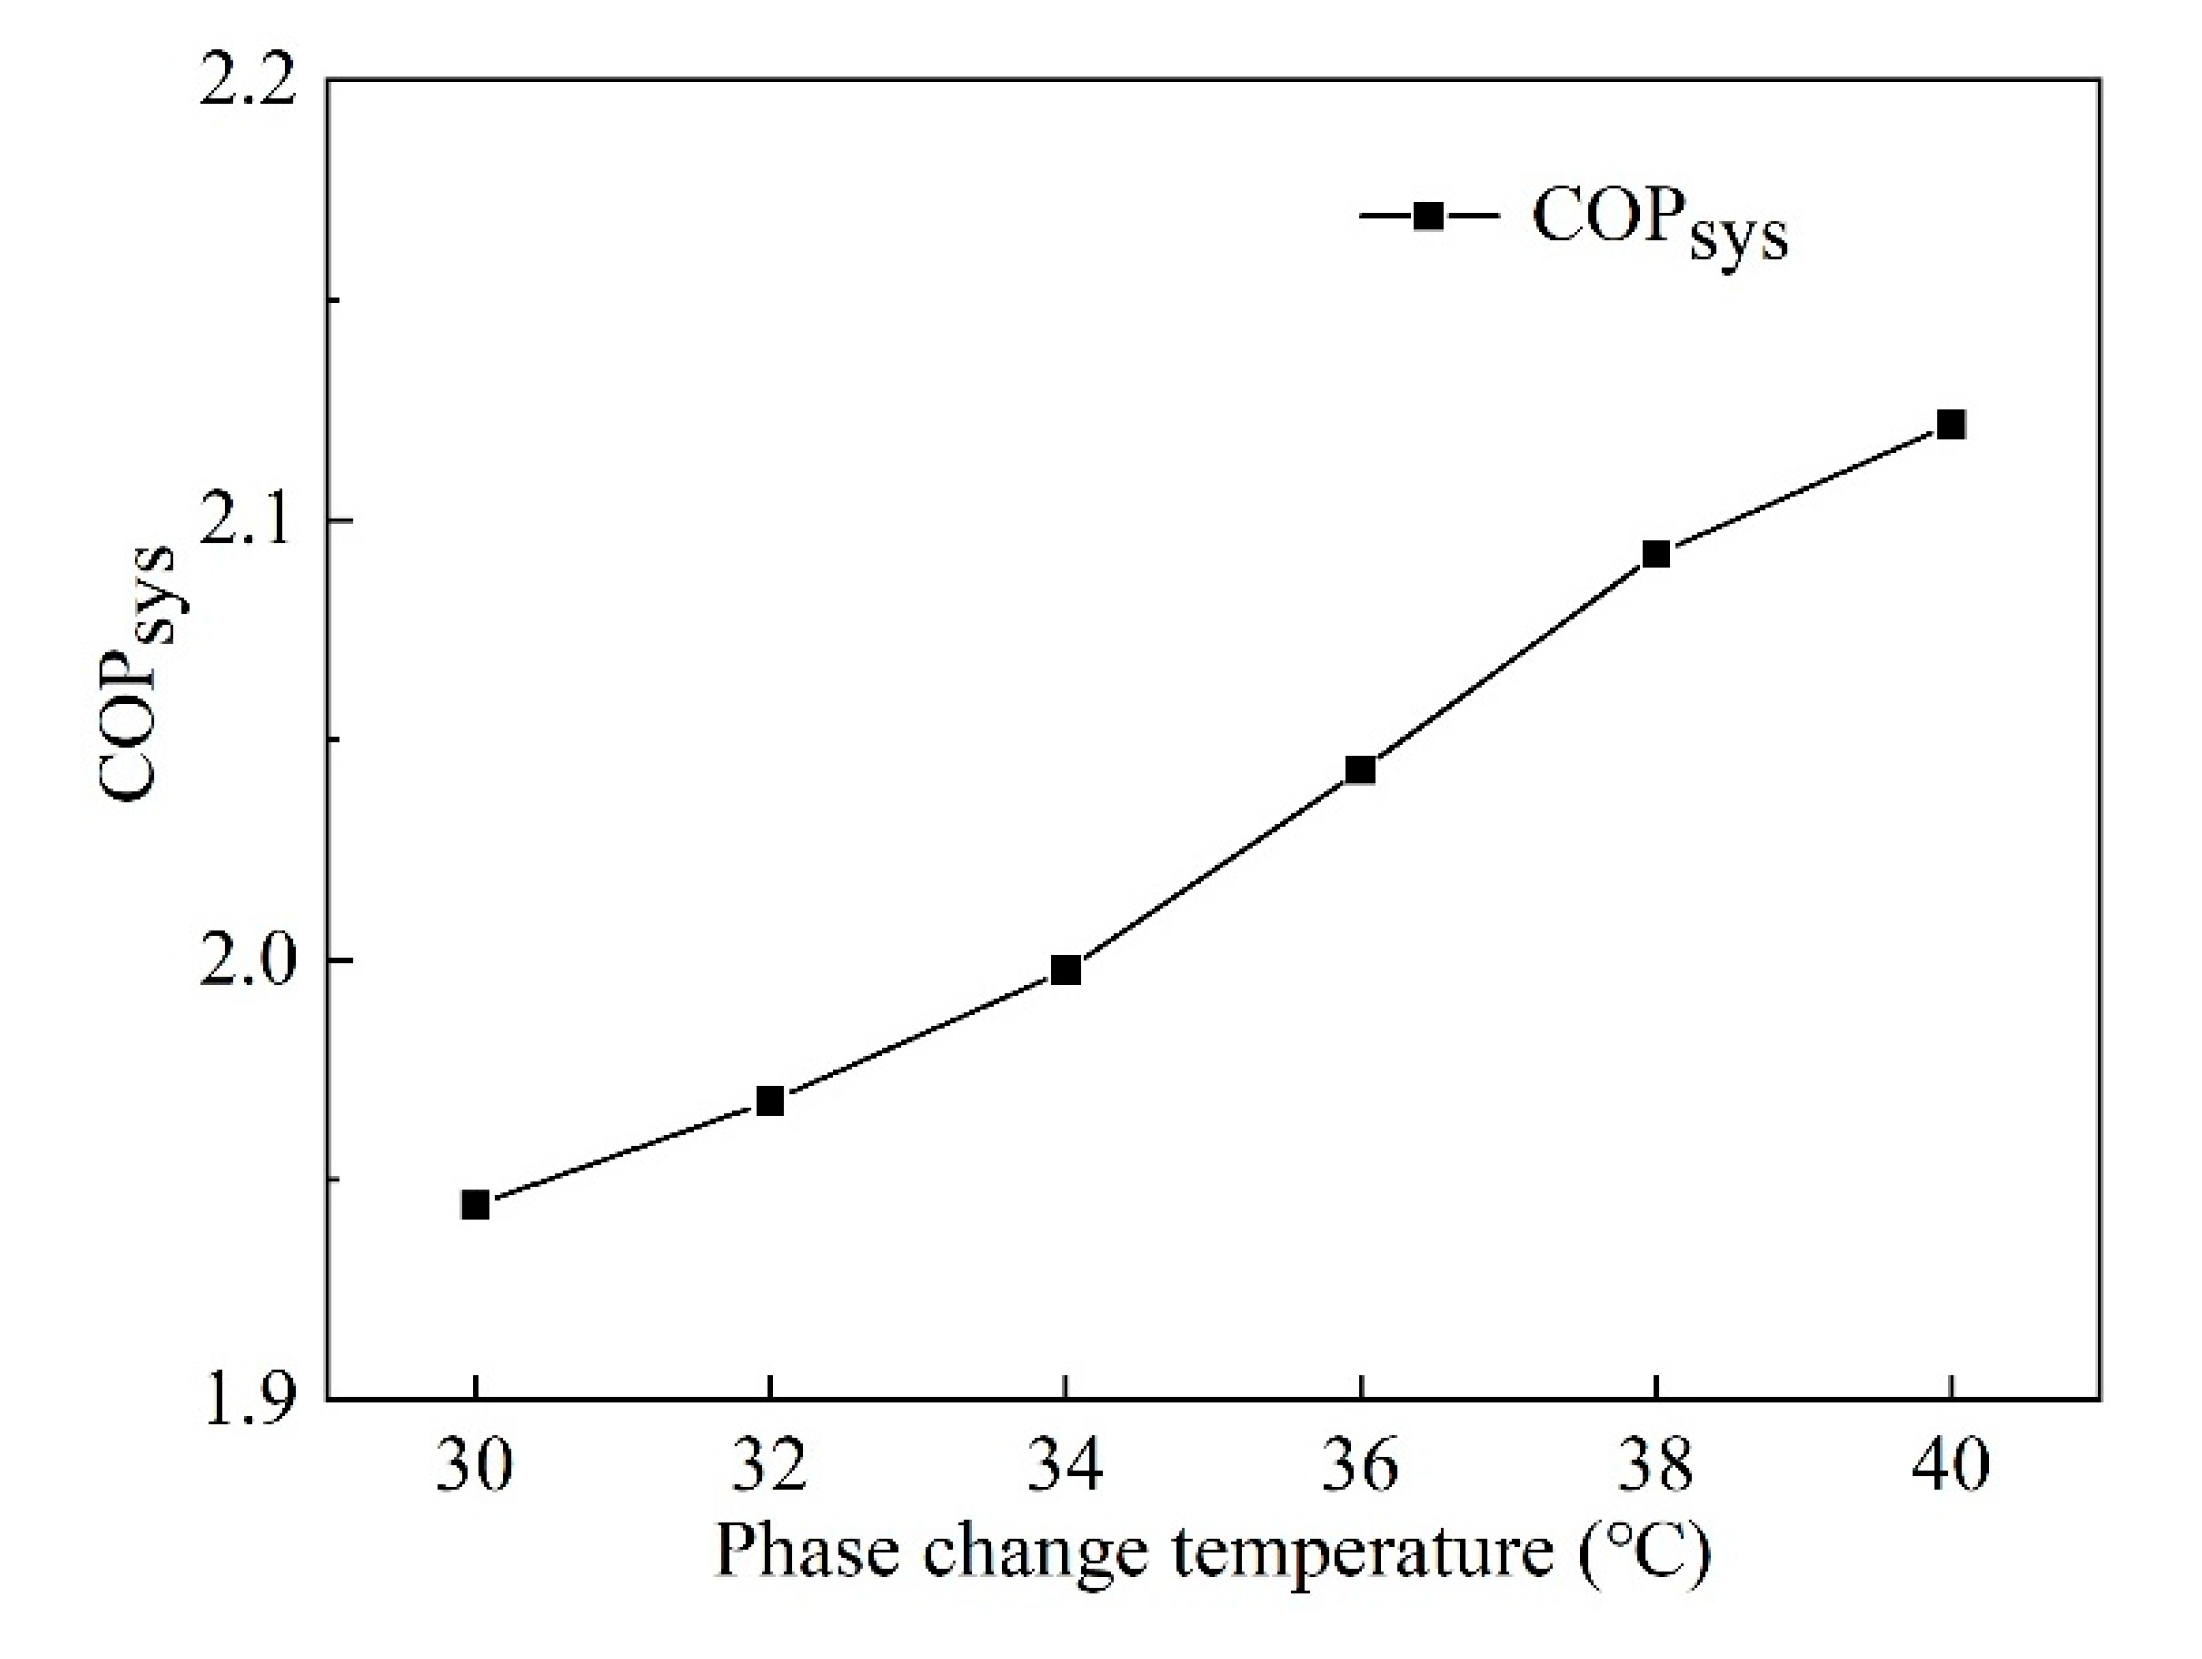
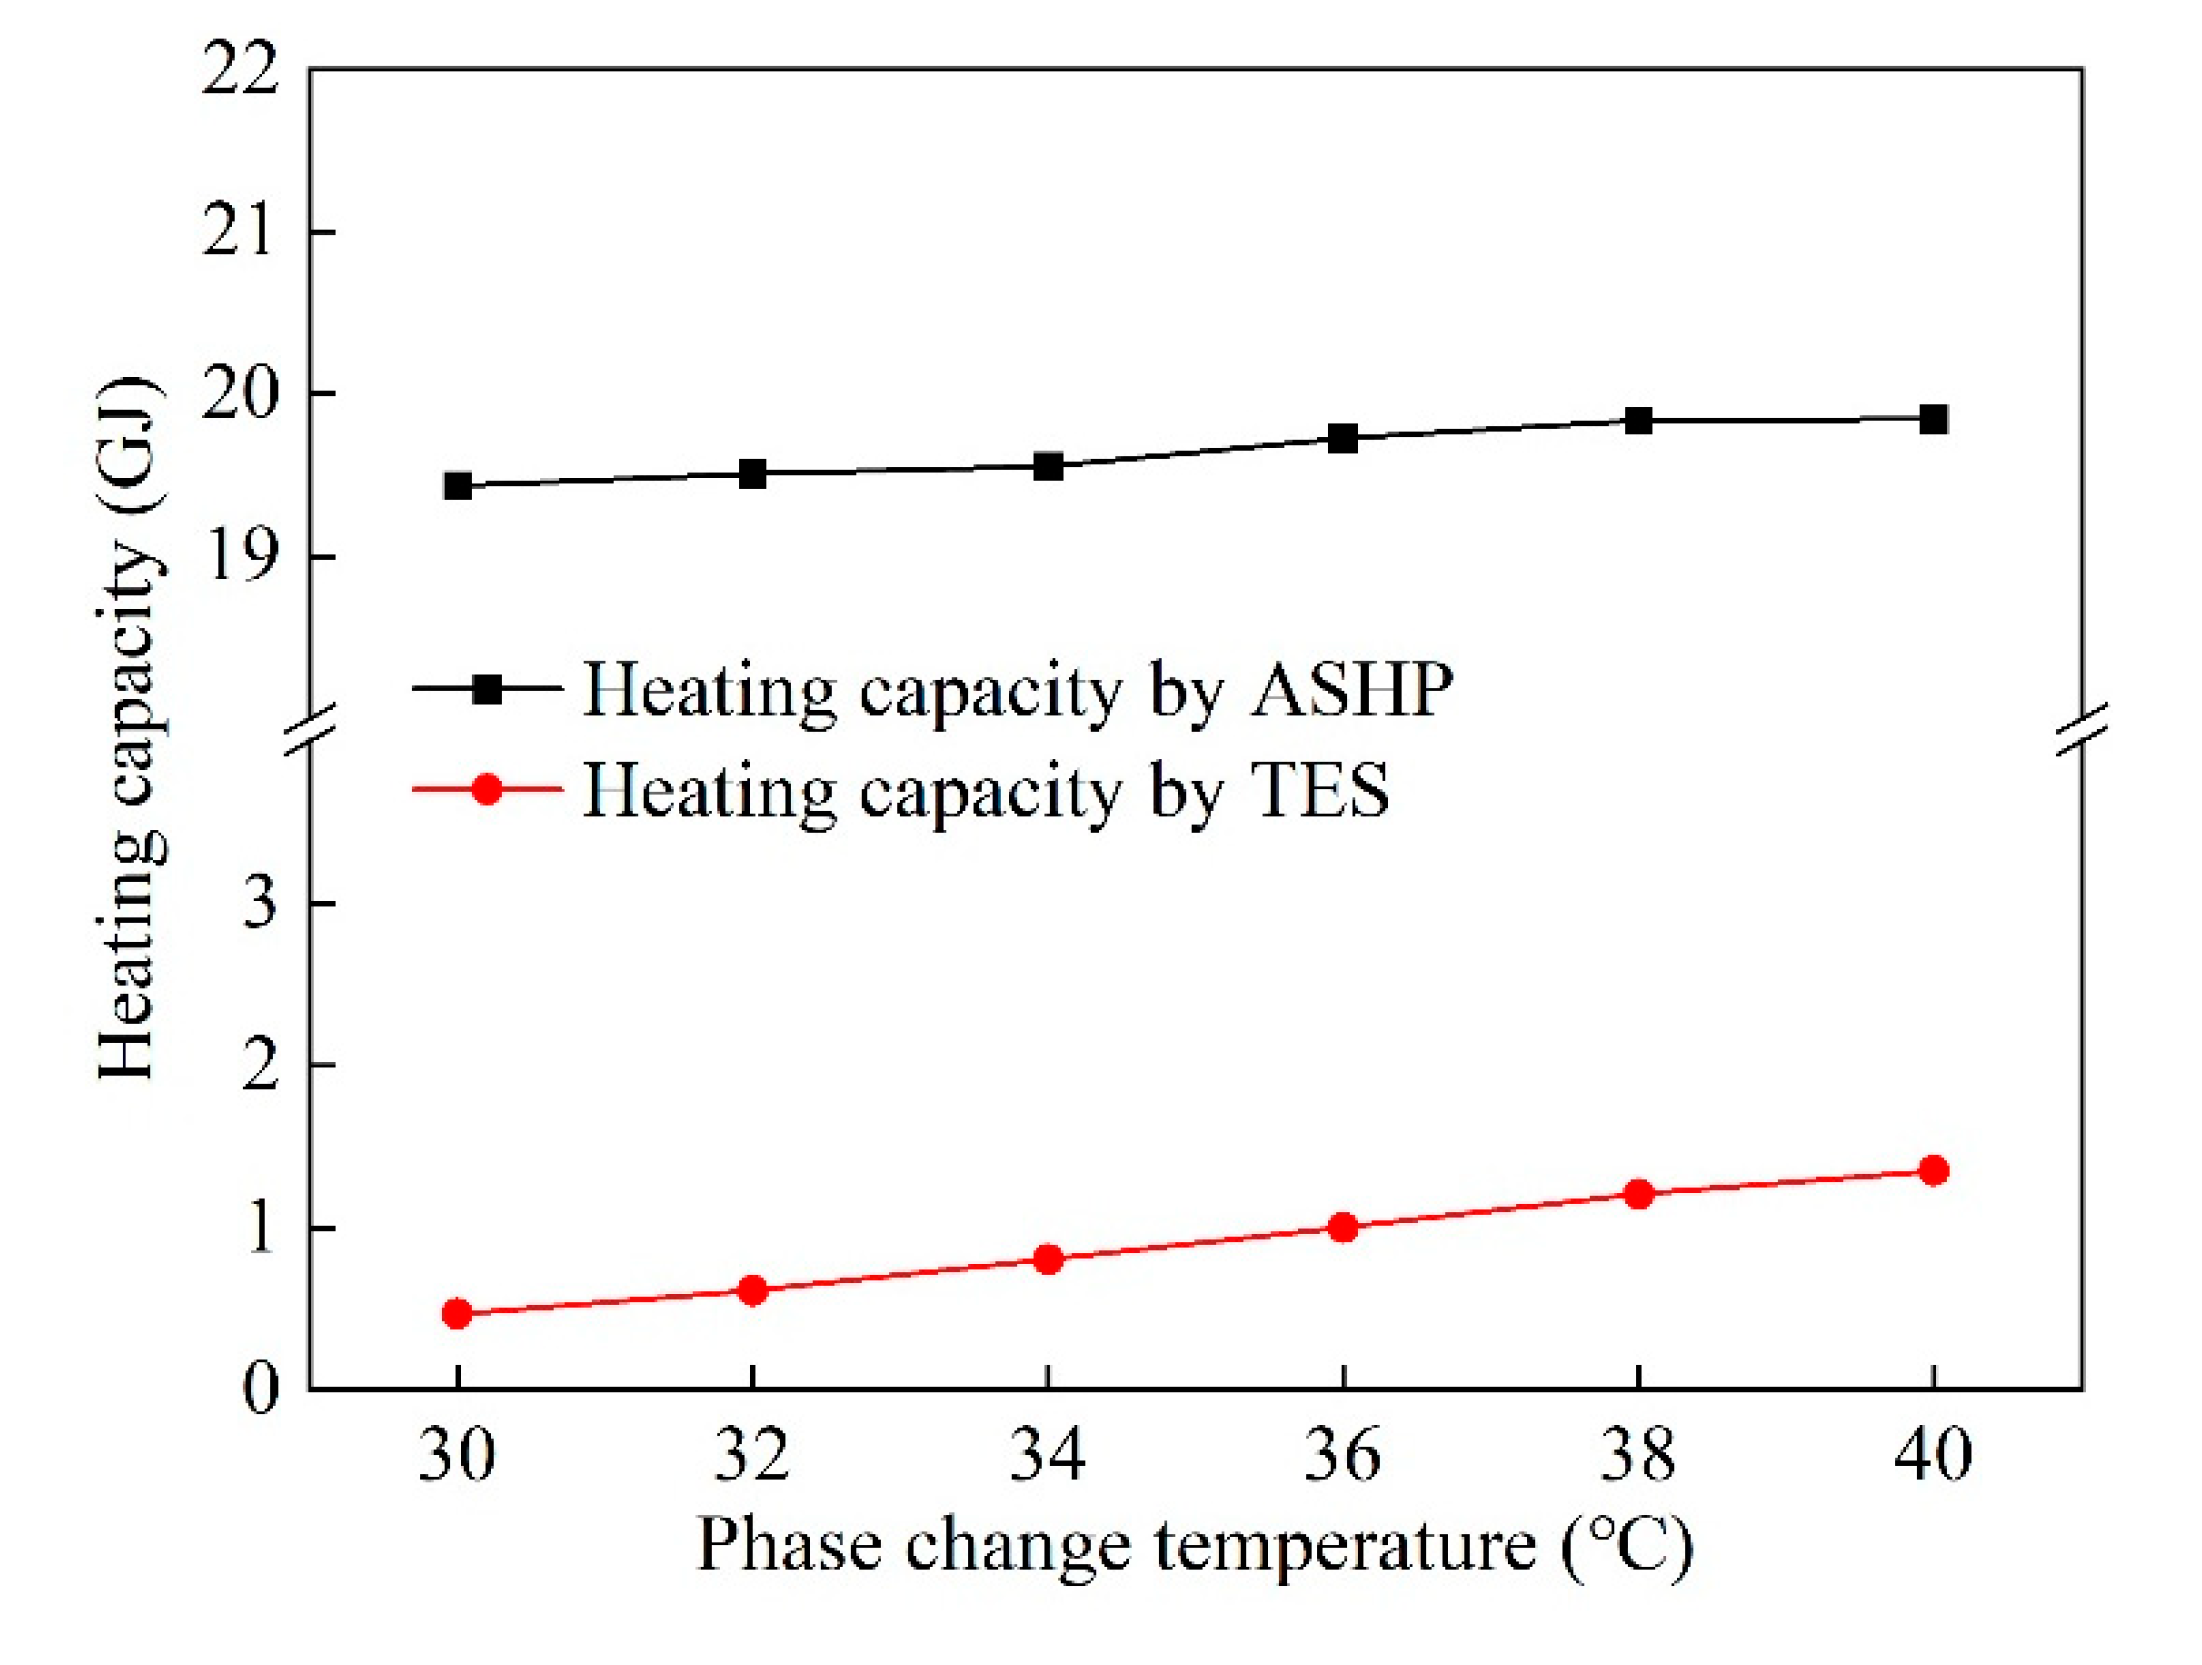
4.2. Effect of Phase Change Temperature of PCM on the System Characteristics

The phase change temperature of PCM significantly influences the performance of the system. When the phase change temperature is low, the heat transfer temperature difference is large and results in a good heat transfer efficiency. However, the low-temperature energy stored under the heat release mode may not meet the terminal demand, which requires the electric auxiliary heating equipment. The effect of the phase change temperature on the COP and the heat capacity of the coupled heating system is shown in Figure 9 and Figure 10. With the increase of the phase change temperature, the COP of the coupled heating system increases greatly, and the heating capacity increases slightly. Additionally, the heating capacity provided by TES increased with the increase of phase change temperature under the heat release mode.
In addition, with the increase of the phase change temperature, PCMs can release more high-temperature heat under heat release mode, reducing the auxiliary heating power consumption of the system, thus resulting in an increased COP of the coupled heating system. When the phase change temperature is 36 °C, the system COP is 2.04, while the phase change temperature changes from 36 °C to 40 °C, the system COP increases by 3.9%.
The effect of the phase change temperature on the power consumption and the expenses present value of the coupled heating system is shown in Figure 11. The power consumption of the system decreases with the increase of the phase change temperature. The reason for this phenomenon is that the phase change temperature increased, which led to storing high-temperature energy under the heat storage mode. This kind of result can release more heat under the heat release mode and reduce the auxiliary heating power consumption of the system. When the phase change temperature increases, the initial investment of the coupled heating system is not influenced, and the power consumption is reduced, so the expenses present value of the coupled system decreases.

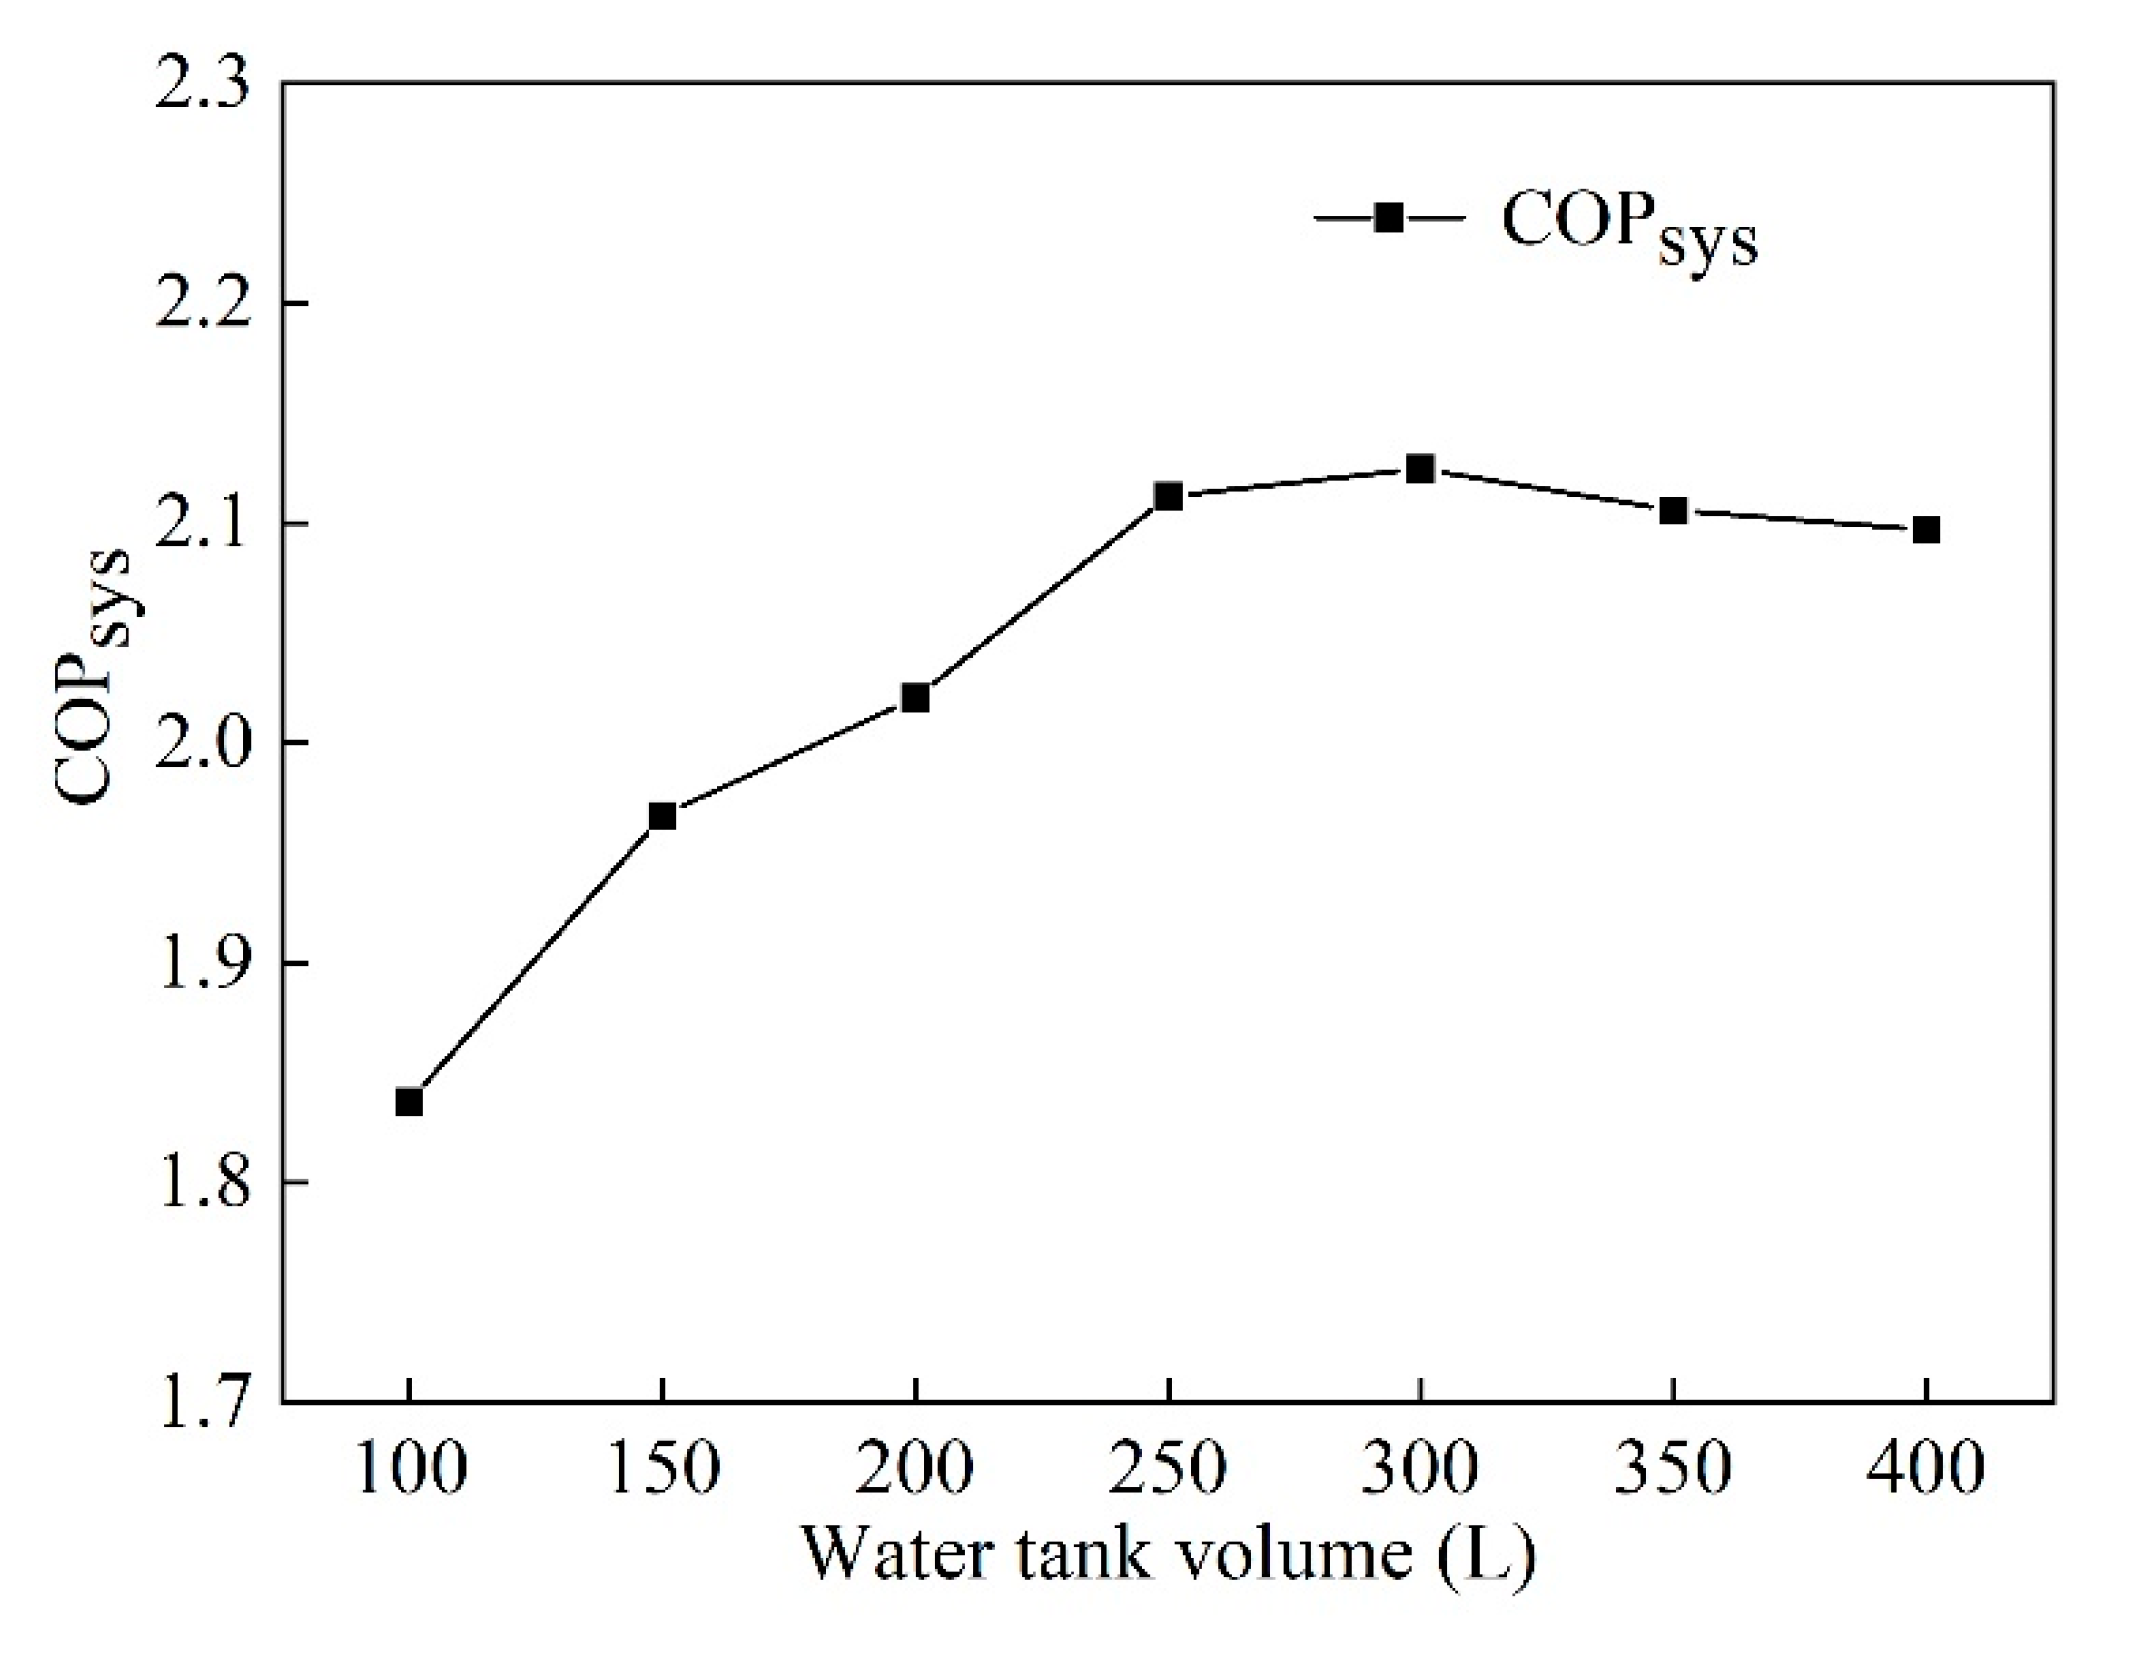
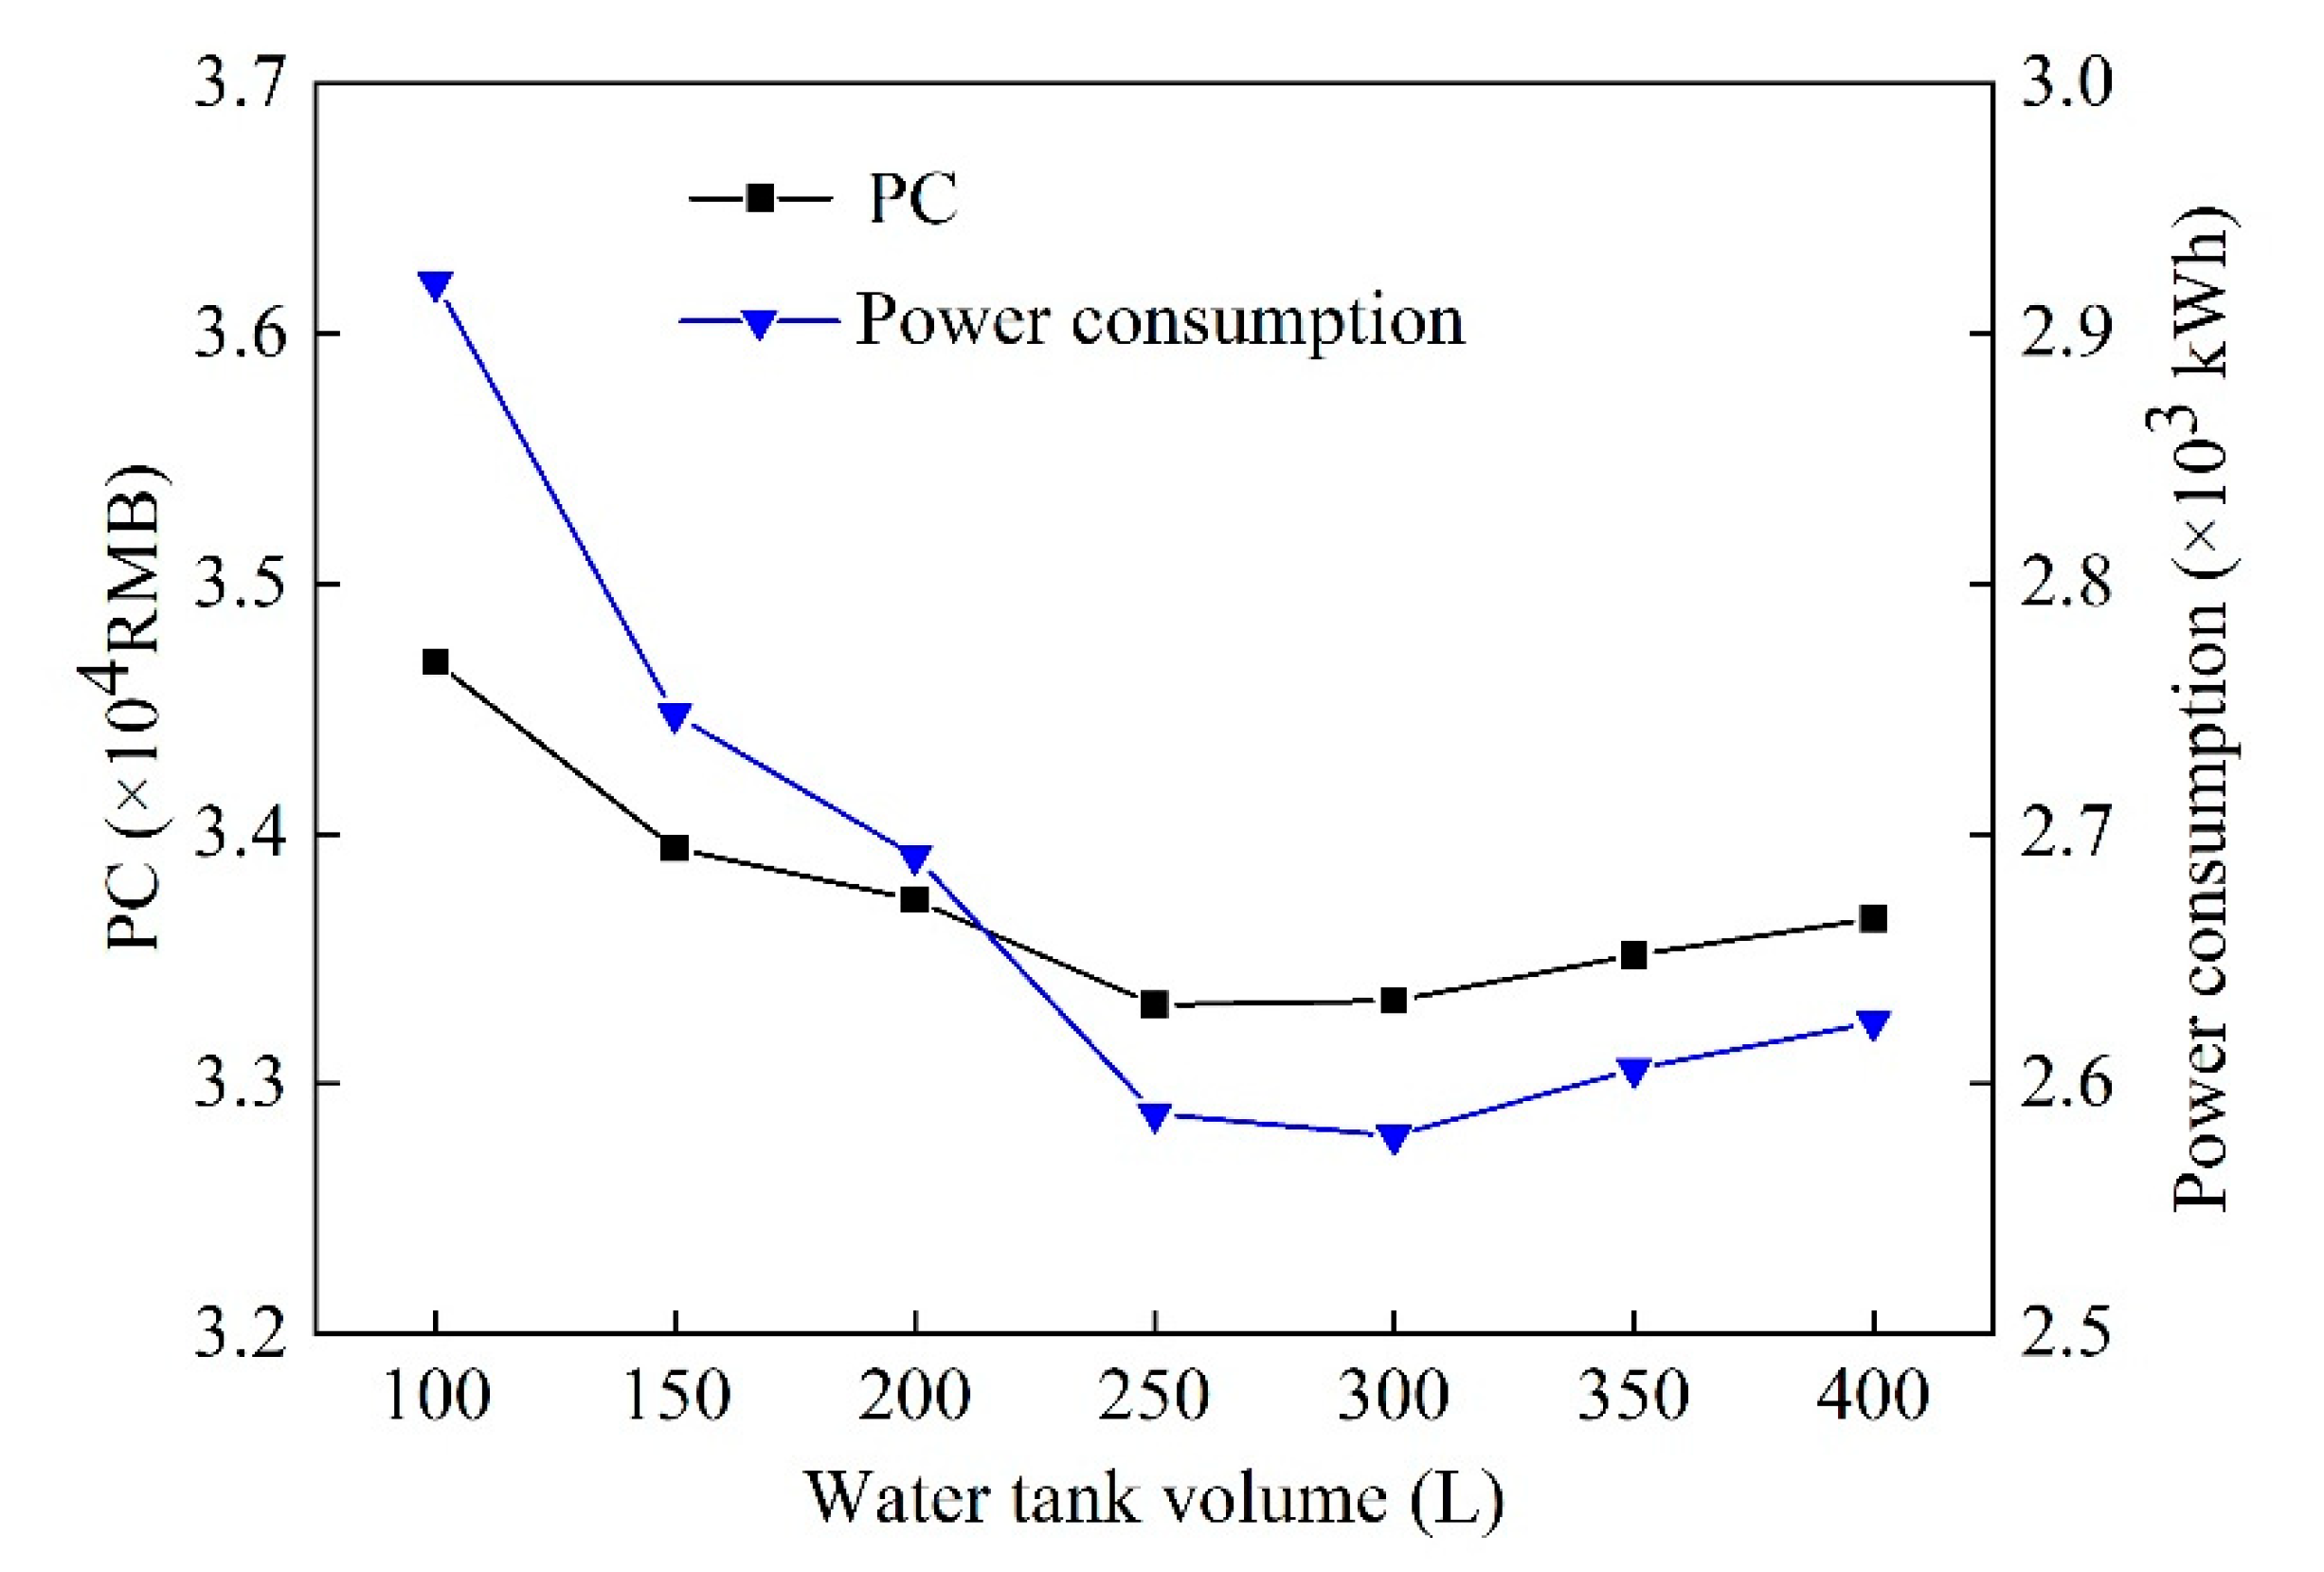
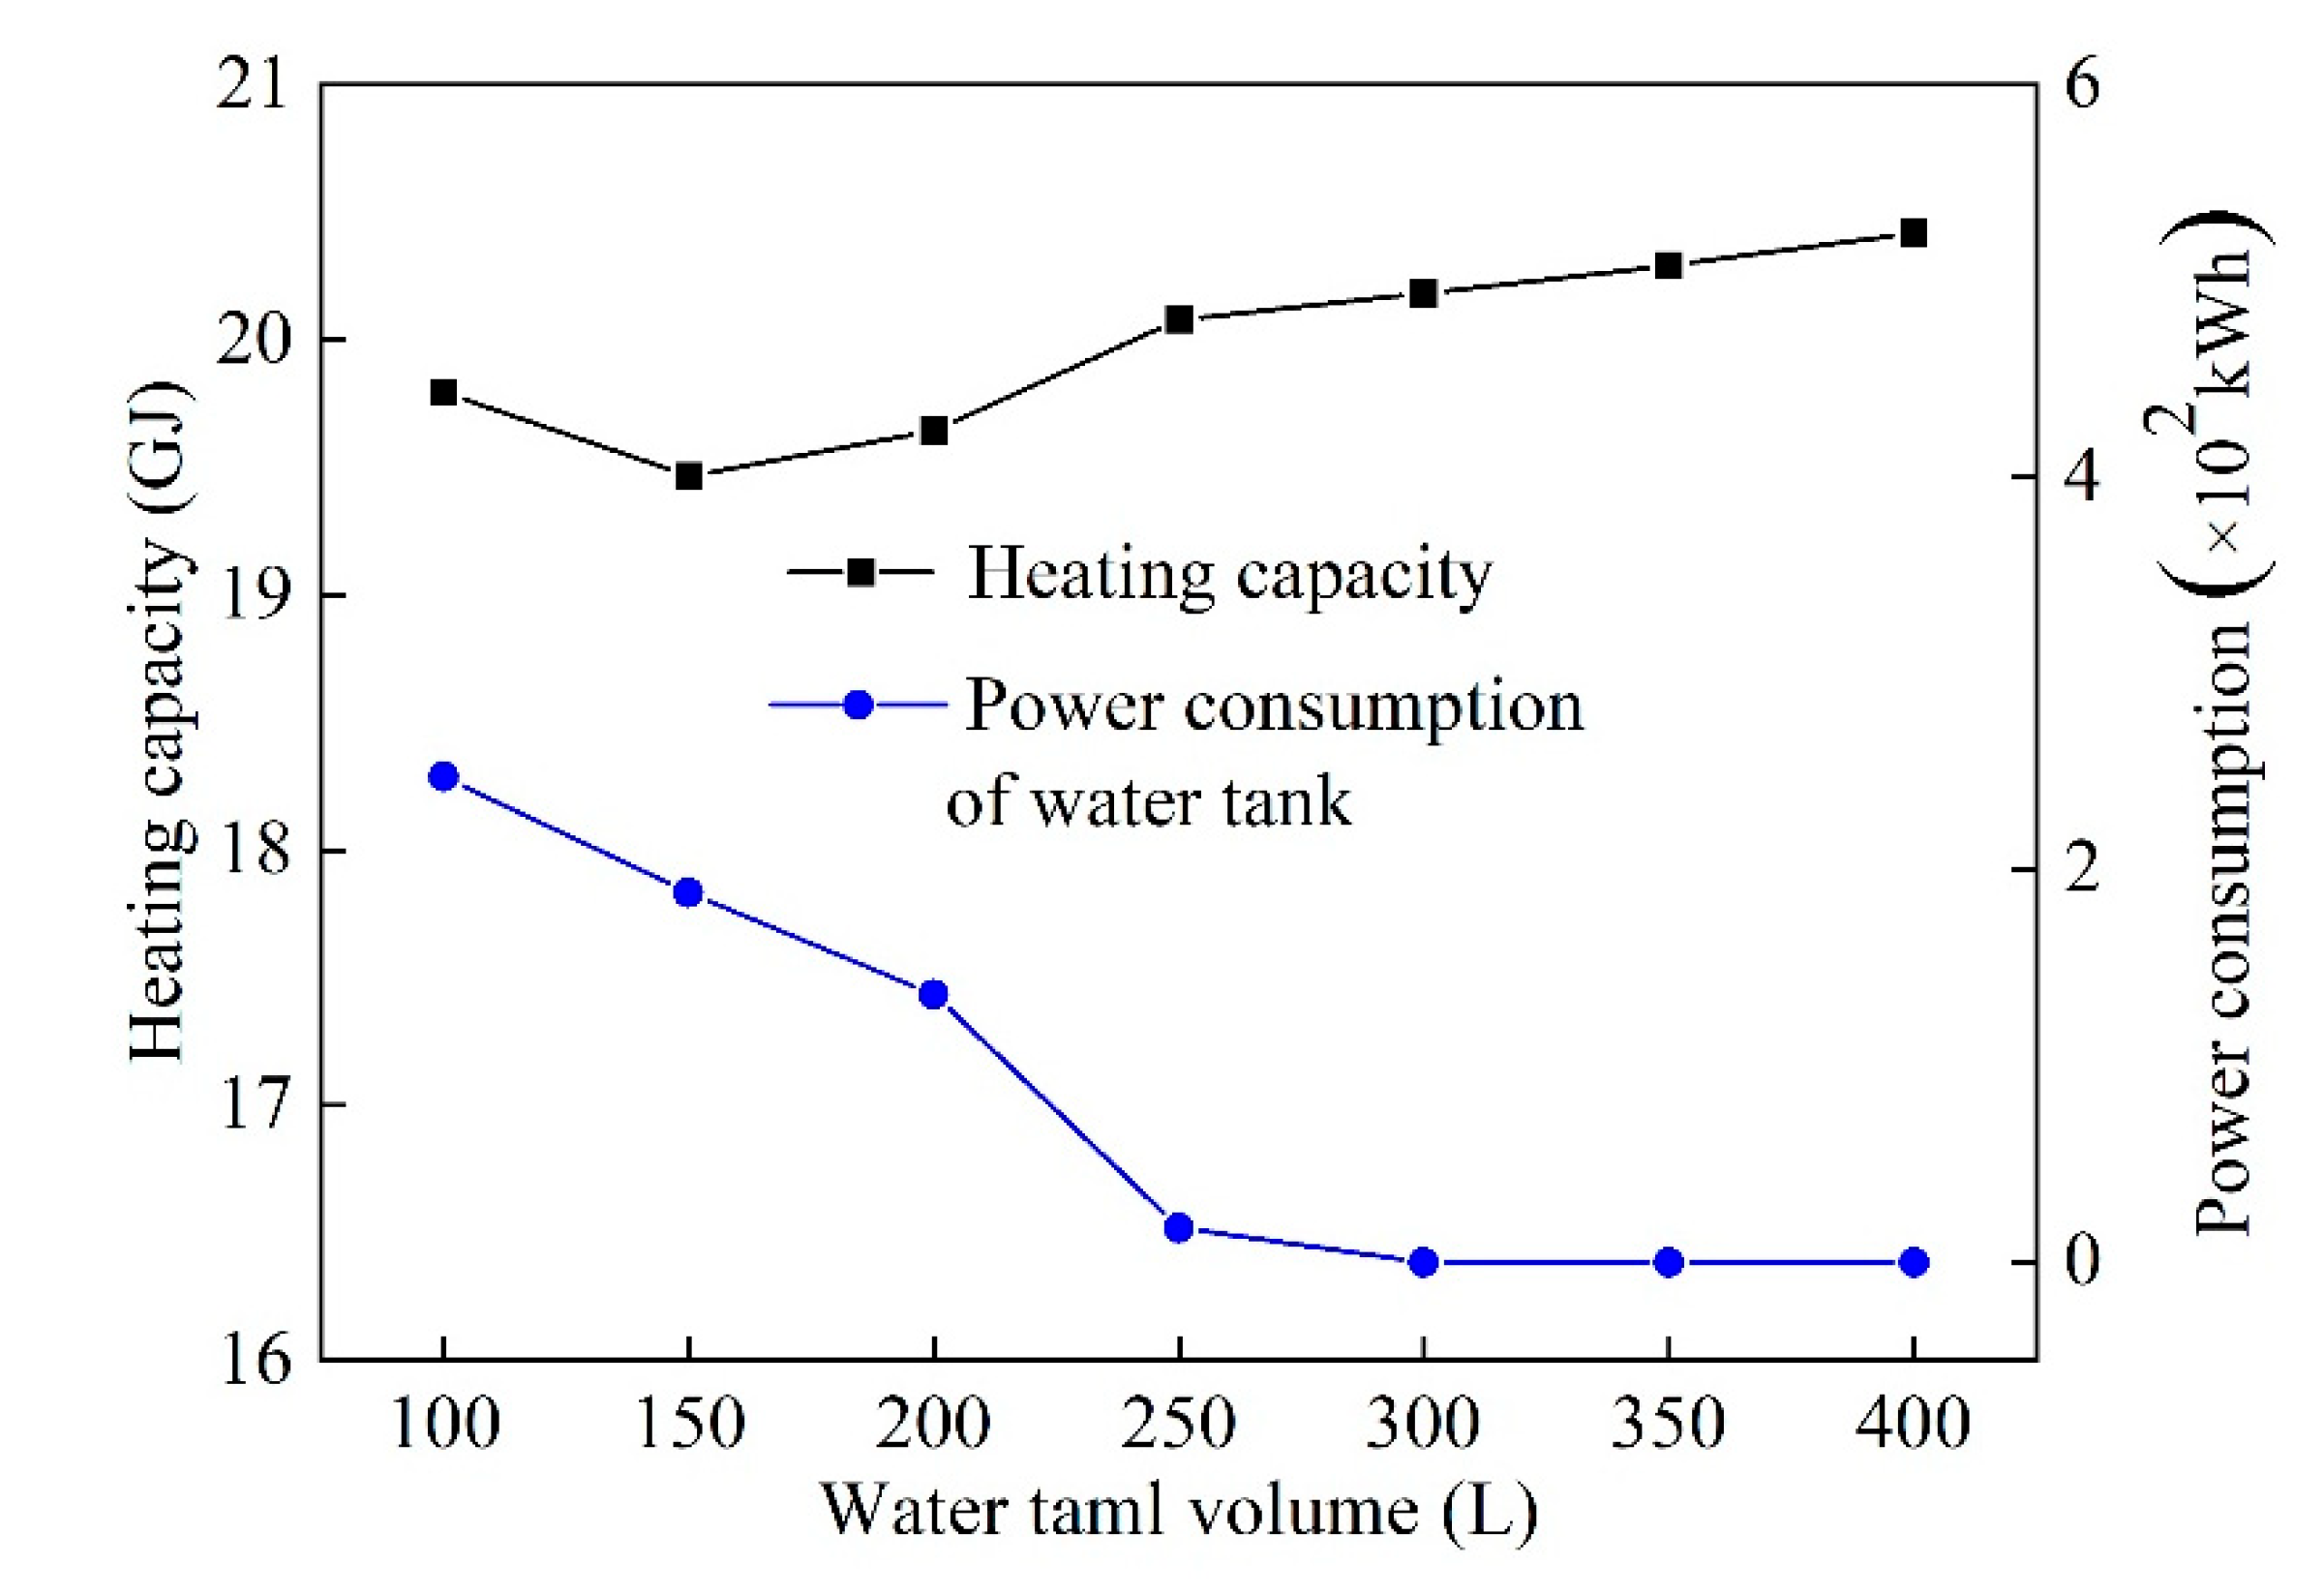
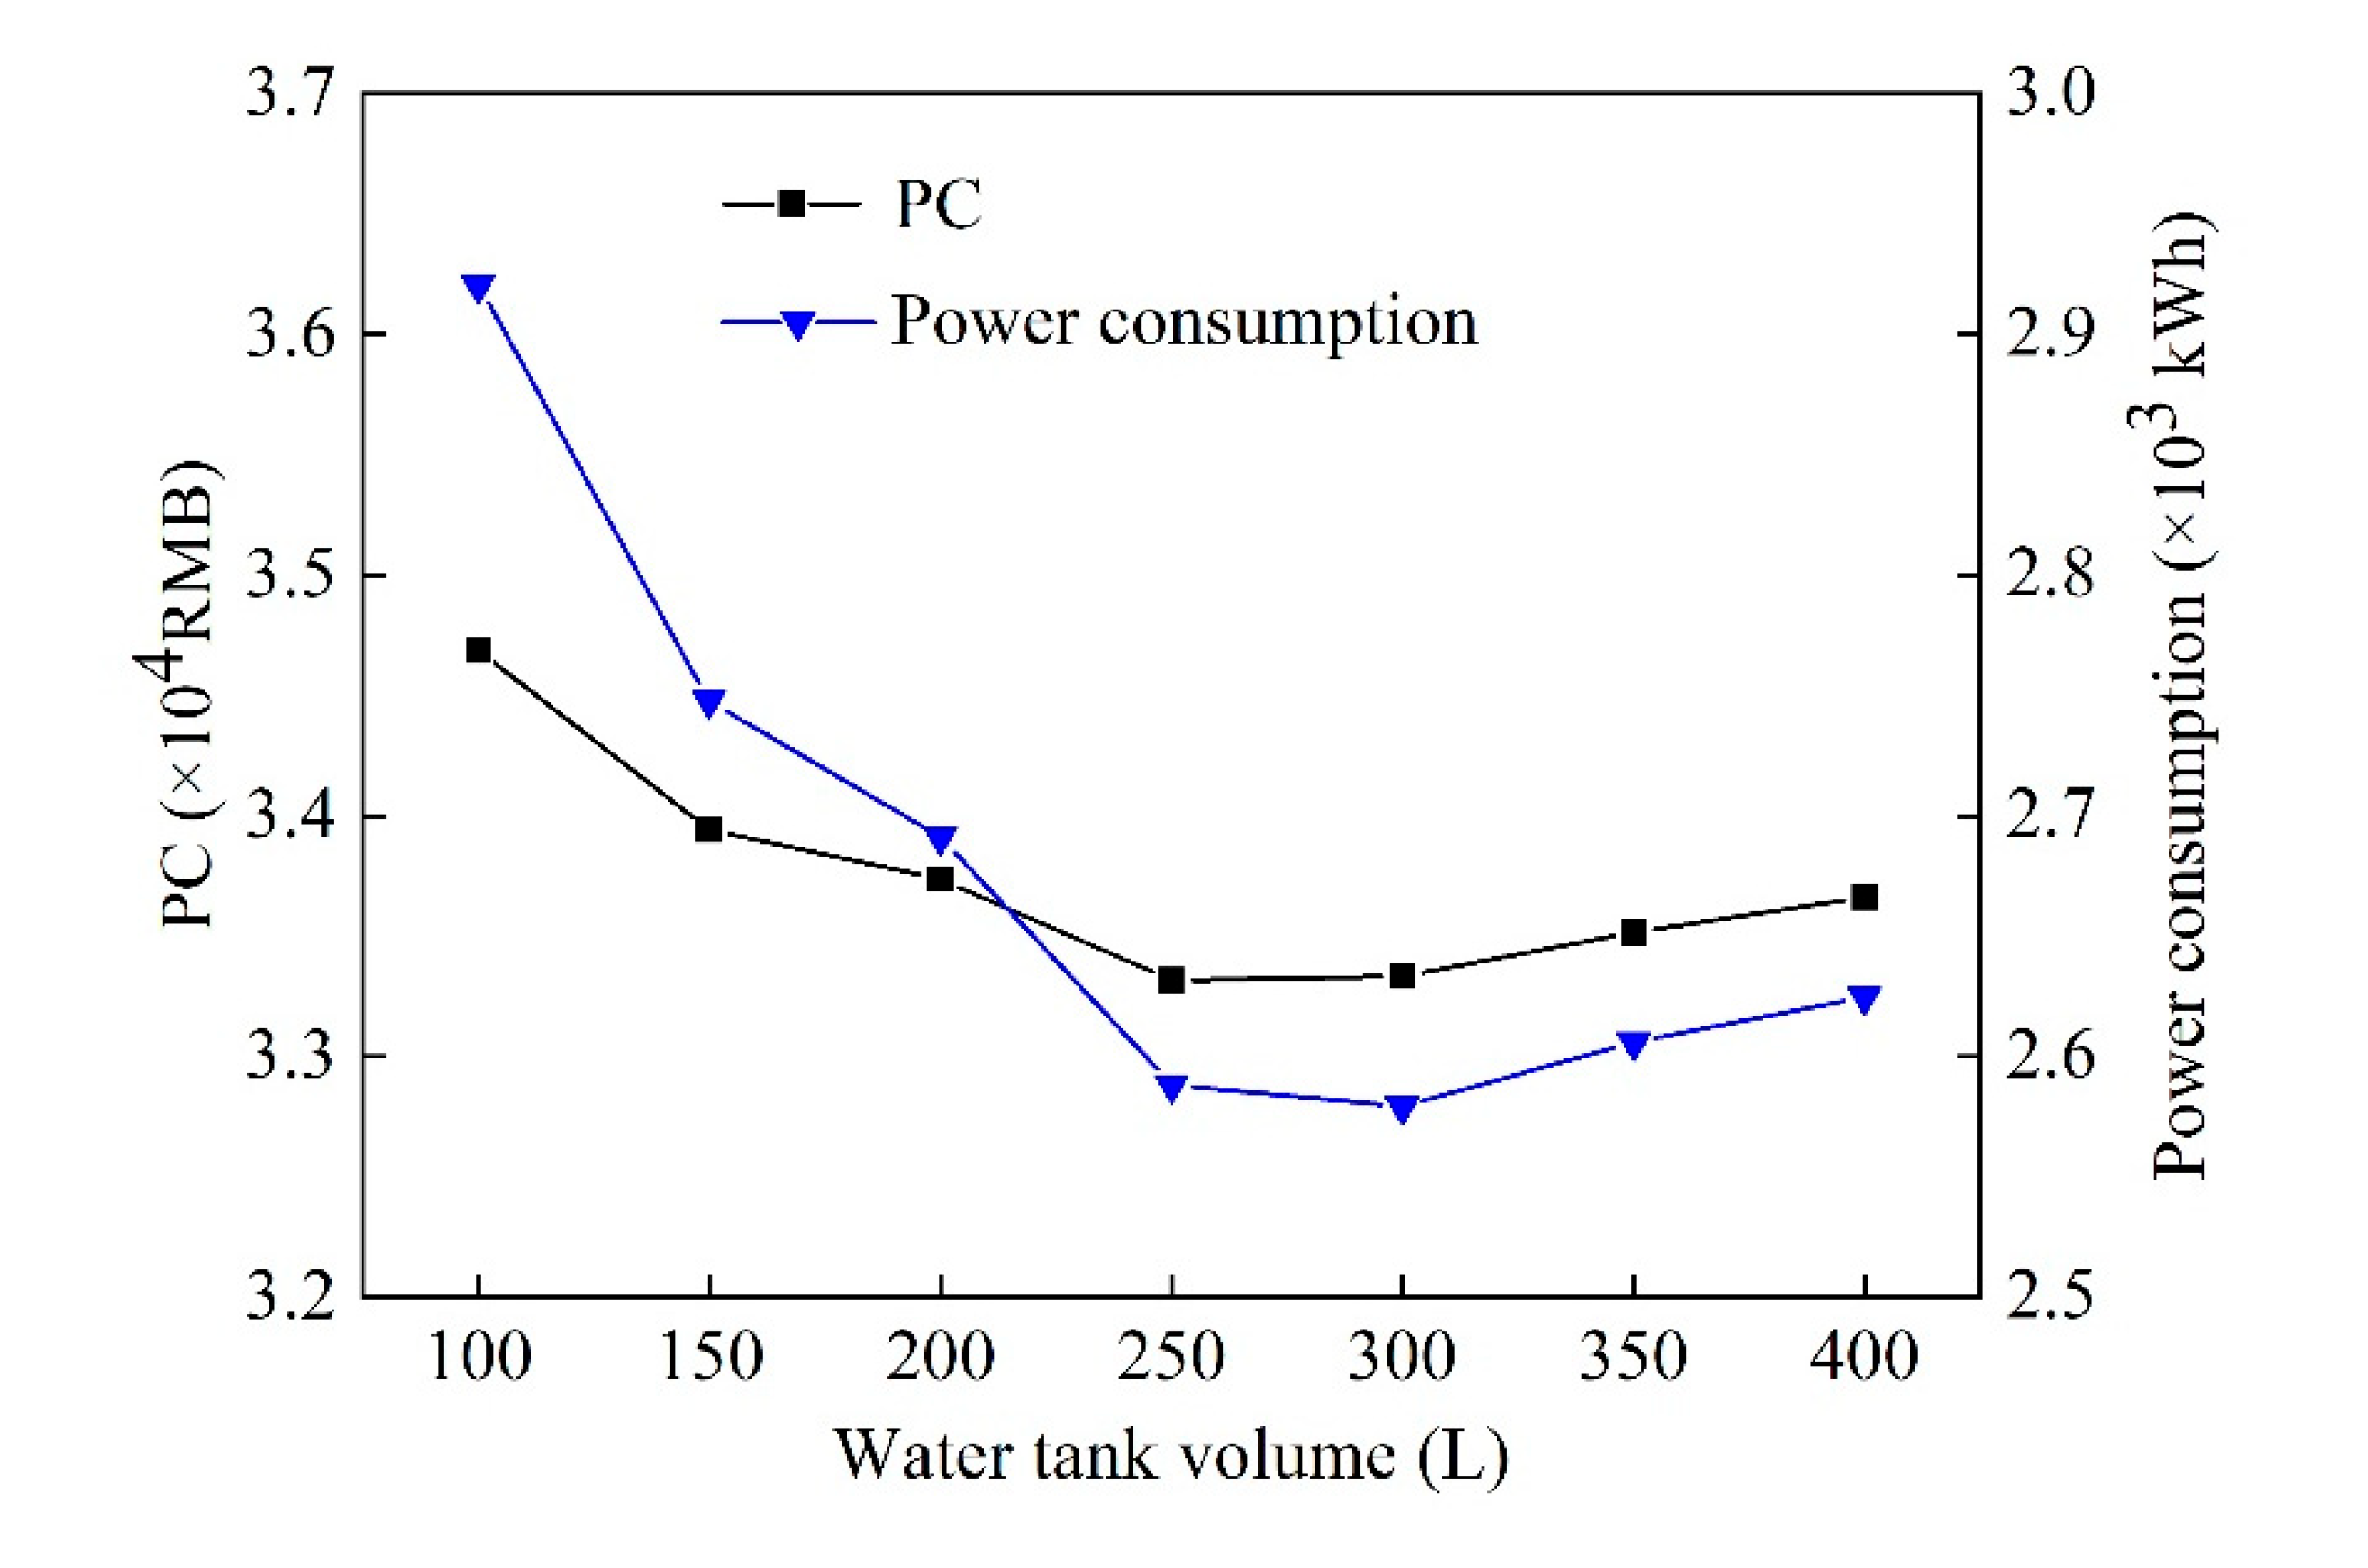
4.3. Effect of Water Tank Volume on the System Characteristics

The effect of the buffer water tank volume on the COP and heating capacity of the coupled heating system is represented in Figure 12 and Figure 13. With the increase of the buffer water tank volume, the COP of the coupled heating system increases first and then decreases, while the heating capacity of the heat pump shows the tendency of decreasing first and then increasing. The reason is that the heat pump still needs to start and stop frequently to meet the demand of the terminal when the water tank volume is too small, leading to the increase of the power consumption of the unit and the more water tanks electricity consumption resulting in the COP of the system is varying significantly lower. When the tank volume increases to more than 200 L, it can give full play to its buffer role so that the heating capacity and power consumption of the heat pump unit can be maintained at a stable level, while water tank’s electricity consumption is reduced. The system COP reaches the maximum value of 2.12 at this time that the volume is 250 L. However, in fact, the volume is not as big as possible, although the electricity consumption is reduced and the water temperature keeps stable with the large volume of the water tank, it increases the heat load of the system, which leads to the reduction of system COP.
As shown in Figure 14, the system power consumption decreases first and then increases slightly when the water tank volume increases, leading to the operating cost of the system decreasing first and then increasing. Additionally, the system initial investment increased gradually. However, the water tank cost accounts for a small proportion of the total initial investment amount, the cost present value of the coupled heating system shows a decreasing first and then a slow growth trend, getting a minimum with the volume is about 250 L.

4.4. System Optimization

According to the above research results, the weight of PCM, the phase change temperature, and the water tank volume have a significant impact on the COP of the system. In order to improve the system performance, three key parameters—the weight of PCM, phase change temperature of PCM, and the volume of the water tank—are employed. The optimization objective function is defined as LCC, and the system is optimized under the given cost constraint. LCC is mainly composed of three parts as follows:
L C C = C I + C O + C D
The LCC of the coupled heating system is set as the sum of initial investment cost and operating cost according to the characteristics of the system. Considering the impact of the increase of electricity charges and loan interest rate on initial investment and operating costs, the system LCC calculation formula is as follows:
f ( x ) = C o ( 1 + i ) m + P r i c e × W r + W 1 + W 2 × 1 ( 1 + i ) m 1 ( 1 + i )
where i is the annual interest rate of bank loans, 6.5%; Price is local electricity price, 0.56 RMB/kW·h; i is the average annual increase rate of electricity bills (approximately equal to the inflation rate of RMB), 3%; m is the service life of the system, 15 years.
Based on the TRNSYS platform, the optimization model of the system is established in this paper. The Hooke–Jeeves optimization algorithm is called by Genopt software, and TRNSYS and optimization software Genopt are connected through the TRNOPT module in the TRNSYS component library to optimize the key design parameters of the coupled heating system synchronously. The simulation optimization model of the coupled heating system is shown in the following Figure 15.

4.4.1. Optimization Algorithm Parameter Settings

To compare the performance before and after optimization, the system components are first designed with reference to specifications and related standards. The key design parameters of each component are shown in Table 3.
The optimization objective function of this system is the LCC of the coupled heating system. The water tank cost of the heating system is 1000 RMB/m3, the initial investment of ASHP is 2000 RMB/kW, the PCM cost is 10 RMB/kg, and the cost of water pumps and pipeline accessories is 2000 RMB. Comprehensively considering the electricity price in Xi’an area, the expression of the objective function is as follows:
f ( x ) = C o ( 1 + i ) m + P r i c e × W 1 + W 2 + W r × 1 ( 1 + i ) m 1 ( 1 + i ) = ( 2000 × 7 + 1000 v + 10 m + 2000 ) × ( 1 + i ) 15 +   0.56 × W 1 + W 2 + W r × 1 ( 1 + i ) 15 1 ( 1 + i )
According to the above research, three variables, such as the weight of PCM, phase change temperature of PCM, and the volume of the water tank, are selected as the influencing factors of system optimization research in this work. Table 4 shows the value range and step size of the optimized variable.

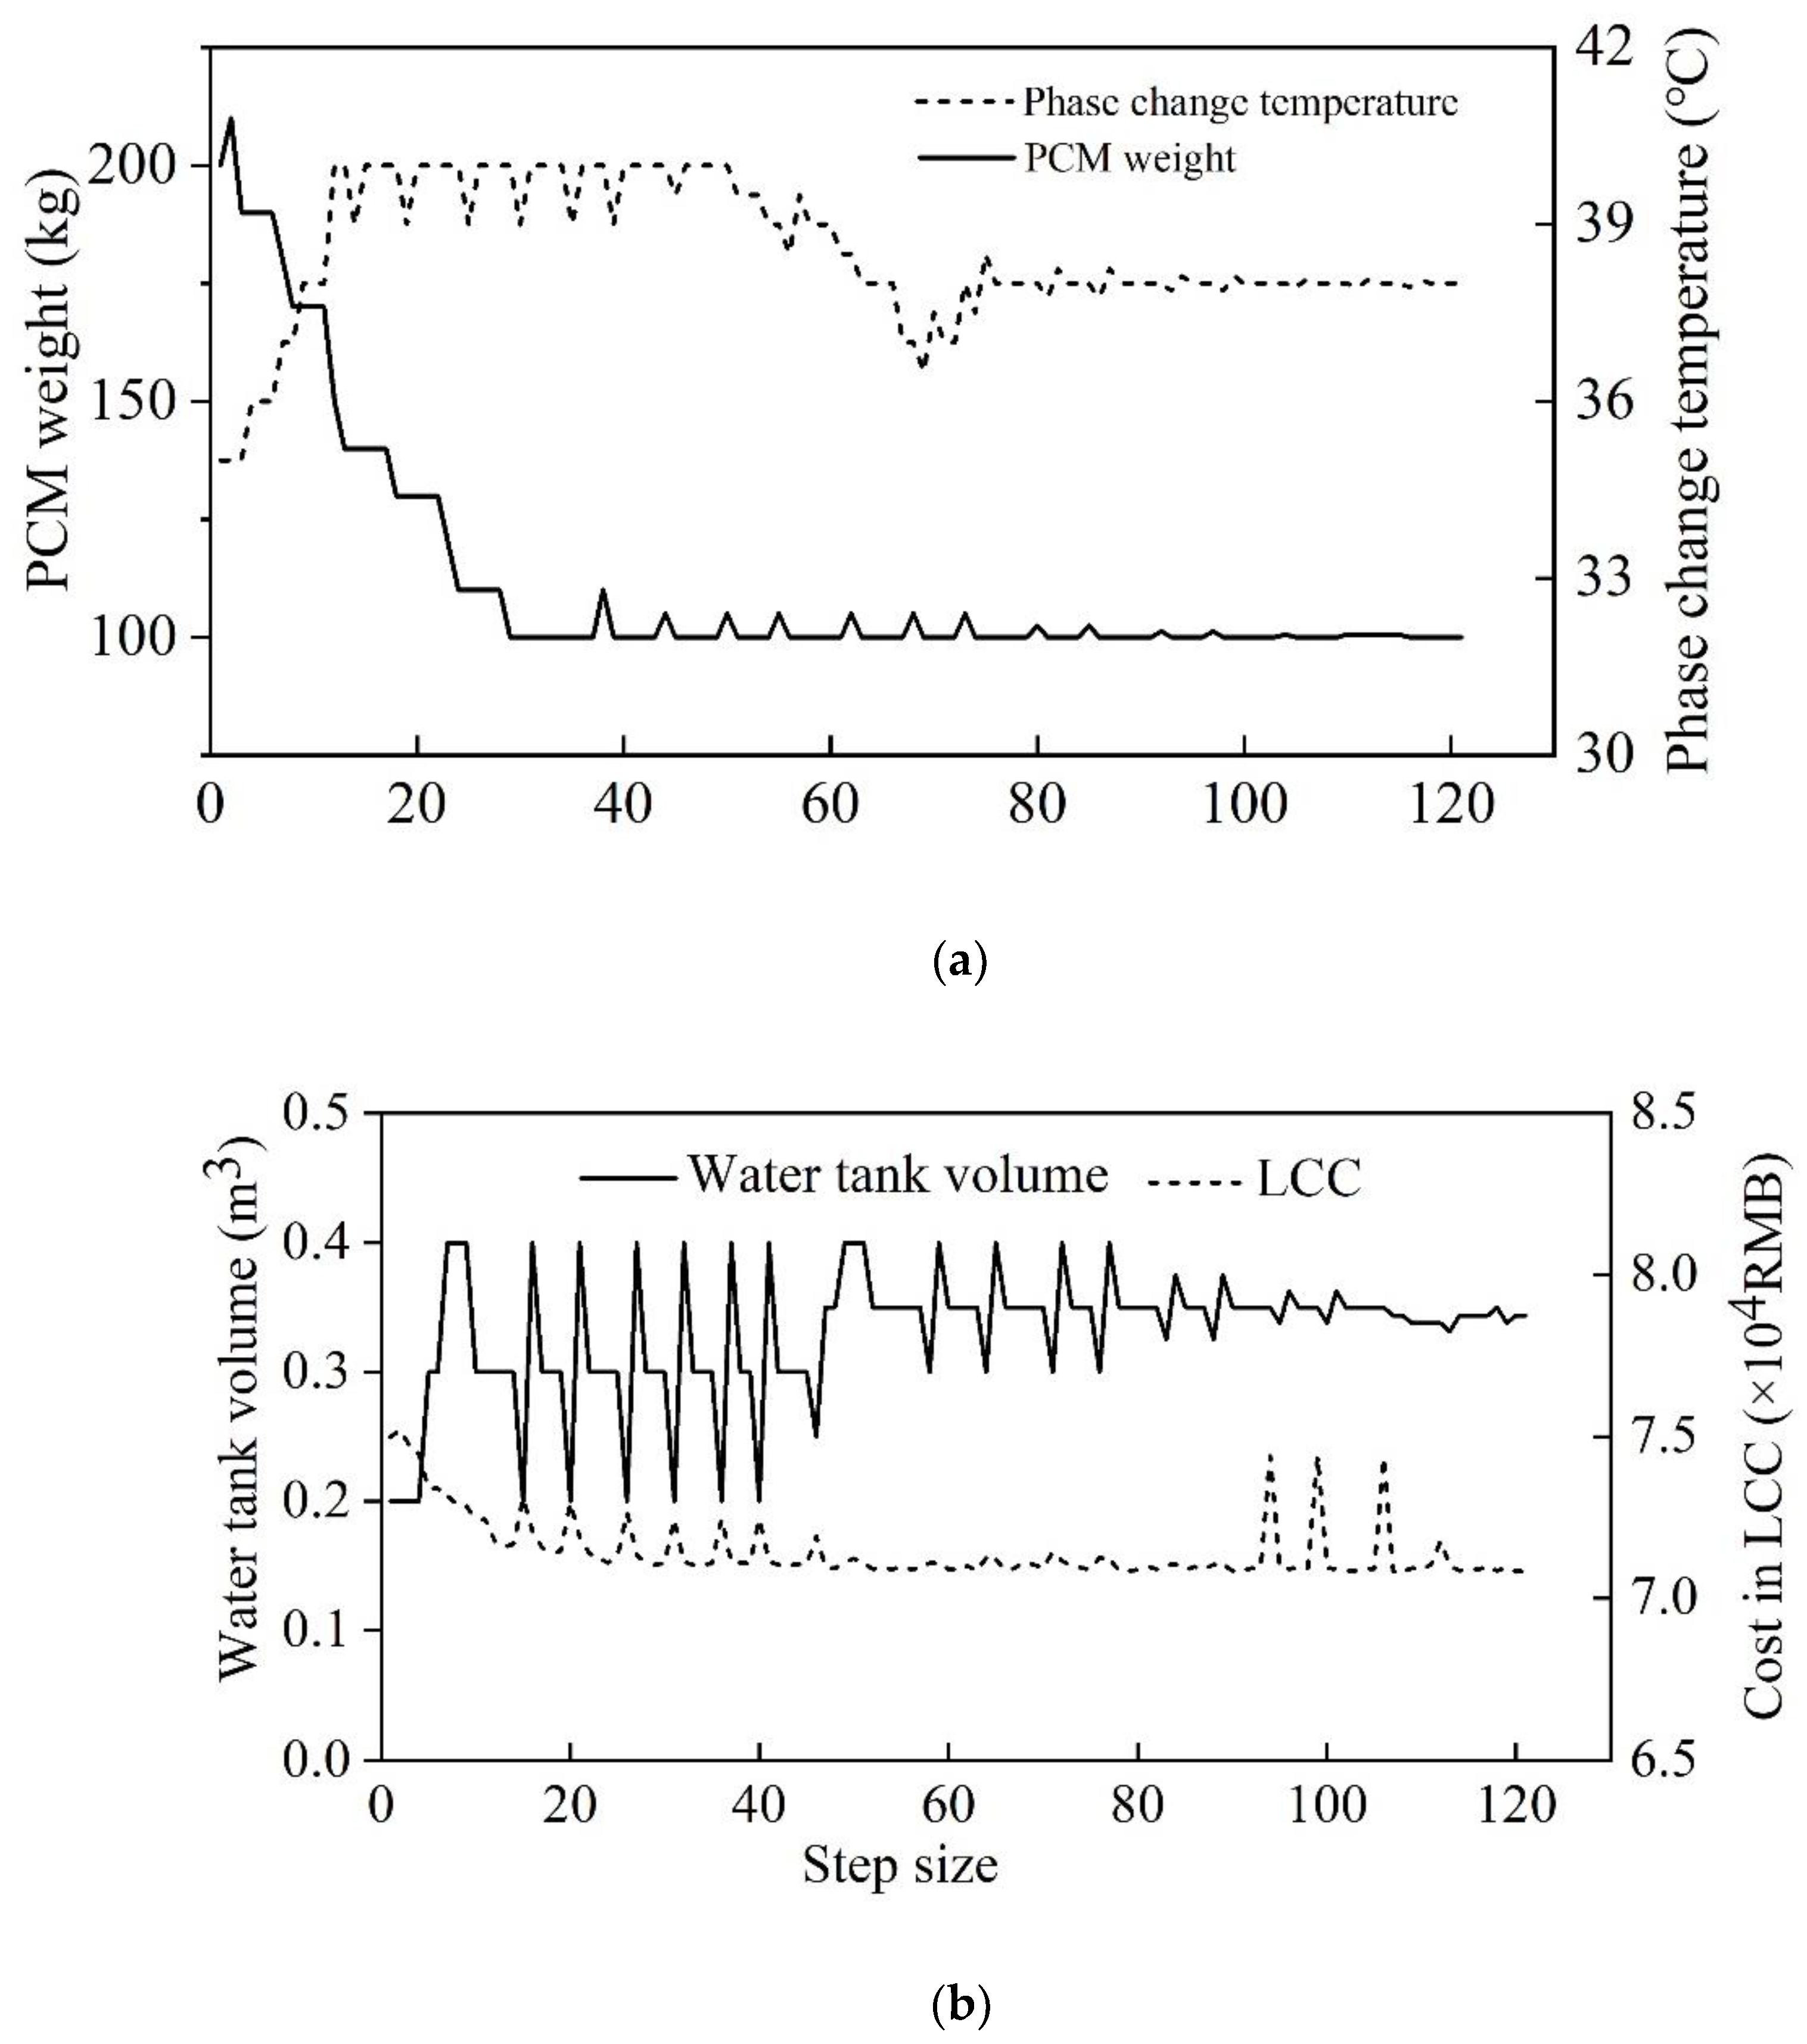
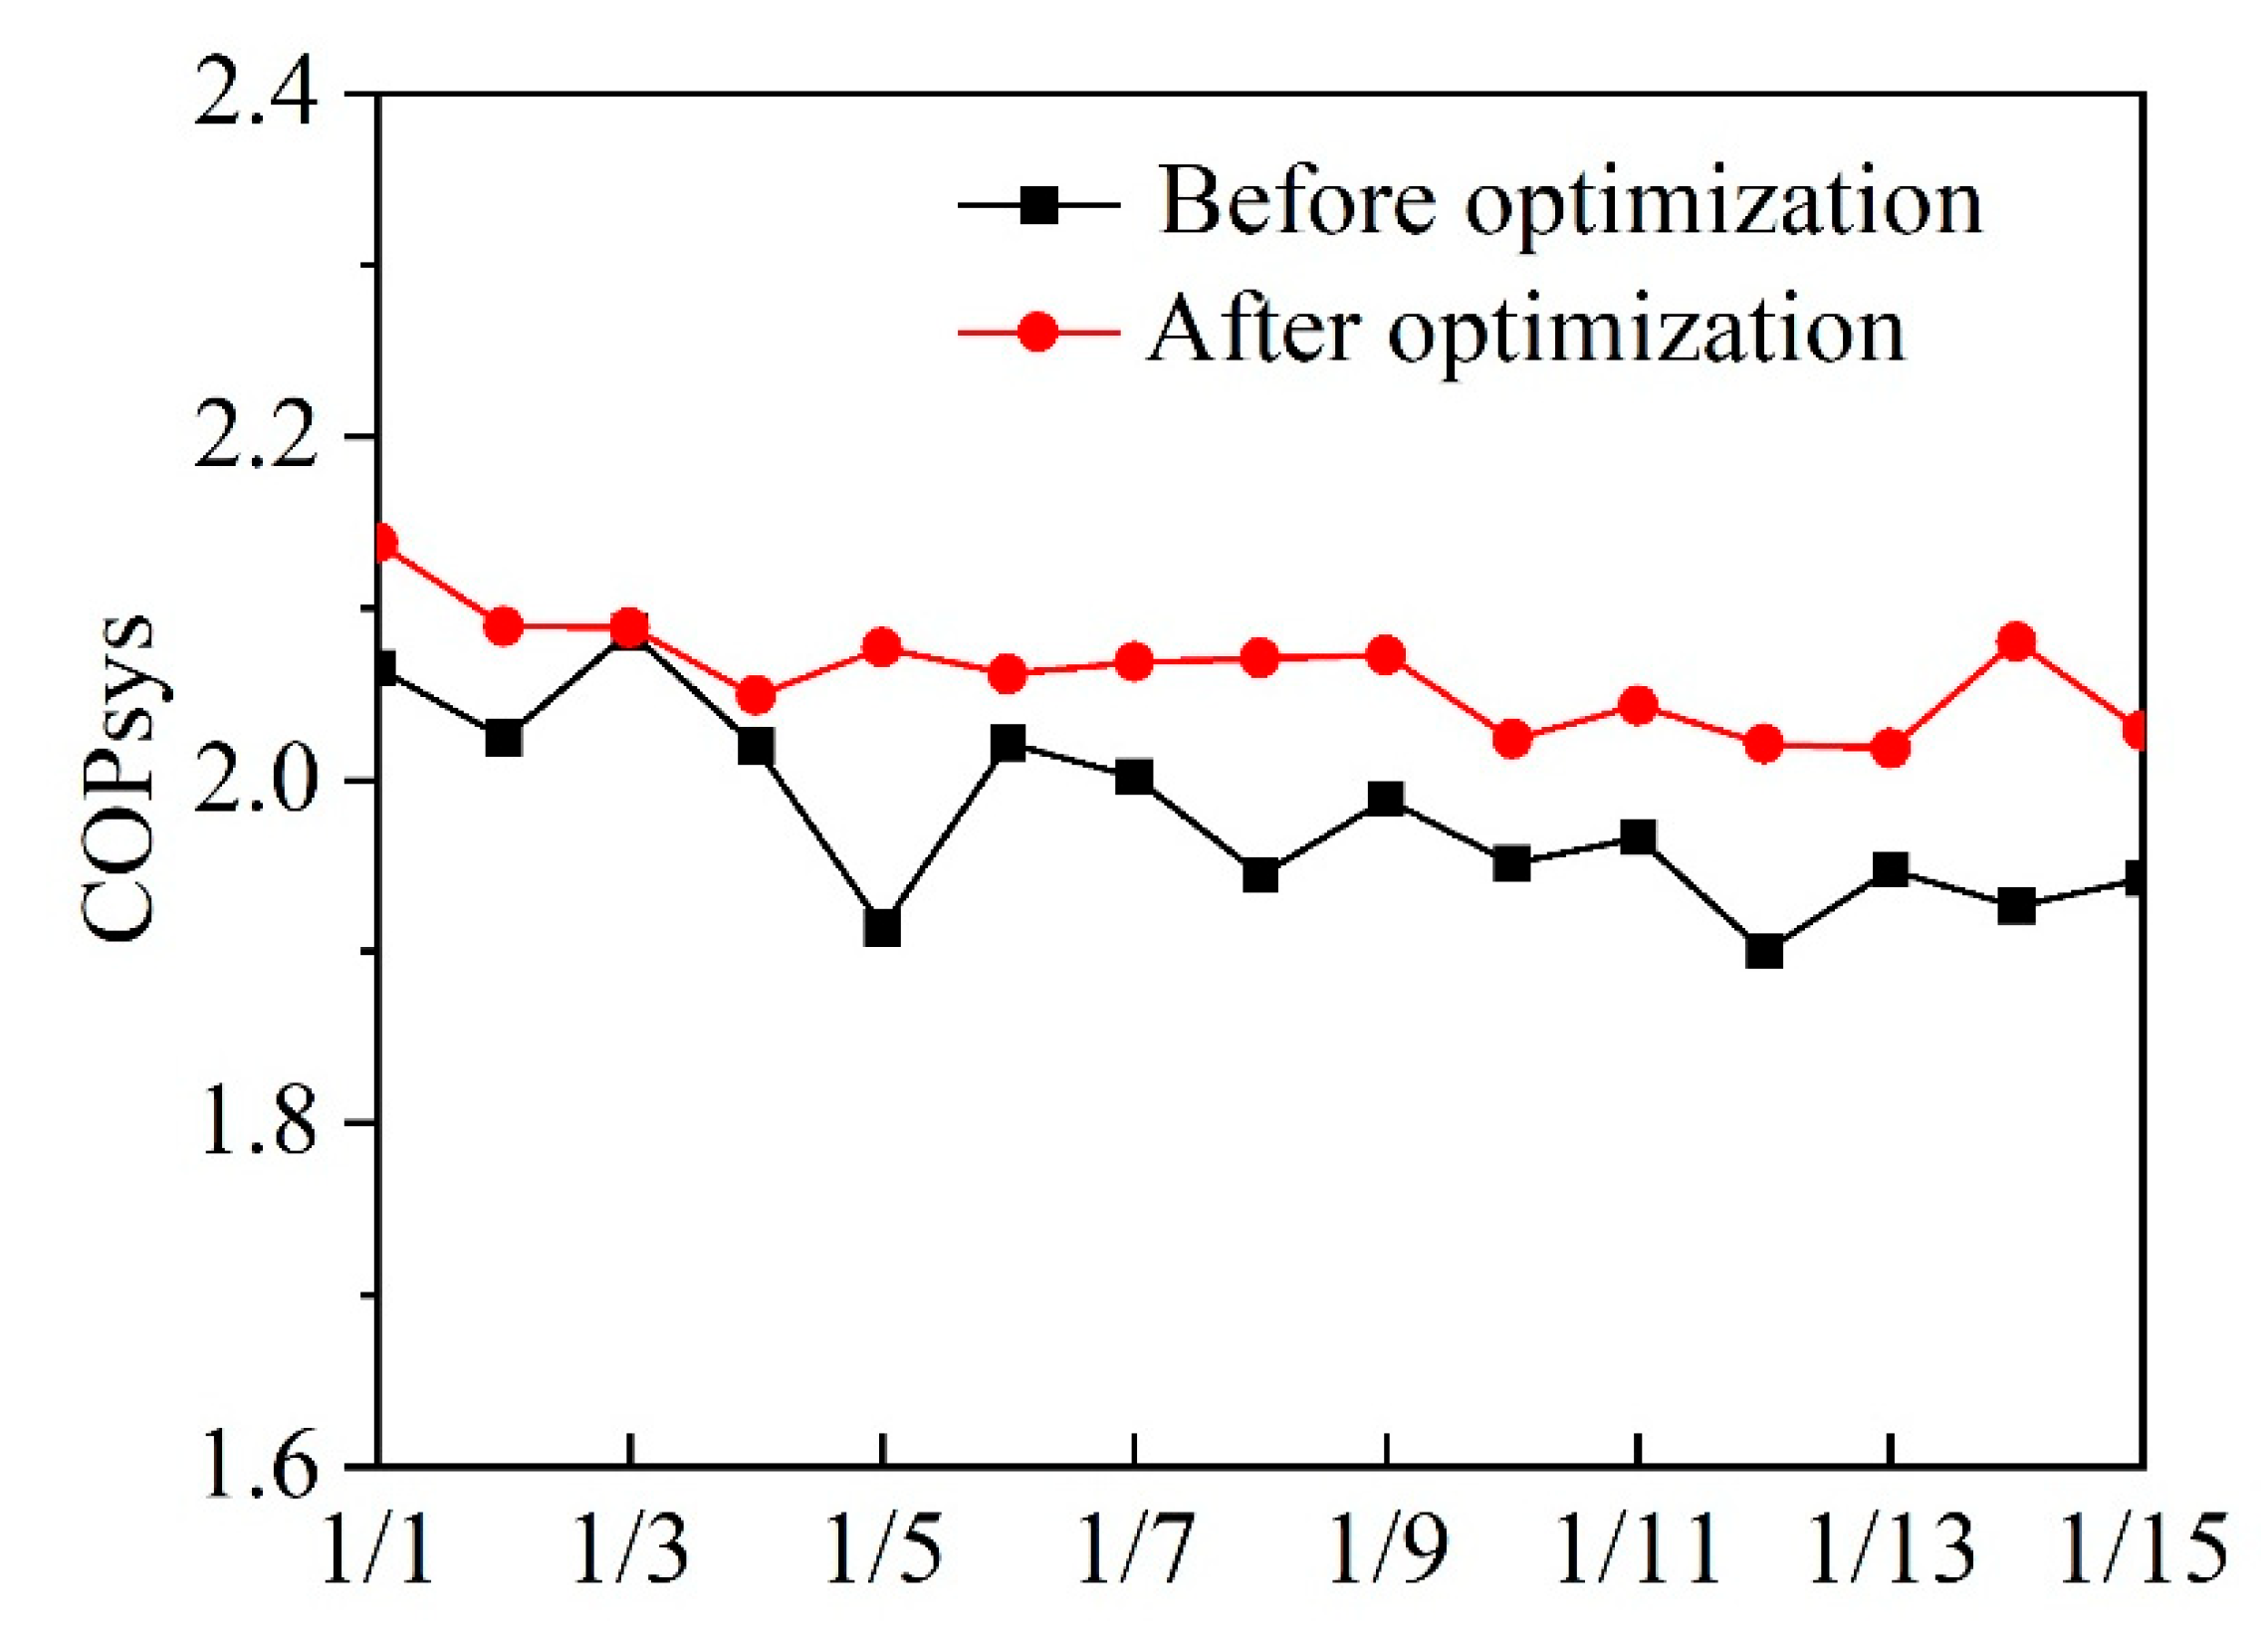
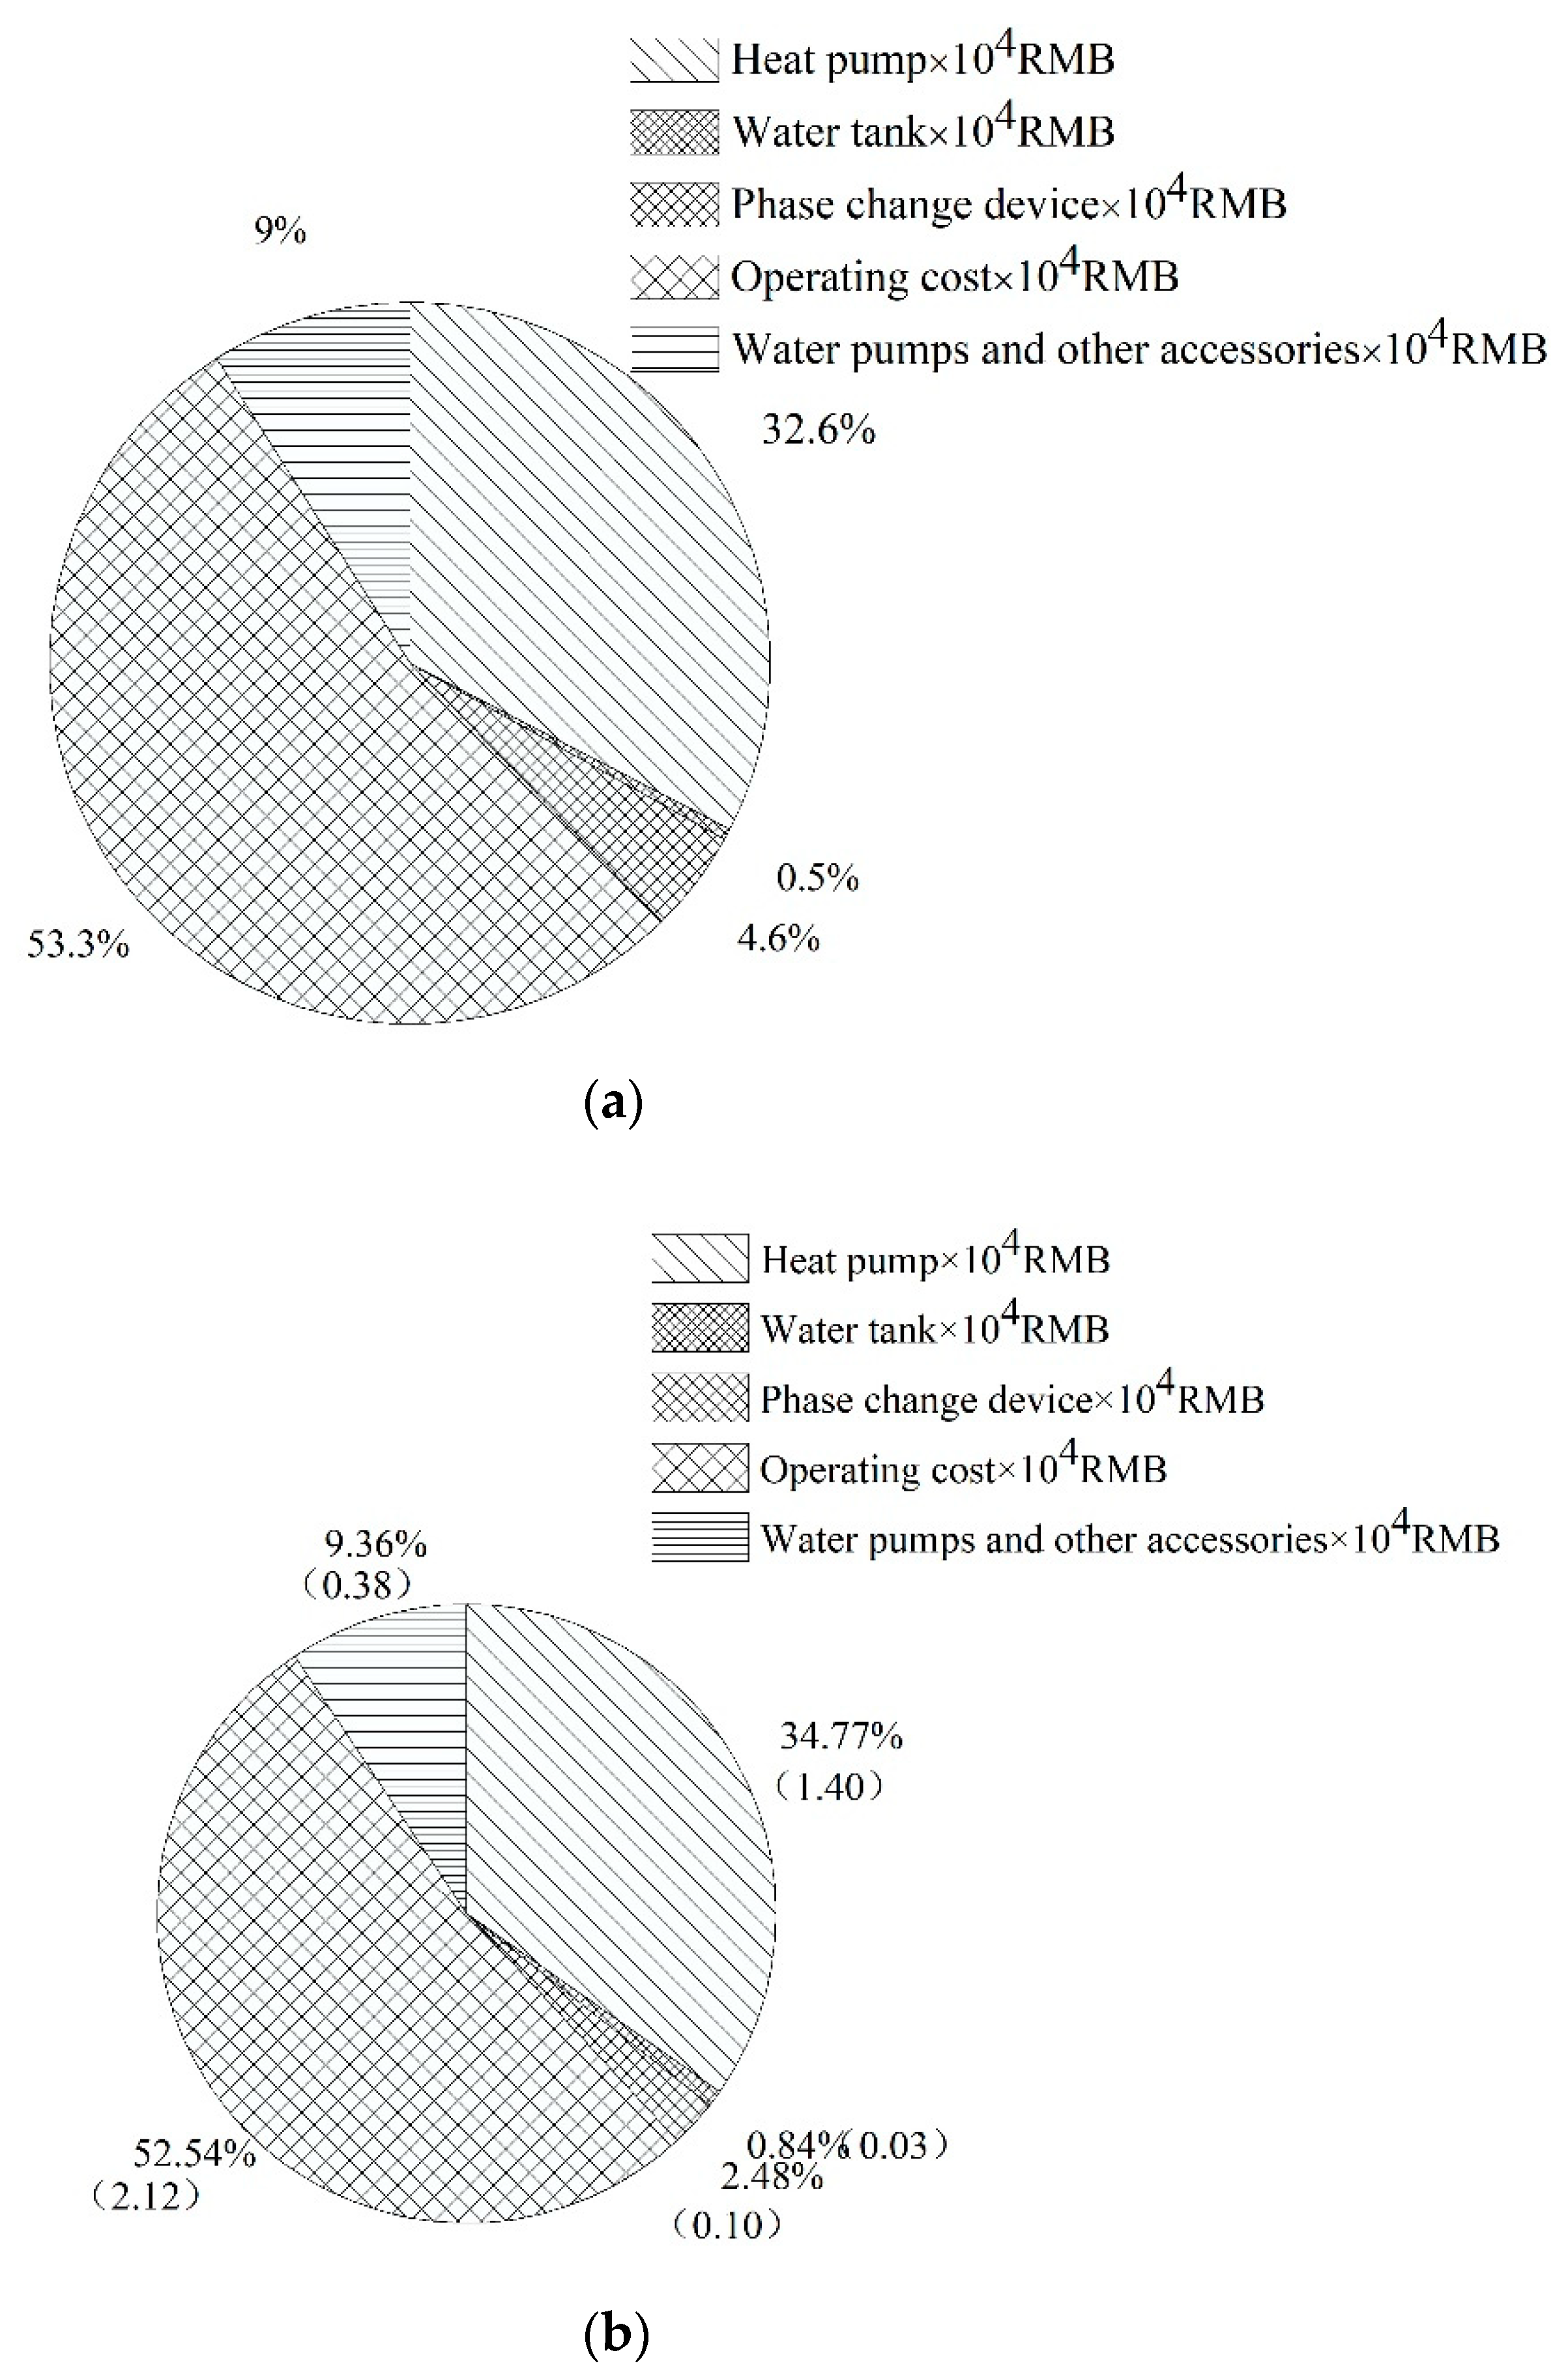
4.4.2. Optimization Results

Figure 16 shows the iterative process of each design parameter and the convergence result of the Hooke–Jeeves algorithm. It can be seen that each optimization variable is continuously transformed by the optimization algorithm to realize iterative calculation. The function value is carried out in the direction that is beneficial to the decline of the optimization target. The objective function value is calculated by 50 iterations, and the fluctuation is reduced compared with the initial stage, which indicates that the Hooke-Jeeves algorithm can achieve the optimization objective in the optimization model of the coupled heating system. After 100 iterative calculations, the objective function value is basically in a stable state with little fluctuation. When the final iteration reaches 121 times, the algorithm converges, indicating that the optimization results meet the accuracy requirements. At this time, the optimization objective function approaches the minimum value, and the system parameters are the optimal solution.
The optimization results show that when the weight optimization result of PCM is 100 kg, the phase change temperature optimization result is 38 °C, and the volume of the water tank is 0.34 m3, the whole life cycle cost of the system reaches the minimum. According to the optimal parameter combination obtained by this optimization, it can provide technical support for the design optimization of the coupled heating system in the actual project.
According to the optimization results of the coupled heating system, the key design parameters of the system before and after optimization are compared in Table 5.
To study the changes in system performance before and after optimization, the system average COP (COPsys) is used as the evaluation index to verify the accuracy of the optimization algorithm results. To find the influence of randomness of typical day selection on system evaluation results, the coupled heating system for 15 consecutive days from 1 January to 15 January is simulated and verified under typical low-temperature conditions in Xi’an. Figure 17 shows the change of system COPsys. The optimized COPsys is higher than that before optimization, which indicates that the performance of the optimized system is improved by synchronously optimizing the key design parameters of the system, and the optimization results are reliable. From Table 6, by analyzing the heating capacity and energy consumption in the whole heating period, the optimized COPsys has increased by 7.4% compared with that before optimization.
According to the optimization results of the model, the key influencing factors of the system are set as the optimal design parameter combination, and the cost of CO2 ASHP, the cost of water tank and accessories, the investment cost of each component of the system operating cost, and their proportion in the whole LCC of the coupled heating system before and after optimization are compared and analyzed, as shown in Figure 18. The results show that the water tank cost increases and the operating cost decrease after the optimization of the coupled heating system, which indicates that increasing the buffer water tank volume within a reasonable range is beneficial to improving the energy utilization rate, reducing the energy consumption, and thereby reducing the LCC.
In the figure, more than half of the system LCC before and after optimization is the system operating cost, which shows that the system operating cost accounts for a large proportion of the LCC, and the system operating cost is highly correlated with the local electricity price, that is, the local electricity price greatly influences the LCC and affects the best matching point of the system.

5. Conclusions

This paper put forward a transcritical CO2 ASHP coupled with TES for the heating system. The simulation of this system is finished by TRNSYS software, and the model is verified by experimental data. In addition, the effect of the main factors, such as the weight of PCMs, the phase change temperature of PCMs, and water tank volume, and the characteristics of the system are discussed. Additionally, the performance of the system is optimized, and its economic is analyzed by life cycle cost (LCC). The main findings from the results are indicated that with the increase of water tank volume, the initial investment of the system increases gradually, but the water tank cost accounts for a small proportion of the total initial investment. Therefore, the present value of system cost decreases first and then increases slowly and reaches the minimum value when the volume of the water tank is about 250 L. In addition, when the PCM weight is 100 kg, the phase change temperature is 38 °C, and the water tank volume is 0.34 m3, the LCC of the system is the smallest. Compared with the system before optimization, the cost of the optimized system increased, the annual operating cost of the system decreased, and the COPsys increased by 7.4%.

Author Contributions

Formal analysis, K.X.; Investigation, G.L.; Methodology, Z.W.; Supervision, F.W.; Writing–original draft, Y.Z. All authors have read and agreed to the published version of the manuscript.

Funding

The work was supported by the Fundamental Research Funds for the Central Universities of China (No. JZB2015065) and Xi’an Municipal Science and Technology Foundation (No. 21XJZZ0038).

Institutional Review Board Statement

Not applicable.

Informed Consent Statement

Not applicable.

Data Availability Statement

Not applicable.

Conflicts of Interest

The authors declare no conflict of interest.

Nomenclature

AHeat exchange area, (m2);
A c Heat exchange area of inner tube, (m2);
A max Maximum area of PCM, (m2);
A o Outer surface area of inner tube, (m2);
C o Initial investment of the system, (RMB);
C p Specific heat capacity of water at constant pressure, (kJ/(kg·°C));
CDWaste disposal costs, (RMB);
CIInitial investment of the system, (RMB);
COOperation and maintenance costs, (RMB);
C O P * Corrected COP of ASHP;
C O P A H P Coefficient of performance of ASHP;
C O P rated The COP under the rated conditions
L Micro segment length, (m);
Q * Corrected heating capacity of ASHP, (kW);
Q A H P Heating capacity of ASHP, (kW);
Q rated Heating capacity of ASHP under the rated condition (kW);
RChanging radius of the PCM during phase change, (m);
RHTFHeat transfer resistance between thermal fluid and wall, (m2·K·W−1);
RmaxRadius of PCM when point of intersection with neighboring phase change front, (m);
RPCMHeat transfer resistance between PCM (m2 ·K·W−1)
R T Total heat resistance of heat exchanger, (K/W);
RWALLHeat conduction resistance of tube wall (K/W);
R i Inner radius of casing, (m);
R o Outer radius of casing, (m);
SShape coefficient of phase change material in heat exchanger;
T c Simulation value of heat exchange outlet water temperature, (°C);
T e Experimental value of heat exchange outlet water temperature, (°C);
V s Volume of water tank, (m3);
V w Water storage tank volume, (m3);
W 1 Energy consumption of water pump, ([kW);
W 2 Energy consumption of auxiliary electric heating of the system, (kW);
W r Energy power consumption of the CO2 ASHP, (kW);
d i Inner diameter of inner tube of heat exchanger, (m);
h f Heat transfer coefficient between heat source fluid and inner wall of heat exchanger, (W·m−2);
i The bench discount rate, (%);
i The average annual increase rate of electricity bills;
kOverall heat-transfer coefficient, (W/(m2·K));
m · Flow rate of heat exchange fluid, (kg·s−1);
nn = 0.4 for heating;
m s Mass of PCM, (kg);
t Time, (s);
t d b Outdoor dry bulb temperature, (°C);
t w Inlet water temperature of gas cooler, (°C);
λ f Thermal conductivity of fluid, (W·(m·K)−1);
λ W Wall thermal conductivity, (W·m−1);
λ P C M PCM thermal conductivity, (W·m−1);
μ f Hydrodynamic viscosity, (kg·(m·s)−1);
N u Nusselt number;
ASHPAir source heat pump
ECThe electricity cost
EEVElectronic expansion valves
GWPGlobal warming potential
HRMHeat release mode
HSMHeat storage mode
IHXInternal heat exchange
LCThe labor cost
LCCLife cycle cost
NTUNumber of transfer units
OTCThe annual operating cost
ODPOzone depletion potential
P2The water pump
PCMPhase change material
RCThe maintenance cost
TESThermal energy storage
Subscript
Sys System

References

  1. Sartori, T.; Calmon, J.L. Analysis of the impacts of retrofit actions on the life cycle energy consumption of typical neighbourhood dwellings. J. Build. Eng. 2019, 21, 158–172. [Google Scholar] [CrossRef]
  2. Song, M.; Mao, N.; Xu, Y.; Deng, S. Challenges in, and the development of, building energy saving techniques, illustrated with the example of an air source heat pump. Therm. Sci. Eng. Prog. 2019, 10, 337–356. [Google Scholar] [CrossRef]
  3. Song, M.; Xie, G.; Pekař, L.; Mao, N.; Qu, M. A modeling study on the revere cycle defrosting of an air source heat pump with the melted frost downwards flowing away and local drainage. Energy Build. 2020, 226, 110257. [Google Scholar] [CrossRef]
  4. Li, Y.; Rezgui, Y.; Zhu, H. District heating and cooling optimization and enhancement—Towards integration of renewables, storage and smart grid. Renew. Sustain. Energy Rev. 2017, 72, 281–294. [Google Scholar] [CrossRef]
  5. Zhang, L.; Jiang, Y.; Dong, J.; Yao, Y. Advances in vapor compression air source heat pump system in cold regions: A review. Renew. Sustain. Energy Rev. 2018, 81, 353–365. [Google Scholar] [CrossRef]
  6. Wang, Z.; Zhang, Y.; Wang, F.; Li, G. Research on the characteristics of CO2 heat pump integrated with thermal energy storage for space heating. J. Mech. Sci. Technol. 2021, 35, 2259–2270. [Google Scholar] [CrossRef]
  7. Ma, R.; Mao, C.; Shan, M.; Zhang, L.; Yang, X. Occupant control patterns of low temperature air-to-air heat pumps in Chinese rural households based on field measurements. Energy Build. 2017, 154, 157–165. [Google Scholar] [CrossRef]
  8. Wang, Z.; Li, G.; Wang, F. Techno-economic evaluation of a frost-free air source heat pump water heater. Sustain. Cities Soc. 2020, 57, 102102. [Google Scholar] [CrossRef]
  9. Wang, Z.; Li, G.; Wang, F.; Liu, Z.; Wang, M. Performance analysis and operation optimization of air-to-water CO2 heat pump with phase change thermal storage. Energy Build. 2020, 209, 109738. [Google Scholar] [CrossRef]
  10. Song, M.; Dang, C. Review on the measurement and calculation of frost characteristics. Int. J. Heat Mass Transf. 2018, 124, 586–614. [Google Scholar] [CrossRef]
  11. Song, M.; Mao, N. Experimental study on the melted frost influence on the metal energy storage during an air source heat pump defrosting. Energy Build. 2020, 214, 109809. [Google Scholar] [CrossRef]
  12. Ma, Y.; Liu, Z.; Tian, H. A review of transcritical carbon dioxide heat pump and refrigeration cycles. Energy 2013, 55, 156–172. [Google Scholar] [CrossRef]
  13. ASHRAE. 15 & 34 Safety Standard for Refrigeration Systems and Designation and Classification of Refrigerants ISO 5149 Mechanical Refrigerating Systems Used for Cooling and Heating—Safety Requirements. Available online: https://www.ashrae.org/technical-resources/bookstore/standards-15-34 (accessed on 17 October 2018).
  14. Wang, Z.; Li, G.; Wang, F.; Zhang, Y. Performance investigation of a transcritical CO2 heat pump combined with the terminal of radiator and floor radiant coil for space heating in different climates, China. J. Build. Eng. 2021, 44, 102927. [Google Scholar] [CrossRef]
  15. Kim, M.-H.; Pettersen, J.; Bullard, C.W. Fundamental process and system design issues in CO2 vapor compression systems. Prog. Energy Combust. Sci. 2004, 30, 119–174. [Google Scholar] [CrossRef]
  16. Yu, B.; Yang, J.; Wang, D.; Shi, J.; Chen, J. An updated review of recent advances on modified technologies in transcritical CO2 refrigeration cycle. Energy 2019, 189, 116147. [Google Scholar] [CrossRef]
  17. Lorentzen, G. Trans-Critical Vapour Compression Cycle Device. Patent WO/ 07683, 12 July 1990. [Google Scholar]
  18. Riffat, S.B.; Afonso, C.F.; Oliveira, A.C.; Reay, D.A. Natural refrigerants for refrigeration and air-conditioning systems. Appl. Therm. Eng. 1997, 17, 33–42. [Google Scholar] [CrossRef]
  19. Yang, D.; Song, Y.; Cao, F.; Jin, L.; Wang, X. Theoretical and experimental investigation of a combined R134a and transcritical CO2 heat pump for space heating. Int. J. Refrig. 2016, 72, 156–170. [Google Scholar] [CrossRef]
  20. Austin, B.T.; Sumathy, K. Transcritical carbon dioxide heat pump systems: A review. Renew. Sustain. Energy Rev. 2011, 15, 4013–4029. [Google Scholar] [CrossRef]
  21. Jiang, Y.; Ma, Y.; Li, M.; Fu, L. An experimental study of trans-critical CO2 water–water heat pump using compact tube-in-tube heat exchangers. Energy Convers. Manag. 2013, 76, 92–100. [Google Scholar] [CrossRef]
  22. Qin, X.; Wang, D.; Jin, Z.; Wang, J.; Zhang, G.; Li, H. A comprehensive investigation on the effect of internal heat exchanger based on a novel evaluation method in the transcritical CO2 heat pump system. Renew. Energy 2021, 178, 574–586. [Google Scholar] [CrossRef]
  23. Salajeghe, M.; Ameri, M. Effects of further cooling the gas cooler outlet refrigerant by an absorption chiller, on a transcritical CO2-compression refrigeration system. Int. J. Exergy 2016, 21, 110–125. [Google Scholar] [CrossRef]
  24. Yu, B.; Yang, J.; Wang, D.; Shi, J.; Chen, J. Performance Enhancement Research of a CO2 Air Conditioning System with Propane Mechanical Subcooling for Electric Vehicle. Trans. Jpn. Soc. Refrig. Air Cond. Eng. 2018, 35, 409. [Google Scholar]
  25. Boccardi, G.; Botticella, F.; Lillo, G.; Mastrullo, R.; Mauro, A.W.; Trinchieri, R. Thermodynamic Analysis of a Multi-Ejector, CO2, Air-To-Water Heat Pump System. Energy Procedia 2016, 101, 846–853. [Google Scholar] [CrossRef]
  26. Bai, T.; Yan, G.; Yu, J. Performance evolution on a dual-temperature CO2 transcritical refrigeration cycle with two cascade ejectors. Appl. Therm. Eng. 2017, 120, 26–35. [Google Scholar] [CrossRef]
  27. Li, D.; Baek, J.S.; Groll, E.A.; Lawless, P.B. Thermodynamic analysis of vortex tube and work output expansion devices for the transcritical carbon dioxide cycle. In 4th IIR-Gustav Lorentzen Conference on Natural Working Fluids at Purdue; Purdue University: West Lafayette, IN, USA, 2000. [Google Scholar]
  28. Pérez-García, V.; Rodríguez-Muñoz, J.L.; Ramírez-Minguela, J.J.; Belman-Flores, J.M.; Méndez-Díaz, S. Comparative analysis of energy improvements in single transcritical cycle in refrigeration mode. Appl. Therm. Eng. 2016, 99, 866–872. [Google Scholar] [CrossRef]
  29. Wang, Z.; Wang, F.; Ma, Z.; Lin, W.; Ren, H. Investigation on the feasibility and performance of transcritical CO2 heat pump integrated with thermal energy storage for space heating. Renew. Energy 2019, 134, 496–508. [Google Scholar] [CrossRef]
  30. Wang, Z.; Wang, F.; Li, G.; Song, M.; Ma, Z.; Ren, H.; Li, K. Experimental investigation on thermal characteristics of transcritical CO2 heat pump unit combined with thermal energy storage for residential heating. Appl. Therm. Eng. 2020, 16525, 114505. [Google Scholar] [CrossRef]
  31. Cecchinato, L.; Chiarello, M.; Corradi, M.; Fornasieri, E.; Minetto, S.; Stringari, P.; Zilio, C. Thermodynamic analysis of different two-stage transcritical carbon dioxide cycles. Int. J. Refrig. 2009, 32, 1058–1067. [Google Scholar] [CrossRef]
  32. Pitarch, M.; Navarro-Peris, E.; Gonzalvez, J.; Corberan, J.M. Analysis and optimisation of different two-stage transcritical carbon dioxide cycles for heating applications. Int. J. Refrig. 2016, 70, 235–242. [Google Scholar] [CrossRef]
  33. Sarkar, J.; Agrawal, N. Performance optimization of transcritical CO2 cycle with parallel compression economization. Int. J. Therm. Sci. 2010, 49, 838–843. [Google Scholar] [CrossRef]
  34. Dai, B.; Liu, S.; Li, H.; Sun, Z.; Song, M.; Yang, Q.; Ma, Y. Energetic performance of transcritical CO2 refrigeration cycles with mechanical subcooling using zeotropic mixture as refrigerant. Energy 2018, 150, 205–221. [Google Scholar] [CrossRef]
  35. Nebot-Andres, L.; Llopis, R.; Sánchez, D.; Catalán-Gil, J.; Cabello, R. CO2 with mechanical subcooling vs. CO2 cascade cycles for medium temperature commercial refrigeration applications thermodynamic analysis. Appl. Sci. 2017, 7, 955. [Google Scholar] [CrossRef] [Green Version]
  36. Tay, N.H.S.; Belusko, M.; Bruno, F. An effectiveness-NTU technique for characterising tube-in-tank phase change thermal energy storage systems. Appl. Energy 2012, 91, 309–319. [Google Scholar] [CrossRef]
Figure 1. Schematic diagram of the heating system of CO2 ASHP coupled with TES. 1—compressor; 2—gas cooler; 3—dry filter; 4—IHX, 5—EEV; 6—evaporator; 7—reservoir; 8,9—solenoid valve; 10—buffer water tank; 11—radiator; 12—water pump; 13—TES.
Sustainability 13 13683 g001
Figure 2. Typical rural house plan.
Sustainability 13 13683 g002
Figure 3. Comparison of the simulated and experimental values of TES.
Sustainability 13 13683 g003
Figure 4. Control model of the studied heating system.
Sustainability 13 13683 g004
Figure 5. CO2 ASHP heating system model coupled with TES.
Sustainability 13 13683 g005
Figure 6. Variations of the system COP at the different weights of PCM.
Sustainability 13 13683 g006
Figure 7. Variations of the heating capacity at the different weights of PCM.
Sustainability 13 13683 g007
Figure 8. Variations of the expenses present value and the power consumption at the different weight of PCM.
Sustainability 13 13683 g008
Figure 9. Variations of the system COP at the different phase change temperature of PCM.
Sustainability 13 13683 g009
Figure 10. Variations of the and heating capacity at the different phase change temperature of PCM.
Sustainability 13 13683 g010
Figure 11. Variations of the expenses present value and the power consumption at the different weight of PCM.
Sustainability 13 13683 g011
Figure 12. Variations of the system COP and heating capacity at the different water tank volumes.
Sustainability 13 13683 g012
Figure 13. Variations of the system COP and heating capacity at the different water tank volumes.
Sustainability 13 13683 g013
Figure 14. Variations of the expenses present value and the power consumption at the different water tank volumes.
Sustainability 13 13683 g014
Figure 15. TRNSYS optimization model of the coupled heating system.
Sustainability 13 13683 g015
Figure 16. Optimization process and results. (a) PCM weight and phase change temperature changes with iterative steps; (b) water tank volume and LCC changes with iterative steps.
Sustainability 13 13683 g016
Figure 17. COPsys changes before and after system optimization.
Sustainability 13 13683 g017
Figure 18. LCC proportion chart. (a) Before optimization; (b) After optimization.
Sustainability 13 13683 g018
Table 1. Parameters of the building envelope.
Building EnvelopeMaterials and PracticesHeat Transfer Coefficient/(W/(m2·°C))
Exterior wall20 mm cement mortar + 370 mm solid clay brick wall + 50 mm polystyrene board external insulation0.7
Exterior doorDouble glass plastic and steel frame door2.5
Exterior windowDouble glass plastic and steel frame window2.7
RoofPlaster roof + insulation layer0.8
Table 2. Simulation system components and parameter settings.
ModulesType PartInitial Parameter Setting
Building modelType 56Air exchange rate: 0.5 h−1
Room temperature control range: 18 ± 2 °C
Meteorological dataType 15Input meteorological data of typical years in Xi’an
ASHPType 941Rated heat: 7 kW
Rated power: 3.5 kW
RadiatorType 1231Design heat capacity: 5 kW
Design surface temperature: 50 °C
Buffer tankType 4cTemperature stratification: 4
Volume: 0.2 m3
TESCustomPhase transition temperature: 35 °C
Material quality: 200 kg
Water pumpType3dMaximum flow: 300 kg/h
Maximum power: 0.067 kW
Table 3. Initial design parameters of the coupled w heating system.
Component NameParametersValueUnit
CO2 ASHPRated heating capacity
Rated power
7
3.5
kW
kW
Heat source side water pumpFlow
Power
300
0.067
kg/h
kW
Load side water pumpFlow
Power
300
0.067
kg/h
kW
TESWeight
Phase change temperature
200
35
kg
°C
Buffer water tankVolume0.2m3
Table 4. Value range and step size of optimization variables.
Variation RangeThe Mass of Phase Change Heat Storage Material (m)/kgWater Tank Volume (V)/m3Phase Change Temperature (t)/°C
Minimum2000.130
Maximum4000.440
Step size100.11
Table 5. Value range of optimization variables.
Optimization VariablesInitial ValueOptimized Value
Weight of PCM (m)/kg200100
Water tank volume (V)/m30.20.34
Phase change temperature (t)/°C3538
Table 6. Energy efficiency analysis of the baseline system and the coupled system during the heating period.
System TypeSystem Heat Supply/kWhTotal Energy Consumption/kWhCOPsys
Before optimization538526652.02
After optimization541925032.17
Publisher’s Note: MDPI stays neutral with regard to jurisdictional claims in published maps and institutional affiliations.

