Abstract
The Han River Basin is a main agricultural production area and a water source for the middle route of the South-to-North Water Diversion Project in China. Over the past 20 years, human exploitation and ecological construction have disturbed the sustainability of land productivity in the Han River Basin. Theil–Sen trend analysis, Mann–Kendall statistical test, and Hurst index methods were applied to examine spatial–temporal trends and sustainability characteristics of land net primary productivity (NPP) change in the Han River Basin from 2001 to 2019 using MOD17A3 NPP product, natural, and socio-economic data obtained from Google Earth Engine (GEE). The findings demonstrated that the interannual variation of land NPP exhibited a fluctuating upward trend, with a more pronounced growth rate from 2001 to 2010 than from 2011 to 2019. The spatial heterogeneity of land NPP was evident, with high values in the west and low values in the east. Of the basin area, 57.82% presented a significant increase in land NPP, while only 0.96% showed a significant decrease. In the future, land NPP in the Han River Basin will present sustained growth. The results were also compared with Trends.Earth’s calculations for the SDG 15.3.1 sub-indicator of land productivity. In addition, the spatial heterogeneity of factors influencing land NPP change was explored using a multiscale geographically weighted regression (MGWR) model. Precipitation and population count were the dominant factors in most regions. Besides, precipitation, population count, and human modification all exhibited inhibitory effects on the increase in land NPP except for elevation. The research can provide a scientific basis for tracking land degradation neutrality (LDN) progress and achieving sustainable socio-ecological development of the Han River Basin.
1. Introduction
As an essential part of terrestrial ecosystems, vegetation plays an irreplaceable role in regulating the global climate and carbon balance. Increasing the carbon sink in terrestrial vegetation has become a strategic option for humans to cope with global warming [1,2]. Increasing studies on the terrestrial carbon cycle have focused on estimating land productivity and its response mechanisms, which have become an essential element and hotspot in current ecology and global change research [3,4,5,6,7]. The United Nations (UN) Sustainable Development Goal (SDG) indicator 15.3.1 includes land productivity as one of the three key sub-indicators [8,9]. However, spatially explicit baselines and dynamic progress results for SDG target 15.3 (land degradation neutrality, LDN) at a global scale have not yet been released, which is directly related to data availability, methodological uncertainty, and political sensitivity. Complementary studies on trends and sustainability in land productivity change could provide technical and data support for regional SDG 15.3.1 assessments. It is of great theoretical and practical significance for achieving LDN and ensuring sustainable socio-ecological development.
Net primary productivity (NPP) is the total quantity of dry organic matter produced by green plants per unit area per unit time through photosynthesis after subtracting autotrophic respiration [10]. NPP is a crucial parameter in terrestrial ecological processes. It reflects the combined effects of climate change and human activities on terrestrial vegetation. As a result, it is a critical indicator for determining carbon balance, health, and sustainability of terrestrial ecosystems [3,11]. Studies have demonstrated that NPP can effectively capture the state of land productivity. It is more vulnerable to climate change and human activities than vegetation indexes such as NDVI [12,13]. Climatic factors (e.g., temperature, precipitation, and solar radiation) and human activities (e.g., land-use change, vegetation construction, and soil-water conservation) are now widely regarded as the main drivers of land productivity change [1,14]. For instance, government-led ecological projects, including afforestation and conversion of farmland to forest or grassland, will improve land productivity; urban expansion will decrease land productivity by occupying ecological land, including farmland, forest, and grassland.
The earliest methods of quantifying NPP were in situ measurements, which mainly included harvest measurements, biomass surveys, photosynthesis measurements, radiation measurements, chlorophyll measurements, and feedstock material consumption measurements [15]. However, these methods are often restricted by several factors that make them difficult to implement. Thus, scholars presented statistical climate models, physiological–ecological process models, light energy utilization models, and multiple interactive models [16,17,18,19]. Long timeseries and wide coverage of remote sensing data make data-driven models of ecosystem processes a vital tool for understanding the spatial and temporal characteristics of land productivity and its driving mechanisms. MODIS data are presently one of the primary remote sensing data sources for regional land NPP estimation due to their high temporal resolution and low acquisition cost [20,21]. MOD17A3 calculates global terrestrial NPP using the Biome-BGC model with a light energy utilization model based on MODIS Terra satellite parameters [22]. It has been validated and applied extensively in global and regional carbon cycle research [3,23,24,25].
The Han River Basin is an important ecological barrier area and a water source for China’s South-to-North Water Diversion Project. As the world’s largest water transfer project, it is expected to transfer 9.5 billion cubic meters of water annually from the Han River Basin to the North China Plain, benefiting over 120 million people who are experiencing water shortages [26,27]. In order to ensure high-quality and sustainable water transfer for the project, ecological protection and water security in the water source area are of paramount importance. China has implemented a series of ecological construction projects in the Han River Basin since 1999, including afforestation, reforestation, conversion of farmland to forest or grass, natural forest protection, and soil-water conservation. The vegetation in the basin has changed dramatically in terms of area, distribution, and quality. Much attention has been paid to whether ecological restoration projects are effective in improving ecosystem services in the Han River Basin [28]. In addition, agriculture thrived early in the Han River Basin, with the Jianghan Plain and Hanzhong Basin serving as important agricultural and commercial grain production bases in China [29,30]. Intensive agricultural activities are concentrated along river systems [28]. Socio-economic development and increasing human exploitation of land resources have led to changes in land structure and degradation of land functions. As a result, the sustainability of land productivity has been disturbed [31,32,33]. It is essential to establish a rapid evaluation system that objectively illustrates the trends and sustainability of land productivity changes due to the abovementioned disturbances.
Remarkable progress has been made in the estimation methodologies, spatial–temporal changes, and impact mechanisms of land productivity in recent years [4,6,34,35,36]. Land productivity change and its influencing factors have been investigated at different scales, including global [35,37], national [20,21,38], and ecologically sensitive or fragile areas [34,35,36,37]. These studies have all verified the impact of climate change and human activities on land productivity to varying degrees, as well as the spatial heterogeneity of land productivity responses to these factors. Land productivity in various regions has also been better understood and recognized. Scholars have conducted numerous studies on the dynamics of vegetation/land productivity in the Han River Basin. These studies have played a positive role in ecological construction and environmental protection in the Han River Basin, focusing on the effects of forest vegetation on the water environment [39], vegetation succession during fallow restoration [40], the relationship between land productivity changes and climatic factors [41,42,43,44], and hydrological effects of vegetation change [45] and their impacts on soil erosion [46]. Previous research has mostly concentrated on the relationship between land NPP changes and climatic factors. The spatial–temporal dynamics and sustainability of land NPP change in the Han River Basin under the influence of human activities, as well as on longer time scales, have not been fully studied. There are few quantitative studies that incorporate the effects of climatic factors and human activities on land NPP change in the Han River Basin. As a result, it is difficult to reveal the response mechanisms to land productivity change in the Han River Basin. What is the influence of human exploitation and ecological construction on land productivity in the basin? What are the differences between regions? These issues are not clear. Quantitative analysis and assessment are required in conjunction with relevant data and methods.
Google Earth Engine (GEE) is a cloud computing platform for remote sensing with vast global geoscience data. The computational efficiency of GEE can significantly reduce the quantity of intermediate data storage required to support the processing of long timeseries and large amounts of remote sensing data. GEE has developed into a powerful research tool in geosciences and related domains. Many studies have utilized it to detect water and vegetation dynamics, estimate crop yield, and monitor forest change [47,48,49,50,51]. Through GEE, Robinson et al. (2018) [52] developed two NPP products for the U.S. mainland with different resolutions (30 m and 250 m).
The three objectives of this study are (i) what are the trends of land NPP change in the Han River Basin over the last 20 years? (ii) What are the spatial patterns of natural and anthropogenic factors influencing land NPP changes within the basin? In particular, what are the regional differences in the dominant factors within the basin? (iii) How to facilitate to calculate and operate land productivity evaluation at the basin scale and assess their accuracy, reliability, or validity, taking the Han River Basin as an example.
First, this paper intends to take advantage of the acquisition and computational efficiency of the GEE cloud platform to invoke timeseries NPP dataset from 2001 to 2019 in the Han River Basin. Secondly, a pixel-by-pixel trend analysis method is used to assess the spatial–temporal trends and sustainability characteristics of land NPP changes. Furthermore, comparisons are made with the land productivity assessment method recommended in the practice guidelines provided by the United Nations Convention to Combat Desertification (UNCCD). In addition, a multiscale geographically weighted regression model (MGWR) based on regular grids is constructed to explore the influence of natural and human activity factors on land NPP change and their spatial differences. We aim to enrich the research related to land productivity changes and their response mechanisms in the Han River Basin. The results can provide scientific support to guarantee regional food security and high-quality water transfer, help track the progress of LDN, and contribute to the socio-ecological sustainable development of the basin.
Innovations in this study include (i) using international shared datasets based on the GEE cloud platform to track and monitor land productivity in the Han River Basin and, thus, provide an operational approach for SDG 15.3.1 assessment practices at the regional scale and promote the understanding of achieving sustainable development goals of the basin; (ii) applying the MGWR model to study the influencing factors of land NPP change. MGWR enables us to reveal the spatial heterogeneity of factors influencing land NPP change more extensively and intuitively than general linear regression models and, thus, helps to clarify regional differences in the dominant factors of land productivity changes.
2. Materials and Methods
2.1. Study Area
The Han River is the largest tributary of the Yangtze River, with a total length of 1577 km. The mainstream of Han River originates at the southern foot of Qinling Mountains, flows through Shaanxi Province and Hubei Province, and feeds into the Yangtze River at the Dragon King Temple in Hankou, Wuhan. The Han River Basin is located between 30°10′–34°20′ N and 106°15′–114°20′ E, covering a gross area of 159,000 km2.
The topography of the Han River Basin is high in the west and low in the east, with low and moderate mountains in the west and hilly plains in the east. The upper reaches, involving the watershed above Danjiangkou, which has undulating topography with Daba Mountains and Qinling Mountains to the south and north, respectively, and the Hanshui Valley in between. The middle reaches, from Danjiangkou to Zhongxiang, where the terrain is relatively flat, with Wudang Mountains and Funiu Mountains to the south and north, respectively, and the Nanyang Basin in between. The lower reaches, which belong to the Jianghan Plain where the terrain is flat, are located below Zhongxiang. The Han River Basin is in the subtropical monsoon zone, with a mild and humid climate. Precipitation in the basin is relatively abundant, with an annual average of 894 mm. Precipitation is unevenly distributed throughout the year, mainly concentrated from May to October. Runoff is chiefly supplied by precipitation, and its annual distribution coincides with the distribution of precipitation, with the flood season lasting from late June to early October [53]. The upper reaches of the Han River Basin is densely forested, consisting mainly of evergreen broad-leaved forests, evergreen coniferous forests, deciduous broad-leaved forests, and mixed forests, whereas the middle and lower reaches are mostly agricultural lands, where soil erosion is a concern [29,46].
According to water resources zoning, the Han River Basin is divided into three sub-basins: the watershed above Danjiangkou, the Tangbai River Watershed, and the mainstream watershed below Danjiangkou, which account for 47%, 21%, and 32% of the basin area, respectively. The Han River Basin is now known as a water conservation area for the middle route of China’s South-to-North Water Diversion Project. Figure 1 illustrates the geographical overview of the Han River Basin.
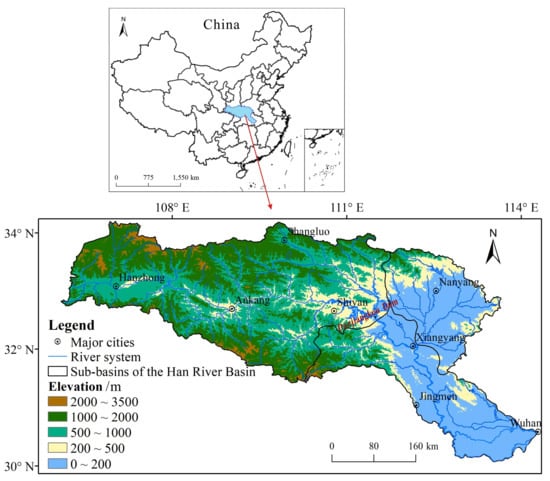
Figure 1.
Location and topography of the Han River Basin, China.
2.2. Data Sources and Processing
2.2.1. NPP Data
NPP data from 2001 to 2019 were derived from the annual NPP dataset (MOD17A3HGF V6) (https://lpdaac.usgs.gov/products/mod17a3hgfv006/, accessed on 2 September 2021) provided by NASA, with a spatial resolution of 500 m and a conversion factor of 0.0001. MOD17A3HGF is synthesized from all 8-day net photosynthesis (PSN) products (MOD17A2H) from the given year, where the PSN value is the difference between gross primary productivity (GPP) and maintenance respiration (MR). MOD17A3HGF V6 improves the accuracy of NPP estimation by using updated Biome Property look-up tables (BPLUT) and an updated version of the Global Modeling and Assimilation Office (GMAO) meteorological data compared with MOD17A3 V5.5 [54]. The function to obtain the dataset in GEE is ee.ImageCollection(“MODIS/006/MOD17A3HGF”).
2.2.2. Meteorological Data
Temperature data from 2001 to 2019 were collected from the daily land surface temperature (LST) product (MOD11A1) (https://lpdaac.usgs.gov/products/mod11a1v006/, accessed on 28 September 2021) provided by NASA, with a spatial resolution of 1000 m and a conversion factor of 0.02. The function to obtain the product is ee.ImageCollection(“MODIS/006/MOD11A1”) in GEE. The GEE platform can also perform calculations of annual average temperature based on these obtained data.
Precipitation data from 2001 to 2019 were obtained from Climate Hazards Group Infrared Precipitation with Station data (CHIRPS) (https://www.chc.ucsb.edu/data/chirps, accessed on 28 September 2021) provided by University of California, Santa Barbara (UCSB), with a spatial resolution of 0.05 arc degrees. The function to obtain the dataset is ee.ImageCollection(“UCSB-CHG/CHIRPS/DAILY”) in GEE. The GEE platform can also perform calculations of annual average precipitation based on these obtained data.
2.2.3. Topographic Data
Elevation data were derived from NASA Digital Elevation Model product (NASADEM) (https://lpdaac.usgs.gov/products/nasadem_hgtv001/, accessed on 28 September 2021), with a spatial resolution of 30 m. NASADEM is a reprocessing of STRM that incorporates auxiliary data from ASTER GDEM, ICESat GLAS, and PRISM to improve accuracy. The function to obtain the data in GEE is ee.Image(“NASA/NASADEM_HGT/001”). In addition, slope data can be generated according to NASADEM.
2.2.4. Forest Cover Data
Forest cover data were derived from the global forest cover change product (GFCC30SR) (https://lpdaac.usgs.gov/products/gfcc30tcv003/, accessed on 11 October 2021) provided by NASA with a spatial resolution of 30 m. GFCC30SR is based on the enhanced Global Land Survey (GLS) datasets, which consists of Landsat 5 Thematic Mapper (TM) and Landsat 7 Enhanced Thematic Mapper Plus (ETM+) imagery. The forest cover layer estimates the percentage of horizontal ground covered by woody vegetation greater than 5 m in height in each 30 m pixel. The dataset is available for four epochs centered on 2000, 2005, 2010, and 2015. The function to obtain the data in GEE is ee.ImageCollection(“NASA/MEASURES/GFCC/TC/v3”).
2.2.5. Human Activity Data
Population count data were collected from the gridded product of global population (GPWv411) (https://sedac.ciesin.columbia.edu/data/collection/gpw-v4, accessed on 11 October 2021) provided by Socioeconomic Data and Applications Center (SEDAC), with a spatial resolution of 30 arc seconds and covering the years 2000, 2005, 2010, 2015, and 2020. The function to obtain the data is ee.ImageCollection (“CIESIN/GPWv411/GPW_Population_Count”).
Human modification data were derived from the global human modification dataset (gHM) (https://sedac.ciesin.columbia.edu/data/set/lulc-human-modification-terrestrial-systems, accessed on 11 October 2021) provided by SEDAC with a spatial resolution of 1000 m. The gHM provides a cumulative measure of global human modification of terrestrial land with values ranging from 0.0 to 1.0. The gHM is calculated from the proportion of a given location that has been modified and the intensity of modification associated with a specific type of human modification. Five major anthropogenic stressors were mapped around 2016 using 13 individual datasets: human settlement, agriculture, transportation, mining and energy production, and electrical infrastructure. The function to obtain the data in GEE is ee.ImageCollection(“CSP/HM/GlobalHumanModification”).
Since the storage formats, spatial resolutions, and projections of the above datasets are not compatible (Table 1), this study adopted the JavaScript code editor based on GEE to implement the calling, reprojecting, resampling, clipping, computing, and related pre-processing to reduce labor and hardware resource usage.

Table 1.
Source and resolution of the data used.
2.3. Methods
2.3.1. Change Trend of Land NPP
The Theil–Sen trend analysis [55] and Mann–Kendall statistical test [56] were used to conduct pixel-by-pixel change trend analysis and significance tests for timeseries land NPP in the Han River Basin. The advantage of the Theil–Sen trend analysis is that it does not require the sample to obey a specific distribution and is not subject to outliers. The Mann–Kendall test is a non-parametric test that is used to test data that are not normally distributed. The Theil–Sen slope (ρ) is calculated as follows:
where ρ is the slope of land NPP; median is the median function; i and j are timeseries; xi and xj are land NPP values in the i-th and j-th years, respectively. When ρ > 0, it indicates an upward trend in land NPP; when ρ < 0, it indicates a downward trend in land NPP; when ρ = 0, it indicates an insignificant trend in land NPP. According to the Mann–Kendall test, five significance levels are assigned to characterize the change trend of land NPP: highly significant increase (ρ > 0, p < 0.01), significant increase (ρ > 0, 0.01 < p < 0.05), no significant change (p > 0.05), significant decrease (ρ < 0, 0.01 < p < 0.05), and highly significant decrease (ρ < 0, p < 0.01).
2.3.2. Sustainability Analysis of Land NPP Change
The Hurst index was used to describe sustainable characteristics of land NPP change in the Han River Basin from 2001 to 2019. The Hurst index was first proposed by the British hydrologist Hurst (1951) [57] and was later modified by Mandelbrot and Wallis (1969) [58]. The Hurst index is an effective method for quantitatively predicting future trends of timeseries data based on a rescaled range analysis method. It has been widely used in meteorology, hydrology, geology, and other fields. Its calculation procedure can be found in previous studies [24,59]. The Hurst index (H) is generally available in three cases, with values ranging from 0 to 1.
- (1)
- If 0.5 < H < 1, it is a continuous series that the future trend of land NPP change is consistent with the past. The closer H is to 1, the stronger the continuity is.
- (2)
- If H = 0.5, it is a random series that the future trend of land NPP change is irrelevant to the past.
- (3)
- If 0 < H < 0.5, it is a reverse continuous series that the future trend of land NPP change is opposite to the past. The closer H is to 0, the stronger the reverse continuity is.
2.3.3. Land Productivity Assessment Based on Trends.Earth for SDG Indicator 15.3.1
SDG indicator 15.3.1 uses information from three sub-indicators: land productivity, land cover, and soil organic carbon, according to the conceptual framework for monitoring LDN released by UNCCD. The Trends.Earth plugin (http://trends.earth, accessed on 25 May 2021) can be used to calculate the above sub-indicators. Trends.Earth allows the user to calculate each sub-indicator in a spatially explicit manner, generating raster maps that are later integrated into the final SDG 15.3.1 indicator maps [60]. The output is a tabular report that shows potential areas for improvement and degradation. In Trends.Earth, land productivity is calculated using annual average NDVI from MODIS or AVHRR data. Three measures of change derived from NDVI timeseries data are used to estimate land productivity, including trajectory, state, and performance.
- (1)
- Trajectory—measures the rate of change in land productivity over time. Trends.Earth uses pixel-level linear regressions to identify areas where land productivity has changed during the analysis period. Mann–Kendall non-parametric tests are then performed, considering only those significant changes with a p-value ≤ 0.05. Positive significant trends in NDVI indicate potential improvement, while negative significant trends suggest potential degradation.
- (2)
- State—detects the most recent changes in land productivity compared with the baseline period. The baseline period is considered as the historical period, while the comparison period is defined as the most recent years. Then, the average NDVI is calculated for the baseline and comparison periods. The percentile class to which it belongs is determined, with possible values ranging from 1 (lowest class) to 10 (highest class). If the difference in class between the baseline period and the comparison period is less than 2, the pixel may be degraded; if the difference is greater than 2, the pixel may have a recent improvement in productivity; if there is only a small change, the pixel is considered stable.
- (3)
- Performance—measures local productivity compared with similar land cover types across the study area. If the observed average NDVI is less than 50% of the maximum productivity, this sub-indicator considers the pixel to be potentially degraded. The maximum productivity is at the 90th percentile of the frequency distribution of NDVI.
In addition, the three sub-indicators of land productivity are merged to determine the integrated degradation type of land productivity occurring in the area, according to the rules shown in the table below (Table 2). The result is a 5-level indication supporting the assessment of SDG 15.3.1.
Table 2.
Sub-indicators of land productivity and their integration.
2.3.4. Geographically Weighted Regression (GWR) and Multiscale GWR (MGWR)
Variance inflation factor (VIF) is employed to detect the severity of multicollinearity in the ordinary least square (OLS) regression analysis. VIF is calculated as [61]:
where Ri2 represents the unadjusted coefficient of determination for regressing the i-th independent variable on the remaining ones. The reciprocal of VIF is known as tolerance. In general, a VIF above 4 or a tolerance below 0.25 suggests the presence of multicollinearity, and further investigation is required. When the VIF is greater than 10 or the tolerance is less than 0.1, significant multicollinearity must be rectified.
The geographically weighted regression (GWR) was first proposed by Brunsdon et al. (1996) [62] to investigate the local non-stationarity of independent variables in space. Due to the improved fit of the simulation model, GWR has been increasingly utilized in spatial regression than general linear regression models. As GWR is ineffective in diagnostic analysis, OLS regression is essential to validate the model’s accuracy prior to GWR analysis [63]. OLS is a global linear regression model in which all independent variables in each region are used to estimate a dependent variable. The basic principle is to minimize the sum of the squares of the differences between the observed dependent variable in the given dataset and those predicted by the linear function of the independent variable. The GWR model derives separate regression coefficients for each grid, unlike the OLS model, which only measures global or average significance. The GWR model is structured as follows [64,65]:
where (ui, vi) is the central coordinate at position i; yi is the attribute value at i; bwj represents the bandwidth used by the regression coefficient of the j-th variable; βbwj(ui, vi) is the regression coefficient for the j-th variable at i; β0(ui, vi) and εi are the intercept and error term at i, respectively.
In common with the GWR model, the regression coefficient (βbwj) of the multiscale GWR (MGWR) model is calculated based on local regression, as well as kernel functions and bandwidth selection criterion. Unlike the GWR model, the MGWR model allows for different degrees of spatial smoothing for each variable separately, which lowers estimation bias and produces a more realistic and valuable model of the spatial process [61]. Thus, the heterogeneity of bandwidth in the MGWR model is what distinguishes it from the GWR model, and this improvement can be achieved by redefining GWR as a generalized additive model (GAM) [66].
The optimal bandwidth was determined using Gauss functions and the Akaike information criterion (AIC) to examine the fit of the OLS, GWR, and MGWR models. In general, if the difference in AIC values between the two models is greater than 3, there is a significant difference between them. The model with a lower AIC value is considered to have a better fit. In addition, the Moran’s I statistic is usually used to check spatial autocorrelation in the error terms of the model. The residuals of the model are randomly distributed when the Moran’s I value is close to 0, which indicates a good fit. On the other hand, the model shows a poor fit.
The study area was divided into regular grid cells measuring 5 × 5 km. The dependent variable was the difference in land NPP from 2001 to 2019, and the independent variables were seven influencing factors (temperature, precipitation, elevation, slope, forest cover, population count, and human modification). All variables needed to be standardized using outlier procedures before being fitted to the model. Furthermore, the influence factor corresponding to the maximum absolute value of the regression coefficients was identified as the dominant component in land NPP changes.
In this study, the MGWR model was implemented using MGWR 2.2 software developed by the Spatial Analysis Research Center of Arizona State University (SPARC), and data pre-processing and map production were carried out by ArcGIS 10.3 software.
3. Results
3.1. Spatial–Temporal Pattern of Land NPP
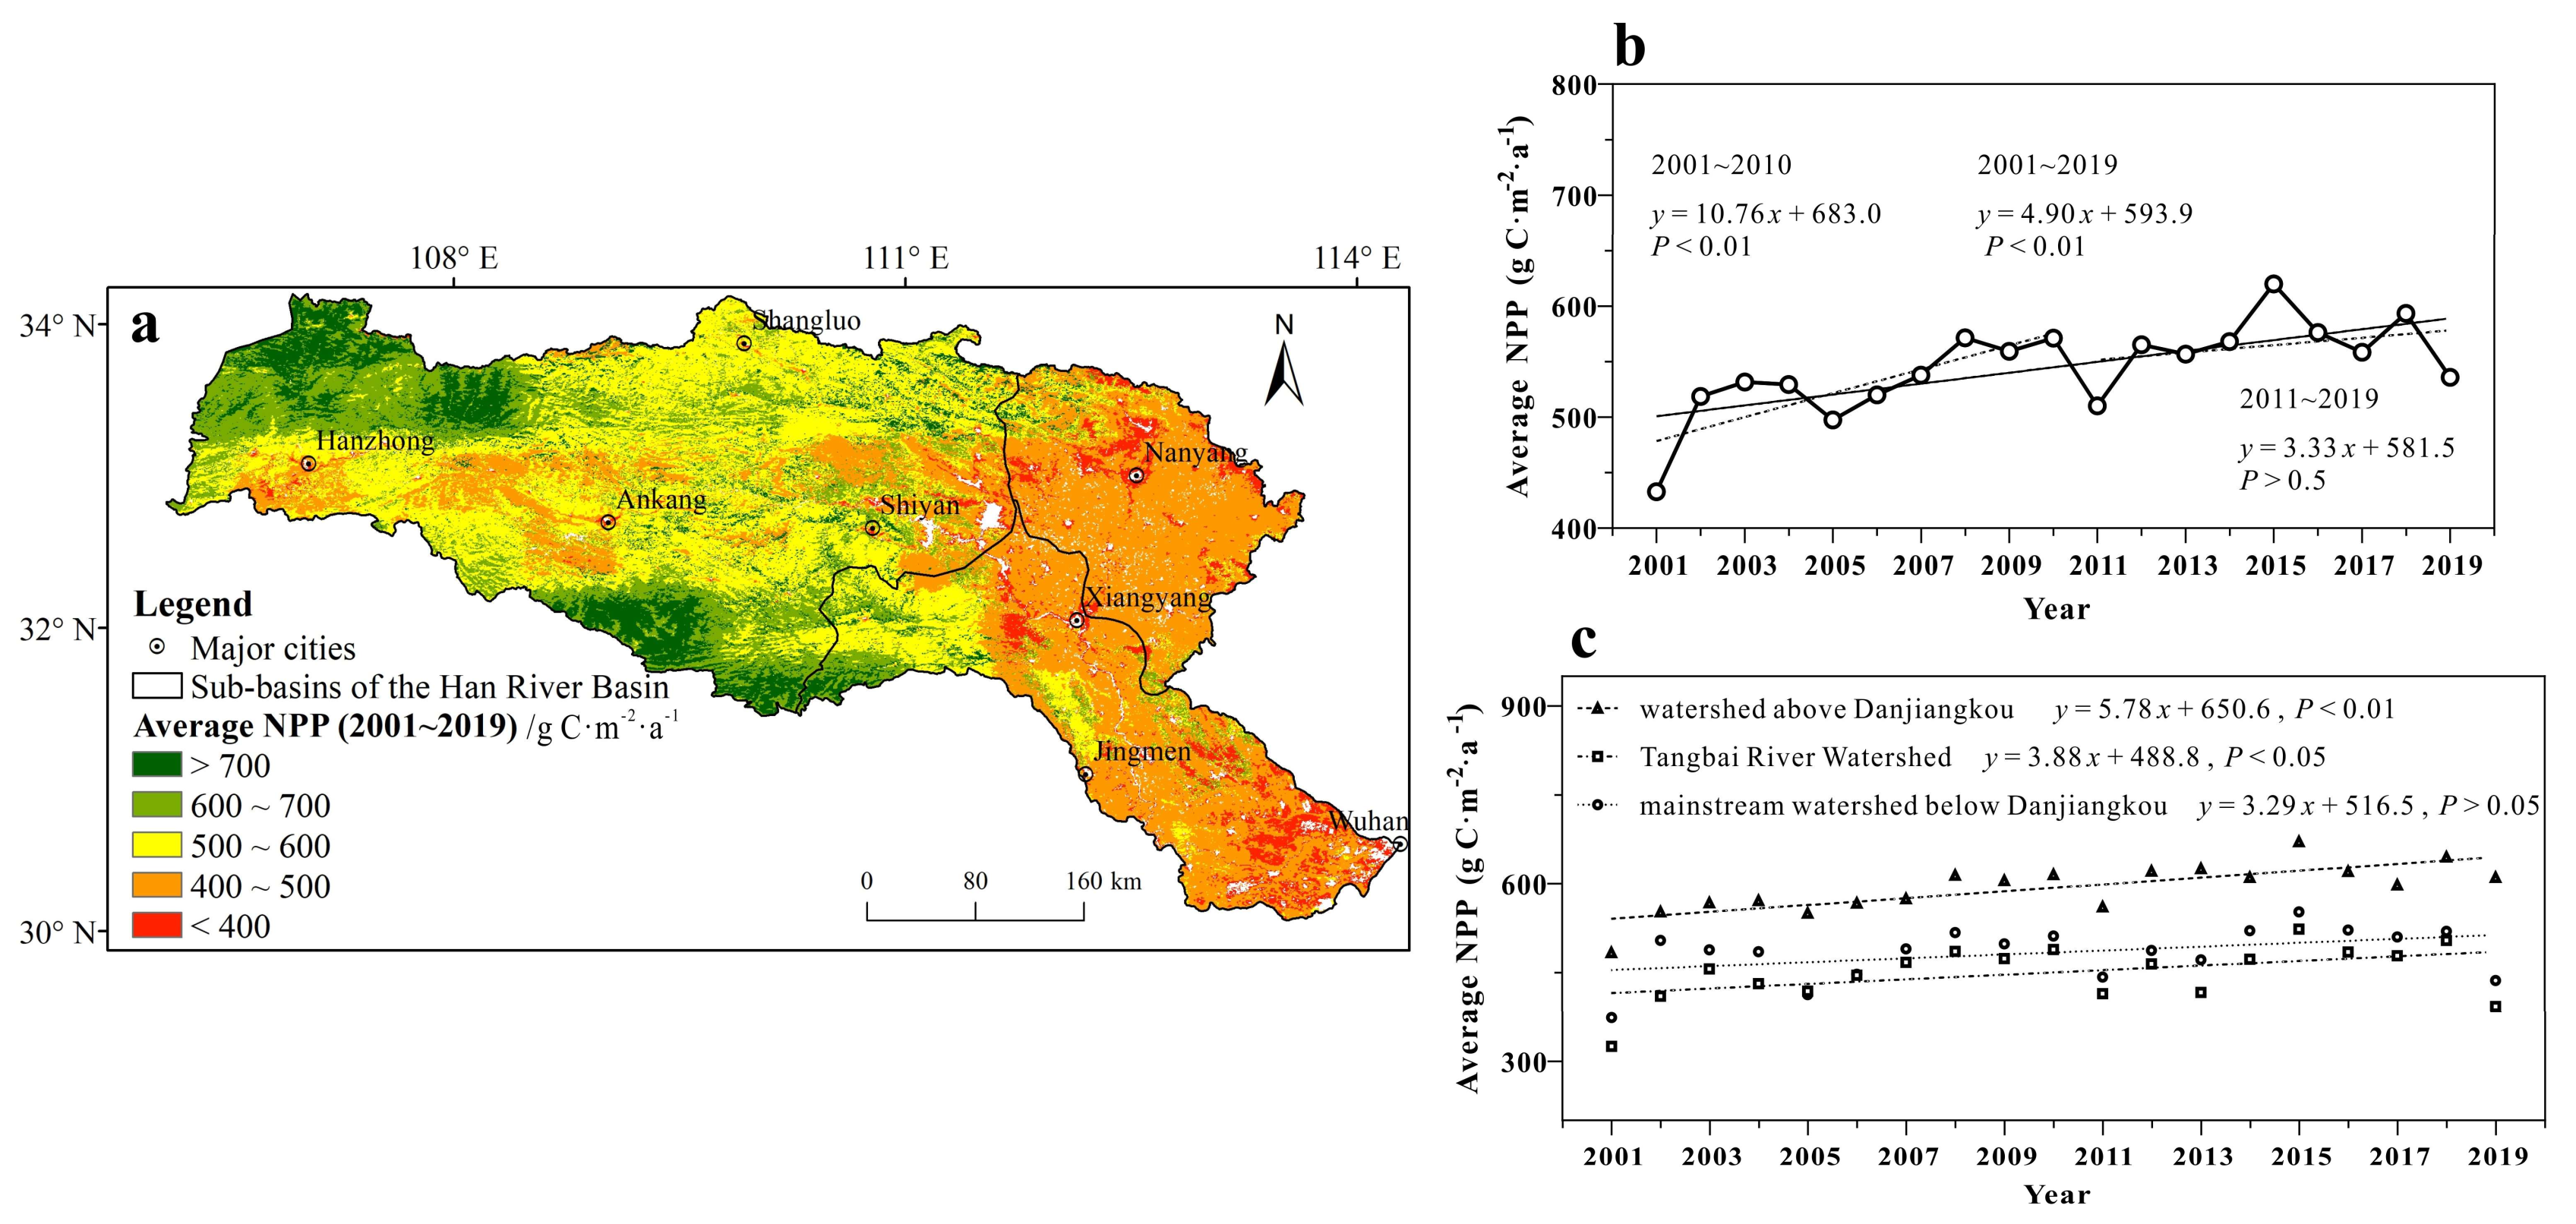
The average land NPP in the Han River Basin from 2001 to 2019 showed evident spatial heterogeneity, with high values in the west and low values in the east (Figure 2a). Land with NPP values greater than 700 g C·m−2·a−1 accounted for 9.81% of the basin area, mainly in Qinling Mountains located in the northwest and in Daba Mountains distributed in the southwest. Land with NPP values between 600 and 700 g C·m−2·a−1 accounted for 18.10% of the basin area, primarily in northern Hanzhong and southern Ankang and Shiyan. Land with NPP values between 400 and 600 g C·m−2·a−1 accounted for 66.15% of the basin area and was concentrated in the middle and upper reaches. Land with NPP values less than 400 g C·m−2·a−1 accounted for 5.94% of the basin area, mainly around Nanyang and in the lower reaches of the Han River (Figure 2a).
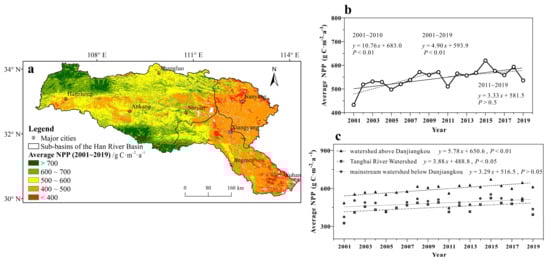
Figure 2.
Spatial distribution (a) and interannual variation of the multi-year average of land net primary productivity (NPP) in the Han River Basin of China (b) and its sub-basins (c) from 2001 to 2019.
The spatial distribution of land NPP in sub-basins of the Han River Basin also presented significant regional differences. Specifically, land showing the highest NPP values was in the watershed above Danjiangkou, with an average of 591 g C·m−2·a−1, land exhibiting moderate NPP values was in the mainstream watershed below Danjiangkou, with an average of 482 g C·m−2·a−1, and land displaying the lowest NPP values was in the Tangbai River Watershed, with an average of 449 g C·m−2·a−1.
The average annual land NPP in the Han River Basin between 2001 and 2019 ranged from 140 to 1033 g C·m−2·a−1, with an average of 486 g C·m−2·a−1. The highest was in 2015, while the lowest was in 2001. The interannual variation of land NPP exhibited a fluctuating upward trend. The growing linear trend reached the significant level (p < 0.01) with an average change rate of 4.90 g C·m−2·a−1. The increasing trend between 2001 and 2010 was more pronounced (p < 0.01), with an average growth rate of 10.76 g C·m−2·a−1, while the increasing trend between 2011 and 2019 was less pronounced (p > 0.5), with an average growth rate of 3.33 g C·m−2·a−1 (Figure 2b).
The average growth rates of land NPP in the upper, middle, and lower reaches of the basin were 5.78, 3.88, and 3.29 g C·m−2·a−1 (Figure 2c), respectively. Specifically, the growth rate of land NPP in the watershed above Danjiangkou from 2001 to 2019 was faster than the basin-wide average (4.90 g C·m−2·a−1), whereas the growth rates of land NPP in the Tangbai River Watershed and the mainstream watershed below Danjiangkou were slower than the basin-wide average.
3.2. Change Trend of Land NPP
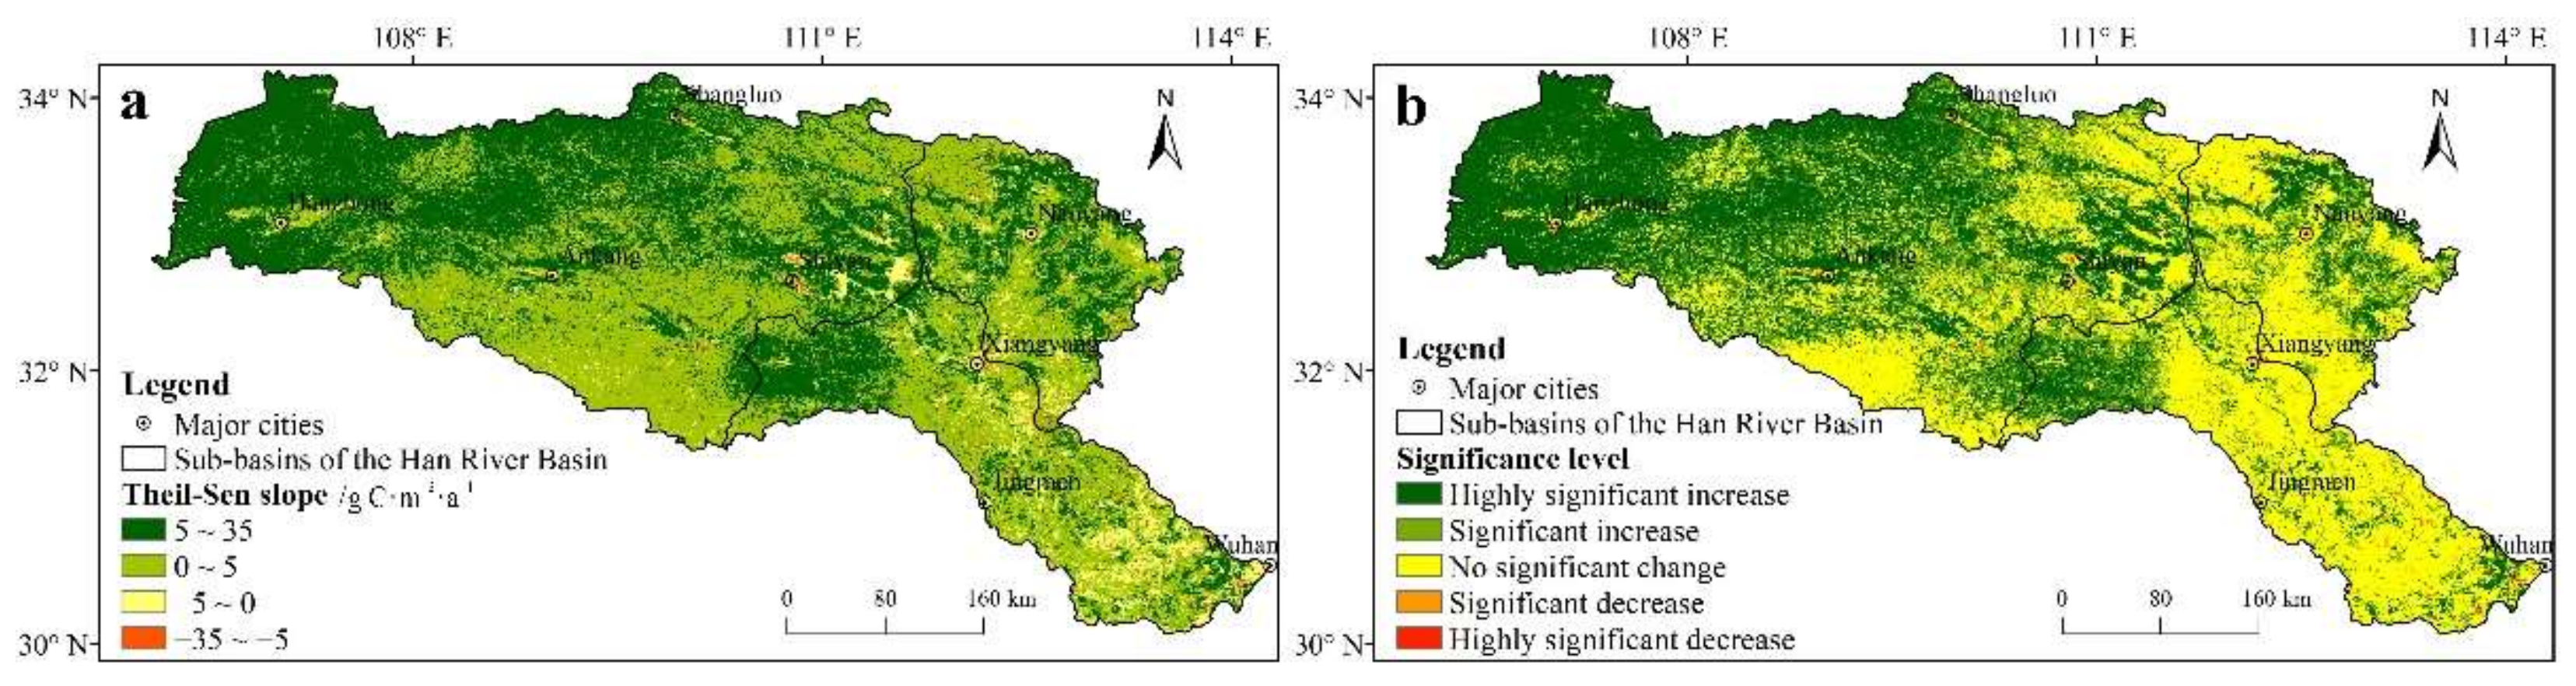
The Theil–Sen slope (ρ) of land NPP ranged from −33 to 20 g C·m−2·a−1 in the Han River Basin from 2001 to 2019. Land with an increasing trend of NPP (ρ > 0) accounted for 92.27% of the basin area, while land with a decreasing trend of NPP (ρ < 0) only accounted for 7.73%. Specifically, land with faster increases in NPP (ρ > 5) was mainly located in Hanzhong, northern Ankang, Fangxian, the Shennongjia Forestry District, regions around the Danjiangkou Reservoir, and parts of the Nanyang Basin, whereas land with faster decreases in NPP (ρ < −5) accounted for a small proportion and was concentrated in the peri-urban areas (Figure 3a).

Figure 3.
Spatial distribution of change trend (a) and significance levels (b) of land net primary productivity (NPP) in the Han River Basin of China between 2001 and 2019.
The Mann–Kendall method was used to examine the change trend of land NPP at five significance levels (Figure 3b). Land with highly significant (p < 0.01) and significant (p < 0.05) increases in NPP accounted for 39.25 and 18.57% of the basin area, while land with highly significant (p < 0.01) and significant (p < 0.05) decreases in NPP only accounted for a small proportion of the basin area (0.96% in total). The spatial distribution of areas with significant increases was quite similar to that of areas with high growth rates of land NPP. In addition, land NPP in most regions, representing 41.23% of the basin area, did not change significantly.
3.3. Sustainability Analysis of Land NPP Change
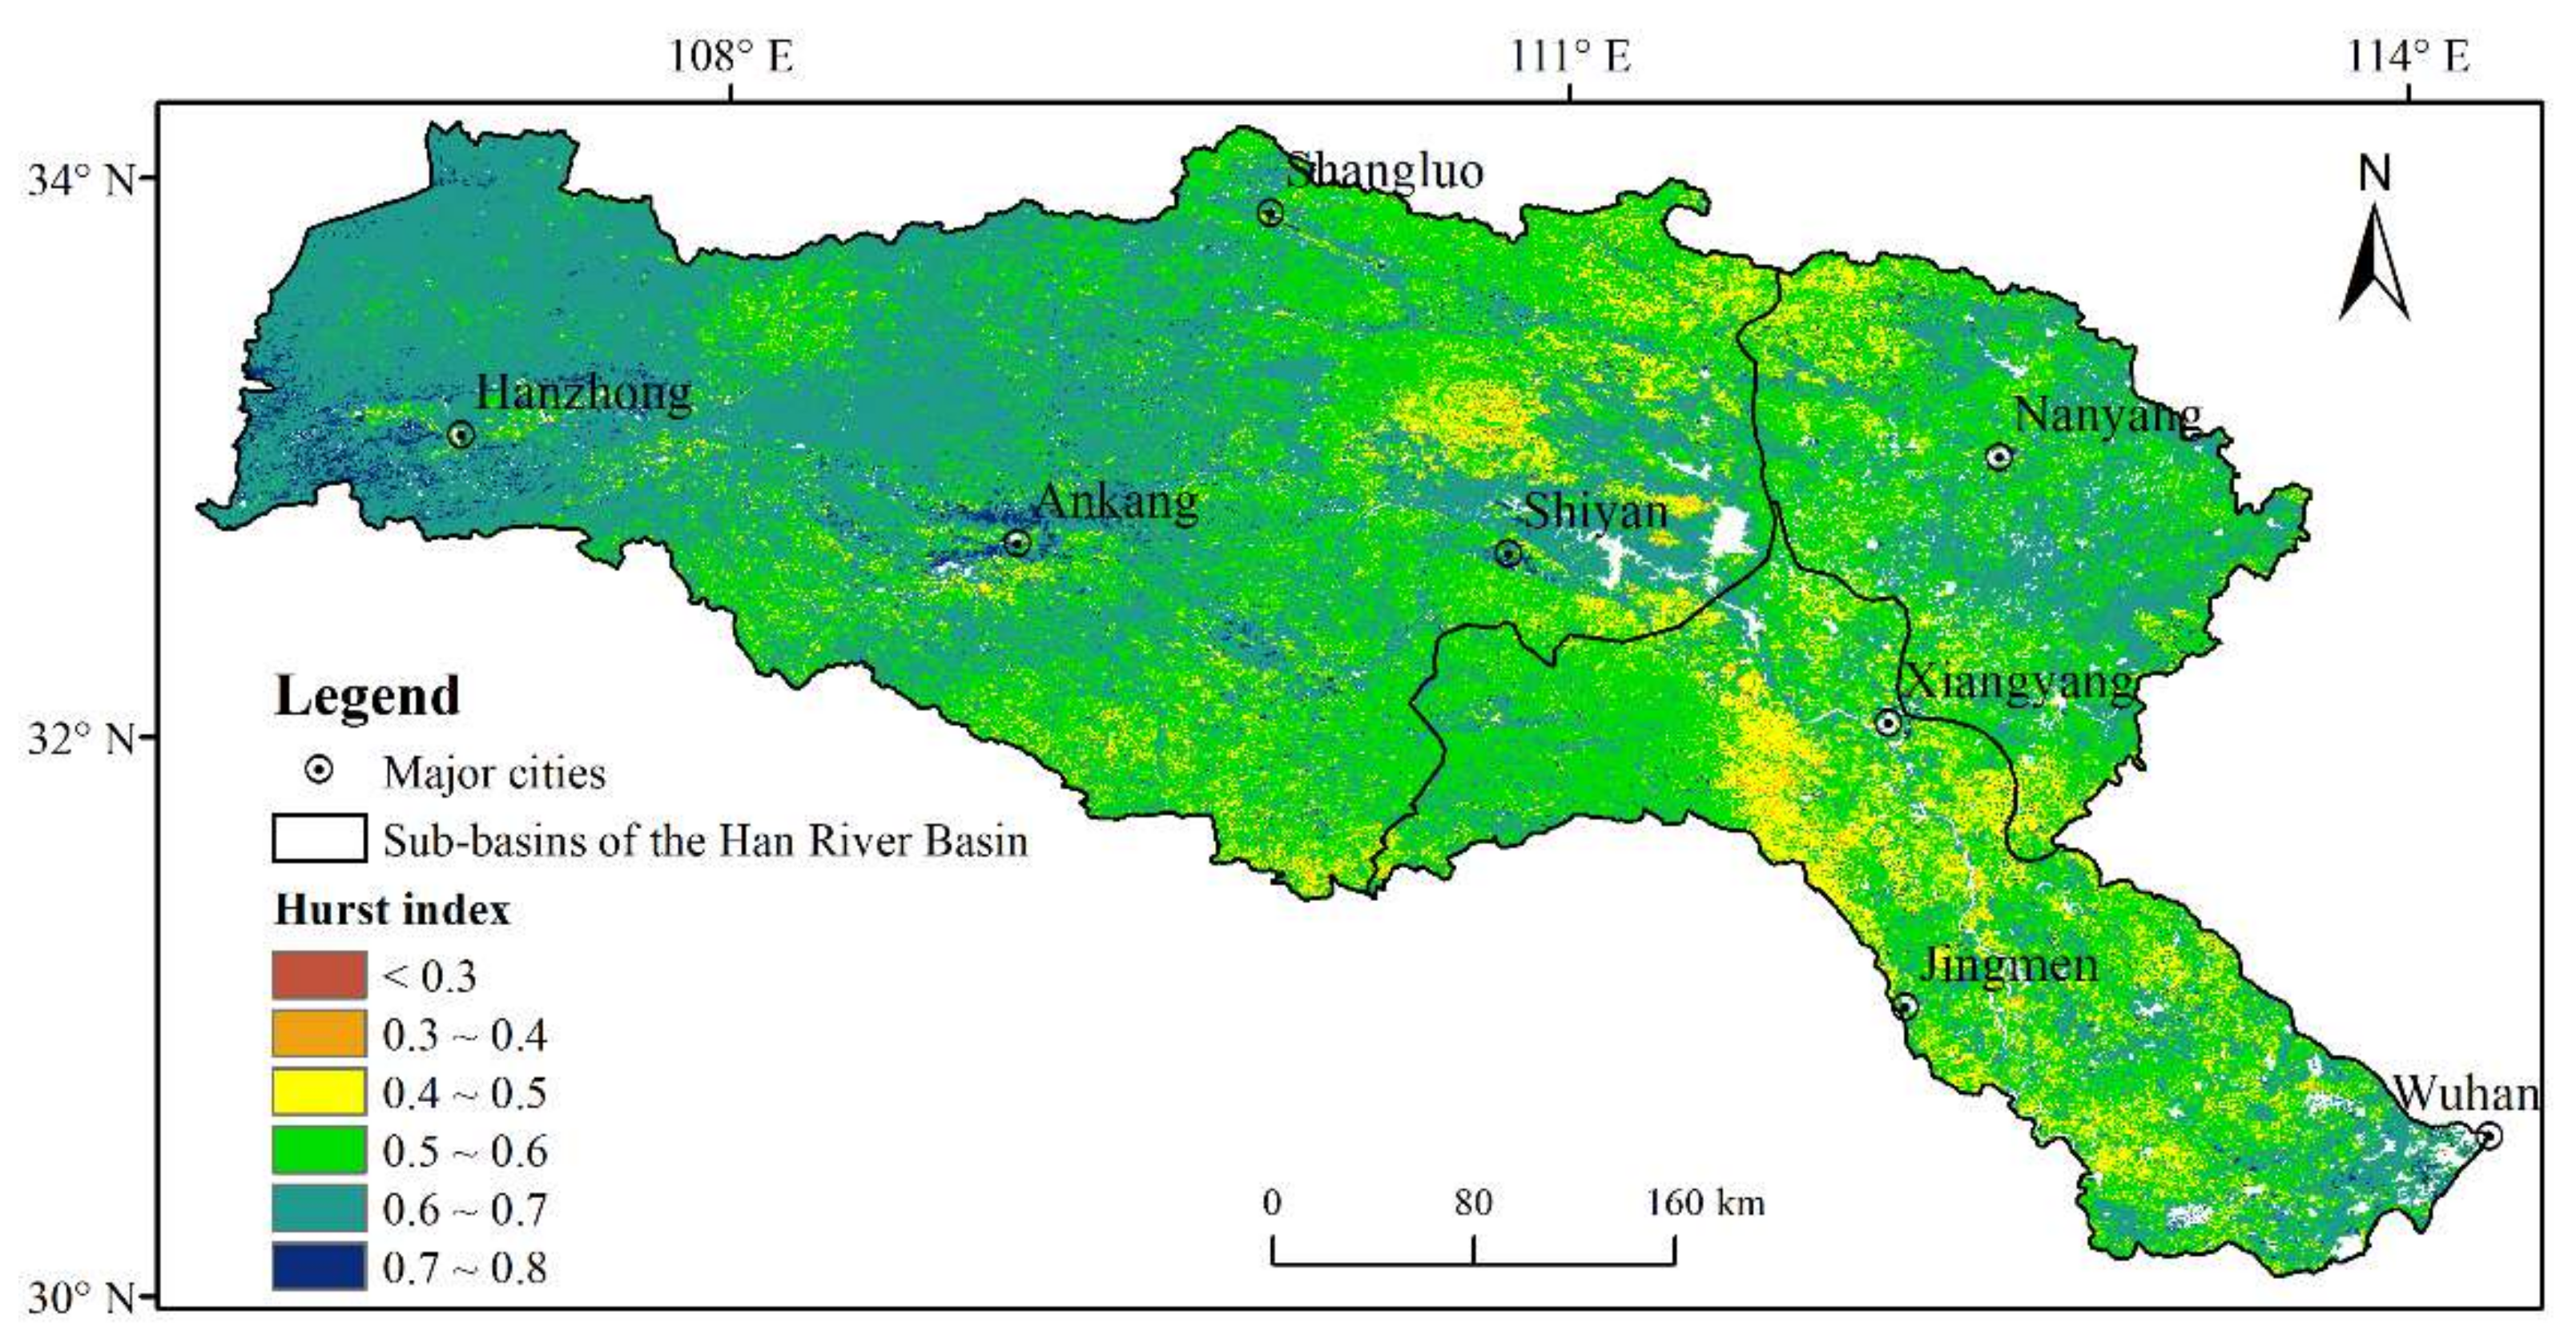
The Hurst index of land NPP ranged from 0.29 to 0.74 in the Han River Basin from 2001 to 2019, with a multi-year average of 0.59. The continuous series of land NPP (0.5 < H < 1) accounted for 89.44% of the basin area, indicating that the future trend of land NPP is consistent with the past in most areas of the Han River Basin. The reverse continuous series of land NPP (0 < H < 0.5) accounted for 10.56% of the basin area and was mainly concentrated in the middle-lower reaches of Nanzhang, Gucheng, and Yicheng and in the upper reaches of junction areas of Shangnan, Yunxi, and Yunxian (Figure 4). The future trend of land NPP in these regions is opposite to the past.

Figure 4.
Spatial distribution of Hurst index of land net primary productivity (NPP) in the Han River Basin of China from 2001 to 2019.
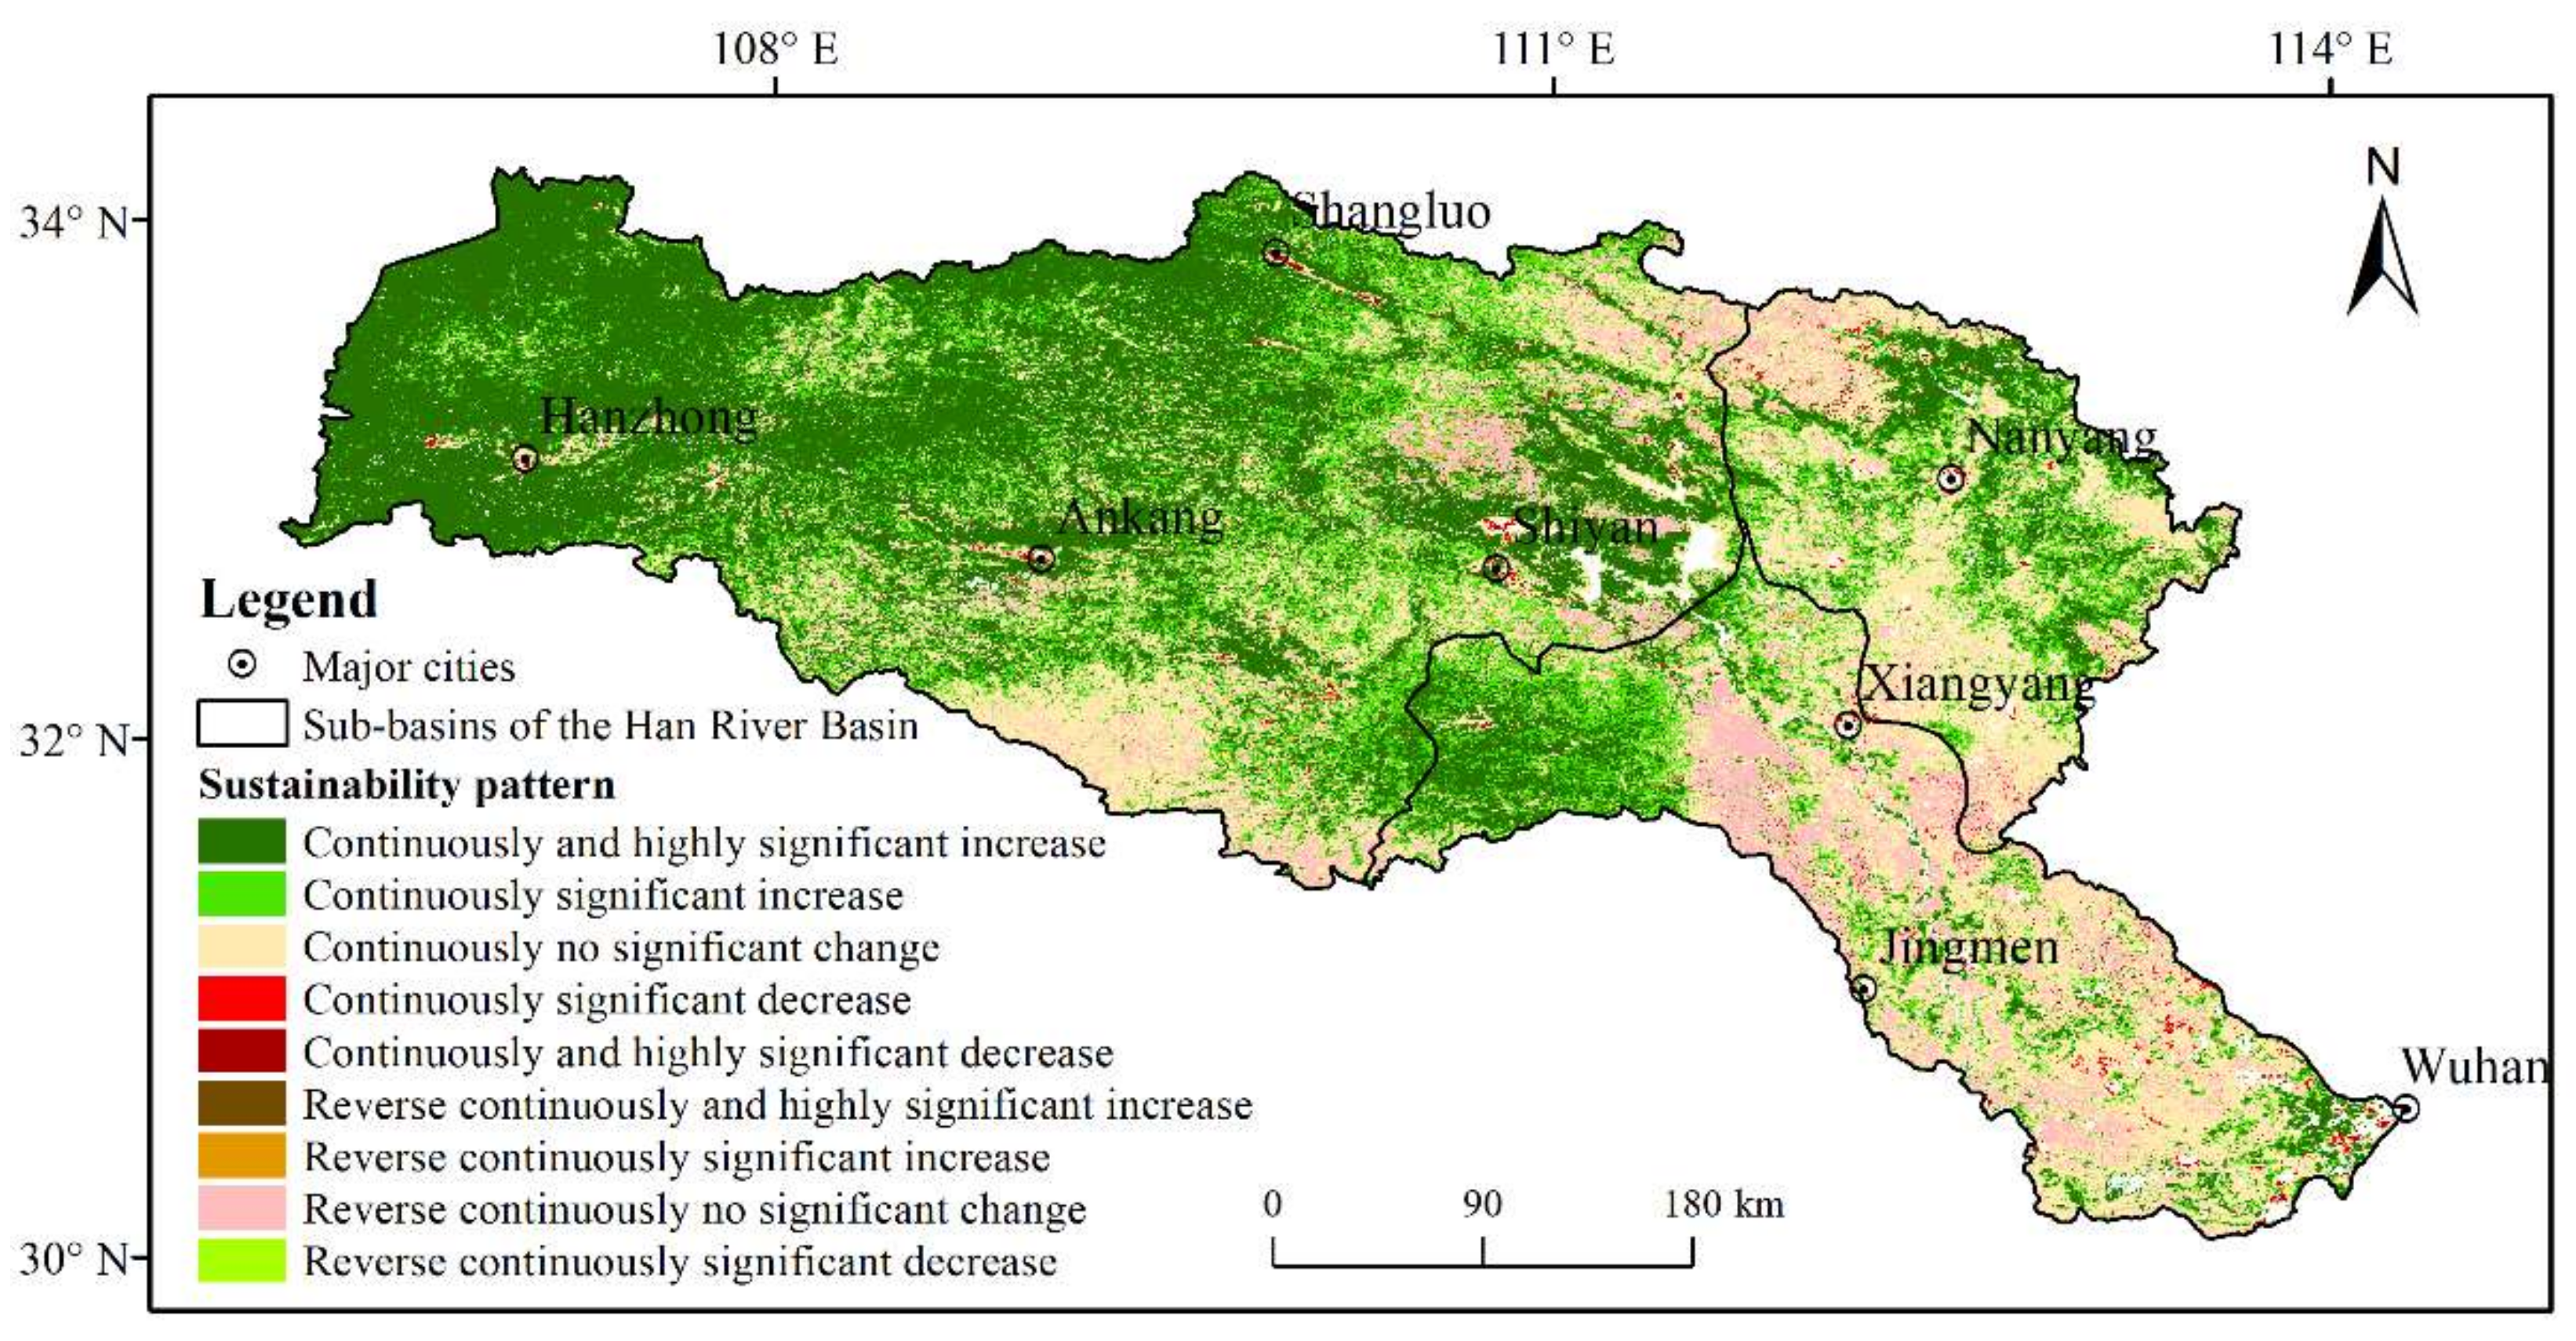
Spatial overlay analysis of the change trend map and the Hurst index map was performed to obtain the coupled distribution of sustainability pattern of land NPP in the Han River Basin from 2001 to 2019 (Figure 5). In the continuous series of sustainability pattern, regions exhibiting significant and highly significant increases accounted for 58.90% of the basin area, mainly in Hanzhong, northern Ankang, Fangxian, the Shennongjia Forestry District, regions around the Dankiangkou Reservoir, and parts of the Nanyang Basin; areas showing significant and highly significant decreases represented 0.98% of the basin area, primarily in the peri-urban areas. In the reverse continuous series of sustainability pattern, regions displaying significant and highly significant increases accounted for 0.33% of the basin area; areas presenting significant and highly significant decreases only accounted for a small proportion (less than 0.01%). In general, series with continuously significant increases in sustainability pattern of land NPP were far more than those with continuously significant decreases (or reverse continuously significant increases). Therefore, land NPP in the Han River Basin will present sustained growth in the future.

Figure 5.
Spatial distribution of sustainability pattern of land net primary productivity (NPP) in the Han River Basin of China from 2001 to 2019.
4. Discussion
4.1. Comparison of Land Productivity Assessment
- (1)
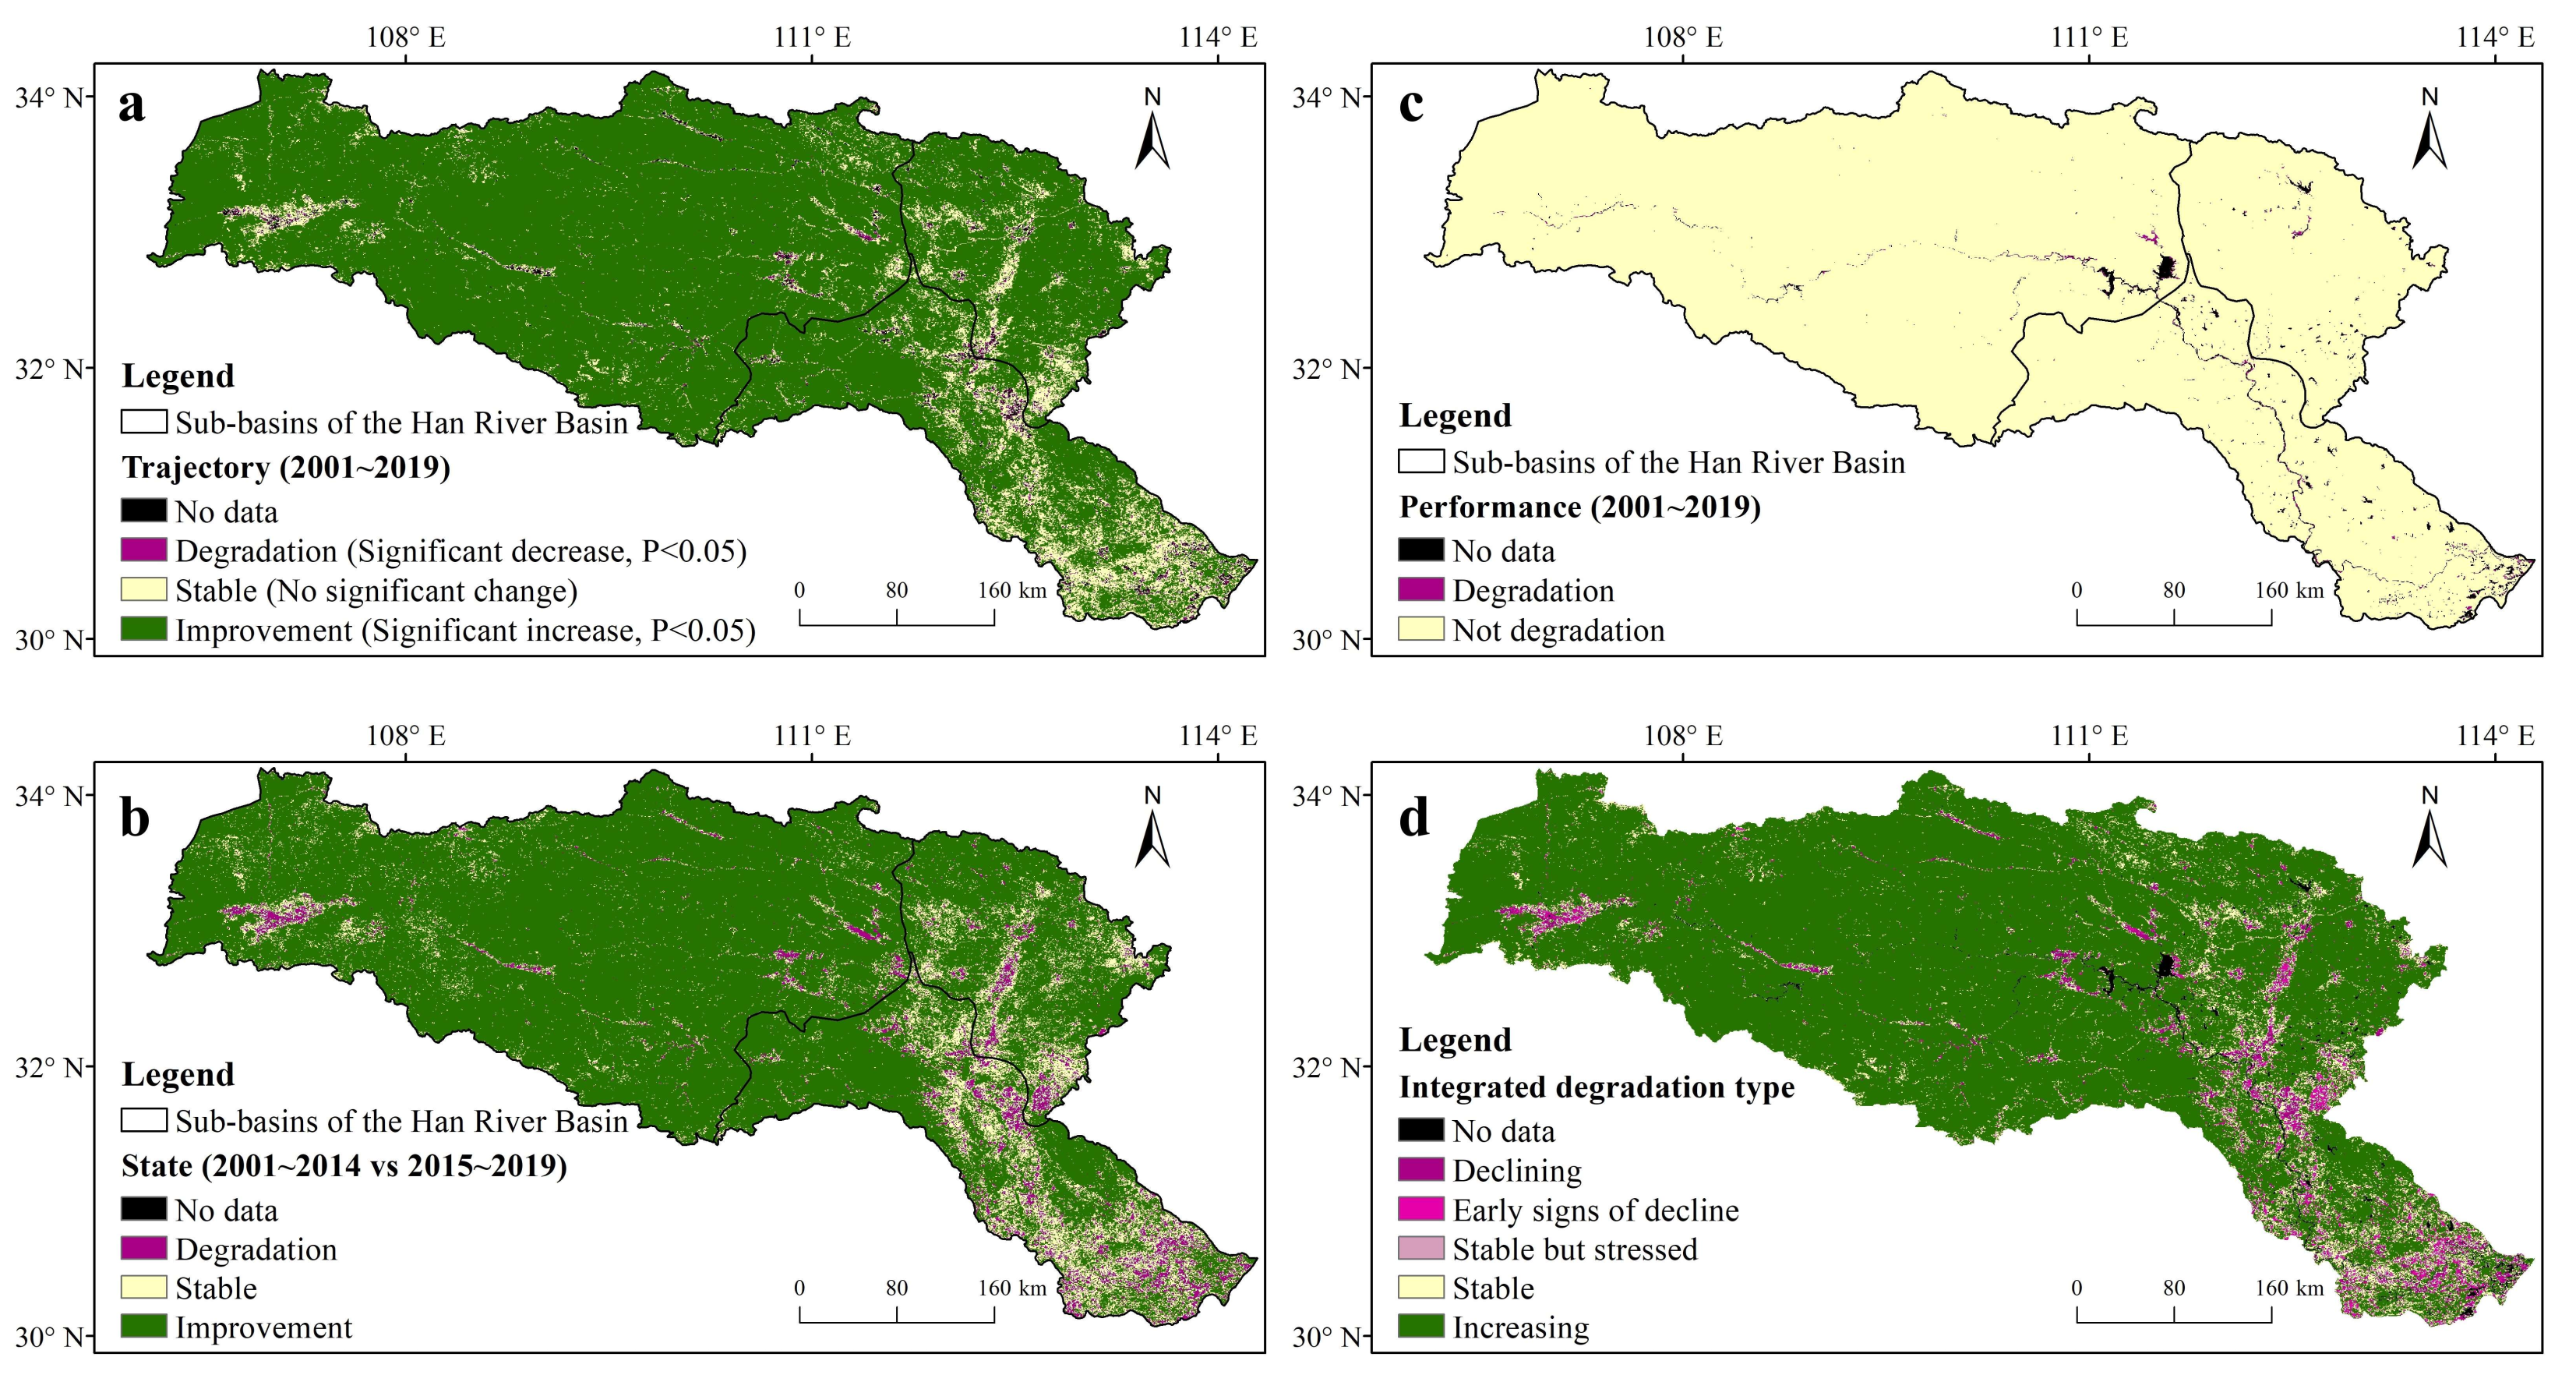
- Land productivity assessment based on Trends.Earth—the MODIS NDVI dataset (MOD13Q1) was chosen to estimate land productivity in the Han River Basin from 2001 to 2019, which can be implemented in the Trends.Earth plugin of QGIS 3.16 software. It was obtained by integrating three categories of trajectory, state, and performance according to the rules in Table 2. Figure 6 presents the spatial distribution of land productivity in the Han River Basin from 2001 to 2019 using this method. In this study, the state was computed using 2001–2014 as the baseline period and 2015–2019 as the comparison period to compare a region’s current productivity with its past productivity. Specifically, three integrated degradation types, including stable, stable but under pressure, and early signs of decline, were combined as STABLE; the integrated degradation type of increasing was classified as IMPROVEMENT; the integrated degradation type of declining was labeled as DEGRADATION.
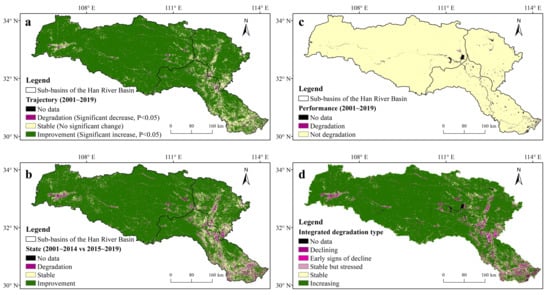 Figure 6. Trajectory (a), state (b), performance (c), and integrated degradation type of land productivity (d) in the Han River Basin of China from 2001 to 2019 calculated by Trends.Earth.
 - (2)
- Land productivity assessment based on sustainability pattern—the sustainability analysis of land NPP presented in Figure 5 was taken for land productivity estimation. Specifically, three sustainability patterns of land NPP, including continuously and highly significant increase, continuously significant increase, and reverse continuously significant decrease, were combined as IMPROVEMENT; four sustainability patterns, covering continuously and highly significant decrease, continuously significant decrease, reverse continuously and highly significant increase, and reverse continuously significant increase, were merged as DEGRADATION; two sustainability patterns, involving continuously no significant change and reverse continuously no significant change, were grouped as STABLE.
- (3)
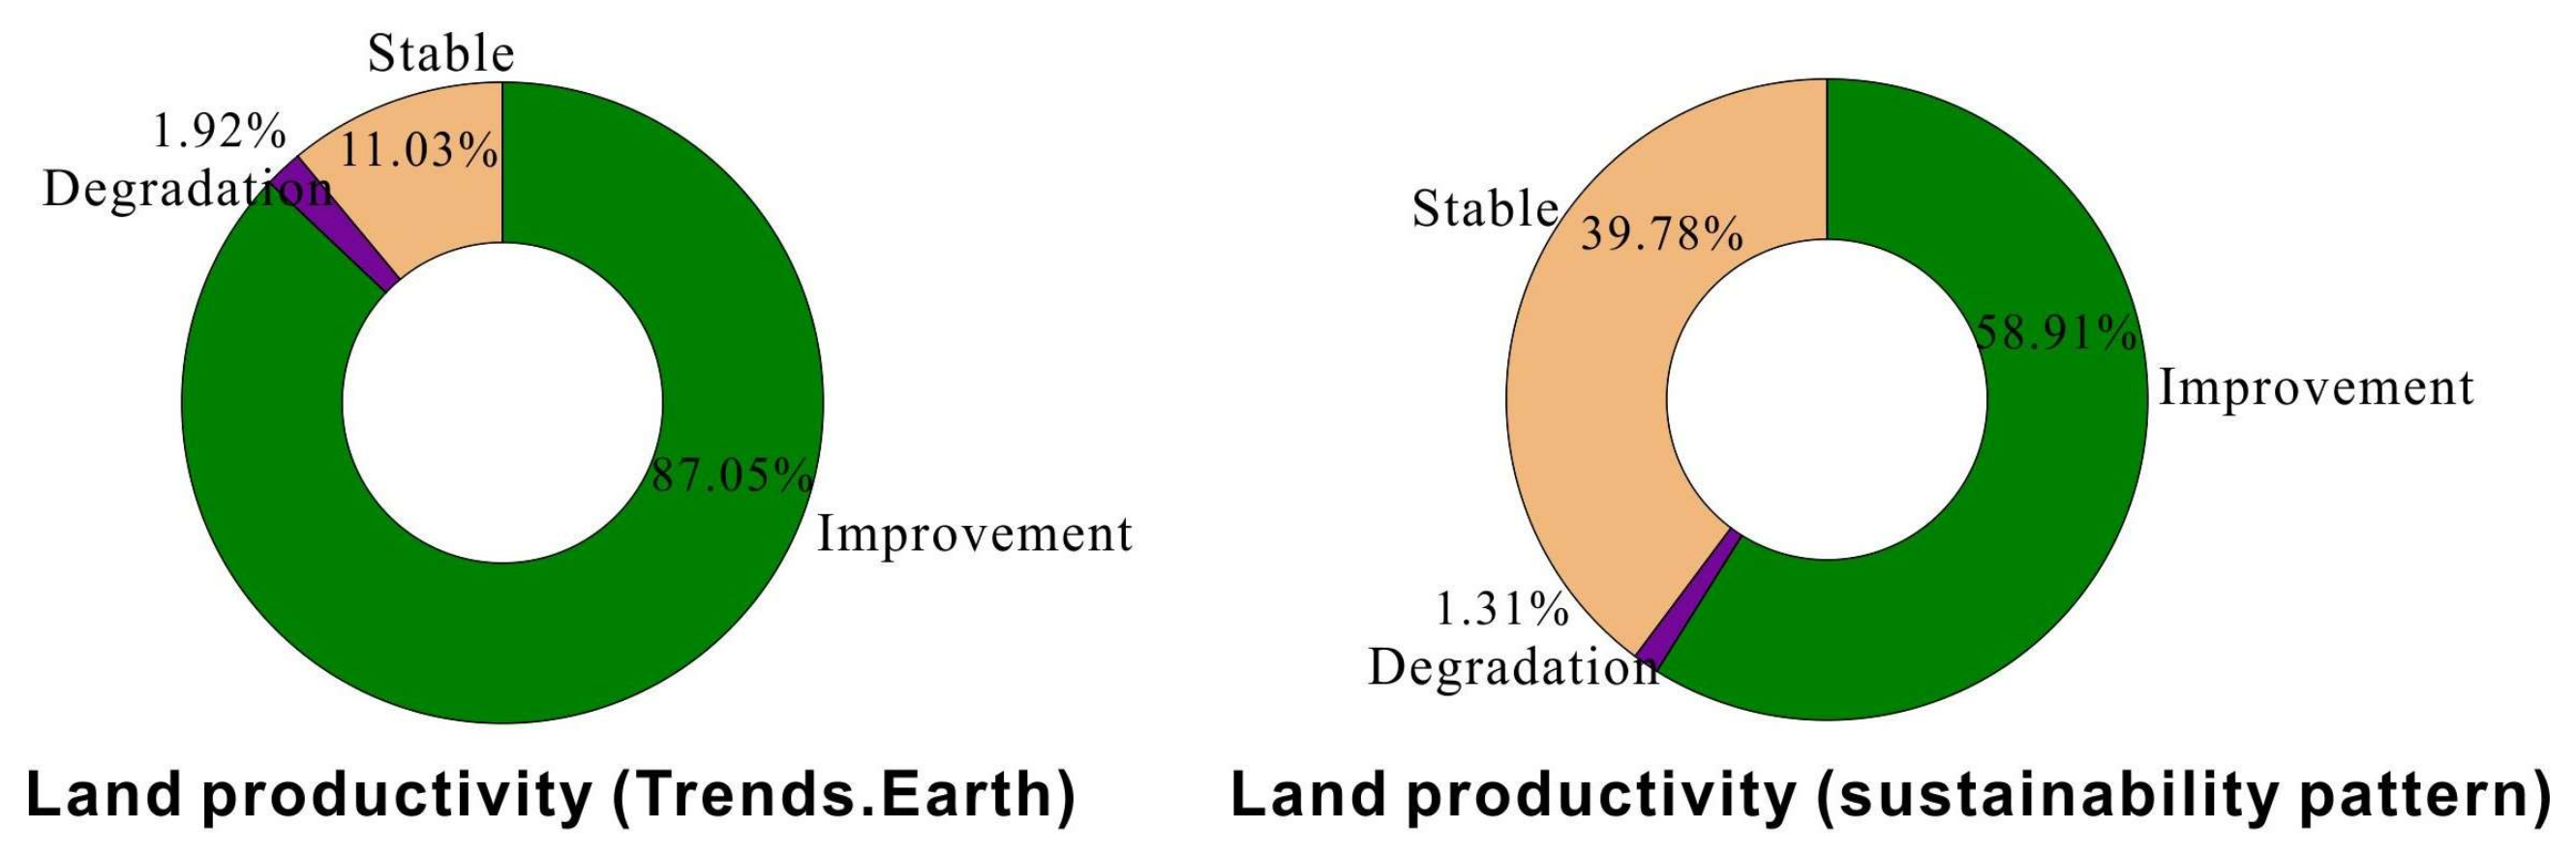
- Comparison of the results obtained using the above two methods—the DEGRADATION land estimated by the two methods was broadly consistent, but the assessments of IMPROVEMENT and STABLE presented some differences. (Figure 7). Specifically, the percentages of IMPROVEMENT, DEGRADATION, and STABLE in the Trends.Earth method were 87.05%, 1.92%, and 11.03%, respectively; the percentages of those in the sustainability pattern method were 58.90%, 1.32%, and 39.78%, respectively. Because certain land defined as IMPROVEMENT by Trends.Earth was classified as STABLE by the sustainability pattern method.
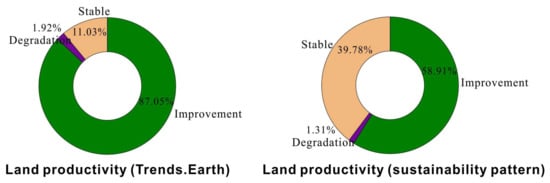 Figure 7. Comparison of land productivity assessment results between two methods—the Trends.Earth method and the sustainability pattern method.
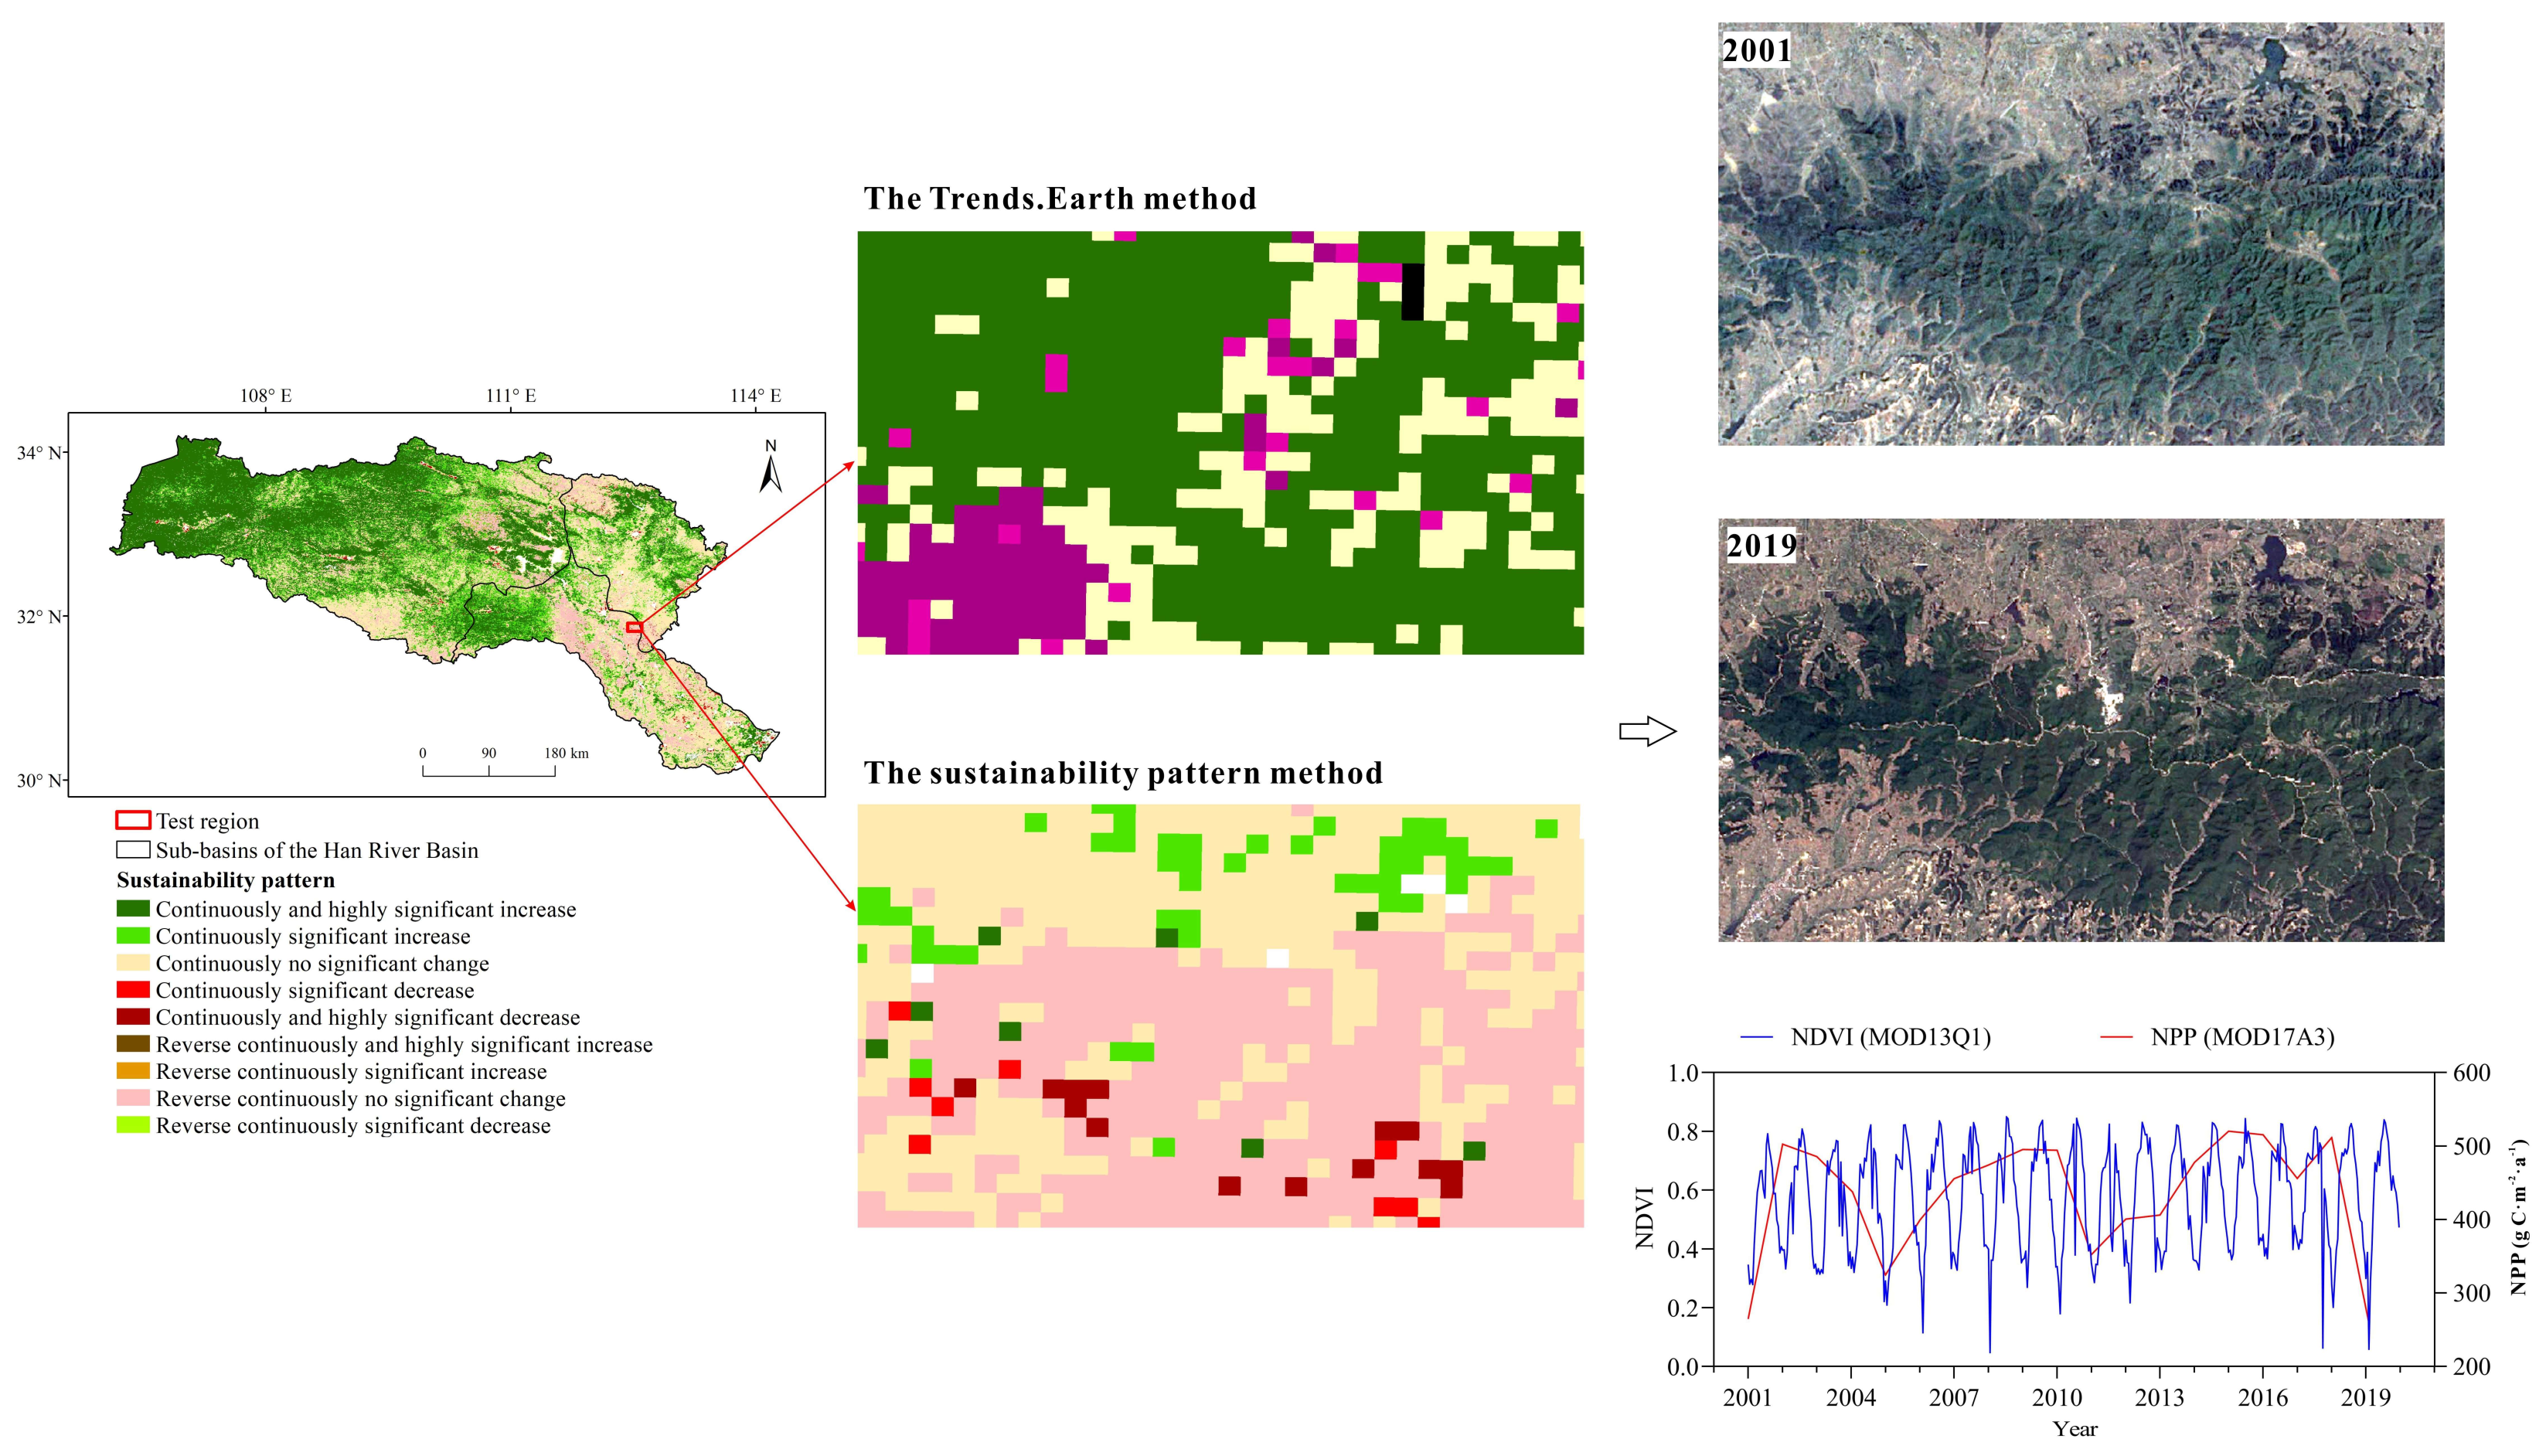
In addition, this study chose a test area to investigate the above differences (Figure 8). The test region was defined as IMPROVEMENT in the Trends.Earth method but classified as STABLE in the sustainability pattern method. We discovered that the test region is mostly in a more stable state from the Google Earth images in 2001 and 2019. The Trends.Earth method appeared to overestimate IMPROVEMENT and DEGRADATION lands. As a result, the conclusions drawn from the sustainability pattern method were more reasonable. One explanation could be the data source for assessing land productivity. The Trends.Earth method was based on annual NDVI obtained from MOD13Q1, while the sustainability pattern method was based on annual NPP generated from MOD17A3. It is worth emphasizing that, according to the UNCCD-LDN scientific framework [67], the assessment of land improvement or land degradation must exactly correspond to the time period under consideration. In this study, the Trends.Earth compared the current productivity of an area with its past productivity using the period 2001–2014 as the baseline period and the period 2015–2019 as the comparison period. Thus, there may be cases where the assessment leads to an improvement, yet in reality it is still in the process of degradation. Therefore, it is essential to recognize that despite the positive results derived from the Trends.Earth method, land degradation in the Han River Basin could be severe. The methodological framework for land productivity monitoring should be upgraded in the future, thus serving to achieve a higher level of LDN by 2030.

Figure 8.
Comparison of land productivity assessment results, Google Earth images, and data sources between the Trends.Earth method and the sustainability pattern method in the test region.
4.2. Key Drivers of Land NPP Change
Climate variability and human activity are commonly regarded as the two main components influencing land NPP change. OLS regression was firstly applied to identify potential explanatory variables. The dependent variable was the increase in land NPP in the Han River Basin from 2001 to 2019, and the independent variables were seven influencing factors: temperature, precipitation, elevation, slope, forest cover, population count, and human modification. OLS regression results revealed that none of the seven explanatory factors had a VIF value above 10, indicating that these independent variables had only minimal covariances. In addition, with the exception of temperature, slope, and forest cover, the other four independent variables passed the significance test at the 5% level. As a result, these four variables were included in the OLS regression.
The presence of spatial correlation between the variables is a requirement for using the GWR model. Moran’s I values were used to pre-test the spatial correlation of the associated variables. We examined the spatial autocorrelation of the standardized residuals for all grids and found that the standard deviations predicted by the GWR model were spatially randomly distributed, with a Moran’s I value of 0.009 and a z-score of 0.956. Therefore, the overall simulation effect of the model is favorable. It is reasonable and feasible to apply the GWR model to evaluate the factors influencing land NPP change in the Han River Basin.
Table 3 compares the key metrics associated with fit statistics for the global model (OLS), GWR, and MGWR. The MGWR model had a smaller AIC, a slightly larger adjusted R2, and richer bandwidths than OLS and GWR. Therefore, MGWR outperformed the other two models in fitting the drivers of land NPP change in the Han River Basin.
Table 3.
Fit statistics for OLS, GWR, and MGWR models.
The variable bandwidth measures the spatial scale of each process. It captures the difference in the scale of action of natural and socio-economic influences on land NPP. The larger the scale of action, the lower the spatial heterogeneity of influencing factors. On the contrary, the more pronounced the spatial heterogeneity. Based on the results of the MGWR model, among the natural factors, the scales of action of precipitation and elevation were 51 and 5794 (Table 3), respectively. The effect of precipitation on land NPP change indicated a high degree of spatial heterogeneity. The scale of action of elevation was proportional to the sample size. It was a global variable with low spatial heterogeneity, and the effect of elevation on land NPP change was broadly consistent throughout the basin. There was significant spatial heterogeneity in the effect of human factors on land NPP change, with a scale of 485 for population count and 645 for human modification (Table 3).
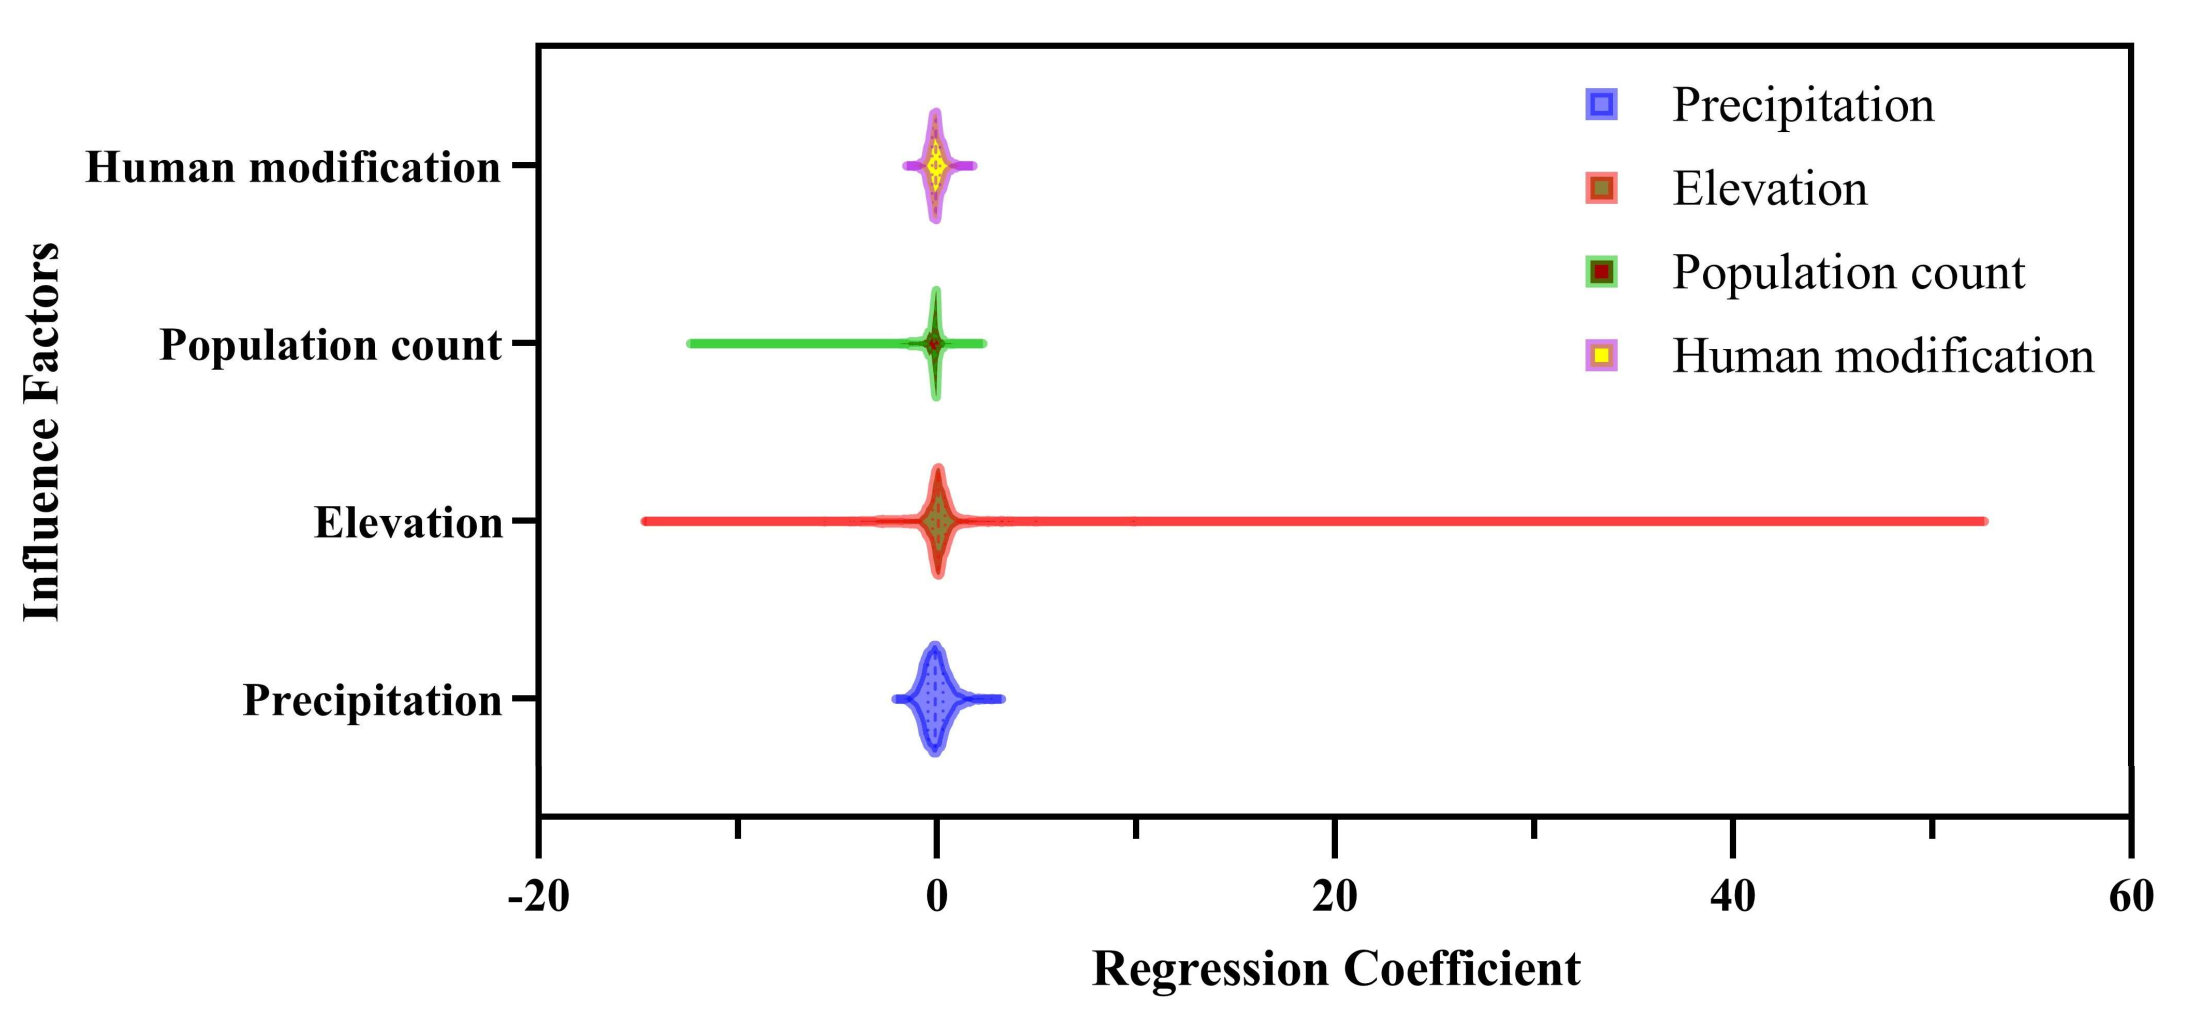
The violin plot of regression coefficients of the influencing factors of the MGWR model (Figure 9) shows both positive and negative effects on land NPP change. The increase in population count had an overall negative effect on land NPP (19.42% positive, 80.58% negative), and the negative effect was substantial. In contrast, the increase in elevation had an overall positive effect on land NPP (59.15% positive, 40.85% negative), though the positive effect was not strong, whereas the polarization was pronounced. Besides, precipitation and human modification had bi-directional effects on land NPP, with relatively equivalent positive and negative effects, but generally negative. In general, precipitation, population count, and human modification all exhibited inhibitory effects on the increase in land NPP except for elevation.

Figure 9.
Distribution of regression coefficients of influence factors of the MGWR model.
Figure 10 demonstrates the factors that exerted the most significant influence on land NPP change for each grid. It was found that the dominant factors influencing vegetation growth varied with geographic location. Each influencing factor was both positively and negatively correlated with land NPP change. The results showed that precipitation and population count were the dominant factors in most regions, accounting for 65.16% and 23.23% of the basin area, respectively. Specifically, the northern, north-western, and southern parts of the basin were mainly influenced by population count, while the central and south-eastern regions were primarily affected by precipitation.
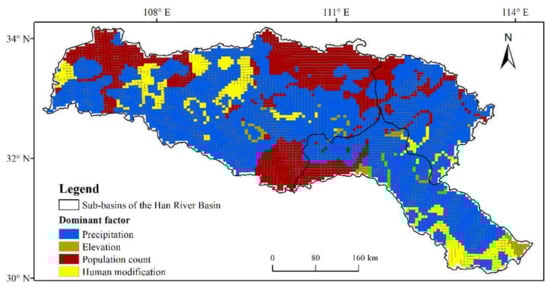
Figure 10.
Regional differences in the dominant factors of land NPP change in the Han River Basin of China from 2001 to 2019.
4.3. Further Research
The 2030 Sustainable Development Goals (SDGs) are currently less than 10 years away. Given the long time it takes for ecosystems to recover from conservation to benefits, only urgent and effective action to halt and reverse global land degradation will make it possible to meet the growing global demand for agriculture and, thus, achieve the 2030 SDGs. Focusing on the lack of methodology in assessing SDG 15.3 progress, this paper used an internationally shared dataset to enable the tracking and monitoring of SDG 15.3.1 indicators to evaluate trends in the growth trend of LDN in the Han River Basin. The study can provide important information to support the understanding of SDG 15.3 achievement at a regional scale. The methodology adopted in this paper can also be replicated and operationalized on a global scale. The results are globally consistent and comparable, which can help to clarify the global contribution of LDN growth in the region.
The findings of this paper on the achievement and trends of LDN growth in the Han River Basin are broadly consistent with those of Zhang and Ren (2016) [43] on the spatial distribution and temporal trends of land productivity. The NPP data in both studies were based on the MOD17A3 dataset, which was obtained using a model combining ecological processes and remote sensing data (Biome-BGC model). The MOD17A3 NPP dataset compensates to some extent for the deficiencies of ecophysiological models in non-homogeneous regions and helps provide feedback on regional land productivity, carbon sink capacity, and ecosystem quality. The multi-year average of land NPP derived in this study (486 g C·m−2·a−1) was higher than that gained by Zhang and Ren (2016) [43] (439 g C·m−2·a−1), mainly due to the inconsistent time period. This study was based on 2001–2019, whereas their work was based on 2000–2012. Therefore, this study better represented the impact of the implementation of China’s South-to-North Water Diversion Project (the middle route started supplying water on 12 December 2014) on land NPP and the ecology of the water source area.
This paper explored the drivers of land NPP change and their spatial differentiation using an MGWR model based on regular grids, which helps identify the dominant influencing factors at given locations. The study reflected that land NPP change in the Han River Basin resulted from a combination of natural elements and human activities. Changes in land NPP are usually nonlinear and are often influenced by multiple factors. Most previous studies have explored the influence of climatic factors on land NPP changes [34,41,42,44], while the combined effects of climate change and human activities have been less considered [43]. The study by Zhang and Ren (2016) [43] elaborated the effects of temperature, precipitation, elevation, slope, and human activities, respectively. Their finding that the precipitation had a more substantial impact on land NPP than the temperature was consistent with present studies [42,43,68]. However, these studies were more oriented toward descriptive statistical analysis and did not spatially elucidate the dominant factors of spatial differentiation. Therefore, there were similarities and differences in the conclusions. Several studies have discussed anthropogenic impact concerning land-use patterns or land-use intensity [30,31,32,33], but there is no direct relationship between land NPP and land use. Land NPP may remain constant for land-use changes, while land use may stay the same for land NPP changes.
Baseline determination and dynamic monitoring of degraded land are key tasks in achieving SDG target 15.3 (LDN) [8], which can be directly used to assess the progress of LDN and provide support for land-use planning. Further research can be geared toward the demand for geographic data at different spatial scales in the assessment of SDG 15.3 progress. This work could take advantage of big data platforms to provide better support for data, products, and tools. The development of cloud-based SDG 15.3.1 online tools will be an essential part of the geodata support in the LDN assessment. By interfacing with multiple data calculation engines and data environments, users will be provided with online SDG 15.3.1 indicator calculations and integrated assessments based on areas of interest. This is particularly important for the monitoring and assessment of SDG 15.3 in less developed countries and regions.
5. Conclusions
The spatial–temporal trends and sustainability characteristics of land NPP change in the Han River Basin from 2001 to 2019 were investigated based on the MOD17A3 NPP dataset obtained from GEE. The main drivers of land NPP change and their spatial differences were quantified as well. The results are presented below.
- (1)
- The multi-year average of land NPP was 486 g C·m−2·a−1 in the Han River Basin from 2001 to 2019, with the highest in 2015 and the lowest in 2001. The interannual variation of land NPP exhibited a fluctuating upward trend, with a more pronounced growth rate from 2001 to 2010 than from 2011 to 2019. The growth rate of land NPP in the upper reaches was faster than the basin-wide average, while the growth rates in the middle and lower reaches were slower than the basin-wide average.
- (2)
- The spatial heterogeneity of land NPP was evident, with high values in the west and low values in the east. Of the basin area, with NPP values between 400 and 600 g C·m−2·a−1, 66.15% was concentrated in the middle and upper reaches of the basin. Land NPP was highest in the watershed above Danjiangkou, followed by the mainstream watershed below Danjiangkou, and lowest in the Tangbai River Watershed. The Theil–Sen slope of land NPP in the Han River Basin from 2001 to 2019 ranged from −33 to 20 g C·m−2·a−1. Of the basin area, 57.82% presented a significant increase in land NPP, 0.96% showed a significant decrease, and 41.23% exhibited no significant change. In general, series with continuously significant increases in sustainability pattern of land NPP change were far more than those with continuously significant decreases. Land NPP in the Han River Basin will present sustained growth in the future.
- (3)
- It was broadly consistent in the estimation of DEGRADATION between the Trends.Earth method and the sustainability pattern method. However, there were some differences in the assessment of IMPROVEMENT and STABLE, because certain land defined as IMPROVEMENT by Trends.Earth was classified as STABLE by the sustainability pattern method.
- (4)
- The MGWR model outperformed the global OLS and GWR models in fitting the drivers of land NPP change in the Han River Basin. There are regional differences in the main factors influencing land NPP change. Precipitation and population count were the dominant factors in most regions, and the population count shows a significant inhibitory effect on the growth of land NPP. In practice, a zoning approach should be adopted to develop differentiated vegetation restoration and conservation programs for specific regions.
The assessment approach proposed in this study can provide a methodological framework and examples of regional practice that can enable track progress of LDN and the socio-ecological sustainable development of the basin.
Author Contributions
Conceptualization, Y.H. and C.W.; methodology, Y.H.; software, Y.H.; validation, Y.H., C.W. and X.Y.; formal analysis, Y.H.; investigation, X.Y.; resources, Y.H.; data curation, C.W.; writing—original draft preparation, Y.H.; writing—review and editing, C.W. and S.Y.; visualization, Y.H.; supervision, X.Y.; project administration, C.W.; funding acquisition, C.W. All authors have read and agreed to the published version of the manuscript.
Funding
This research was funded by the National Natural Science Foundation of China, grant number 41704013. C.W. was supported by funding from the Sino-German Scientist Cooperation and Exchange Program (42061134010) and the Special Project on Strategic Pioneering Science and Technology of the Chinese Academy of Sciences (XDA15017700, XDB23030100).
Data Availability Statement
The data that support the findings of this paper are available from the corresponding author upon justifiable request.
Conflicts of Interest
The authors declare no conflict of interest.
References
- Fang, J.Y.; Yu, G.R.; Liu, L.L.; Hu, S.J.; Chapin, F.S. Climate change, human impacts, and carbon sequestration in China. Proc. Natl. Acad. Sci. USA 2018, 115, 4015–4020. [Google Scholar] [CrossRef] [Green Version]
- Chen, T.T.; Peng, L.; Liu, S.Q.; Wang, Q. Spatio-temporal pattern of net primary productivity in Hengduan Mountains area, China: Impacts of climate change and human activities. Chin. Geogr. Sci. 2017, 27, 948–962. [Google Scholar] [CrossRef] [Green Version]
- Jones, M.O.; Running, S.W.; Kimball, J.S.; Robinson, N.P.; Allred, B.W. Terrestrial primary productivity indicators for inclusion in the National Climate Indicators System. Clim. Chang. 2018, 163, 1855–1868. [Google Scholar] [CrossRef]
- Alma, M.P.; Rogelio, C.N.; Florian, K.; Sylvain, L.; Piera, P. Identifying effects of land use cover changes and climate change on terrestrial ecosystems and carbon stocks in Mexico. Glob. Environ. Chang. 2018, 53, 12–23. [Google Scholar]
- Li, P.; Peng, C.H.; Wang, M.; Li, W.Z.; Zhao, P.X.; Wang, K.F.; Yang, Y.Z.; Zhu, Q.A. Quantification of the response of global terrestrial net primary production to multifactor global change. Ecol. Indic. 2017, 76, 245–255. [Google Scholar] [CrossRef]
- Wen, Y.Y.; Liu, X.P.; Bai, Y.; Sun, Y.; Yang, J.; Lin, K.; Pei, F.S.; Yan, Y.C. Determining the impacts of climate change and urban expansion on terrestrial net primary production in China. J. Environ. Manag. 2019, 240, 75–83. [Google Scholar] [CrossRef]
- Prăvălie, R. Exploring the multiple land degradation pathways across the planet. Earth-Sci. Rev. 2021, 220, 103689. [Google Scholar] [CrossRef]
- Prince, S.D. Challenges for remote sensing of the Sustainable Development Goal SDG 15.3.1 productivity indicator. Remote Sens. Environ. 2019, 234, 111428. [Google Scholar] [CrossRef]
- Sims, N.C.; England, J.R.; Newnham, G.J.; Alexander, S.; Green, C.; Minelli, S.; Held, A. Developing good practice guidance for estimating land degradation in the context of the United Nations Sustainable Development Goals. Environ. Sci. Policy 2019, 92, 349–355. [Google Scholar] [CrossRef]
- Khalifa, M.; Elagib, N.A.; Ribbe, L.; Schneider, K. Spatio-temporal variations in climate, primary productivity and efficiency of water and carbon use of the land cover types in Sudan and Ethiopia. Sci. Total Environ. 2018, 624, 790–806. [Google Scholar] [CrossRef] [PubMed]
- Forkel, M.; Carvalhais, N.; Rodenbeck, C.; Keeling, R.; Heimann, M.; Thonicke, K.; Zaehle, S.; Reichstein, M. Enhanced seasonal CO2 exchange caused by amplified plant productivity in northern ecosystems. Science 2016, 351, 696–699. [Google Scholar] [CrossRef] [Green Version]
- You, N.S.; Dong, J.W.; Xiao, T.; Liu, J.Y.; Xiao, X.M. The effects of the ”Grain for Green” project on gross primary productivity in the Loess Plateau. Sci. Geogr. Sin. 2020, 40, 315–323. [Google Scholar]
- Zhang, Y.; Zhang, C.B.; Wang, Z.Q.; Yang, Y.; Zhang, Y.Z.; Li, J.L.; An, R. Quantitative assessment of relative roles of climate change and human activities on grassland net primary productivity in the Three-River Source Region, China. Acta Prataculturae Sin. 2017, 26, 1–14. [Google Scholar]
- Piao, S.L.; Liu, Z.; Wang, T.; Peng, S.S.; Ciais, P.; Huang, M.T.; Ahlstrom, A.; Burkhart, J.F.; Chevallier, F.; Janssens, I.A.; et al. Weakening temperature control on the interannual variations of spring carbon uptake across northern lands. Nat. Clim. Change 2017, 7, 359–363. [Google Scholar] [CrossRef]
- Clark, D.A.; Brown, S.; Kicklighter, D.W.; Chambers, J.Q.; Thomlinson, J.R.; Ni, J. Measuring net primary production in forests: Concepts and field methods. Ecol. Appl. 2001, 11, 356–370. [Google Scholar] [CrossRef]
- Sun, J.W.; Guan, D.X.; Wu, J.B.; Jin, C.J.; Yuan, F.H. Research advances in net primary productivity of terrestrial vegetation. World For. Res. 2012, 25, 1–6. [Google Scholar]
- Wang, Y.; Xia, W.T.; Liang, T.G. Research progress on spatial-temporal dynamic simulation model of net primary productivity of terrestrial ecosystems. Pratacultural Sci. 2010, 27, 77–88. [Google Scholar]
- Zhu, W.Q.; Pan, Y.Z.; Zhang, J.S.; Zhu, W.Q.; Pan, Y.Z.; Zhang, J.S. Estimation of net primary productivity of Chinese terrestrial vegetation based on remote sensing. Chin. J. Plant Ecol. 2007, 31, 413–424. [Google Scholar]
- Zhao, J.F.; Yan, X.D.; Zhu, Y.J. Advance in research on net primary productivity of terrestrial vegetation. J. Desert Res. 2007, 27, 780–786. [Google Scholar]
- Ardö, J.; Tagesson, T.; Jamali, S.; Khatir, A. MODIS EVI-based net primary production in the Sahel 2000–2014. Int. J. Appl. Earth Obs. 2018, 65, 35–45. [Google Scholar] [CrossRef]
- Yu, T.; Sun, R.; Xiao, Z.Q.; Zhang, Q.; Liu, G.; Cui, T.X.; Wang, J.M. Estimation of global vegetation productivity from Global LAnd Surface Satellite. Remote Sens. 2018, 10, 327. [Google Scholar] [CrossRef] [Green Version]
- Turner, D.P.; Ritts, W.D.; Cohen, W.B.; Gower, S.T.; Running, S.W.; Zhao, M.S.; Costa, M.H.; Kirschbaum, A.A.; Ham, J.M.; Saleska, S.R. Evaluation of MODIS NPP and GPP products across multiple biomes. Remote Sens. Environ. 2006, 102, 282–292. [Google Scholar] [CrossRef]
- He, Y.; Piao, S.L.; Li, X.Y.; Chen, A.P.; Qin, D.H. Global patterns of vegetation carbon use efficiency and their climate drivers deduced from MODIS satellite data and process-based models. Agric. Forest Meteorol. 2018, 256–257, 150–158. [Google Scholar] [CrossRef]
- Liu, Y.Y.; Yang, Y.; Wang, Q.; Du, X.L.; Li, J.L.; Gang, C.C.; Zhou, W.; Wang, Z.Q. Evaluating the responses of net primary productivity and carbon use efficiency of global grassland to climate variability along an aridity gradient. Sci. Total Environ. 2019, 652, 671–682. [Google Scholar] [CrossRef] [PubMed]
- Peng, D.L.; Zhang, B.; Wu, C.Y.; Huete, A.R.; Gonsamo, A.; Lei, L.P.; Ponce-Campos, G.E.; Liu, X.J.; Wu, Y.H. Country-level net primary production distribution and response to drought and land cover change. Sci. Total Environ. 2017, 574, 65–77. [Google Scholar] [CrossRef] [PubMed]
- Berkoff, J. China: The South–North Water Transfer Project—Is it justified? Water Policy 2003, 5, 1–28. [Google Scholar] [CrossRef]
- Zhu, Y.P.; Zhang, H.P.; Chen, L.; Zhao, J.F. Influence of the South-North Water Diversion Project and the mitigation projects on the water quality of Han River. Sci. Total Environ. 2008, 406, 57–68. [Google Scholar] [CrossRef]
- Zhang, Q.F.; Xu, Z.F.; Shen, Z.H.; Li, S.Y.; Wang, S.S. The Han River watershed management initiative for the South-to-North Water Transfer project (Middle Route) of China. Environ. Monit. Assess. 2009, 148, 369–377. [Google Scholar] [CrossRef]
- Cai, S.M.; Chen, G.J.; Du, Y.; Wu, Y.J. Thoughts on sustainable development in the basin of Hanjiang River. Res. Environ. Yangtze Basin 2000, 9, 411–418. [Google Scholar]
- Shen, Z.H.; Zhang, Q.F.; Yue, C.; Zhao, J.; Hu, Z.W.; Lü, N.; Tang, Y.Y. The spatial pattern of land use/land cover in the water supplying area of the Middle-Route of the South-to-North Water Diversion (MR-SNWD) Project. Acta Geogr. Sin. 2006, 61, 633–644. [Google Scholar]
- Liao, W.; Li, L.; Wu, Y.J.; Shi, Z.H. Land use change and eco-environmental vulnerability evaluation in the Danjiangkou Reservoir Area. J. Nat. Res. 2011, 26, 1879–1889. [Google Scholar]
- Qi, W.H.; Li, H.R.; Zhang, Q.F.; Zhang, K.R. Forest restoration efforts drive changes in land-use/land-cover and water-related ecosystem services in China’s Han River basin. Ecol. Eng. 2019, 126, 64–73. [Google Scholar] [CrossRef]
- Pan, P.P.; Yang, G.S.; Su, W.Z. Progress on effects of land use change on land productivity. Prog. Geogr. 2012, 31, 539–550. [Google Scholar]
- Cui, L.L.; Shi, J.; Xiao, F.J. Impacts of climatic factors and El Nio/La Nia events on the changes of terrestrial ecosystem NPP in China. Acta Geogr. Sin. 2018, 73, 54–66. [Google Scholar]
- Rafique, R.; Zhao, F.; de Jong, R.; Zeng, N.; Asrar, G.R. Global and regional variability and change in terrestrial ecosystems net primary production and NDVI: A model-data comparison. Remote Sens. 2016, 8, 177. [Google Scholar] [CrossRef] [Green Version]
- Volkova, L.; Roxburgh, S.H.; Weston, C.J.; Benyon, R.G.; Sullivan, A.L.; Polglase, P.J. Importance of disturbance history on net primary productivity in the world’s most productive forests and implications for the global carbon cycle. Glob. Chang. Biol. 2018, 24, 4293–4303. [Google Scholar] [CrossRef]
- Li, J.; Wang, Z.L.; Lai, C.G.; Wu, X.Q.; Zeng, Z.Y.; Chen, X.H.; Lian, Y.Q. Response of net primary production to land use and land cover change in mainland China since the late 1980s. Sci. Total Environ. 2018, 639, 237–247. [Google Scholar] [CrossRef]
- Wang, X.; Tan, K.; Chen, B.Z.; Du, P.J. Assessing the spatiotemporal variation and impact factors of net primary productivity in China. Sci. Rep. 2017, 7, 44415. [Google Scholar] [CrossRef] [Green Version]
- Bu, H.M.; Dang, H.S.; Zhang, Q.F. Impacts of forest vegetation on water environment of the Jinshui River Basin in the Upper Han River. Acta Ecol. Sin. 2010, 30, 1341–1348. [Google Scholar]
- Wang, X.; Li, Z.B.; Li, P. Vegetation succession on retired croplands during their recovery processes in Dan-Han River Watershed of Shaanxi Province, Northwest China. Chin. J. Appl. Ecol. 2012, 23, 347–356. [Google Scholar]
- Li, X.Y. Time-dalayed correlation analysis between vegetation cover changes and climatic factors in Hanjiang River Basin. Bull. Soil Water Conserv. 2013, 33, 268–270. [Google Scholar]
- Zhang, J.; Fu, H.Y.; Qin, G.W. Spatio-temporal changes of farmland productivity in Hanjiang River Basin. J. Northwest Norm. Univ. (Nat. Sci.) 2018, 54, 128–134. [Google Scholar]
- Zhang, J.; Ren, Z.Y. Spatiotemporal pattern of net primary productivity in the Hanjiang River Basin. Acta Ecol. Sin. 2016, 36, 7667–7677. [Google Scholar]
- Jia, X.F.; Zhu, H.C.; Ling, F.; Zhang, Y.H.; Wang, L.H.; Du, Y. Forest cover monitoring and its changes in Hanjiang River Basin based on Landsat multispectral and PALSAR/PALSAR-2 data. Res. Environ. Yangtze Basin 2021, 30, 321–329. [Google Scholar]
- Zhang, X.; Deng, Z.M.; Li, D.; Xiao, Y.; Zhu, C.R. Simulation of hydrological response to land use/cover change in Hanjiang Basin. Res. Environ. Yangtze Basin 2014, 23, 1449–1455. [Google Scholar]
- Gao, Y.L.; Li, H.B. Influence of landscape pattern change on soil erosion in Han River Basin. Acta Ecol. Sin. 2021, 41, 2248–2260. [Google Scholar]
- Dong, J.W.; Xiao, X.M.; Menarguez, M.A.; Zhang, G.L.; Qin, Y.W.; Thau, D.; Biradar, C.; Moore, B. Mapping paddy rice planting area in northeastern Asia with Landsat 8 images, phenology-based algorithm and Google Earth Engine. Remote Sens. Environ. 2016, 185, 142–154. [Google Scholar] [CrossRef] [Green Version]
- Hansen, M.C.; Potapov, P.V.; Moore, R.; Hancher, M.; Turubanova, S.A.; Tyukavina, A.; Thau, D.; Stehman, S.V.; Goetz, S.J.; Loveland, T.R.; et al. High-resolution global maps of 21st-century forest cover change. Science 2013, 342, 850–853. [Google Scholar] [CrossRef] [Green Version]
- Huang, H.B.; Chen, Y.L.; Clinton, N.; Wang, J.; Wang, X.Y.; Liu, C.X.; Gong, P.; Yang, J.; Bai, Y.Q.; Zheng, Y.M.; et al. Mapping major land cover dynamics in Beijing using all Landsat images in Google Earth Engine. Remote Sens. Environ. 2017, 202, 166–176. [Google Scholar] [CrossRef]
- Lobell, D.B.; Thau, D.; Seifert, C.; Engle, E.; Little, B. A scalable satellite-based crop yield mapper. Remote Sens. Environ. 2015, 164, 324–333. [Google Scholar] [CrossRef]
- Pekel, J.F.; Cottam, A.; Gorelick, N.; Belward, A.S. High-resolution mapping of global surface water and its long-term changes. Nature 2016, 540, 418–422. [Google Scholar] [CrossRef] [PubMed]
- Robinson, N.P.; Allred, B.W.; Smith, W.K.; Jones, M.O.; Moreno, A.; Erickson, T.A.; Naugle, D.E.; Running, S.W.; Pettorelli, N.; Paruelo, J. Terrestrial primary production for the conterminous United States derived from Landsat 30 m and MODIS 250 m. Remote Sens. Ecol. Conserv. 2018, 4, 264–280. [Google Scholar] [CrossRef]
- Wang, D.; Wu, D.D.; Xie, X.B.; Li, X.H. Study on spatio-temporal variation of runoff in flood season in Hanjiang River Basin. Pearl River 2020, 41, 30–39. [Google Scholar]
- Zhao, W.Q.; Du, H.M.; Dong, T.X.; Hu, L.L. Temporal-spatial characteristics of the vegetation net primary production in the farming-pastoral eco-tone of southern China during 2005–2014. Res. Soil Water Conserv. 2018, 25, 240–245. [Google Scholar]
- Sen, P.K. Estimates of the regression coefficient based on Kendall’s tau. J. Am. Stat. Assoc. 1968, 63, 1379–1389. [Google Scholar] [CrossRef]
- Kendall, M.G. Rank correlation methods. Biometrika 1957, 44, 298. [Google Scholar] [CrossRef]
- Hurst, H.E. Long-term storage capacity of reservoirs. T. Am. Soc. Civil Eng. 1951, 116, 770–799. [Google Scholar] [CrossRef]
- Mandelbrot, B.B.; Wallis, J.R. Robustness of the rescaled range R/S in the measurement of noncyclic long run statistical dependence. Water Resour. Res. 1969, 5, 967–988. [Google Scholar] [CrossRef]
- Liu, X.F.; Zhu, X.F.; Pan, Y.Z.; Li, S.S.; Ma, Y.Q.; Nie, J. Vegetation dynamics in Qinling-Daba Mountains in relation to climate factors between 2000 and 2014. J. Geogr. Sci. 2016, 26, 45–58. [Google Scholar] [CrossRef] [Green Version]
- Gonzalez-Roglich, M.; Zvoleff, A.; Noon, M.; Liniger, H.; Fleiner, R.; Harari, N.; Garcia, C. Synergizing global tools to monitor progress towards land degradation neutrality: Trends.Earth and the World Overview of Conservation Approaches and Technologies sustainable land management database. Environ. Sci. Policy 2019, 93, 34–42. [Google Scholar] [CrossRef]
- Shen, T.Y.; Yu, H.C.; Zhou, L.; Gu, H.Y.; He, H.H. On hedonic price of second-hand houses in Beijing based on multi-scale geographically weighted regression: Scale law of spatial heterogeneity. Econ. Geogr. 2020, 40, 75–83. [Google Scholar]
- Brunsdon, C.; Fotheringham, A.S.; Charlton, M.E. Geographically weighted regression: A method for exploring spatial nonstationarity. Geogr. Anal. 2010, 28, 281–298. [Google Scholar] [CrossRef]
- Gong, N.; Niu, Z.G.; Qi, W.; Zhang, H.Y. Driving forces of wetland change in China. J. Remote Sens. 2016, 20, 172–183. [Google Scholar]
- Fotheringham, A.S.; Yue, H.; Li, Z.Q. Examining the influences of air quality in China’s cities using multi-scale geographically weighted regression. T. GIS 2019, 23, 1444–1464. [Google Scholar] [CrossRef]
- Fotheringham, A.S.; Yang, W.B.; Kang, W. Multiscale geographically weighted regression (MGWR). Ann. Am. Assoc. Geogr. 2017, 107, 1247–1265. [Google Scholar] [CrossRef]
- Oshan, T.M.; Smith, J.P.; Fotheringham, A.S. Targeting the spatial context of obesity determinants via multiscale geographically weighted regression. Int. J. Health Geogr. 2020, 19, 1–17. [Google Scholar] [CrossRef]
- Cowie, A.L.; Orr, B.J.; Sanchez, V.M.C.; Chasek, P.; Crossman, N.D.; Erlewein, A.; Louwagie, G.; Maron, M.; Metternicht, G.I.; Minelli, S.; et al. Land in balance: The scientific conceptual framework for Land Degradation Neutrality. Environ. Sci. Policy 2018, 79, 25–35. [Google Scholar] [CrossRef]
- Jiang, C.; Wang, F.; Mu, X.M.; Li, R. Effects of climate changes on Net Primary Productivity (NPP) of vegetation in Han River Basin. J. Northwest Forest. Univ. 2013, 28, 51–57. [Google Scholar]


Publisher’s Note: MDPI stays neutral with regard to jurisdictional claims in published maps and institutional affiliations. |
© 2021 by the authors. Licensee MDPI, Basel, Switzerland. This article is an open access article distributed under the terms and conditions of the Creative Commons Attribution (CC BY) license (https://creativecommons.org/licenses/by/4.0/).