Article

Enhanced Optimization of Bioethanol Production from Palm Waste Using the Taguchi Method

by
Tamer I. M. Ragab
1,*,
Fahad M. Alminderej
2,*,
Wael A. El-Sayed
2,3,
Sayed M. Saleh
2,4 and
Al Shimaa Gamal Shalaby
1
1
Chemistry of Natural and Microbial Products Department, National Research Centre, Cairo 12622, Egypt
2
Department of Chemistry, College of Science, Qassim University, Buraidah 51452, Saudi Arabia
3
Photochemistry Department, National Research Centre, Cairo 12622, Egypt
4
Chemistry Branch, Department of Science and Mathematics, Faculty of Petroleum and Mining Engineering, Suez University, Suez 43721, Egypt
*
Authors to whom correspondence should be addressed.
Sustainability 2021, 13(24), 13660; https://doi.org/10.3390/su132413660
Submission received: 16 November 2021 / Revised: 2 December 2021 / Accepted: 4 December 2021 / Published: 10 December 2021

Abstract

:
In the present study, palm fiber (PF) and palm fronds (PFN) were selected as local agricultural wastes for the extraction of different biopolymers (cellulose, hemicelluloses, and lignin) by alkaline sodium hydroxide (PF, 2.37% NaOH at 86.5 °C for 1.6 h; PFN, 6% NaOH at 90 °C for 1 h) and bioethanol production. The processes of extraction were optimized by the experimental design method of Taguchi. The total carbohydrates of PF and PFN obtained were 24.4% and 31.0%, respectively. In addition, the untreated palm fiber (UPF), untreated palm frond (UPFN), cellulose palm fibers (CPF), and cellulose palm fronds (CPFN) were subjected to enzymatic hydrolysis processes using crude enzymes and commercial enzymes at 48 °C and pH 5.5. The results indicate that the maximum reducing sugars used were CPF 229.90, CPFN 243.69, UPF 120.19, and UPFN 100.00 (mg/g), which were obtained at a crude enzyme loading. CPF and CPFN hydrolysates were then successfully converted into bioethanol by a separate enzymatic hydrolysis and fermentation by Saccharomyces cerevisiae. Anaerobic cultivation of the hydrolysates with S.cerevisiae resulted in 0.222 g/g and 0.213 g/g bioethanol in the case of CPF and CPFN, respectively. Optimization processes could be an innovative approach to the sustainable development of bioethanol production.

1. Introduction

Recently, the use of biomass has become more widespread due to growing global environmental issues and the need for new green biomaterials. During domestic and industrial processing, large amounts of agricultural waste are produced for the manufacture of different goods, creating a major problem of biowaste manufacture. Therefore, the processing of agricultural waste in order to reduce the environmental impacts attributed to discarding it is a crucial task [1]. Important issues are new low-cost methods and techniques for extracting renewable cellulose and its modification to produce a promising value-added derivative of cellulose.
The date palm is the most important agricultural product in the world’s arid zones, particularly in North Africa and the Middle East. There are over 120 million date palms worldwide, which yield millions of tons of dates per year, apart from secondary items such as palm midribs, fiber, stems, fronds, and kernels [2]. The Arab world has over 84 million date palm trees [3]. Egypt was the world’s largest producer of dates in 2012 (1.47 million tons), accounting for almost one fifth of global production [4].
Date palms contain tremendous amounts of agricultural waste in the form of dry leaves, roots, pits, and kernels. A typical date tree can produce up to 20 kg of dry frond per year, while date pits account for nearly 10% of date fruits. Some studies have estimated that Saudi Arabia alone produces over 200,000 tons of date palm annually. Date palm is renewable because it can be replaced in a relatively short time. It takes 4 to 8 years to bear fruit after planting, and 7 to 10 years for commercial harvest yields [5]. Date palm wastes are usually burned on farms or disposed of in landfills, which causes pollution. A small portion of its biomass is used in the processing of animal feed in countries such as Iraq and Egypt. Such amounts of essential and useful biomass waste are of potential interest in various countries, since they can be seen as new sources of cellulosic fiber. Innovative ways of valorizing this abundant renewable resource should therefore be found [6]. Alternatively, several studies have shown that date palm waste can function as an efficient filler in thermoplastic and thermosetting materials for use in various industrial applications [7]. Agricultural wastes supply approximately 33% of the total biofuel consumption (39% Europe, 29% Latin America, 13% Africa, 41% India, and 51% China). A total of 491 billion liters of bioethanol can be produced per year from lignocellulosic biomass [8].
Cellulose, hemicelluloses, and lignin are the main constituents of date palm biomass. Additionally, date palm has low moisture content. Such factors make date palm biomass an excellent resource in Egypt for waste-to-energy conversion. The low level of humidity in date palm waste makes it suitable for thermochemical conversion technologies such as combustion, gasification, and pyrolysis that can produce steam, syngas, biofuel, etc. There is a broad range of thermal and biochemical technologies for converting the energy contained in date palm biomass to usable energy forms. By using hydrolysis and fermentation processes, the cellulosic content, in date palm waste can be transformed into bioethanol. Therefore, Egypt’s abundance of date palm trees could catalyze the growth of the biomass and biofuel industry [9].
In order to evaluate its applications, the agricultural waste of date palm, specifically fronds and fibers, was subjected to chemical treatment. The present study, therefore, aimed to extract cellulose, hemicellulose, and lignin from Egyptian date palm agricultural waste (fronds and fibers). The extraction process was optimized by the Taguchi experimental design method using different conditions (alkali treatment, time, and temperature). Additionally, untreated palm fibers, palm fronds, and extracted crude cellulose palm fibers and fronds were subjected to an enzymatic hydrolysis process using crude and commercial enzymes. The hydrolysate cellulose was then converted to bioethanol by fermentation using Saccharomyces cerevisiae. The hydrolysis and fermentation processes were also optimized in order to provide an innovative approach to the sustainable development of bioethanol production.

2. Materials and Methods

2.1. Materials

2.1.1. Palm Fiber and Frond Collection

Palm fibers (PF) and palm fronds (PFN) (Phoenix dactylifera L.) were collected from Siwa Oasis in the Western Desert in October 2018. Using a grinding machine, the collected agricultural waste was then dried at 70 °C in an oven to a constant weight andmilled into a powder (0.5–1 cm).

2.1.2. Chemicals

Sodium hydroxide, HCl and H2SO4 were obtained from local scientific distributors in Egypt. Other chemicals, including BaCO3, NaOH, n-BuOH, acetone, and aniline, were purchased from Sigma-Aldrich, Merck, and BDH. All chemicals used were of analytical grade.

2.1.3. Microorganisms and Enzymes

A Saccharomyces cerevisiae (S. cerevisiae) commercial strain was obtained from the culture collection of the Bacteria Division, Faculty of Science, Helwan University. A laboratory-prepared enzyme mixture was obtained from isolated Aspergillus niger (A. niger) and commercial cellulase (Novozyme 188).

2.2. Methods

2.2.1. Physiochemical Analysis

The chemical composition of the collected PF and PFN (wax, moisture, protein, and ash content) was determined according to AOAC [10]. Low-molecular-weight carbohydrates (LMWC) were calculated after soxhlet extraction by dissolving them in 85% ethanol for 24 h and analyzing them by paper chromatography as per [11]. Identification of spots was accomplished by spraying the papers with aniline–phthalate reagent [12]. The phenol–sulfuric acid method was used to conduct quantitative screening of D-glucose, L-arabinose, D-xylose, and D-glucuronic acid [13]. Then, the color density for pentose and hexose sugars was estimated at a wavelength of 480 nm and 490 nm, respectively.

2.2.2. Total Carbohydrates Estimation

Strong acid hydrolysis was applied to determine the total carbohydrates of PF, PFN, extracted cellulose, and hemicellulose as glucose [13] as follows: 0.5 mg of the sample was carefully stirred with 0.5 mL of ice cold 80% H2SO4 to give a paste and was kept at room temperature for 15 h, then diluted with a mixture of cold distilled water (up to 13 mL). In a sealed tube, the solution was further hydrolyzed by heating in a boiling water bath for 6 h. The hydrolysate solution was neutralized by the addition of a calculated amount of BaCO3. The neutralized solution was filtered and thoroughly washed with water. The filtrate was treated by a cation exchange resin (Amberlit IR-120 (H+)). The total amount of carbohydrates was determined in the extract using the phenol–sulfuric acid method. The details of this method are as follows: after suitable dilution, 1 mL of 5% phenol solution was added to 1 mL of the resulting diluted solution. After mixing, 5 mL of concentrated H2SO4 was added rapidly to the mixture, shaken, and set aside for 10 min at room temperature, then placed in a water bath at 20–30 °C for 20 min. Thereafter, the color density was measured at 490 nm using a UNICO 7200 spectrophotometer [14].

2.2.3. Qualitative Examination

The resulting hydrolysis polysaccharides were decolorized by boiling with charcoal, concentrated under reduced pressure at 45 °C, and then examined by paper chromatography (Whatman No.1) using the solvent system n-butanol–acetone–water (4:5:1) [11]. Authentic samples of glucose, glucuronic acid, arabinose, and xylose were co-chromatographed as reference substances. Detection of spots was achieved by spraying the papers with aniline–phthalate reagent (1.66 g of o-phthalic acid and 0.91 mL of aniline were dissolved in a mixture of 48 mL of n-butanol, 48 mL of diethyl ether, and 4 mL of water) [12]. After chromatographic separation, the chromatogram was air dried and dipped in 40–50 mL of the aniline–phthalate reagent, air dried, and then heated at 105 °C for 10 min in an oven in order to develop the colored spots.

2.2.4. Quantitative Determination

Quantitative determination of the hydrolysis polysaccharides was done according to the method of [15] with modifications. The individual chromatographic monosaccharide spots were cut off, divided into small strips, dropped into 4 mL of eluting agent (0.7 N HCl in 80% ethanol) in a test tube, and shaken for complete elution. Using the UNICO 7200 spectrophotometer, the absorption of the resulting colored solutions was estimated at 390 nm for pentose and 490 nm for hexose sugars. The quantities of monosaccharide were calculated by comparison with the corresponding standard curves developed under the same conditions [16].

2.2.5. Dewaxing PF and PFN

The wax content was calculated by immersing the milled PF and PFN in a mixture of toluene and ethanol (2:1, v/v) overnight and then filteringthe mixture. The oily residue was collected in a 250 mL round-bottom flask. The wax was eliminated at reduced pressure in a rotary evaporator and then dried in an oven at 60 °C for 16 h [17].

2.2.6. Alkaline Extraction Optimization

Alkaline treatment of dewaxed PF and PFN using the Taguchi experimental design method, a standard L9 orthogonal array, was used to examine four factors (type of alkaline, concentration (%), time (h), and temperature (°C))at three levels. Extraction experiments were conducted onthe static flask stage involving 5 g of dewaxed PF and PFN (liquid-to-solid ratio, 20 mL/g) [17]. The lower and upper levels of optimized factors were selected based on suitable conditions for efficient dissolution of hemicelluloses, lignin, and silica (weight loss %, w/w). The level factors were studied, and the layout of the L9 Taguchi model is presented in Table 1. Each of the nine extraction experiments (denoted by “runs”) was carried out as per the defined values of four different parameters at three different levels.

2.2.7. Taguchi Model Runs Analysis

The Design Expert statistical software package (version 7.0) was used to determine the outcomes of the extraction runs. The response values in terms of weight loss (%, w/w) and S/N ratios of the Taguchi experimental design in the 9 runs were analyzed to independently extract the main effects of the factors; the analysis of variance conditions wewas then appliedo determine which factors were statistically significant. The controlling factors were identified, with the magnitude of the effects qualified and the statistically significant effects determined. Accordingly, the optimal conditions were determined by combining the levels of factors that had the highest main effect value. The analysis of variance (ANOVA) for the responses of weight loss was carried out according to the factor contributing by the Taguchi method. The factors in the experimental design were considered to be statistically significant at the 95% confidence limit and were used to determine the ratio (F) and the p-value (p < 0.05) [18].

2.2.8. Experimental Model Validation

The model was validated by performing an extraction trial employing Taguchi-optimized extraction process parameters on both dewaxed samples. A total of 5 g of dewaxed PF and PFN in NaOH (liquid-to-solid ratio, 20 mL/g) was treated at 90 °C for 2.9 h separately. The reaction mixture was filtrated, the residue (crude cellulose) was washed with distilled water until neutralization, and the filtrate was neutralized at pH 7–6 by hydrochloric acid under cooling. For filtration, the residue used was hemicellulose and the filtrate contained lignin. To obtain lignin, hydrochloric acid was added to the solution until it reached a pH 1.5. All extracted biopolymers (crude cellulose, hemicelluloses, and lignin) were dried overnight at 105 °C [19].

2.2.9. FT-IR Spectroscopy

Characterization and identification of the extracted biopolymers were performed through infrared analysis at National Research Centre, Cairo, Egypt. IR spectra were collected directly from the crude cellulose, hemicelluloses, and lignin powder on a detector prism using a Bruker Vectra 22 FT-IR spectrometer equipped with a Dura Sample IR II™ detector. All spectra were taken at a spectral resolution of 4 cm−1 in the wave number range 4000–400 cm−1.

2.2.10. Enzymatic Hydrolysis Optimization

The Taguchi experimental method was used to optimize the enzymatic hydrolysisprocess. The level factors were studied, and the layout of the L9 Taguchi model is presented in Table 2. Laboratory-prepared Aspergillus niger (A. niger) crude enzymes containing FP-ase, CMC-ase, and β-glucosidase were used to optimize the enzymatic hydrolysis of extracting crude cellulose. Using the laboratory-prepared A. niger crude enzyme and industrial cellulase enzyme (Novozyme 188), enzymatic hydrolysis of dewaxed PF, dewaxed PFN, and extracted crude cellulose was performed in 100 mL of buffer solution at pH 5.5 (0.05 M citrate buffer) after optimization [20].

2.2.11. Glucose Concentration Determination

The hydrolysate samples (1 mL) were added directly to glucose oxidase peroxidase reagent (1 mL), and then the mixture was incubated at 37 °C for 10 min. The absorbance was recorded at 546 nm. The amount of glucose in each sample was measured by using the standard curve of glucose oxidase.

2.2.12. Bacterial Growth

The bacterial growth was measured by measuring the optical density (OD) of cultures at a wavelength of 540 nm using a Shamidzo 2410c UV spectroscope [19].

2.2.13. Fermentation Optimization

Fermentation experiments were carried out under the following conditions: temperature, 30 °C; agitation speed, 40 rpm. Saccharomyces sp. were used as fermentable organisms and maintained on yeast peptone dextrose agar medium (yeast extract, 10; peptone, 20; dextrose, 20; agar–agar, 20gl−).

2.2.14. Distillation and Bioethanol Determination

One milliliter of the fermented wash was placed in a 500 mL pyrex distillation flask containing 30 mL of distilled water. The distillate was collected in a 50 mL flask containing 25 mL of acidified potassium dichromate solution (33.768 g of K2Cr2O7 dissolved in 400 mL of distilled water with 325 mL of sulfuric acid andthe volumeraised to 1 L). Approximately 20 mL of distillate was collected in each sample, and the flasks were held for 20 min in a water bath at 62.5 °C. The flasks were then cooled in an ice bath, and the volume was increased to 50 mL. Five milliliters of solution was diluted with 5 mL of distilled water to determine the optical density at 600 nm using a spectrophotometer. A standard curve was prepared under a similar set of conditions by using a standard solution of ethanol containing 2% to 12% (v/v) ethanol in distilled water. The ethanol content of each sample was estimated and a graph was prepared [21].

3. Results and Discussion

3.1. Chemical Composition and Total Carbohydrates

In the present examination, it was of interest to survey the constituents of PF and PFN, including moisture, ash, wax, low-molecular-weight carbohydrates (LMWC), and protein. The chemical composition of PF and PFN was determined to be (% w/w): moisture, 9.00 and 9.93; wax 3.30 and 4.20, ash 5.1 and 4.9, LMWC 5.2 and 7.9, and protein 2.2 and 2.9, respectively. According to Ragab et al. [19], the chemical composition as percentage w/w LMWC, lipids, wax, ash, and moisture was for rice straw and rice husk 7.35, 2.15, 5.85, 17.65, and 12.41 and 4.20, 5.45, 12.55, 14.20, and 9.20, respectively.

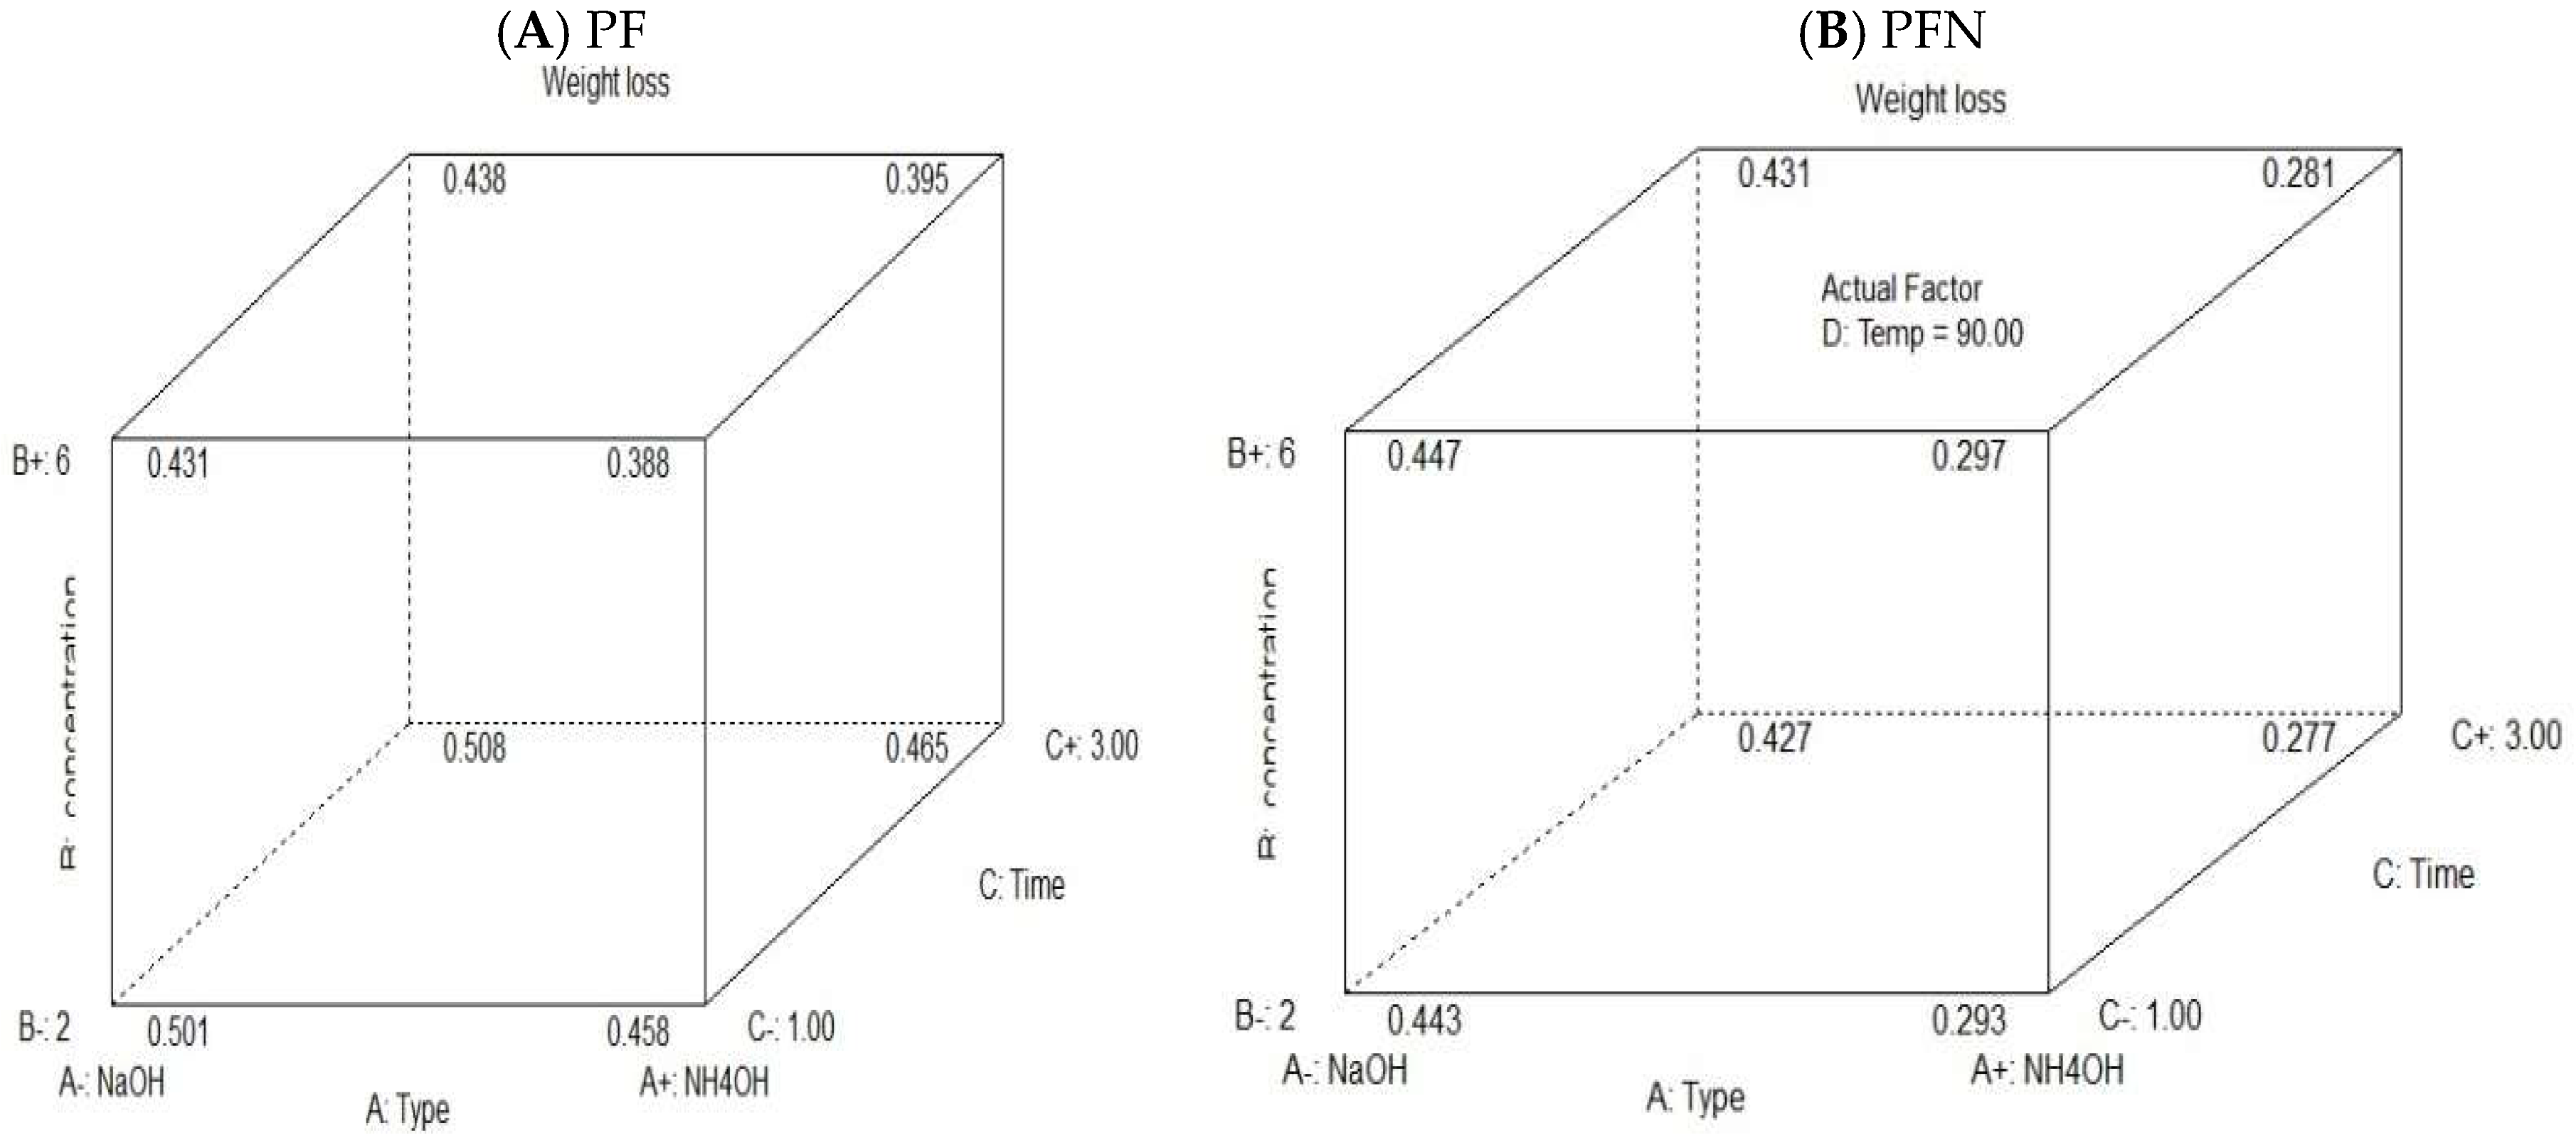
3.2. Cellulose Extraction Optimization by the Taguchi Method

The influence of four factors on the extraction process was tested (Table 1) by the Taguchi experimental method in nine runs (Figure 1). The response values for weight loss (%, w/w) were chosen by the extraction method to maximize the weight loss. The weight loss efficiency (%, w/w) ranged from 0% to 0.49%, which corresponds to the combined effect of the four factors within their specific ranges. The experimental findings indicate that the weight loss is strongly supported by certain variables at the optimal level. The mean weight loss of PF was 0.49% with a mixture of 4% NaOH at 90 °C for 2 h (Figure 1a). The best response for PFN was 0.451%, which was determined in run 4 under the same conditions (Figure 1b). Rice straw and rice husk recorded a maximum weight loss under the same conditions of 0.39% and 0.45%, respectively [19].

3.3. ANOVA Analysis of the Taguchi Model Runs

The F-values for PF and PFN imply that the two models were significant (28.07 and 10.06, respectively). The two rice straw and rice husk models were significant, according to the F-values (67.08 and 218.98, respectively) [20]. The values of “Prob > F” were less than 0.0500, which indicates that the model terms were significant. In the case of the PF model, A and D were significant model terms when A, B, and D were significant model terms for the PFN model. Values greater than 0.1 indicate that model terms are not significant (Table 3).

3.4. Model Evaluation

A common and simple approach to model evaluation is to regress the expected versus actual value. The 0.6544 “Pred R-Squared”value is in fair accordance with the 0.9442 “Adj R-Squared” value. The plot of predicted versus actual values shows how well the model predicted over the range of obtaining data (Figure 2A,B).

3.5. Response Surface Methodology (RSM)

The 3D response surface graph shows the effect of interaction between the significant factors on cellulose extraction. The maximum PF weight loss was obtained using 2.37% NaOH for 1.6 h at 86.5 °C (Figure 3A). In the case of the PFN model, 6% NaOH was used for 1 h at 90 °C (Figure 3B).

3.6. Validation of the Experimental Model

The model was validated by taking the best expected parameters of the extraction method. The validation of the experimental model was carried out by evaluating the weight loss of PF (% w/w), which was 52.74%, almost equal to the 49.69% predicted value, and the weight loss of PFN, which was 55.74%, greater than the 44.68% predicted value. The weight loss of rice straw (%, w/w) was 38.00%, which is almost equal to the predicted value of 40.73%, and the weight loss of rice husk was 48.10%, which is almost equal to the predicted value of 47.25% [20].

3.7. Dewaxed PF and PFN Aqueous Extraction

For both agricultural residues (PF and PFN), cellulose, hemicelluloses, and lignin were extracted with good yield. Interestingly, it was noted that PFN has high cellulose content (50.74% (w/w)). In comparison, PFN has low hemicellulose content (6.87%) and low lignin content (24.61%). On the other hand, PF has 48.34% cellulose, 10.40% hemicellulose, and only 30.3% lignin content. Therefore, the optimization was effective in obtaining higher contents of cellulose using a lower concentration of NaOH, a shorter time, and a lower temperature compared with rice straw (44%) and rice husk (43%) using 4% NaOH for 3 h at 90 °C [17]. The average chemical composition (as a weight percentage) of the date palm fibers and fronds was: cellulose, 40.21% and 38.26%; hemicelluloses, 12.80% and 28.17%; and lignin, 32.20% and 22.53%, respectively [22]. Alkali treatment interferes with the cell wall by dissolving hemicelluloses, lignin, and silica, by swelling cellulose, and by reducing the cellulose’s crystallinity [23]. In the plant cell wall network, hemicelluloses are relatively tightly bound to lignin and cellulose by hydrogen and covalent bonds, respectively; it is difficult to separate them without significant structural modifications [24].

3.8. Qualitative and QuantitativeDetermination of Carbohydrates

Plant cell walls are recognized to be a potential source of active polysaccharides. To obtain further details on the total carbohydrate content of PF, PFN, and extracted crude cellulose, hemicelluloses, and lignin, they were subjected to strong acid hydrolysis followed by qualitative separation and then quantitative determination using paper chromatography. The total PF and PFN carbohydrate values obtained were 24.4% and 31.0%, respectively; however, the percentage was small, so some of them could have been lost during dewaxing processes. The total carbohydrate content of the crude cellulose was 63.95% and 65.20% for PF and PFN, respectively. In the case of PF and PFN hemicelluloses, the strong acid hydrolysis caused over-hydrolysis such that the total carbohydrate content was low (72.4% and 78.1%, respectively). The presence of low carbohydrate content in lignin (PF, 4.45%; PFN, 5.70) indicates that the extraction method was successful, resulting in some cellulose and hemicellulose precipitation along with lignin. The sugar content of the rice straw and rice husk was 62.4% and 64.6%, respectively [19]. According to the paper chromatography study, the ratios of D-glucuronic acid, D-glucose, L-arabinose, and D-xylose were calculated. Table 4 presents the results on themonosaccharide constituents for cellulose, hemicellulose, and lignin extracted from PF and PFN. According to the obtained results, cellulose still has L-arabinose and D-xylose (hemicelluloses) because pure cellulose should just have repeating units of D-glucose. Hemicellulose has glucose, mainly xylose and arabinose. D-xylose, L-arabinose, D-glucoses, D-galactose, D-mannose, D-glucuronic acid, 4-O-methyl-D-glucuronic acid, D-galacturonic acid, and, to a lesser extent, L-rhamnose, L-fucose, and various O-methylated neutral sugars are the main sugars in hemicelluloses. Hemicelluloses are low-molecular-weight branched polymers with a polymerization degree of 80–200 [25]. Lignin has glucose, xylose, and arabinose (soluble cellulose and hemicelluloses) [26].

3.9. FT-IR Analysis

The FT-IR analysis was carried out primarily to classify the functional groups in CPF, CPFN, HPF, HPFN, LPF, LPFN, and untreated residues. In general, some variations in the spectrum were observed in terms of band strength and band disappearance after alkaline extraction (Figure 4). The CPF, CPFN, HPF, HPFN, LPF, and LPFN spectra showed the bands listed in Table 5. The peak at 2922–2854 cm−1 was allocated to the C-H stretching vibration from the-CH2 cellulose group and the peak at 1566 cm−1 was due to the anti-symmetric C-O-C stretching bridge [27]. The effect of the chemical treatment, which can lead to the structure of a type I cellulose crystal, was indicated [28].

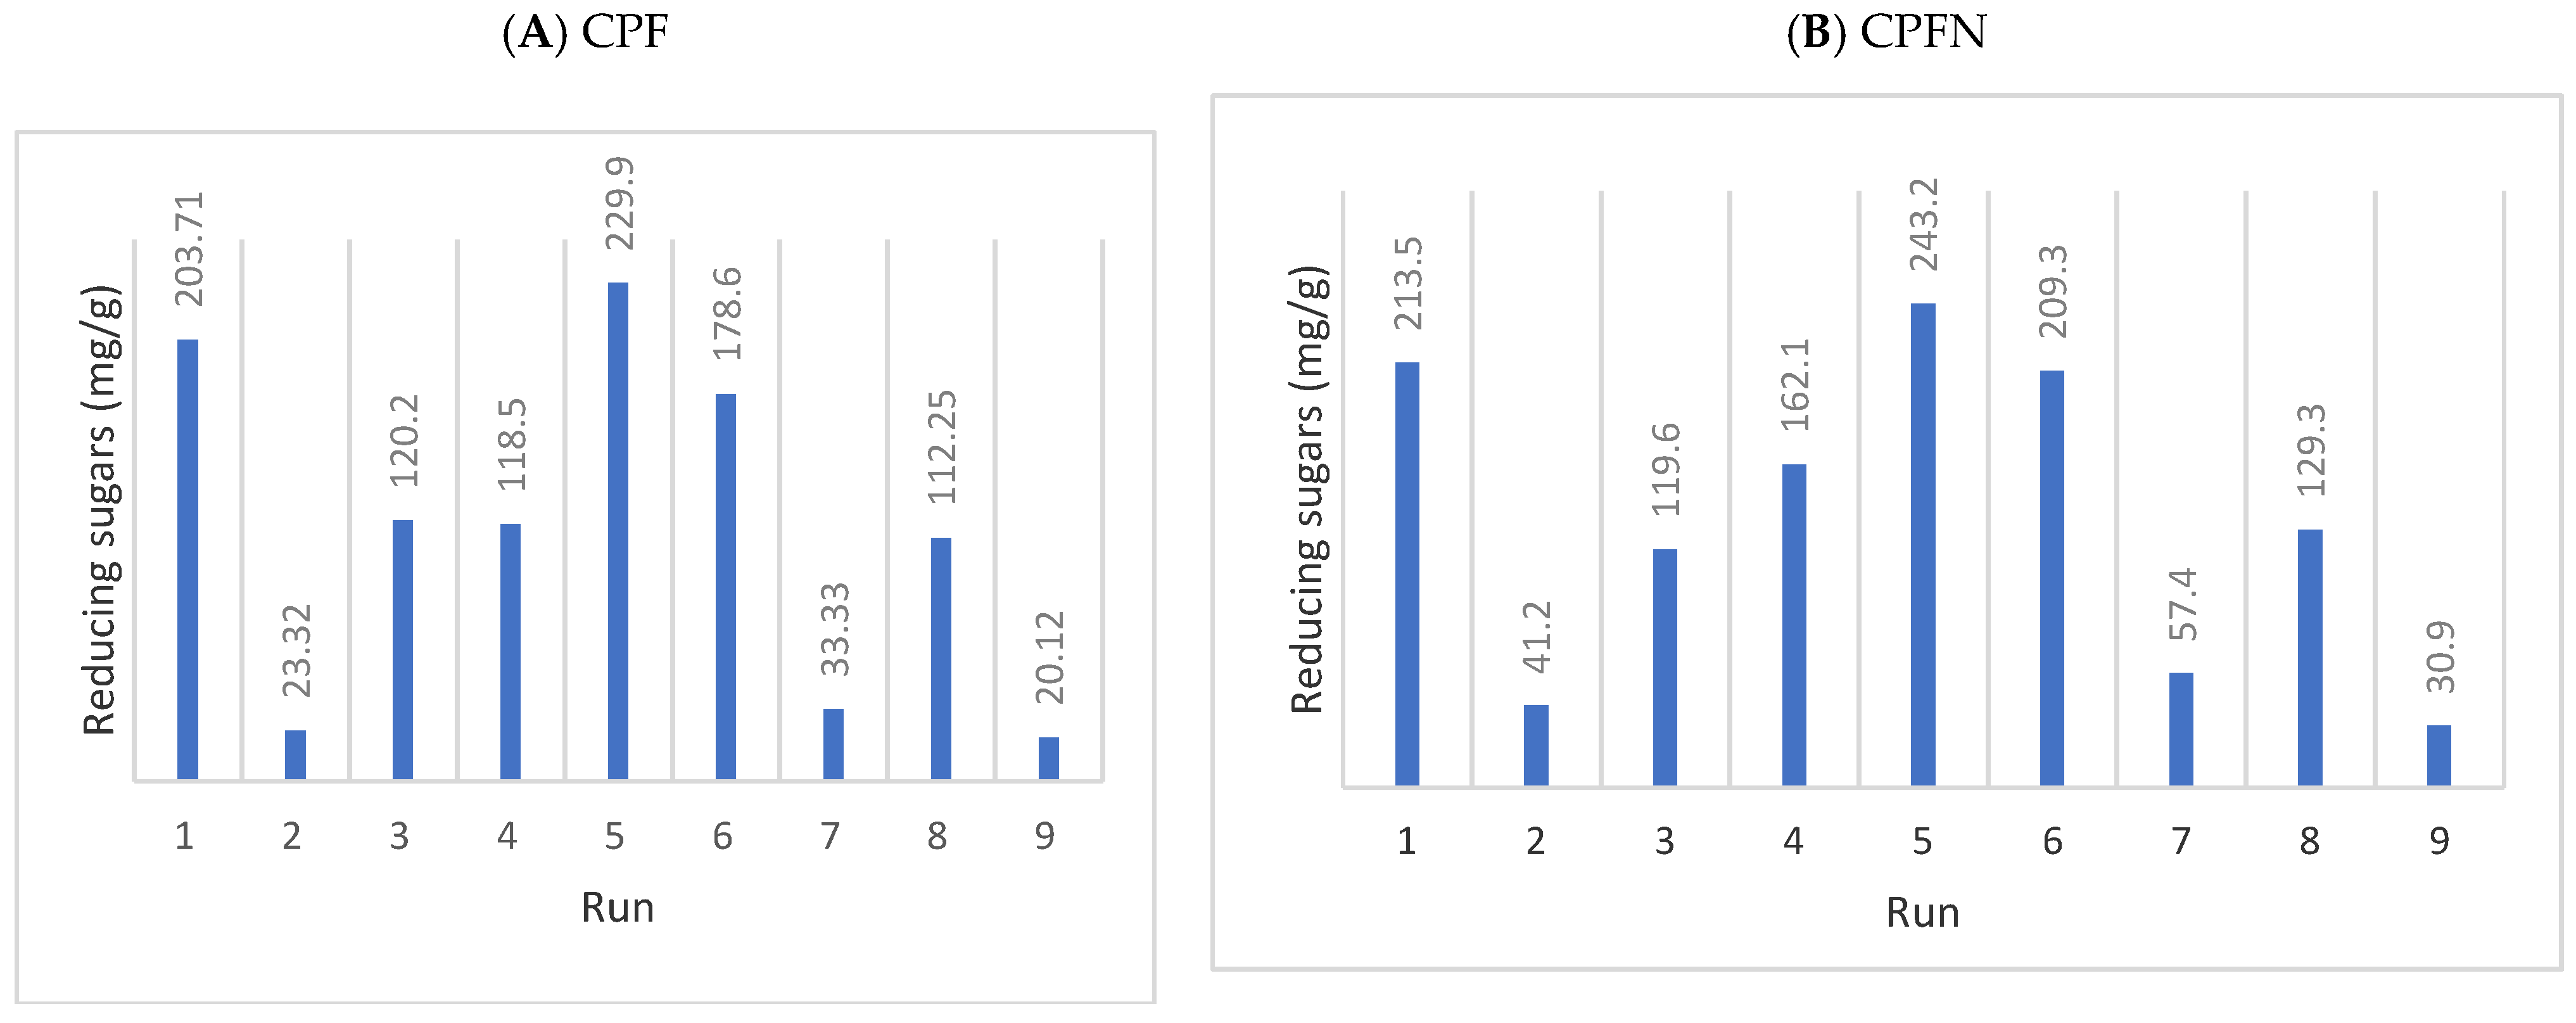
3.10. Crude Enzymatic Hydrolysis Optimization

The response values chosen for the optimization process in terms of reducing sugars showed that the efficiency of the hydrolysate output ranged from 20 to 250 (mg/g), corresponding to the combined effect of the four variables in their different ranges (Table 2). The experimental results suggest that these factors at the optimal level strongly support hydrolysate production. The maximum amount of reducing sugars created from both CPF and CPFN was 229.9 mg/g and 243.2 mg/g, which was observed in run 5 with a combination of 20 IU of enzymes with a 3% (w/v) substrate at 125 rpm and the best response temperature (50 °C) (Figure 5). Under the same conditions, crude cellulose rice straw and rice husk gave the maximum reducing sugar amounts of 230.31 mg/g and 221.8 mg/g, respectively [20].

3.11. ANOVA of Taguchi Model Runs

The obtained F-values for CPF (12.4) and CPFN (11.48) indicate that the two models were significant. Values of “Prob > F” less than 0.0500 indicate that model terms are significant. Factors A and C were significant model terms in the case of both CPF and CPFN. Values greater than 0.1000 indicate that model terms are not significant (Table 6).

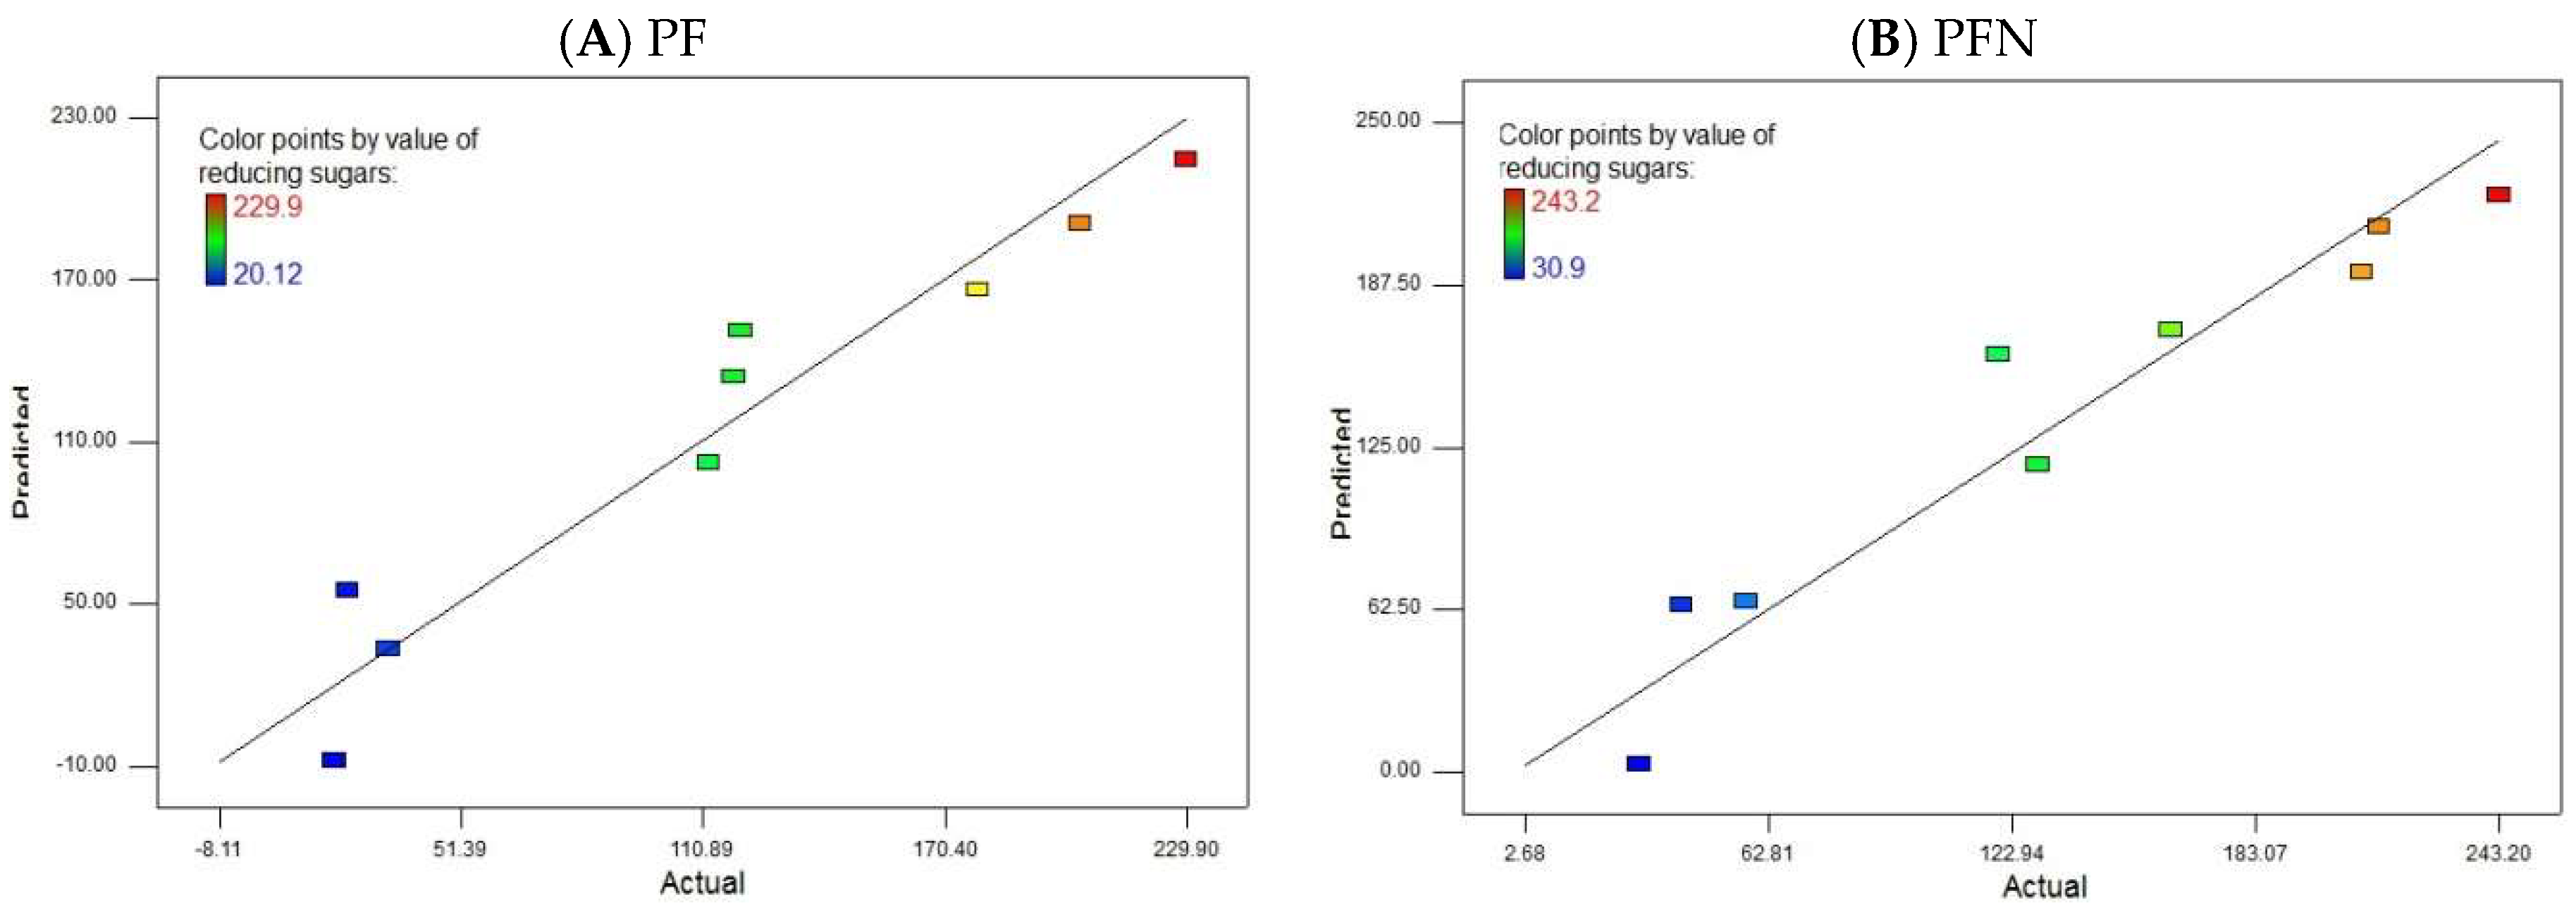
3.12. Model Evaluation
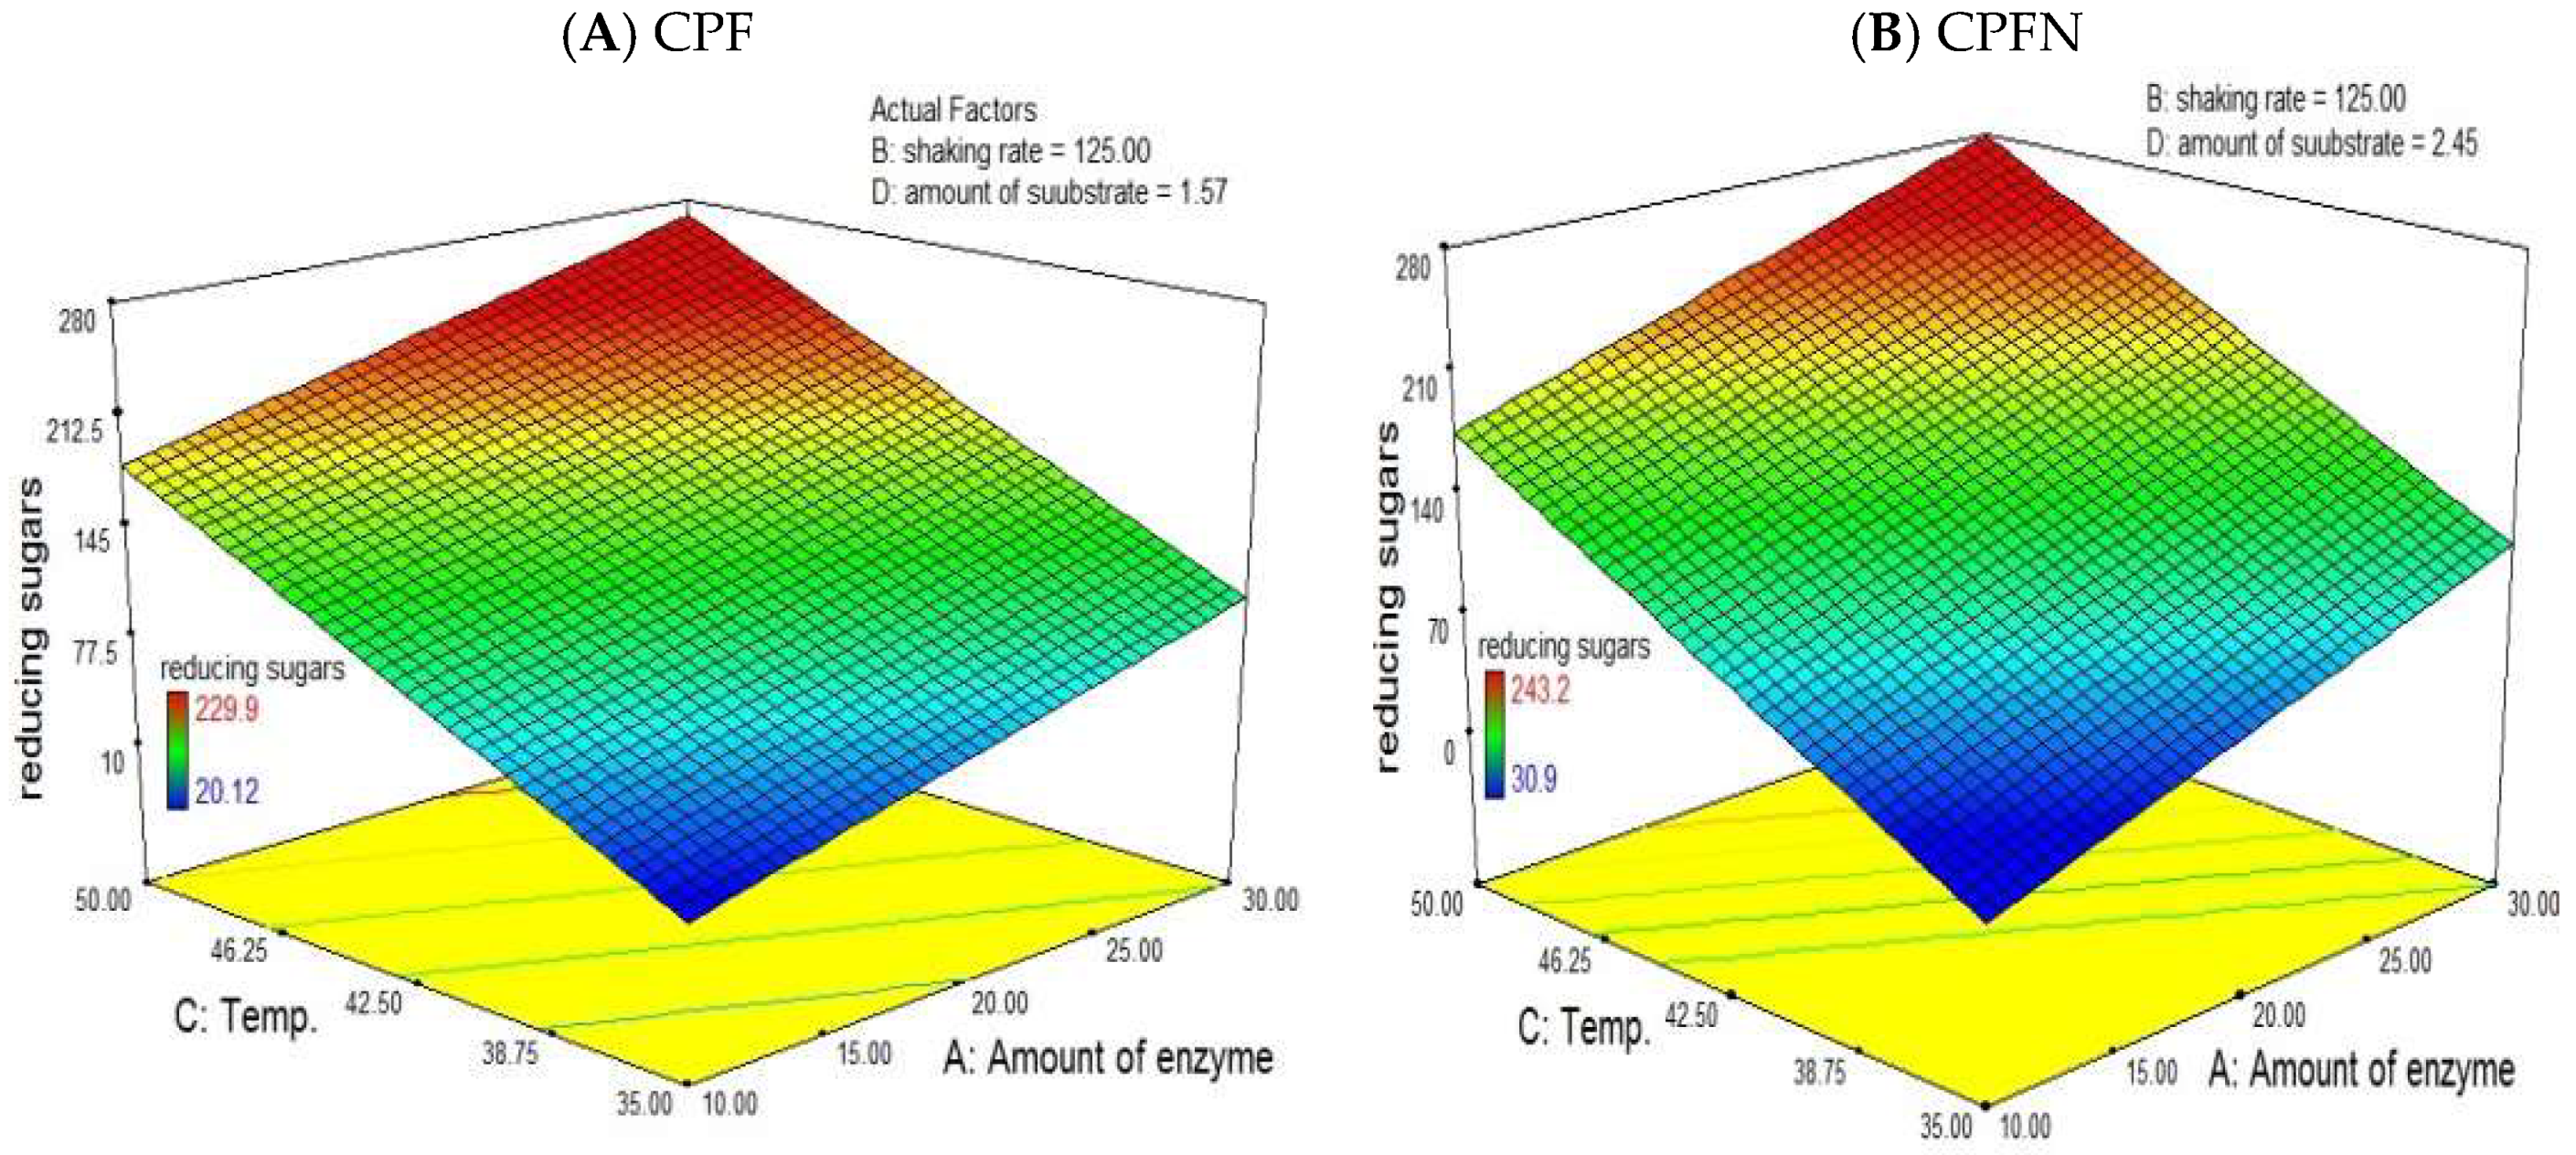
The plot of predicted vs. actual valuesshowshow well the applied model predicted over the range of data (Figure 6). For the CPF model, the “Pred R-Squared” value of 0.5089 was in reasonable agreement with the “Adj R-Squared” value of 0.8508. Additionally, the“Pred R-Squared” value of 0.5890 was in agreement with the “Adj R-Squared” value of 0.9199 in the CPFN model.

3.13. RSM

The 3D response surface graphs display the effects of key process variables on enzymatic hydrolysis. The overall reducing sugar production from CPF expected by the model was found to be 235.4 (mg/g) with 17.87 IU of enzymes and 1.57% (w/v) of substrate at 112 rpm and 49.0 °C (Figure 7). CPFN was expected to produce 267.76 mg/g of reducing sugars using 29.74 IU of enzymes and 1.05% (w/v) of substrate at 100 rpm and 45.7 °C (Figure 7). The data were further validated by carrying out the experiment under optimized conditions.

3.14. Validation of the Experimental Model

The model was validated by taking the best predicted parameters of the extraction process. The validation of the experimental model was achieved by evaluating the amount of reducing sugars derived (mg/g) from CPF (263.88), which was nearly equivalent to the predicted value of 235.41, and from CPFN (331.74), which was nearly equivalent to the predicted value of 269.76.

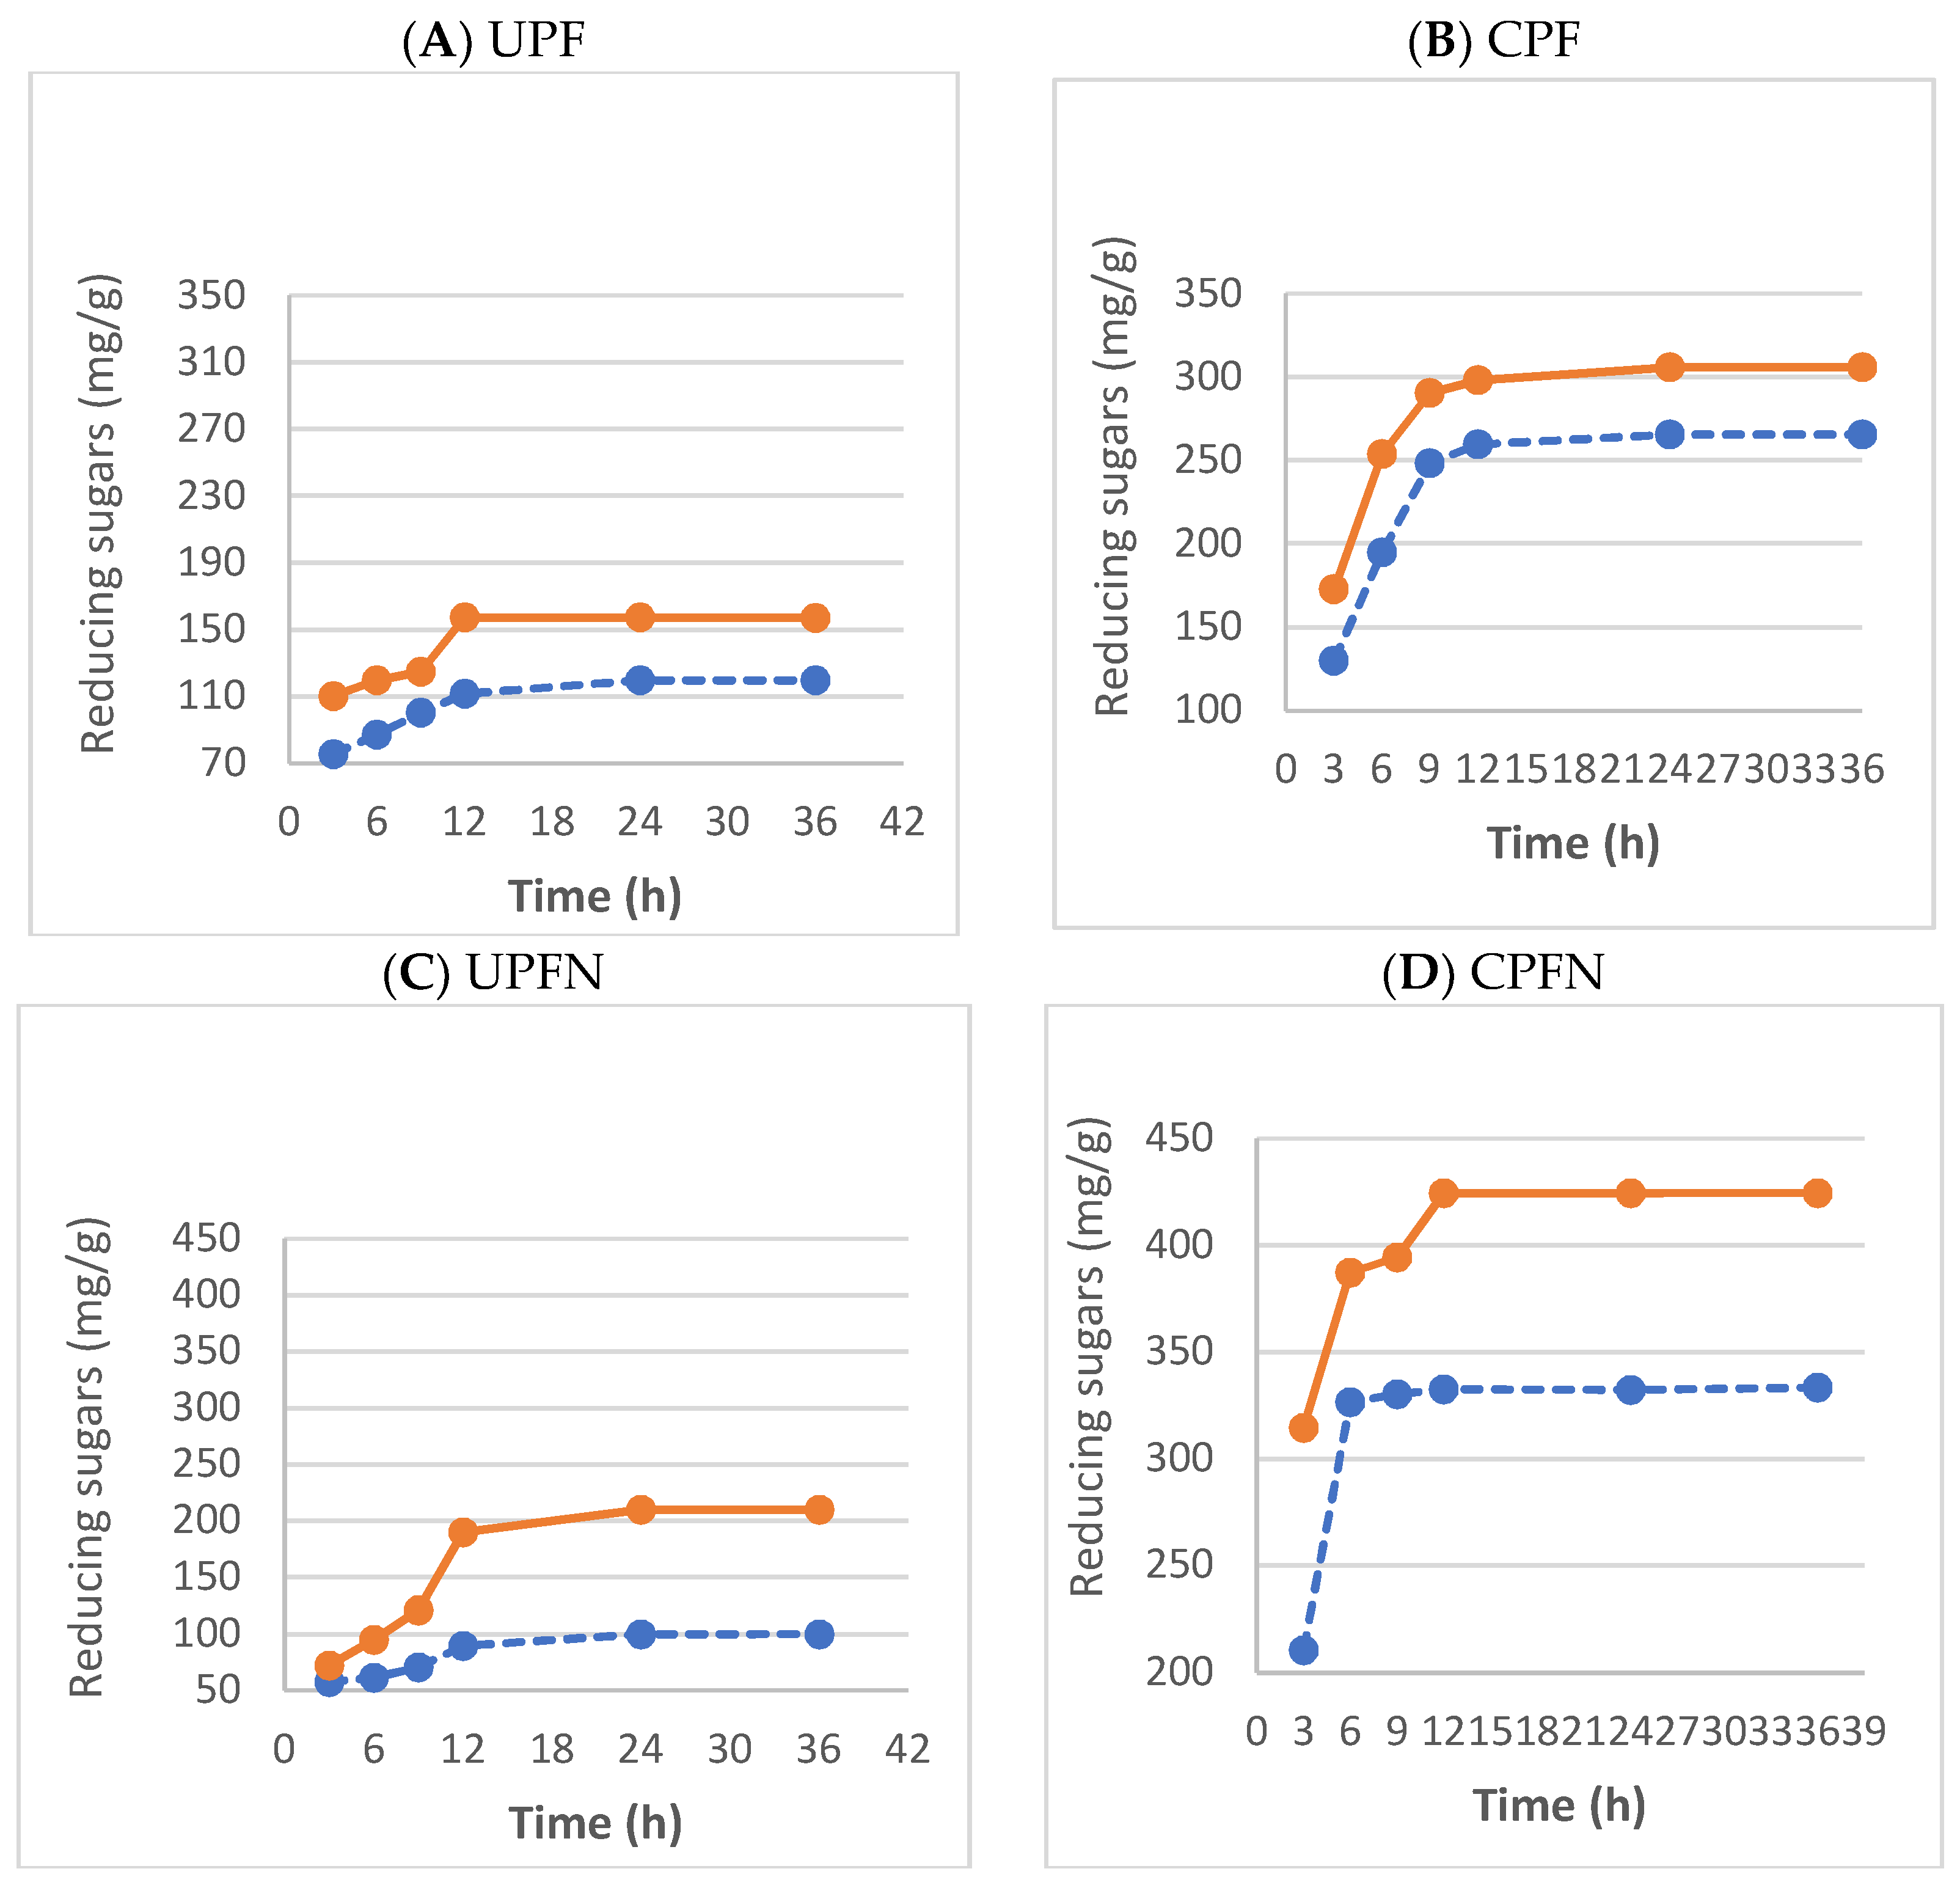
3.15. Commercial Enzymatic Hydrolysis

The efficacy of the crude enzyme and industrial enzymes in substrate saccharification was investigated. Figure 8 showed that the amount of reducing sugars manufactured from untreated palm wastes (UPF and UPFN) and their extracted cellulose increasedas thehydrolysis time increased and, with further hydrolysis, it became nearly constant. The maximum amounts of reducing sugars obtained were (mg/g) UPF, 120.19; CPF, 270.69; UPFN, 100.00; and CPFN, 335.36 at a crude enzyme loading. The commercial enzymes showed a high yield of reducing sugars(mg/g): UPF, 160.97; CPF, 310.50; UPFN, 210.82; and CPFN, 425.38.
The results show that it was very difficult to obtain high yields of reducing sugars from the lignocellulosic residues without pretreatment because lignin was present in the plant cell wall, which hindered the action of the enzyme [29].

3.16. Estimation of Glucose in the Hydrolyzed Cellulose

The highest glucose yield of the crude enzyme of CPF and CPFN from hydrolysis was weighted at a value of 0.39 g with a 21.5% hydrolysis rate and 0.75 g with a 35.5% hydrolysis rate, respectively.

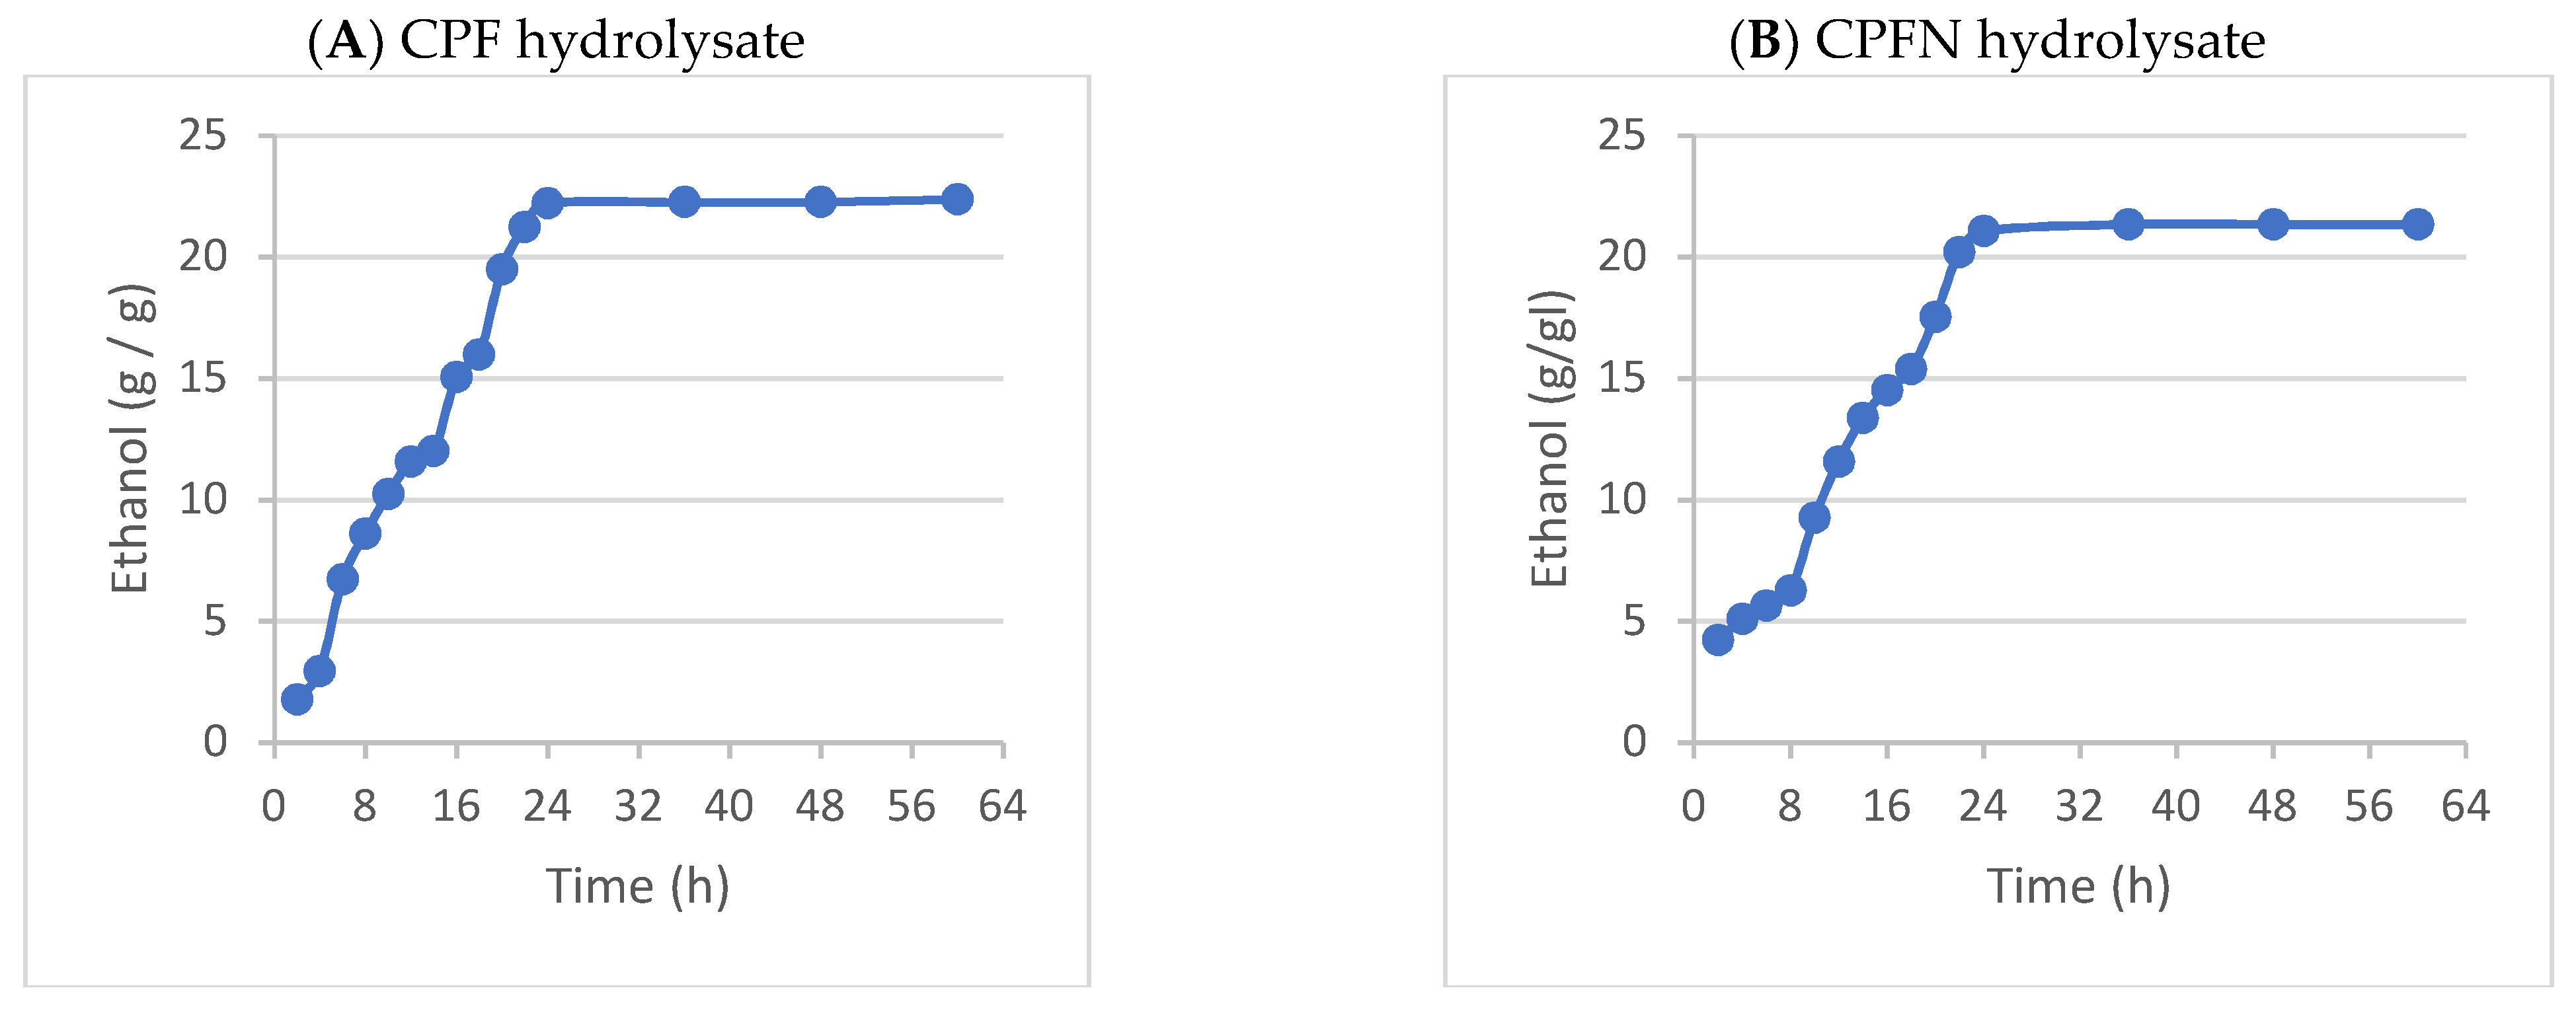
3.17. Bioethanol Production (Fermentation)

Fermentation of CPF and CPFN hydrolysate was carried out and the glucose was found to have completely assimilated within 24 h. Interestingly, it was observed that the bioethanol yield of 22.2% (w/w) in the case of the CPF hydrolysate was almost equal to the CPF model’s predicted value (Figure 9A).The bioethanol yield was 21.34% in the case of the CPFN hydrolysate (Figure 9B). The ethanol yield from the CPF and CPFN hydrolyzate in terms of consuming sugar was 43.5% and 41.8%, respectively, of the theoretical value.

4. Conclusions

This vision of growth in the agro-waste industry is revolutionary in its implementation and could increase gains by substantially increasing the energy output based on a biochemical process for bioethanol production. Full optimization of the extraction, hydrolysis, and fermentation processes could be an innovative approach to the sustainable development of bioethanol production from palm fiber and frond waste and extracted cellulose. Anaerobic cultivation of hydrolysates with S.cerevisiae resulted in 0.222 g/g and 0.213 g/g of bioethanol in the case of CPF and CPFN, respectively.This new concept, known as ‘integral usage’, would improve the current efficiency of bioethanol production per ton and reduce the impact on the environment.

Author Contributions

Conceptualization, T.I.M.R., F.M.A. and W.A.E.-S.; methodology, T.I.M.R. and A.S.G.S.; software, T.I.M.R. and A.S.G.S.; validation, T.I.M.R., W.A.E.-S. and S.M.S.; formal analysis, T.I.M.R., A.S.G.S. and F.M.A.; investigation, T.I.M.R., A.S.G.S., S.M.S. and W.A.E.-S.; resources, F.M.A. and A.S.G.S.; data curation, T.I.M.R. and A.S.G.S.; writing—original draft preparation, T.I.M.R.; writing—review and editing, T.I.M.R. and W.A.E.-S.; visualization, T.I.M.R. and W.A.E.-S.; supervision, T.I.M.R. and F.M.A.; project administration, F.M.A. and S.M.S.; funding acquisition, F.M.A., W.A.E.-S. and S.M.S. All authors have read and agreed to the published version of the manuscript.

Funding

The authors extend their appreciation to the Deputyship for Research& Innovation, Ministry of Education and, Saudi Arabia for funding this research work through the project number (QU-IF-1-1-4). The authors also thank to the technical support of Qassim University.

Institutional Review Board Statement

Not applicable.

Informed Consent Statement

Not applicable.

Conflicts of Interest

The authors declare that they have no conflicts of interest.

Statement of Novelty

  • Palm frond and fiber agro-wastes can generate wealth by the production of bioethanol.
  • Lignocellulosic biomass has many advantages, includingthat it is abundant, a renewable source of sugars, and inexpensive.
  • Bioethanol production was increased under full optimization of the extraction, hydrolysis, and fermentation processes.

References

  1. Thiangtham, S.; Runt, J.; Manuspiya, H. Sulfonation of dialdehyde cellulose extracted from sugarcane bagasse for synergistically enhanced water solubility. Carbohydr. Polym. 2019, 208, 314–322. [Google Scholar] [CrossRef] [PubMed]
  2. Arab Organization for Agricultural Development (AOAD). Arab Agricultural Statistics Yearbook. Part III: Plant Production, Statistics Division; Arab Organization for Agricultural Development, ANS Publisher: Khartoum, Sudan, 2008; Volume 28. [Google Scholar]
  3. El-Juhany, L.I. Degradation of date palm trees and date production in Arab countries: Causes and potential rehabilitation. J. Basic Appl. Sci. 2010, 4, 3998–4010. [Google Scholar]
  4. Abdelwahab, O.; Nasr, S.M.; Thabet, W.M. Palm fibers and modified palm fibers adsorbents fordifferent oils. Alex. Eng. J. 2017, 56, 749–755. [Google Scholar] [CrossRef]
  5. AL-Oqla, F.M.; Alothman, O.Y.; Sapuan, M.J.S.; MandEs-Saheb, M.H. Processing and Properties of Date Palm Fibers and Its Composites. In Biomass and Bioenergy: Processing and Properties; Chapter one Springer International Publishing Switzerland; Hakeem, K.R., Jaeid, M., Rashid, U., Eds.; Springer Verbal: New York, NY, USA, 2014; pp. 1–25. [Google Scholar]
  6. Chandrasekaran, M.; Bahkali, A.H. Valorization of Date palm (Phoenix dactylifera) fruit processing by-products and wastes using bioprocess technology-Review. Saudi J. Biol. Sci. 2013, 20, 105–120. [Google Scholar] [CrossRef] [PubMed] [Green Version]
  7. Al-Oqla, F.M.; Sapuan, S.M. Natural fiber reinforced polymer composites in industrial applications: Feasibility of date palm fibers for sustainable automotive industry. J. Clean. Prod. 2014, 66, 347–354. [Google Scholar] [CrossRef]
  8. Kim, S.; Dale, B.E. Global potential bioethanol production from wasted crops and crop residues. Biomass Bioenergy 2004, 26, 361–375. [Google Scholar] [CrossRef]
  9. Rosemarie, Y.; Jennifer, A.L. An Assessment of Biofuel Use and Burning of Agricultural Waste in the Developing World; Department of Earth and Planetary Sciences, Harvard University: Cambridge, MA, USA, 2003. [Google Scholar]
  10. Association of Official Agricultural Chemists (AOAC). Official Methods of Analysis. Washington, D.C., 15th ed.; Association of the Official Analytical Chemists, INC: Arlington, VA, USA, 1990; Volume 1. [Google Scholar]
  11. Jayme, G.; Knolle, H. Paper chromatography of sugar mixtures upon glass-fiber paper. Angew. Chem. 1956, 68, 243–246. [Google Scholar] [CrossRef]
  12. Partridge, S.M.; Beidler, L.M. Aniline hydrogen phthalate as a spraying reagent for chromatography of sugars. Nature 1949, 164, 443. [Google Scholar] [CrossRef] [PubMed]
  13. Dubois, M.; Gilles, K.A.; Hamilton, J.K.; Rebers, P.A.; Smith, F. Colorimetric Method for Determination of Sugars and Related Substances. Anal. Chem. Am. Chem. Soc. (ACS) 1956, 28, 350–356. [Google Scholar] [CrossRef]
  14. Ragab, T.I.M.; Wasfy, A.A.F.; Amer, H.; El-Gendi, A.; Abdel-Hady, M.S.; Liebner, F. Synthesis of cellulose acetate membrane from the Egyptian rice straws. J. Appl. Sci. 2014, 14, 3424–3435. [Google Scholar] [CrossRef] [Green Version]
  15. Wilson, C.M. Quantitative determination of sugars on paper chromatography. Analyt. Chem. 1959, 31, 1199–1201. [Google Scholar] [CrossRef]
  16. Marrez, D.A.; El Raey, M.A.; Ali, M.; Seif, M.M.; Ragab, T.I.M.; El Negoumy, S.I.; Emam, M. Phenolic profile and antimicrobial activity of green synthesized Acalypha wilkesiana seeds silver nanoparticles against some food borne pathogens. Biosci. Res. 2017, 14, 817–830. [Google Scholar]
  17. Ragab, T.I.M.; Amer, H.; Wasfy, A.A.F.; Abdel-Hady, M.S.A.; Mossa, A.T.H.; Liebner, F. Sulfated Cellulose from Agriculture Wastes, Anticoagulant, Fibrinolytic and Toxicological Studies. J. Environ. Sci. Technol. 2014, 7, 266–280. [Google Scholar] [CrossRef] [Green Version]
  18. Ohtani, K. Bootstrapping R2 and adjusted R2 in regression analysis. Econ. Model 2000, 17, 473–483. [Google Scholar] [CrossRef]
  19. Ragab, T.I.M.; Shalaby, A.G.; El Awdan, S.A.; Refaat, A.; Helmy, W.A. New applied pharmacological approach/trend on utilization of agro-industrial wastes. Environ. Sci. Pollut. Res. 2018, 25, 26446–26460. [Google Scholar] [CrossRef]
  20. Ragab, T.I.M.; Amer, H.; Mossa, A.T.; Emam, M.; Hasaballaha, A.A.; Helmy, W.A. Anticoagulation, fibrinolytic and the cytotoxic activities of sulfated hemicellulose extracted from rice straw and husk. Biocatal. Agric. Biotechnol. 2018, 15, 86–91. [Google Scholar] [CrossRef]
  21. Caputi, A.; Ueda, M.; Brown, T. Spectrophotometric determination of ethanol in wine. Am. J. Enol. Vitic. 1968, 19, 160–165. [Google Scholar]
  22. Mirmehdi, S.M.; Zeinaly, F.; Dabbagh, F. Date palm wood flour as filler of linear low-density polyethylene. Compos. Part B Eng. 2014, 56, 137–141. [Google Scholar] [CrossRef]
  23. Brodeur, G.; Yau, E.; Badal, K.; Collier, J.; Ramachandran, K.B.; Ramakrishnan, S. Chemical and physicochemical pretreatment of lignocellulosic biomass. Enzym. Res. Hindawi 2011, 2011, 787532. [Google Scholar] [CrossRef] [PubMed]
  24. Sun, J.X.; Sun, F.X.; Sun, R.C.; Su, Y.Q. Fractional extraction and structural characterization of sugarcane bagasse hemicelluloses. Carbohydr. Polym. 2004, 56, 195–204. [Google Scholar] [CrossRef]
  25. Cai, Z.S.; Paszner, L. Salt catalyzed wood bonding with hemicellulose. Holzforschung 1988, 42, 11–12. [Google Scholar]
  26. Lupoi, J.S.; Singh, S.; Parthasarthi, R.; Simmons, B.A.; Henry, R.J. Recent innovations in analytical methods for the qualitative and quantitative assessment of lignin. Renew. Sustain. Energy Rev. 2015, 49, 871–906. [Google Scholar] [CrossRef] [Green Version]
  27. Rahman, M.M.; Maniruzzaman, M.; Islam, M.R.; Rahman, M.S. Synthesis of Nano-Cellulose from Okra Fibre and FTIR as Well as Morphological Studies on It. Am. J. Polym. Sci. Technol. 2018, 4, 42–52. [Google Scholar] [CrossRef] [Green Version]
  28. Ibrahim, N.A.; Azraaie, N.; Aimi, N.; Zainul, M.; Amira, N.; Razali, M.; Aziz, F.A.; Zakaria, S. XRD and FTIR Studies of Natural Cellulose Isolated from Pineapple (Ananas comosus) Leaf Fibres. Adv. Mater. Res. 2015, 1087, 197–201. [Google Scholar]
  29. Jeya, M.; Zhang, Y.W.; Kim, I.W.; Lee, J.K. Enhanced saccharification of alkali-treated palm fibres by cellulase from Trametes hirsuta and statistical optimization of hydrolysis conditions by RSM. Bioresour. Technol. Elsevier BV 100 2009, 21, 5155–5161. [Google Scholar] [CrossRef]
Figure 1. Response values of the L9 Taguchi orthogonal array design.
Sustainability 13 13660 g001
Figure 2. Predicted values versus actual values.
Sustainability 13 13660 g002
Figure 3. Response surface graph of cellulose extraction from PF and PFN.
Sustainability 13 13660 g003
Figure 4. FT-IR spectra of cellulose, hemicellulose, and lignin.
Sustainability 13 13660 g004
Figure 5. Response values of the L9 Taguchi orthogonal array design.
Sustainability 13 13660 g005
Figure 6. Predicted values vs. actual values for enzymatic hydrolysis of CPF and CPFN.
Sustainability 13 13660 g006
Figure 7. Response surface graph of enzymatic hydrolysis of CPF and CPFN.
Sustainability 13 13660 g007
Figure 8. Production of reducing sugars by commercial enzymes and crude enzymes from untreated wastes and extracted cellulose.
Sustainability 13 13660 g008
Figure 9. Relationship between bioethanol yield and time for the hydrolysate (CPF and CPFN).
Sustainability 13 13660 g009
Table 1. L9 Taguchi model matrices.
RunA
Alkaline
B
Concentration (%)
C
Time (h)
D
Temperature (°C)
1NaOH2190
2Ca(OH)22230
3NH4OH6290
4NaOH4255
5Ca(OH)24390
6NH4OH4130
7Ca(OH)26155
8NH4OH2355
9NaOH6330
Table 2. L9 Taguchi model template matrix layout for PF, PFN, and crude cellulose.
RunA
Enzymeamount
(IU)
B
Shaking Rate
(rpm)
C
Temperature
(°C)
D
Substrateamount
(% w/v)
130.0012542.501.00
220.0012535.002.00
310.00137.550.002.00
430.0015042.501.00
520.0012550.003.00
620.0015050.002.00
730.0015035.003.00
820.00137.542.503.00
910.0013735.001.00
Table 3. ANOVA table for the PF and PFN Taguchi models.
SourceSum of SquaresdfMean SquareF-Valuep-Value Prob > F
PFPFNPFPFNPFPFNPFPFNPFPFN
Model0.140.13550.0290.02528.0710.060.01010.0431
A—Type0.0640.070220.0320.03531.1114.040.00990.0300
B—concentration7.35 × 10−31.667 × 10−5117.350 × 10−31.667 × 10−57.146.701 × 10−30.07560.9399
C—Time6.667 × 10−53.840 × 10−4116.667 × 10−53.840 × 10−40.0650.150.81560.7206
D—Temp0.0730.055110.0730.05570.9322.060.00350.0183
Table 4. Monosaccharide constituents of PF and PFN cellulose (CPF and CPFN, respectively), hemicellulose (HPF and HPFN, respectively), and lignin (LPF and LPFN, respectively).
Monosaccharide ConstituentsMonosaccharide Constituents of Acid Hydrolysis (% w/w)
CPFCPFNHPFHPFNLPFLPFN
D-glucuronic acid4569tt
D-glucose60622937tt
L-arabinose10113022tt
D-xylose26223532tt
Table 5. Assignment of bands in the spectra of PF and PFN (cellulose, hemicelluloses, and lignin).
Peak Wave Number (cm−1)Band Assignment
PFPFN
Hemicellulose874 cm−1895 cm−1C1 group frequency or ring frequency is characteristic of b-glycosidic linkages between the sugar units
1032 cm−11039 cm−1C–O and C–C stretching or C–OH bending in hemicelluloses
1456 cm−11420 cm−1C–H vibrations of a polysaccharide or OH or CH2 bending
1633 cm−11634 cm−1Absorption ofwater
2925 cm−12924 cm−1C-H symmetric vibrations
3696 cm−13434 cm−1Hydrogen bond in the –OH group
Lignin1025 cm−11025 cm−1Skeletal vibrations of C-O
1122 cm−11122 cm−1Associated with cyclic ether
1390 cm−11383 cm−1Bending vibrations of phenolic OH
1456 cm−11456 cm−1C–H vibrations of a polysaccharide or OH or CH2 bending
1790 cm−11720 cm−1Carbonyl group C=Ocharacteristic of lignins
2925 cm−12925 cm−1C-H symmetric vibrations
3696 cm−13696 cm−1Hydrogen bond in the –OH group
3778, 3911 cm−13780, 3937 cm−1C-H stretching vibrations of methoxy groups.
Cellulose875 cm−1875 cm−1Refers to -CH rocking vibrations characteristic of a cellulose backbone and the β-glycosidic linkages between glucose units.
1032 cm−11032 cm−1C–O and C–C stretching or C–OH bending in hemicelluloses
1044 cm−11037 cm−1C-O-C stretching vibrations of the polysaccharide or ring stretching
-1382 cm−1C-H stretching
1456 cm−11430 cm−1C–H vibrations of a polysaccharide or OH or CH2 bending
1632cm−11632 cm−1Absorption ofwater
2925 cm−12925 cm−1C-H symmetric vibrations, asymmetric stretching of methyl and methylene groups
3434 cm−13429 cm−1Hydrogen bond in the –OH group
Table 6. ANOVA table for the Taguchi models of CPF and CPFN.
SourceSum of SquaresdfMean SquareF Valuep-Value Prob > F
CPFCPFNCPFCPFNCPFCPFNCPFCPFNCPFCPFN
Model45,564.4546,032.294411,391.1111,508.0712.4011.480.01590.0182
A—amount of enzyme8552.4112,152.48118552.4112,152.489.3112.120.03800.0253
B—shaking rate4638.362345.25114638.362345.255.052.340.08790.2009
C—Temp.39,626.3239,726.691139,626.3239,726.6943.1539.620.00280.0033
D—amount of substrate417.86595.7011417.86595.700.450.590.53700.4838
Residual3673.574010.7344918.391002.68--------
Cor total49,238.0150,043.0288------------
Publisher’s Note: MDPI stays neutral with regard to jurisdictional claims in published maps and institutional affiliations.

