Article

Role of a Mine in Changing Its Surroundings—Land Use and Land Cover and Impact on the Natural Environment in Barapukuria, Bangladesh

by
Hossain Mohammad Arifeen
1,
Md. Shahariar Chowdhury
1,2,
Haoran Zhang
3,
Tanita Suepa
3,
Nowshad Amin
4,
Kuaanan Techato
1,2 and
Warangkana Jutidamrongphan
1,2,*
1
Faculty of Environmental Management, Prince of Songkla University, Hat Yai, Songkhla 90110, Thailand
2
Environmental Assessment and Technology for Hazardous Waste Management Research Center, Faculty of Environmental Management, Prince of Songkla University, Songkhla 90110, Thailand
3
Geo-Informatics and Space Technology Development Agency (GISTDA), Bangkok 20230, Thailand
4
College of Engineering, Universiti Tenaga Nasional (The National Energy University), Jalan IKRAM UNITEN, Kajang 43000, Selangor, Malaysia
*
Author to whom correspondence should be addressed.
Sustainability 2021, 13(24), 13602; https://doi.org/10.3390/su132413602
Submission received: 4 November 2021 / Revised: 28 November 2021 / Accepted: 6 December 2021 / Published: 9 December 2021

Abstract

:
Land use and land cover (LULC) change is considered among the most discussed issues associated with development nowadays. It is necessary to provide factual and up-to-date information to policymakers to fulfil the increasing population’s food, work, and habitation needs while ensuring environmental sustainability. Geographical Information System (GIS) and Remote sensing can perform such work adequately. This study aims to assess land use and land cover changes concerning the Barapukuria coal mine and its adjacent areas in Bangladesh by applying remote sensing and GIS (geographical information system) techniques. This research work used time-series satellite images from the Landsat 7 ETM+ satellite between 1999 and 2009 and the Landsat 8 OLI/TIRS satellite for 2019. Supervised classification maximum likelihood classifier matrix was implemented using ERDAS Imagine 2018. The images were categorised into four definite classes: settlement, agricultural land, forest land, and waterbody. Analytical results clearly indicated that settlements and agricultural land had increasing and decreasing trends over the past 20 years, respectively. Settlements increased from 22% to 34% between 1999 and 2019. However, agricultural land reduced from 69% to 59% in the same period. Settlements grew by more than 50% during this period. The research had an overall accuracy of 70%, while the kappa coefficient was more than 0.60. There were land subsidence issues because of mining activities, leading to 1.003 km2 area being depressed and 1500 houses cracked. This research depicts the present LULC scenario and the impact of the coalfield area. It is expected to reduce the burden on policymakers to prepare a proper and effective mines development policy in Bangladesh and meet sustainable development goal (SDG) 15 (Life on land).

1. Introduction

Despite different meanings, land cover and land use (LULC) changes are frequently applied in the same context [1]. Land cover describes the natural characteristics of the earth’s surface, i.e., the dissemination of vegetation, water, soil and other elements of the land [2]. On the contrary, land use considers the human aspect of land use, emphasising the economic aspects [2]. Physical and socio-economic factors are the primary determinants influencing land use and land cover in an area. The changes in land cover/land use, mainly due to human intervention, play a vital role in comprehensively changing the atmosphere [3]. Geographical Information System (GIS) and remote sensing techniques have provided a comprehensive and fruitful method for land use and land cover mapping in an area, i.e., agricultural, built-up, and other forms [4]. Remote sensing data made it easy to analyse land use and land cover changes with reduced costs, lesser time, and better accuracy [5]. In fact, LULC mapping is one of the robust remote sensing applications [6]. In Ghana, remote sensing and geographical information system techniques were deployed to assess mine-related areas’ land use and land cover dynamics [7]. Landsat satellite imageries of three different periods, i.e., 1991, 2000, and 2014 were used to quantify land use and land cover changes in the area.
Image differences showed a positive correlation with land use and land cover changes. The study revealed the declining vegetation trend and the significance of using satellite imagery. The effect of coal mining on LULC changes was analysed for a period of 24 years, i.e., from the year 1990 to 2014 in the Godavari coalfield, India [8]. Research related to LULC change detection was conducted in the Dhanbad district of India [9]. The researchers utilised Landsat satellite images for 1997, 2009, and 2017 to retrieve LULC data of the study area using the supervised classification maximum likelihood technique. Eleven classes were devised based on satellite image interpretation. Several works relating to land use and land cover changes have been completed in Bangladesh. The works address different issues, such as watershed, urbanisation and so on. An initiative was taken to map the urbanisation of Dhaka megacity (1990 to 2006) with multi-sensor data [10]. Researchers assigned a Support Vector Machine (SVM) classifier and used a post-classification comparison to disclose spatio-temporal urban land-use and land-cover change patterns. Another work monitored and detected the land use and land cover change in Dhaka, Bangladesh, for 1960–2005 using topographic maps, multi-temporal remote sensing data, and the maximum likelihood supervised classification technique [11]. The study illustrated the expansion of Dhaka city, the capital of Bangladesh, over the time frame. During this time gap, urban area rose by 15,924 hectares, while agricultural land reduced by 7214 hectares. Another approach was devised to quantify the land use land cover changes in greater Dhaka, Bangladesh, by applying remote sensing techniques on Landsat images and processing population and economic data [12]. Researchers materialised the supervised classification principle along with the post-classification change detection model in GIS. They demonstrated that urban areas expanded while water bodies, agricultural land, and vegetation had a reducing trend.
Population growth and economic development are the forces for urban expansion. Moreover, Ahmed et al. [13] modelled Urban Land Cover Growth Dynamics Using Multi-Temporal Satellite Images in Dhaka, Bangladesh. LULC changes concerning Gazipur Sadar Upazila in Bangladesh were analysed during the 1973–2017 period using Landsat imagery and the maximum likelihood supervised classification algorithm [14]. They stated that urban areas had expanded while vegetation reduced during the same period. Sundarbans, the largest mangrove forest globally, had been assessed for forest cover from 1989 to 2000 using Landsat Thematic Mapper (TM) satellite imagery [15]. Three image processing modules, including Normalised Differential Vegetation Index (NDVI), maximum likelihood classification scheme, and sub-pixel classification, had been applied in the scheme. Research on forest land changes concerning the Chunati Wildlife Sanctuary (CSW) from 2005 to 2015 was conducted using Landsat images and a supervised maximum likelihood classification algorithm [16]. A study of Tangoar haor, a Ramsar site of Bangladesh, revealed that approximately 40% of land cover from the studied area had been converted into other types during the last 30 years (1980–2010) [17]. It was achieved using GIS, remote sensing techniques, and the maximum likelihood supervised classification method. The study clearly stated that forest and highland disappearance increased while settlements increased. Halda watershed, the most potent fish breeding zone in Bangladesh, was analysed for the last 40 years (1978–2017) and classified into five categories: water, vegetation, agriculture, bare soil and settlements [18]. Their research indicated a significant shift in water and vegetation to agricultural land, bare soil, and settlement areas. Arifeen et al. [19] recently researched land use and land cover change detection, urban expansion, and determining factors in Gazipur, Bangladesh. They found higher urbanisation due to population and economic growth, location, and accessibility. Rohingya population played a critical role in changing the environmental setting of Cox’s Bazar, Bangladesh [20]. The study simulated outcomes showing vegetation reduction habitation growth by 2030.
In northern China, coal mining-related subsidence is a prime geohazard [21]. Coal mine subsidence and deformation mapping were conducted using Differential SAR (Synthetic Aperture Radar) Interferometry. Improved radar interferometry and persistent scatter interferometry was used with the small baseline subset methodology to demarcate and quantify the surface distortion of an underground coalfield in Springfield, Illinois, USA [22]. From 1992 to 2000, the highest subsidence rate was −4.1 mm/year, and during 2007–2011, it was −35.9 mm/year.
Bangladesh is a developing nation having a rapid growth rate. According to the World Bank, Bangladesh’s Gross Domestic Product (GDP) growth rate was 7.9% in 2018 [23]. Fulfilling the development goals in Bangladesh leads to higher energy needs, and coal is an important energy source to fulfil this requirement. The Barapukuria coal mine is the only operational coal mine in Bangladesh. Hence, the impact of mining-related LULC changes was assessed to reduce the adverse effect on the atmosphere, policy-making, and actual land administration [8,24,25,26]. Satellite data is critical and significant for verifying changes in land use and land cover [8,27]. There are some research works related to land use and land cover in Bangladesh. These works employed GIS and Remote sensing techniques; however, there is no research concerning mines. This work is the first attempt to analyse land use and land cover changes in a mining zone in Bangladesh.
The area has witnessed changes due to anthropogenic aspects related to mining. In the future, this area might be severely impacted in the LULC context, and this area’s natural aspects could be impacted. Moreover, the knowledge obtained by studying this coal mine will educate policymakers and mine developers about different environmental issues and the harmful consequences of mining. This knowledge could be used while preparing policies for developing other coal mines in Bangladesh. Therefore, the primary goal of this venture is to observe LULC changes in a specific time frame and analyse the pattern of changes by incorporating GIS and remote sensing algorithms. This data will help determine how mining adversely affects nature and impacts efforts towards Sustainable Development Goal (SDG) 15 (Life on Land).

2. Study Area

The area of interest lies in the Dinajpur District in Northwest Bangladesh. It consists of the environment close to the Barapukuria Coal Mine (BCM) (25°32′51.42″ N, 88° 57′38.42″ E). Bangladesh is the 8th most populated country globally and is experiencing high population growth of about 1%/year over the recent decades [28], causing urbanisation. It affects food and energy supply.
The BCM started operations in 2005, and the selected study area has witnessed land cover changes. Local urbanisation and infrastructure increased to sustain a sufficient labour force and a high production rate. Furthermore, it was observed that the mining activities caused subsidence in a broader area, causing resettlement. These changes make the area suitable for a geospatial investigation. It is challenging to overcome geographical limitations without field exploration; hence, the first estimate concerning the study area was derived from personal experiences as Bangladeshi residents. Additionally, a 5 km buffer zone was considered, as modelled by Peeters et al. [29] for an open-pit mine in Australia. The application of this model for the current case is beyond the scope of this work due to a lack of data. However, in the final step, the circular buffer was replaced by administrative boundaries to obtain additional regional information.
The final study area consists of four unions, the smallest administrative units of Bangladesh, namely Habra and Hamidpur, from sub-district (locally called Upazila) Parbatipur and Shibnagar and Paurashava from sub-district Phulbari (Figure 1). These areas have a total land area of 142 km2 affected by the BCM. There are four LULC classes [30] designated for this study (Table 1).

3. Materials and Methods

The primary focus of the study was to identify the changes in land use land cover of a mining area by analysing the medium resolution and open-sourced satellite images of different years with a definite time gap.

3.1. Data Selection and Collection

The research was based on the temporal analysis of satellite imagery of a mining area. Hence, selecting satellite sensors and associated images was the first significant task [31]. Landsat satellite images (Table 2) were selected for the experiment before the literature review concerning previous works. All images were acquired from the United States Geological Survey’s image-related website: earth explorer (www.earthexplorer.usgs.gov (accessed on 20 April 2021)). The images were selected from late November until the end of March (dry season in Bangladesh) to eliminate the effects of seasonal variability. The flight line that covered the area was path 42 and row 138.
Landsat data are multi-spectral, having different colour bands. The study used data from the Landsat Enhanced Thematic Mapper Plus (ETM+), Operational Land Imager (OLI), and Thermal Infrared Sensor (TIRS) sensors

3.2. Image Pre-Processing

Image pre-processing and analysis entailed several steps before the final output was generated. The Earth Resource Development Association System (ERDAS) Imagine 2014 software was used to accomplish the pre-processing tasks. The layer stacking tool was utilised to merge the bands 1–5 and 7 for Landsat 7 images and band 1–7 for Landsat 8 images to create a single band comprising all images (1999, 2009, and 2019).
Landsat 8 bands 5, 4, and 3 and Landsat 7 bands 4, 3, and 2 were used to obtain image data for analysis. Landsat 7 images for 2009 had (Scan Line Corrector) SLC-off data; hence, the Landsat Toolbox was downloaded and added to Arc Toolbox of ArcMap 10.2.2.
Each band was then processed for scanline error correction. Subsequently, the subset tool in ERDAS was used to determine the study area for the images. The UTM (Universal Transfer Mercator) 46 N coordinate system was utilised to re-project the images. Finally, using the panchromatic band (No. 8 for both Landsat 7 and Landsat 8) having a 15-m resolution, the area was pan-sharpened (Figure 2) for better resolution. The pan-sharpened image was 15 m × 15 m.

3.3. Image Classification

Digital image classification in remote sensing detects and clusters similar image pixels into the same information categories produced from several spectral bands of a satellite image [31,32,33]. The supervised maximum likelihood classifier method was used for this analysis. It is a popular conventional pixel-based method where signature files consisting of means and covariance matrices for each class were created before running the classification result. These signatures were used with a classifier (maximum likelihood) to assign each image pixel to a discrete class. In supervised classification, the analyst selects and digitises polygons (training areas) and places these polygons in an AOI (Area of Interest) layer to create the signature files, rather than using an automated routine to define the most separable classes.
In Imagine, an individual training site is delineated as an “area of interest” and given a class name. The pixels within the training site were used to generate a “signature.” This process is repeated to gather several training sites for each class. Subsequently, polygons with the same signature were merged and given the class name. After generating the signature file, the supervised image classification (maximum likelihood classifier) method was run to classify the images based on the designated class. A 3 × 3 majority filter was applied to the map to reduce the salt and pepper effect [34].

3.4. Change Detection

The following formulae are applied to detect changes in land use and land cover type in a specific/given period [35]:
Dc = (At2 − At1)/At1 × 1/(t2 − t1) × 100%
where Dc denotes land use dynamic degree, At1 represents the area of a land-use type at t1, and At2 represents the area of this land-use type at t2.
C = (At2 − At1)/At1 × 100%
where C is the area variation in land use rate, At1 represents the area of a land-use type at t1, and At2 represents the area of this land-use type at t2.

3.5. Accuracy Assessment

It is critical to assess the accuracy of digital image classification. Accuracy assessment is usually implemented using a fresh set of ground truth data or comparing it with a previously classified reference map for selected sampling points [31]. However, those options could not be used due to various constraints (e.g., timespan, budget) associated with the project.
However, field experience in 2016 (February–April) made the task comparatively easier concerning land class identification. Google Earth was used as the validation tool. Historical high-resolution images from Google Earth Pro were utilised for accuracy assessment.
The following formula was applied for accuracy assessment:
Overall accuracy = Total number of correctly classified pixels/Total reference pixels × 100
User accuracy = Number of correctly classified pixels/Total number of classified pixels (Row total) × 100
Producer accuracy = Number of correctly classified pixels/Total number of classified pixels (Column total) × 100
Kappa coefficient = (TS × TCS) − ∑ (Column total × Row total)/ TS2 − ∑ (Column total × Row total)
where TS = Total sample; TCS = Total corrected sample

4. Results

This section comprises subheadings. It provides a concise and precise description of the experimental results, interpretation, and conclusions.

4.1. Land Use and Land Cover Status

4.1.1. LULC Status of the Study Area, 1999

In 1999, the study area was dominantly covered by agricultural land (69%). As Bangladesh is an agricultural country, most lands were agricultural, followed by settlements (22%), water bodies (8%), and forests (1%). (Figure 3 and Table 3).

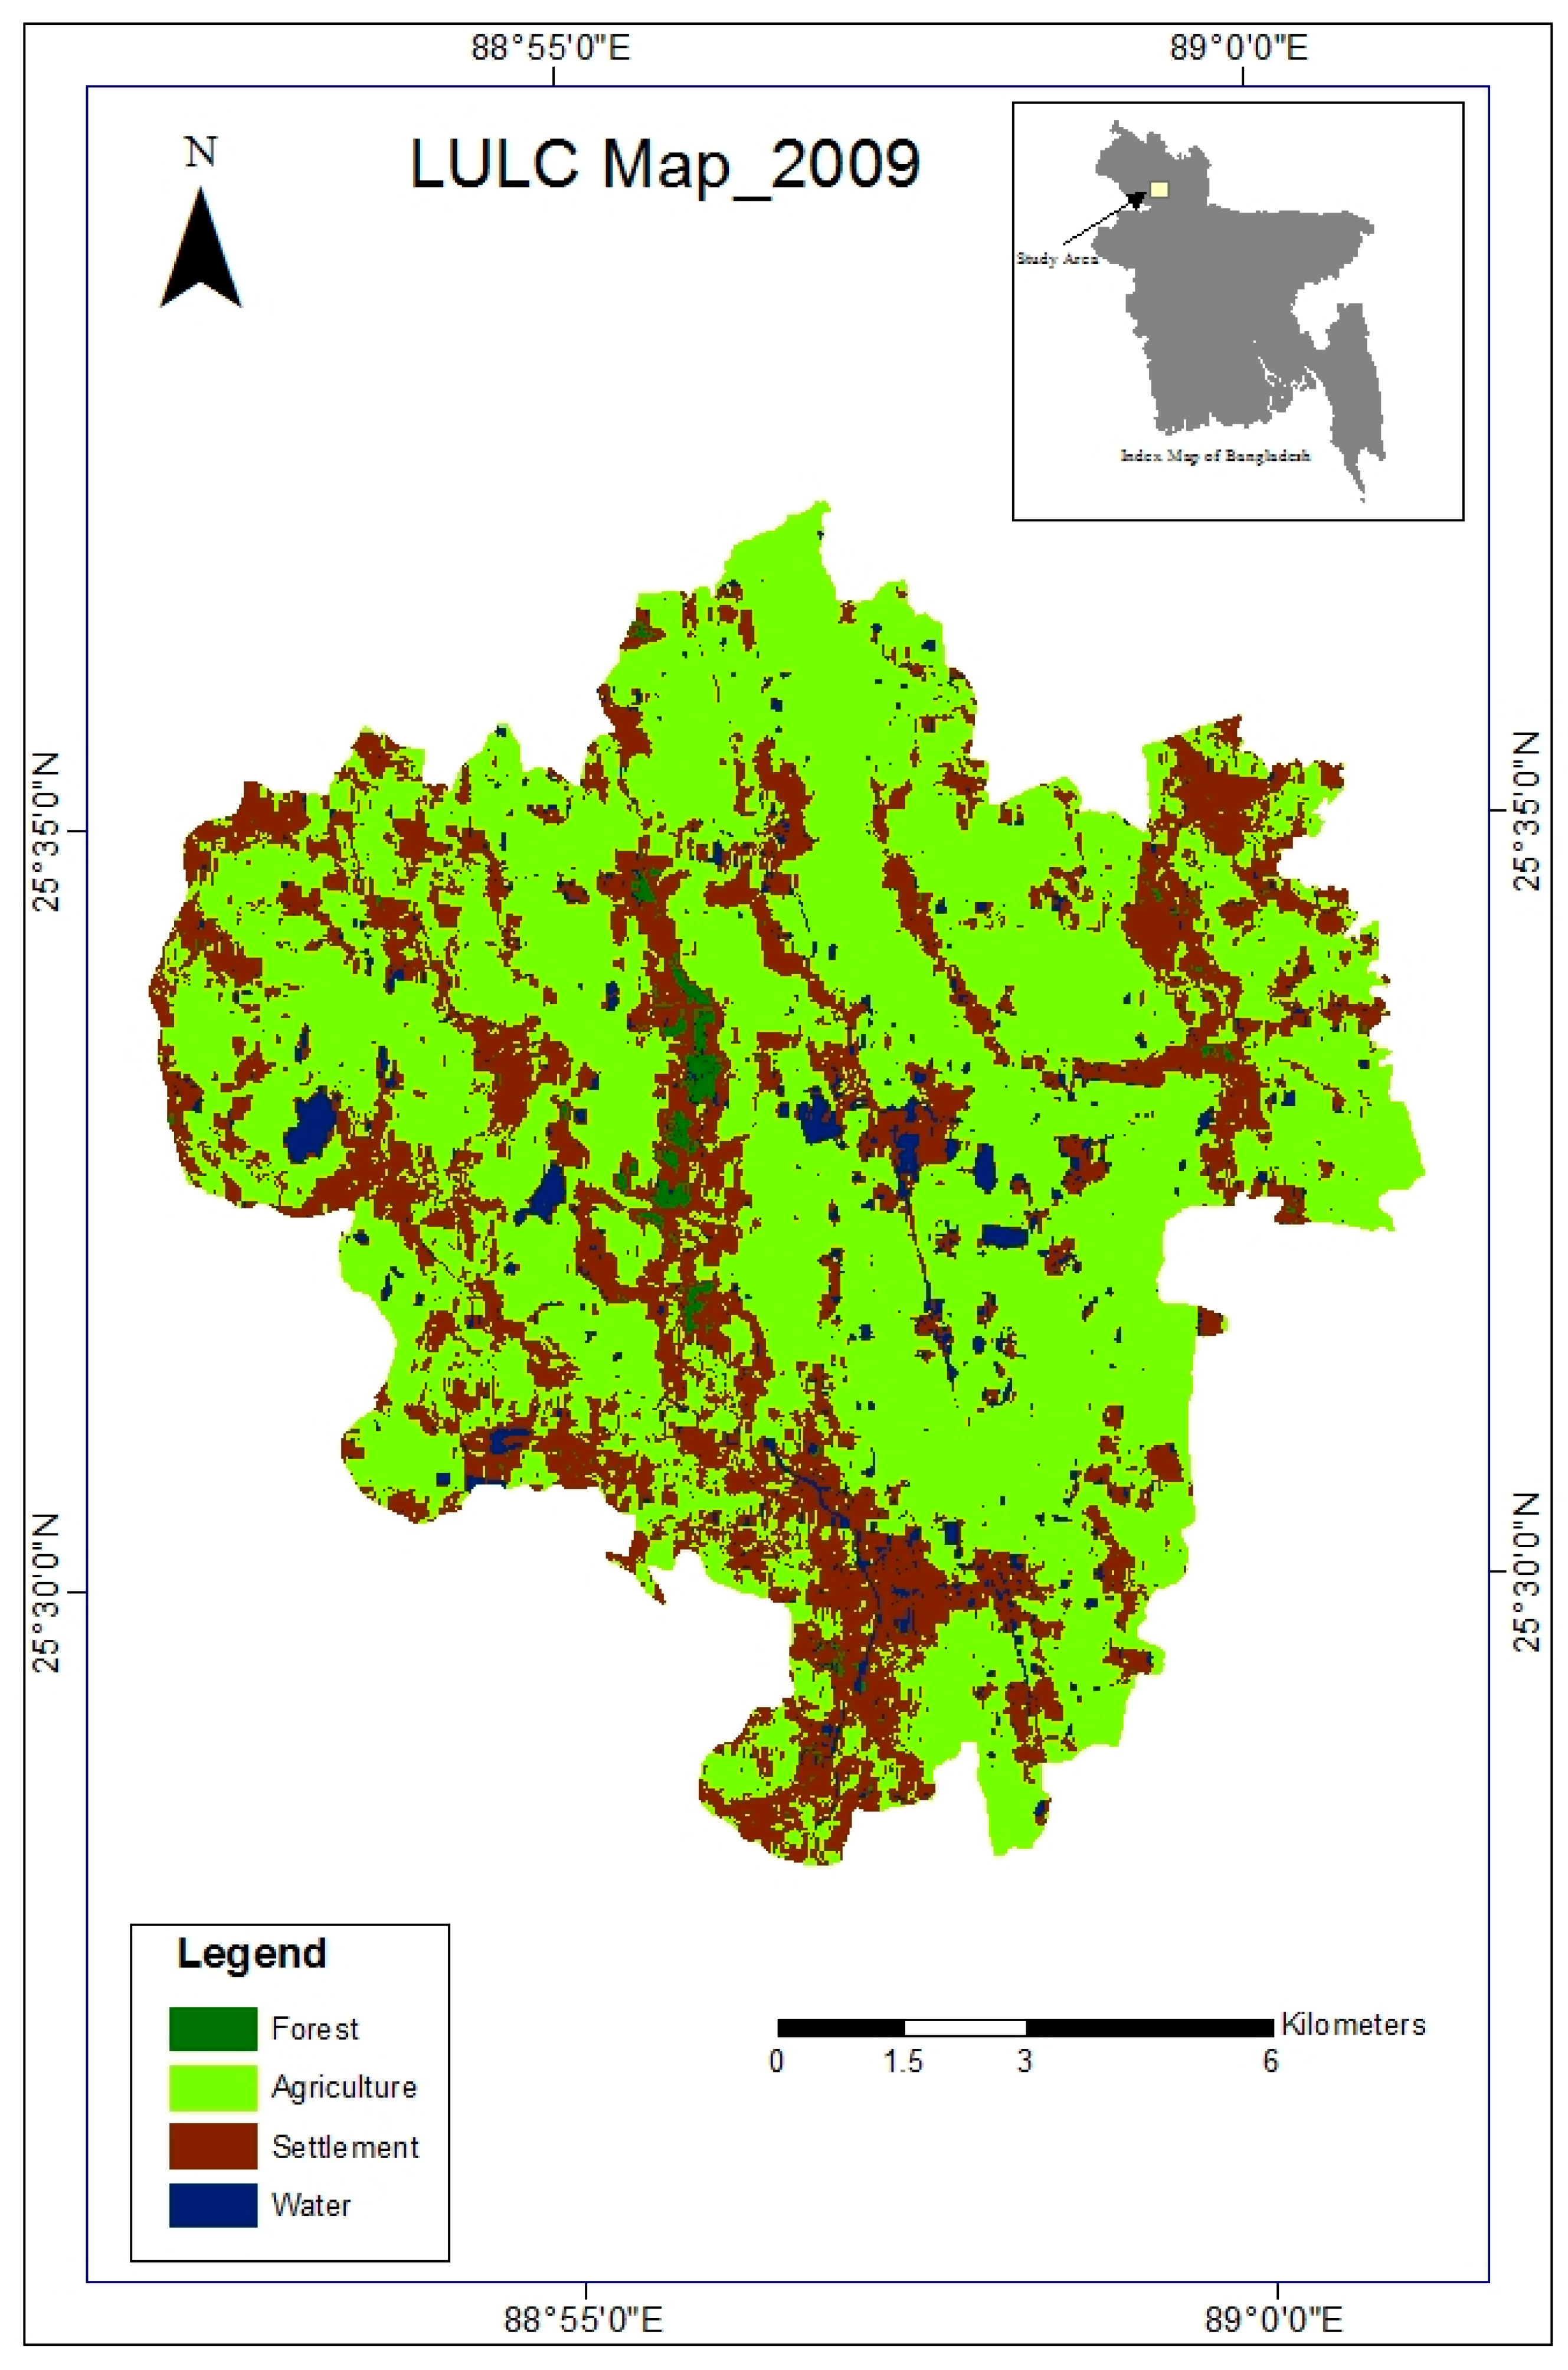
4.1.2. LULC Status of the Study Area, 2009

In 2009, the study area was dominantly covered by agricultural land (68%). The total agricultural land decreased approximately 1.5% but occupied the maximum area. Settlements increased to 28% in that year, and water bodies and forest area decreased to 3% and 1%, respectively (Figure 4 and Table 3).

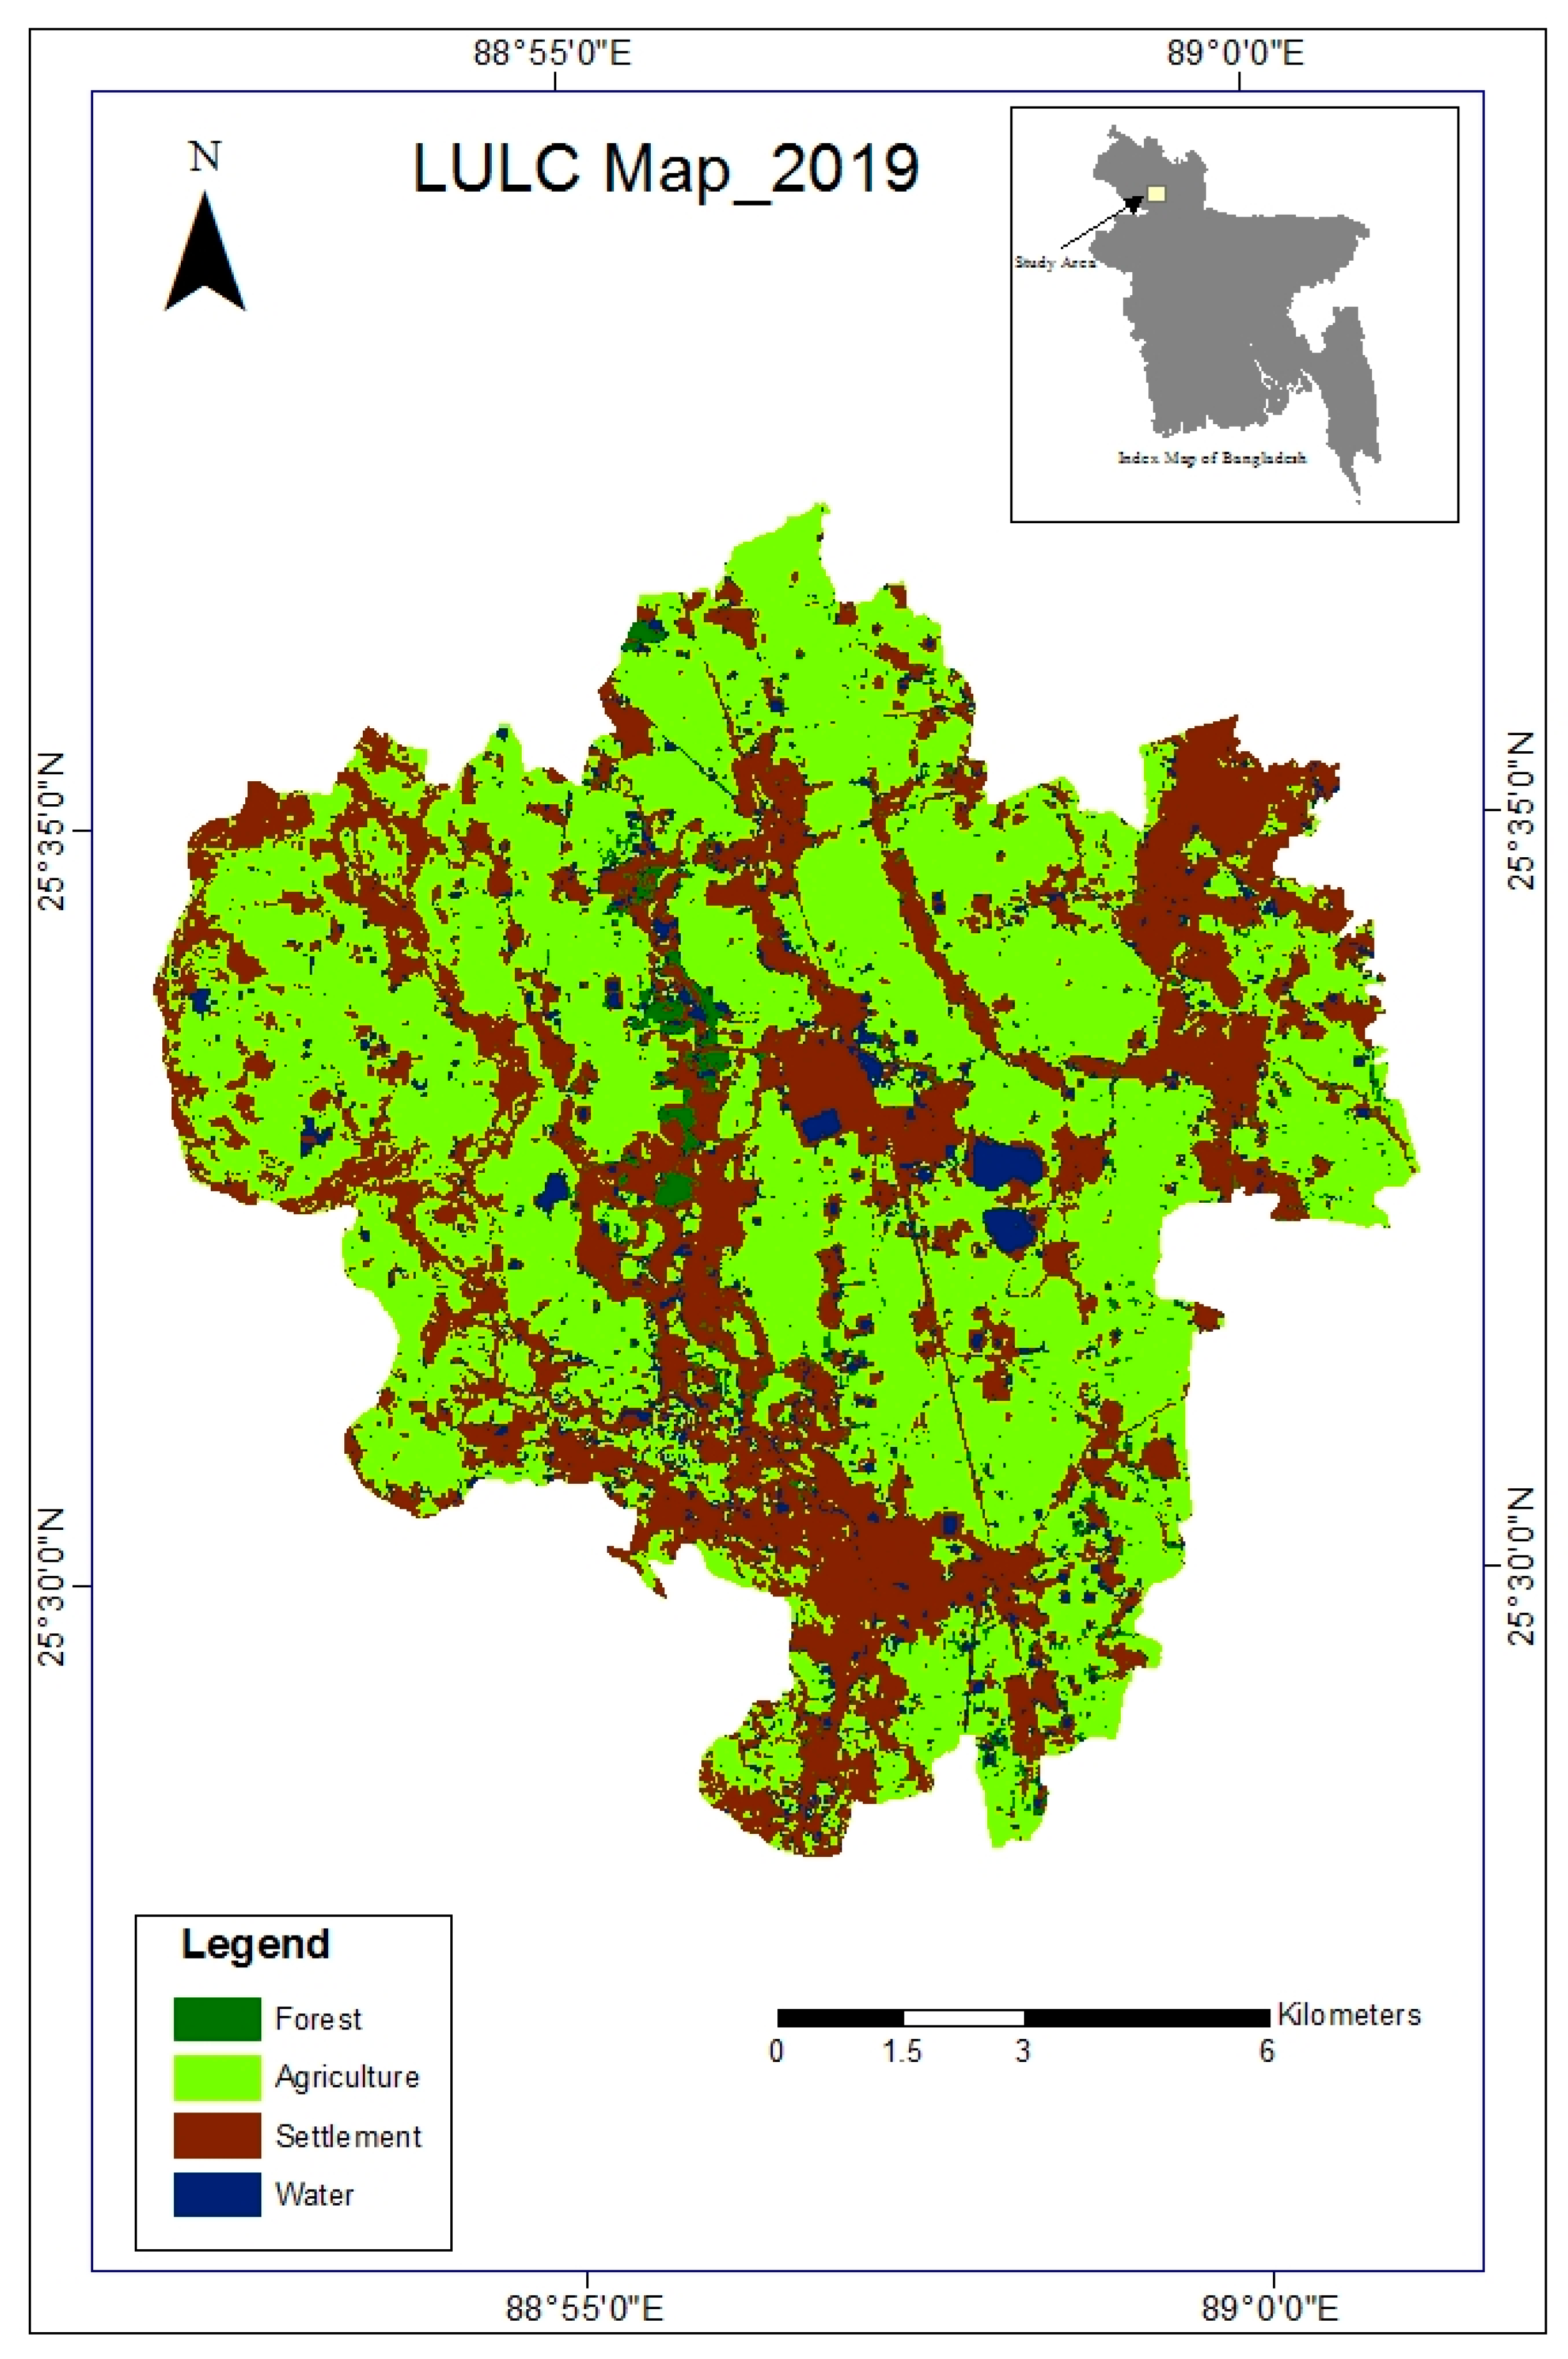
4.1.3. LULC Status of the Study Area, 2019

In 2019, the reducing agriculture trend continued, and agricultural land was approximately 59%, while settlements expanded to about 34% of the total area. Water bodies and forest areas increased slightly to 5% and 2% (Figure 5 and Table 3).
Table 3. Type and year wise LULC distribution of the area (Hectares).
LULCArea 1999Area 2009Area 2019
Hectare%Hectare%Hectare%
Water1079.7537.609414480.1953.384111788.2655.555194
Forest179.641.265989123.9750.873698282.5551.991269
Settlement3143.90322.156244000.83828.195384775.24333.6529
Agriculture9786.39868.968369584.68567.546818343.6358.80064
Grand Total14,189.6910014,189.6910014,189.69100
Table 4 summarises the changes corresponding to years 1999, 2009, and 2019 concerning area (Hectares), percentages (%), and annual average (Hectares) considering the four LULC classes.

4.2. Statistical Analysis

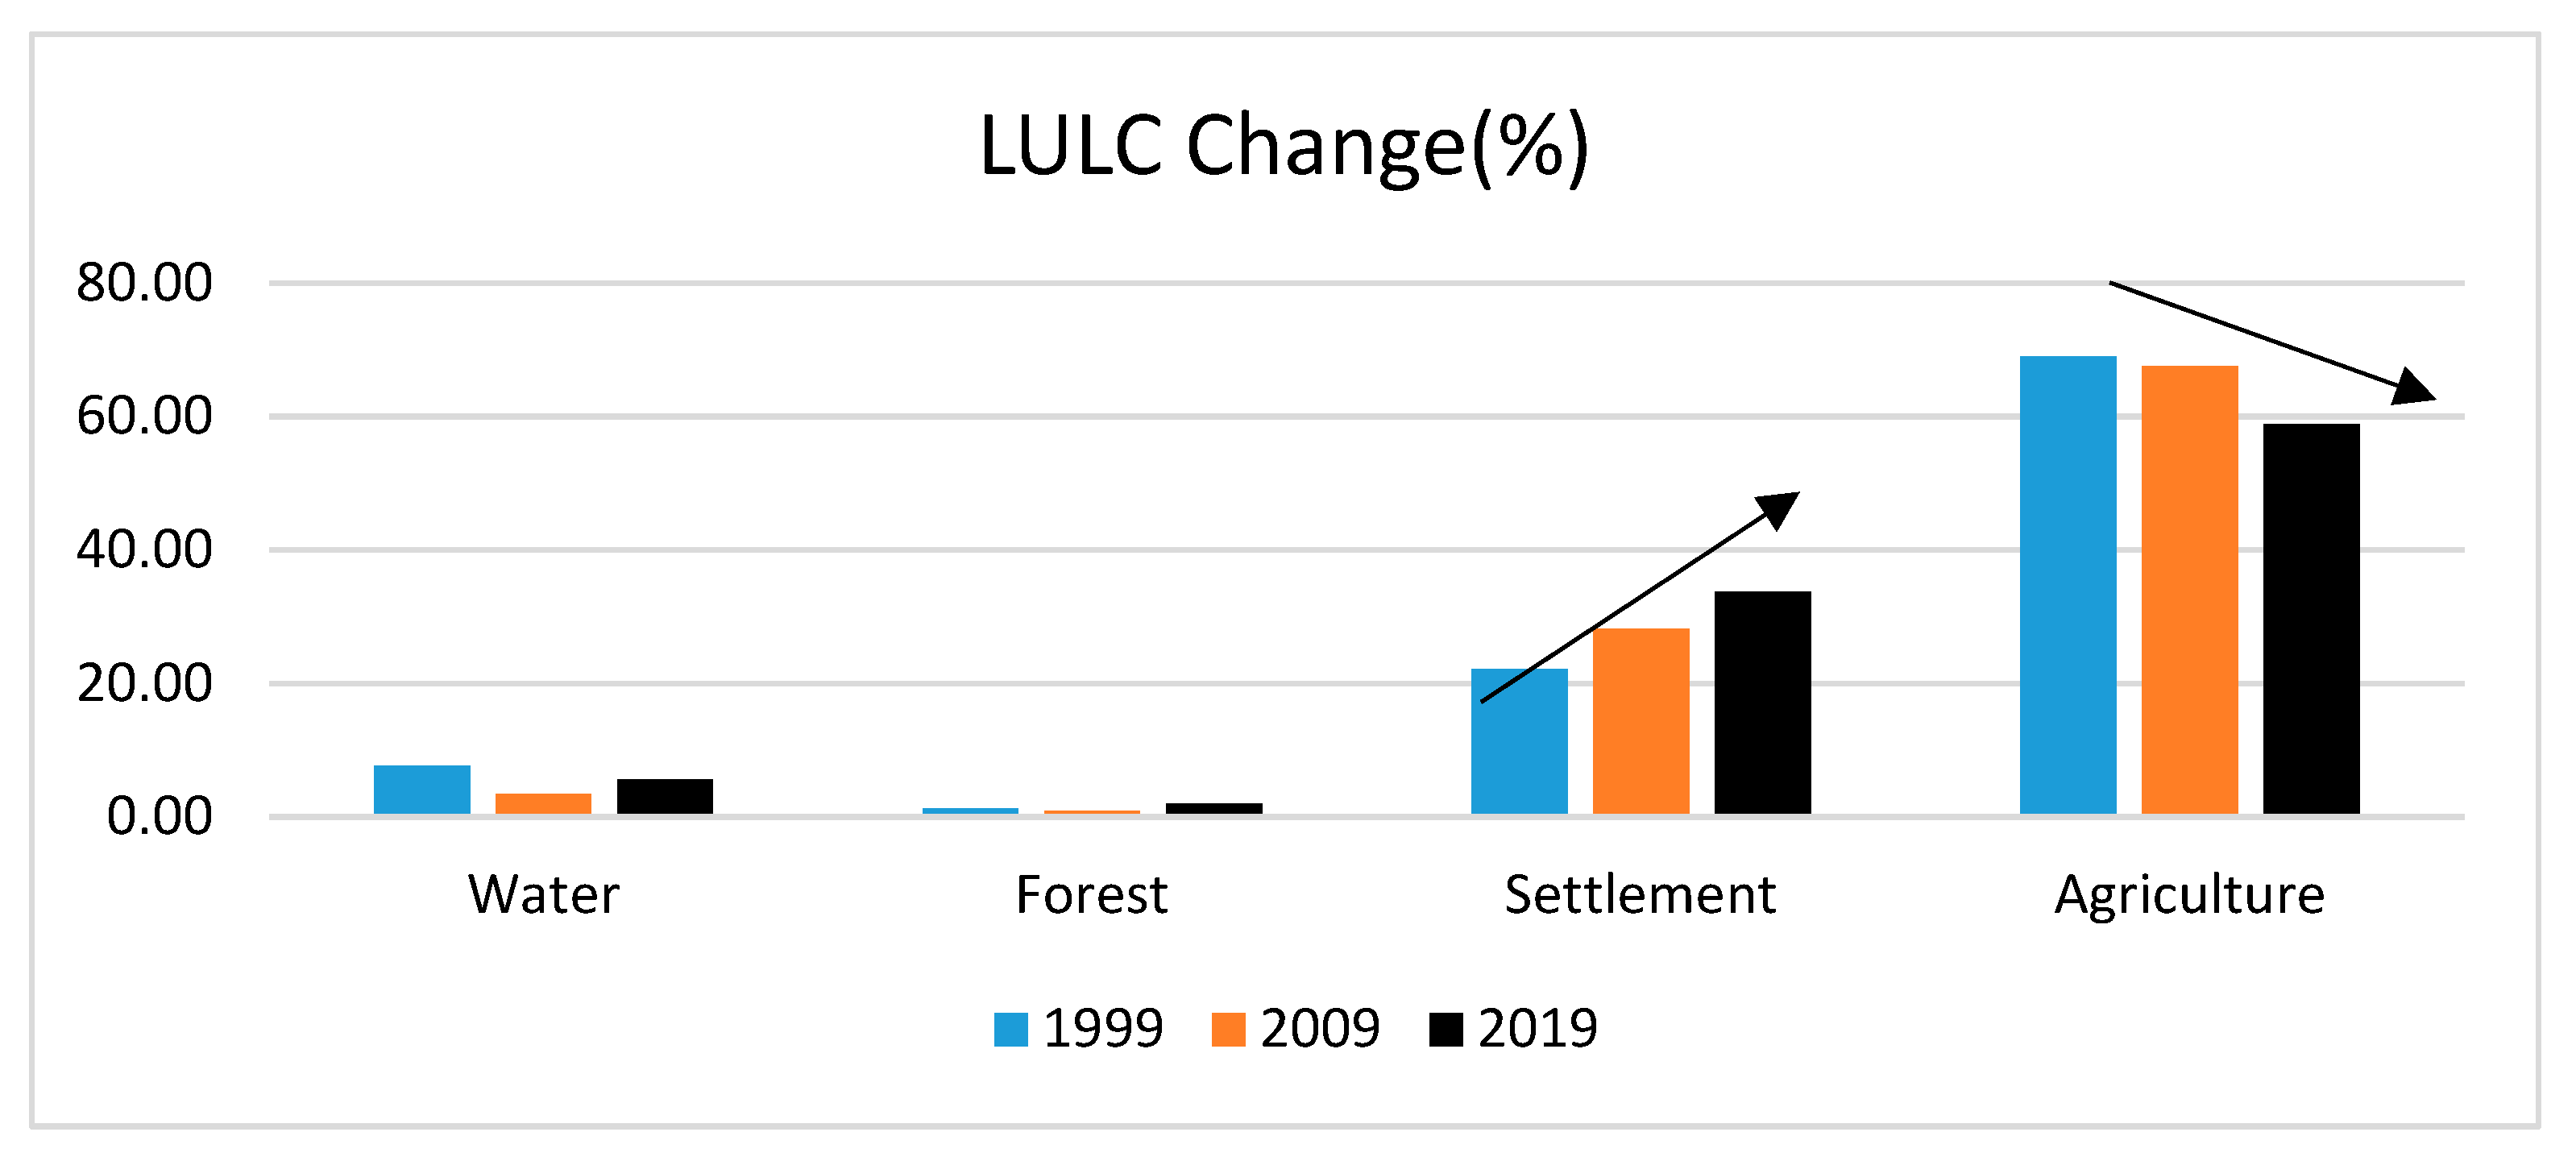
Percentage-based land cover distribution for different years is depicted in Figure 6.
The figure depicts the increase in settlements (built-up area) and decreases in agricultural land. It also implies the conversion of agricultural lands into settlements. In 1999, agricultural land was approximately 69%, while settlements were around 22%. However, in 2019, settlements occupied about 34% of the area, and agricultural land was around 59%. Settlements expanded by more than 50% from their previous state (22% to 34%) during these 20 years. It resembles the case in Sikkim, India, where the built-up area rose, and cultivation land shrunk [36]. The built-up area increased 2.13% (5.41 km2), and agricultural land dropped 2.83% (7.22 km2). Figure 7 and Figure 8 illustrate the relative changes in area (hectares) and percentage of the land-use class types. Settlements (Built-up/Urban) increased in the entire analysis period, while other land classes demonstrated mixed trends; however, agricultural land decreased rapidly.
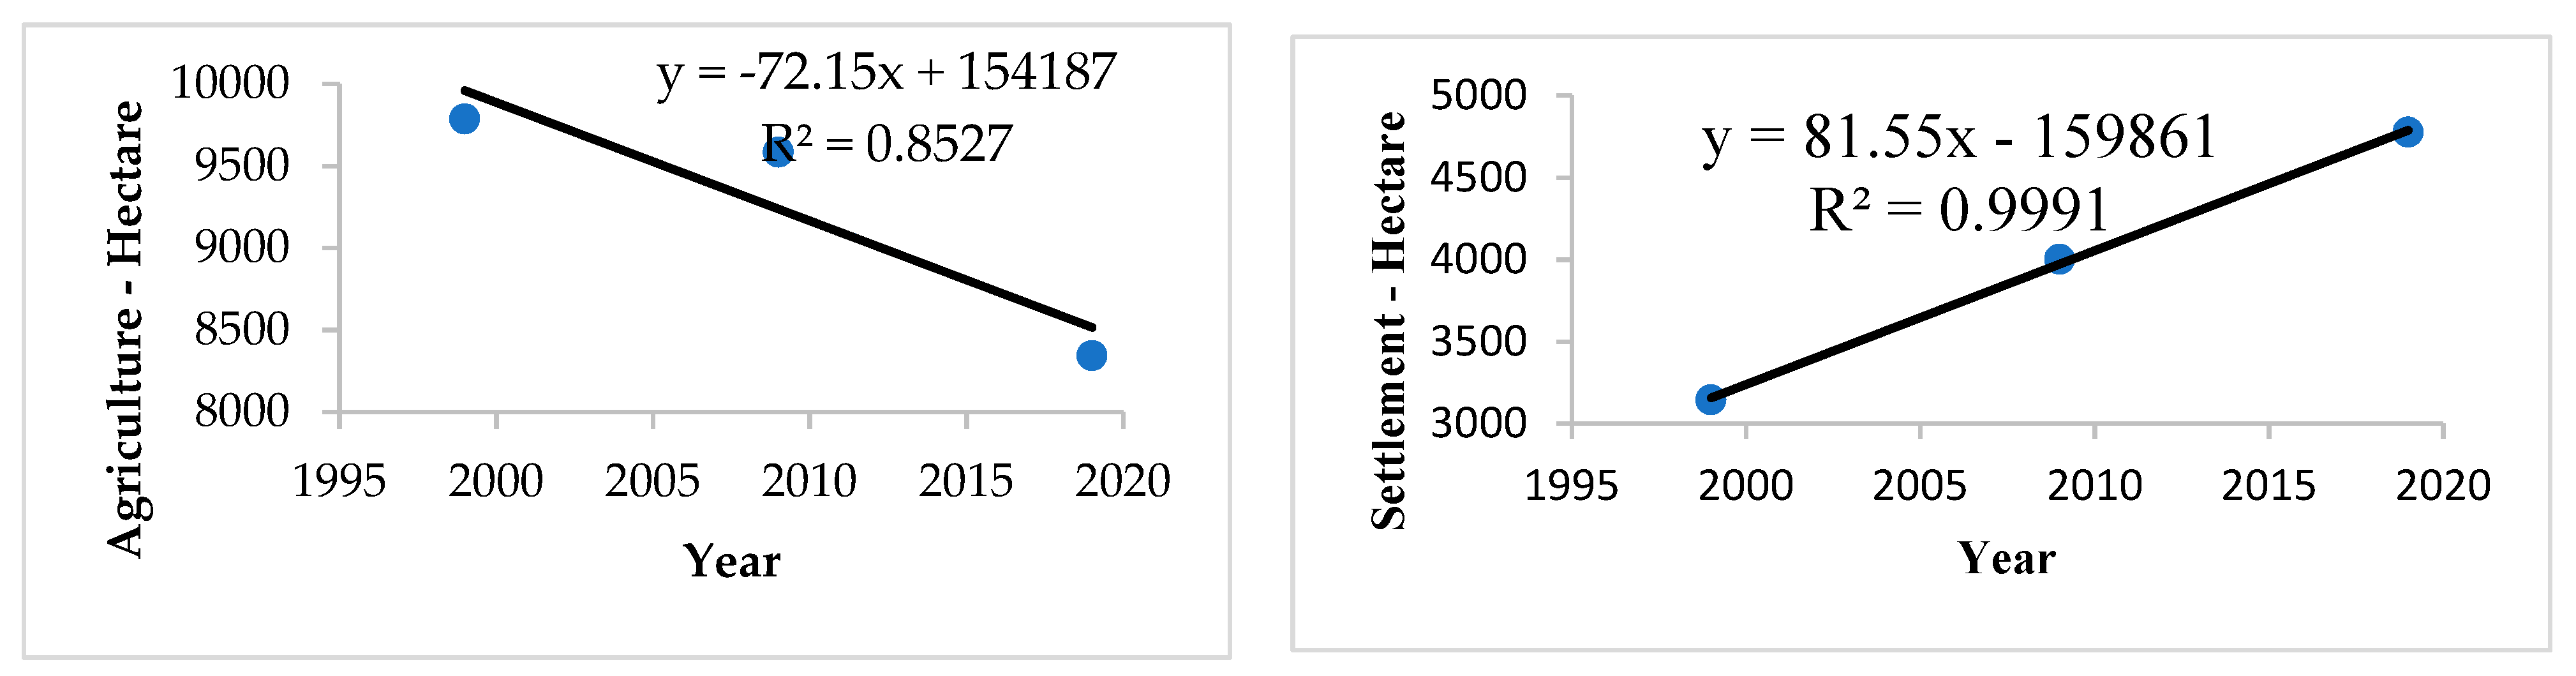
LULC is strongly correlated with time (Figure 9).
With time, it is noted that the reduction or enhancement of land class type is noticeable, which is crucial to evaluate each land type’s internal connection.
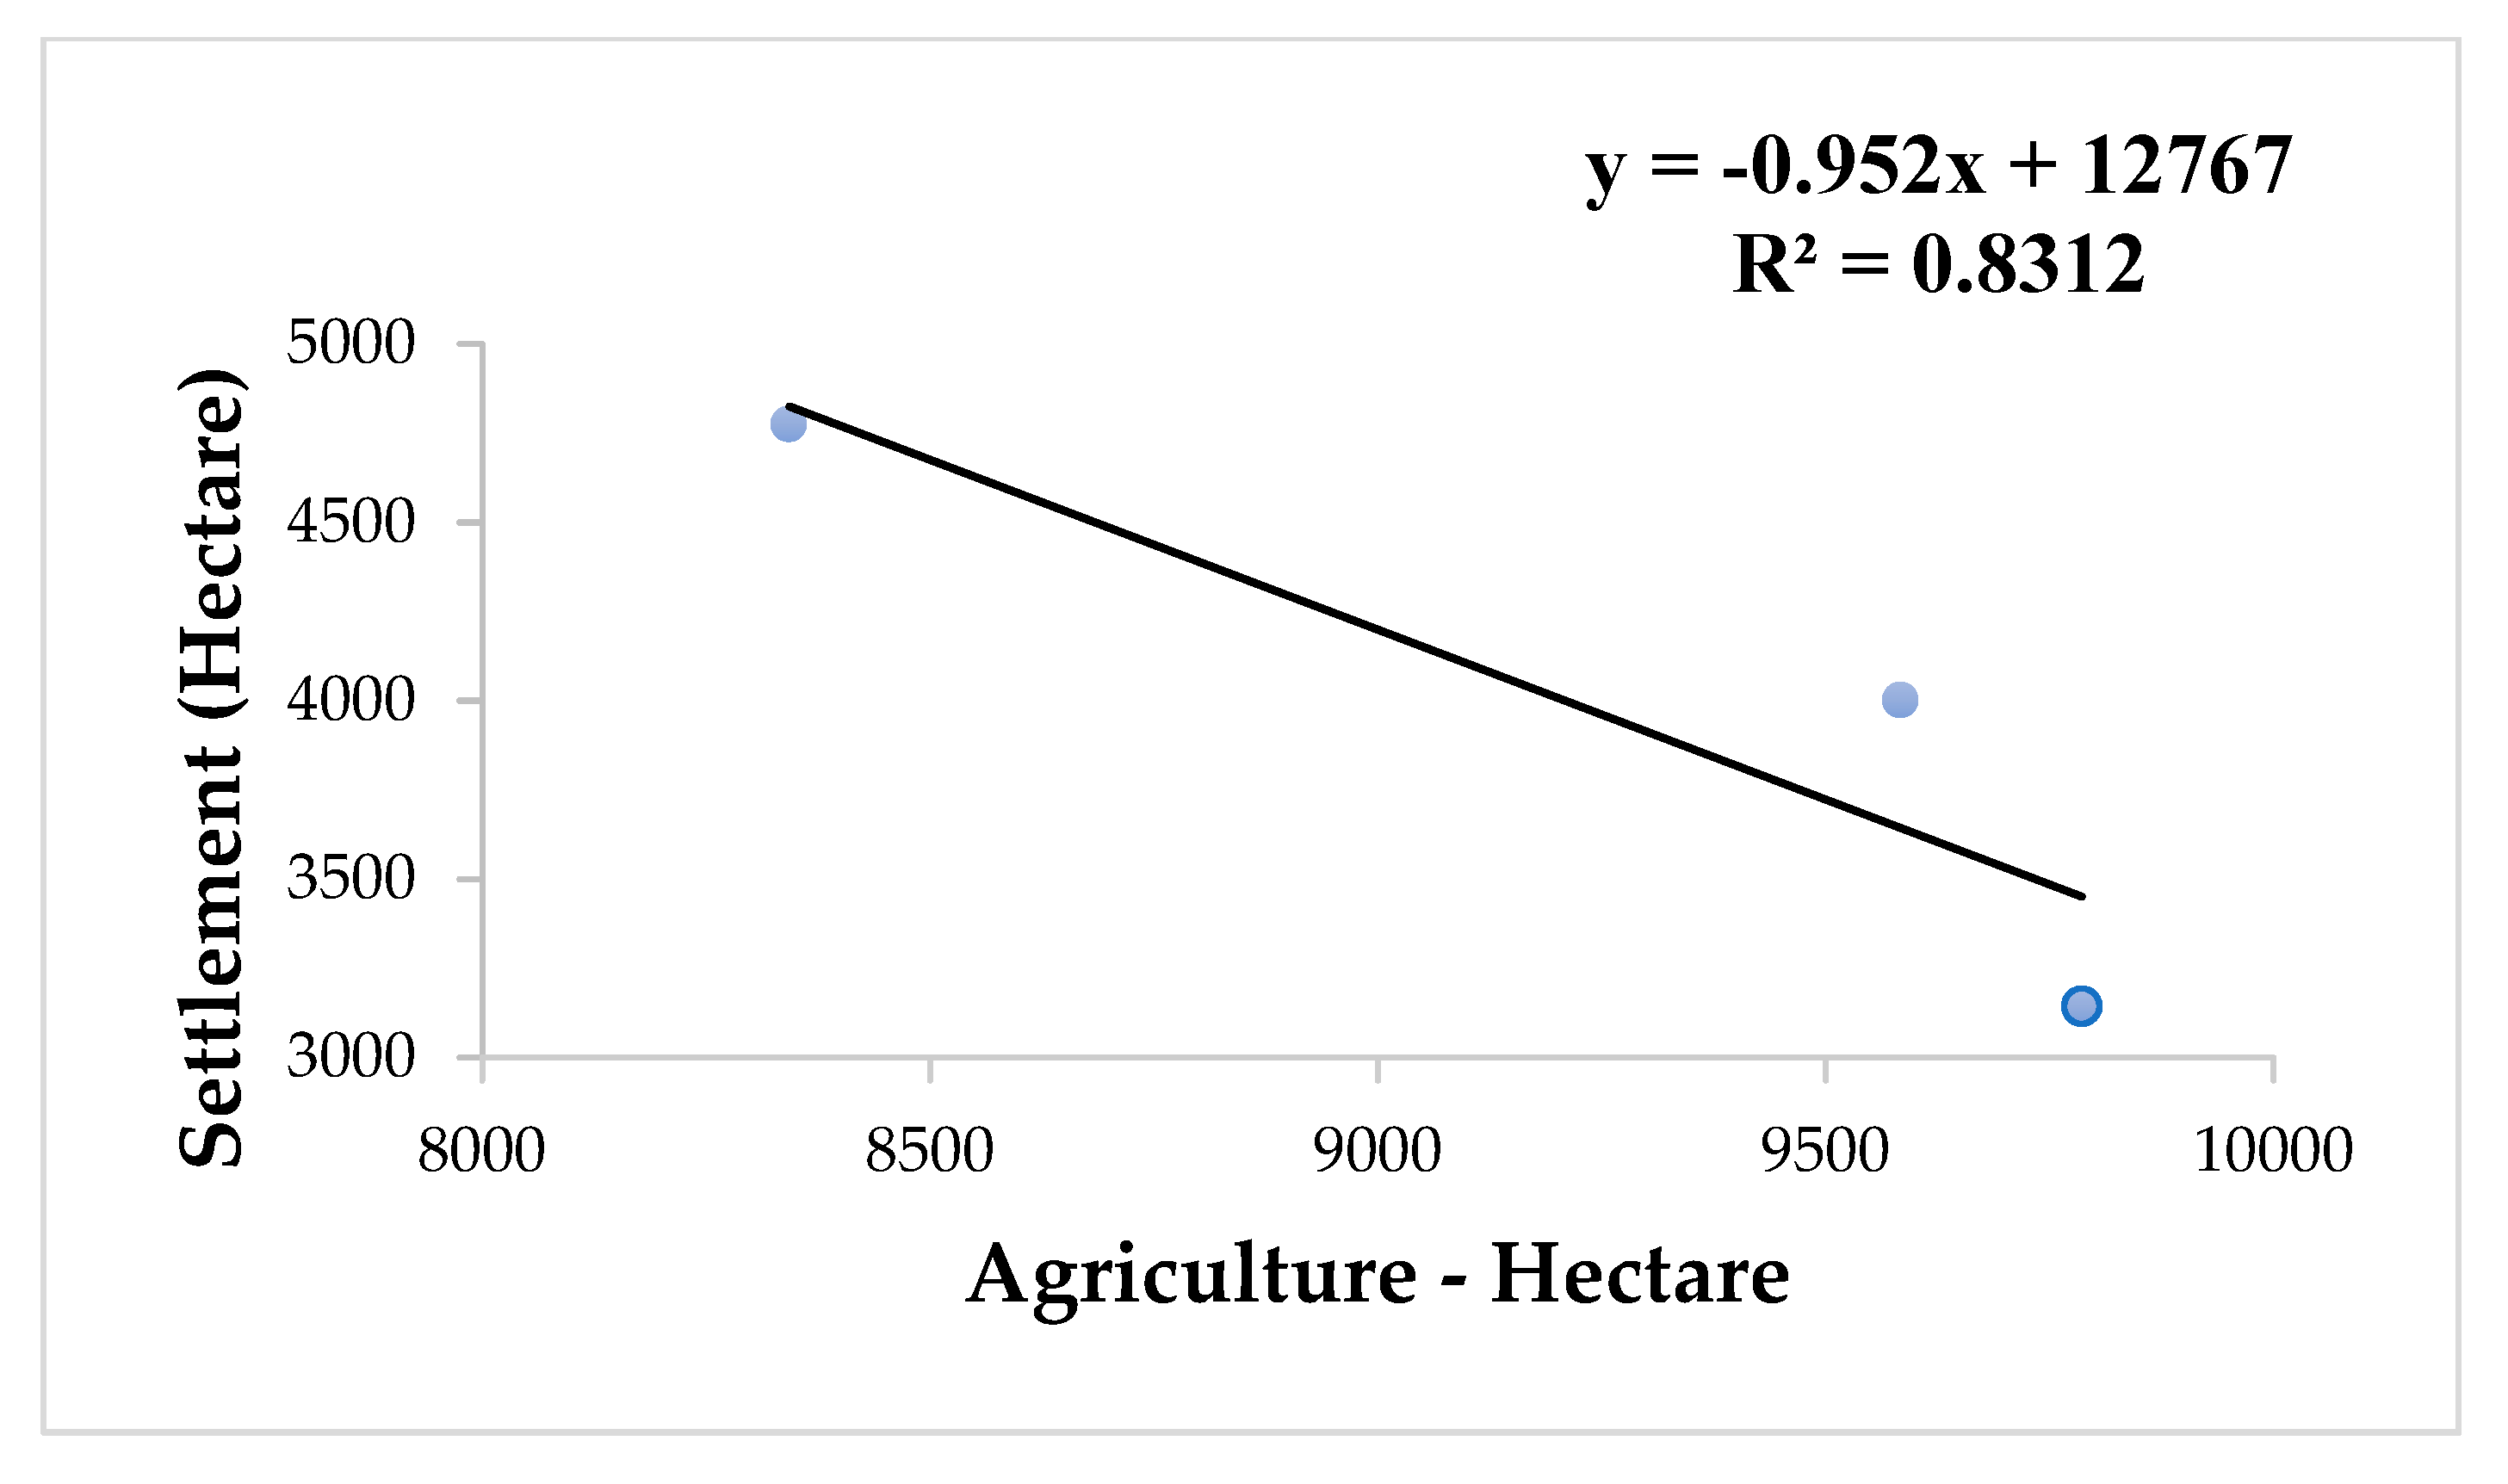
The prominent land use classes are correlated and have decreasing or increasing trends (Figure 10). The following statistical figure demonstrates that rising settlements correlate strongly (negatively) with the downward movement in croplands (R2 = 0.8312).

4.3. Changes by Land Type

The changes in the study area during the observation period is categorised into two types: immediate change and ultimate change. Immediate change denotes the changes every ten years, while ultimate change indicates the overall change during the study period.

4.3.1. Immediate Change

(I) Changes between 1999 to 2009: During 1999–2009, except settlements, all LULC types, including agriculture, forest, and water, had a declining trend. Six hundred hectares of water body area was lost (Figure 11 and Table 5). In 1999, water bodies totalled around 1080 hectares. In 2009, water bodies lost area to agriculture and settlements. Forestry and agriculture also lost area during this period. On the contrary, settlements increased to 857 hectares, gaining 27.26% of land area, equalling 86 hectares per year.
(II) Changes between 2009 to 2019:
During 2009–2019, except agriculture, every type of LULC, including settlements, forests, and water bodies, had an upward trend. Settlements gained 774 hectares (Figure 12 and Table 6). In 2009, the area of all settlements was around 4000 hectares. In 2019, settlements borrowed land from agriculture, water, and forest use. Forestry and water also lost area during this period. There was a significant loss in agricultural area because most agricultural land was used for settlements.

4.3.2. Ultimate Change

Changes between 1999–2019:
During 1999–2009, in the broader sense, settlements and forests gained land while agriculture and water bodies were lost. Settlements increased by 1600 hectares during the mentioned time frame, and forests gained 100 hectares (Figure 13 and Table 7). On the contrary, agriculture reduced by 1443 hectares, and water bodies declined tentatively by 300 hectares. Overall, settlements increased by 52%, and forests increased by 57% from 1999 to 2019. Agricultural land reduced by 15%, and water bodies decreased by 27%.

4.4. Accuracy Assessment

Validation of the four land classes in terms of overall accuracy and kappa coefficients was executed for 1999, 2009 and 2019. One thousand randomly identified points were created on the Arc map for land use and land cover maps of 1999, 2009 and 2019.
The first 20 points of each LULC class for 2019, 2009 and 1999 were exported to Google Earth Pro for accuracy assessment. The prepared LULC classes were validated using Google Earth (Table 8, Table 9 and Table 10).
For 2019, producer accuracy, user accuracy, overall accuracy and kappa coefficient values were the four metrics computed for assessment. Producer accuracy ranged between 52.63 and 100; user accuracy ranged between 60 and 100; overall accuracy was 73.75%, and kappa coefficient was 0.65.
For 2009, producer accuracy ranged between 56.67 and 100, while user accuracy ranged between 50 to 90. Overall accuracy was 72.50%, and the kappa coefficient was 0.63.
For 1999, Google Earth did not have higher resolution images to indicate precise positions concerning specific land classes. As research accuracy assessment is based solely on images provided by Google Earth, it was infeasible to validate settlements data for 1999. However, expert knowledge and experience indicated that settlement (built-up) areas are established near roads and riversides; these areas have a sporadic tree presence. Hence, it can be inferred that settlements were validated correctly to some extent.
Moreover, during the dry period (November–March), seasonal channels dried, causing data mismatch—homestead trees were confused for forests. These happened for all periods (1999, 2009 and 2019). In 1999, producer accuracy ranged between 63.16 and 100; user accuracy ranged between 60 and 90. Overall accuracy and kappa coefficients were 75% and 0.67, respectively.
Overall accuracy exceeded 70%, and the kappa coefficient value was more than 0.60 for each work period.

5. Environment Impact

The conducted research is pertinent to the changes of LULC in the Barapukuria Coal Mine under the district of Dinajpur, Bangladesh. The research work was conducted incorporating GIS and remote sensing techniques and open-sourced Landsat imageries to reveal the surficial land type changes before and after the establishment of the coal field. The major increasing land class is settlement, while decreasing class is agricultural land.
The three maps (Figure 3, Figure 4 and Figure 5) indicate a change in land cover distribution. It is an agro-based zone with settlements, forestry, and a few water bodies. Settlements are distributed everywhere in the study area, especially in the southern and north-eastern parts, such as the expansion of greater Dhaka [37]. The urban region of Dhaka expanded towards the north, northwest, and southwest, and the present study area expanded to the southern part consisting of Phulbari Pourasava (An administrative unit, such as a municipality), a large business and residential zone in this region.
The area is increasing with the development of the Barapukuria Coal Mine and the adjacent power plant. The observations are similar to Shanghai, China, where the total urban area was approximately 255 km2 in 1979; however, it grew to 1968 km2 in 2009 [38]. It is also opposite to Shanghai [39], where the main driving resources to the development are human activities and socio-economic development, but the major infrastructure is the only reason for the change in the Barapukuria area.
Agricultural land is decreasing despite the area being an agricultural zone. The agricultural land is distributed and witnessing a reducing trend with new settlements and infrastructure, which is not the case for the Godavari coalfield in India. Agricultural land in this coalfield increased from 59.46% in 1990 to 62.22% in 2014 [8]. Similar to Barapukuria, Amman [40] experienced the reduction in vegetation area due to the increase in the built-up area. Amman lost 18.82 km2 of vegetation, while Barapukuria dropped 1442.768 hectares of agricultural land. Forests occupy the central part of the region following a north–south trend, occupying minor parts on maps. In the near future, forest areas may be hampered by the advancement of different infrastructures and development works, such as Botswana [41]. In the Gaborone dam catchment area, Botswana, the built-up area increased from 1984 to 2015 and shrubland and savanna decreased for different development activities. Water bodies are widely distributed throughout all three maps and cover small areas. There is a river named “Little Jamuna” in the mid-west. It runs from north to south and covers the area as an elongated strip. The river is almost dry in the dry season. Due to the mining-related development activities, water bodies are also in a reducing trend. The total loss of the area’s water body is about 291.488 hectares from 1999 to 2019, which shows analogous trend of water body losing in South-eastern Tanzania [42].

6. Discussion

Subsidence is caused by the massive extraction of water, coal, oil and gas [43]. The area suffered from extensive environmental change due to mining-related activities. Mining-induced subsidence is visible. Subsidence impacted settlement characteristics, soil behaviour, hydrological balance, and social character [44]. Surface cracks are observed around the mining area (Figure 14).
The total subsided area is about 1.003 km2, and the projected subsided area is 2.173 km2 [44,45]. Approximately 1500 houses were damaged by mining-induced cracking. Subsidence caused the formation of two water bodies that did not exist before (Figure 15). Maximum subsidence of 7.50 metres was observed northwards, while the southern side had maximum subsidence of 7.20 metres [46]. As a result, settlement patterns changed, and crop production was reduced.

7. Conclusions

The study focused on the temporal land use/land cover (LULC) changes for 142 km2 around the Barapukuria Coal Mine. An analysis of Landsat 7 and 8 images from the past 20 years, using a ten-year interval, was conducted to evaluate land use by data quantification and qualification. Four distinct classes were found by analysing the images: agricultural land, settlements, forests, and water bodies. Statistical analysis indicates a reduction in agricultural land (9786 hectares in 1999 and 8343 hectares in 2019). The situation is reversed for settlements (or built-up areas) (3144 hectares in 1999 and 4775 hectares in 2019). It occurred due to the accommodation enhancement and infrastructure development with the increasing mining and power generation-related activities. Settlements increased by more than 50% during this time frame. The overall accuracy of the analyses is more than 70%, and kappa coefficient values are more than 0.60 for three consecutive years. The area also faced some negative consequences, such as surficial cracks and land subsidence. The subsided area was more than 1 km2, and the prediction exceeds 2 km2, indicating cracking around 1500 houses. The outcomes are very effective for land use planning and management personnel to formulate a fool-proof, comprehensive, and sustainable development plan for the area. Moreover, this study can serve as the primary model concerning LULC for additional mining, especially coal mining-related functions in Bangladesh.

Author Contributions

Conceptualization, H.M.A.; methodology, H.M.A.; software, H.M.A.; validation, H.Z.; formal analysis, H.Z.; investigation, N.A. and K.T.; resources, M.S.C.; data curation, T.S.; writing—original draft preparation, H.M.A.; writing—review and editing, M.S.C.; visualization, T.S.; supervision, K.T. and W.J.; project administration, N.A. and K.T.; funding acquisition, K.T. and W.J. All authors have read and agreed to the published version of the manuscript.

Funding

This research received no external funding.

Institutional Review Board Statement

Not applicable.

Informed Consent Statement

Not applicable.

Data Availability Statement

Not applicable.

Acknowledgments

This research was partially supported by “Thailand Science Research and Innovation” (TSRI). Grant Number ENV6505169S. Authors would like to express their gratitude to Universiti Tenaga Nasional for the support through grant code of J510050002/2021083 as a part of BOLD initiative.

Conflicts of Interest

The authors declare no conflict of interest.

References

  1. Fonji, S.F.; Taff, G.N. Using satellite data to monitor land-use land-cover change in North-eastern Latvia. Springerplus 2014, 3, 61. [Google Scholar] [CrossRef] [Green Version]
  2. Rawat, J.; Kumar, M. Monitoring land use/cover change using remote sensing and GIS techniques: A case study of Hawalbagh block, district Almora, Uttarakhand, India. Egypt. J. Remote Sens. Space Sci. 2015, 18, 77–84. [Google Scholar] [CrossRef] [Green Version]
  3. Jensen, J.R. Introductory Digital Image Processing: A Remote Sensing Perspective; Pearson Education, Inc.: Columbus, NJ, USA, 2005. [Google Scholar]
  4. Selçuk, R.E.; Nisanci, R.; Uzun, B.; Yalcin, A.; Inan, H.; Yomralioglu, T. Monitoring land-use changes by GIS and remote sensing techniques: Case study of Trabzon. In Proceedings of the 2nd FIG Regional Conference, Marrakech, Morocco, 2–5 December 2003. [Google Scholar]
  5. Kachhwala, T. Temporal monitoring of forest land for change detection and forest cover mapping through satellite remote sensing. In Proceedings of the 6th Asian Conference on Remote Sensing, Hyderabad, India, 21–26 November 1985. [Google Scholar]
  6. Lo, C.; Choi, J. A hybrid approach to urban land use/cover mapping using Landsat 7 Enhanced Thematic Mapper Plus (ETM+) images. Int. J. Remote Sens. 2004, 25, 2687–2700. [Google Scholar] [CrossRef]
  7. Basommi, P.L.; Guan, Q.; Cheng, D. Exploring Land use and Land cover change in the mining areas of Wa East District, Ghana using Satellite Imagery. Open Geosci. 2015, 1, 618–626. [Google Scholar]
  8. Garai, D.; Narayana, A. Land use/land cover changes in the mining area of Godavari coal fields of southern India. Egypt. J. Remote Sens. Space Sci. 2018, 21, 375–381. [Google Scholar] [CrossRef]
  9. Singh, R.K.; Singha, M.; Singh, S.K.; Debjeet, P.A.; Tripathi, N.; Singh, R.S. Land use/land cover change detection analysis using remote sensing and GIS of Dhanbad distritct, India. Eurasian J. For. Sci. 2018, 6, 1–12. [Google Scholar]
  10. Griffiths, P.; Hostert, P.; Gruebner, O.; van der Linden, S. Mapping megacity growth with multi-sensor data. Remote Sens. Environ. 2010, 114, 426–439. [Google Scholar] [CrossRef]
  11. Dewan, A.M.; Yamaguchi, Y. Using remote sensing and GIS to detect and monitor land use and land cover change in Dhaka Metropolitan of Bangladesh during 1960–2005. Environ. Monit. Assess. 2009, 150, 237. [Google Scholar] [CrossRef]
  12. Dewan, A.M.; Yamaguchi, Y. Land use and land cover change in Greater Dhaka, Bangladesh: Using remote sensing to promote sustainable urbanization. Appl. Geogr. 2009, 29, 390–401. [Google Scholar] [CrossRef]
  13. Ahmed, B.; Ahmed, R. Modeling urban land cover growth dynamics using multi-temporal satellite images: A case study of Dhaka, Bangladesh. ISPRS Int. J. Geo-Inf. 2012, 1, 3–31. [Google Scholar] [CrossRef] [Green Version]
  14. Hassan, M.A.; Mahjabin, R.; Islam, R.; Imtiaz, S. Land Cover Classification and Change Detection Analyzing Multi-Temporal Landsat Data: A Case Study of Gazipur Sadar, Bangladesh between 1973 and 2017. Geogr. Environ. Sustain. 2019, 12, 104–118. [Google Scholar] [CrossRef] [Green Version]
  15. Emch, M.; Peterson, M. Mangrove forest cover change in the Bangladesh Sundarbans from 1989–2000: A remote sensing approach. Geocarto Int. 2006, 21, 5–12. [Google Scholar] [CrossRef]
  16. Islam, K.; Jashimuddin, M.; Nath, B.; Nath, T.K. Land use classification and change detection by using multi-temporal remotely sensed imagery: The case of Chunati wildlife sanctuary, Bangladesh. Egypt. J. Remote Sens. Space Sci. 2018, 21, 37–47. [Google Scholar] [CrossRef]
  17. Haque, M.I.; Basak, R. Land cover change detection using GIS and remote sensing techniques: A spatio-temporal study on Tanguar Haor, Sunamganj, Bangladesh. Egypt. J. Remote Sens. Space Sci. 2017, 20, 251–263. [Google Scholar] [CrossRef]
  18. Chowdhury, M.; Hasan, M.E.; Abdullah-Al-Mamun, M. Land use/land cover change assessment of Halda watershed using remote sensing and GIS. Egypt. J. Remote Sens. Space Sci. 2020, 23, 63–75. [Google Scholar] [CrossRef]
  19. Arifeen, H.M.; Phoungthong, K.; Mostafaeipour, A.; Yuangyai, N.; Yuangyai, C.; Techato, K.; Jutidamrongphan, W. Determine the Land-Use Land-Cover Changes, Urban Expansion and Their Driving Factors for Sustainable Development in Gazipur Bangladesh. Atmosphere 2021, 12, 1353. [Google Scholar] [CrossRef]
  20. Hossain, F.; Moniruzzaman, M. Environmental change detection through remote sensing technique: A study of Rohingya refugee camp area (Ukhia and Teknaf sub-district), Cox’s Bazar, Bangladesh. Environ. Chall. 2021, 2, 1–14. [Google Scholar] [CrossRef]
  21. Li, M.; Zhang, L.; Liao, M.; Shi, X. Detection of coal-mining-induced subsidence and mapping of the resulting deformation using time series of ALOS-PALSAR data. Remote Sens. Lett. 2016, 7, 855–864. [Google Scholar] [CrossRef]
  22. Grzovic, M.; Ghulam, A. Evaluation of land subsidence from underground coal mining using TimeSAR (SBAS and PSI) in Springfield, Illinois, USA. Nat. Hazards 2015, 79, 1739–1751. [Google Scholar] [CrossRef]
  23. WorldBank. GDP Growth (Annual %)—Bangladesh. 19 April 2020. Available online: https://data.worldbank.org/indicator/NY.GDP.MKTP.KD.ZG?locations=BD (accessed on 12 August 2020).
  24. Bocco, G.; Mendoza, M.; Velázquez, A. Remote sensing and GIS-based regional geomorphological mapping—a tool for land use planning in developing countries. Geomorphology 2001, 39, 211–219. [Google Scholar] [CrossRef]
  25. Laskar, A. Integrating GIS and Multicriteria Decision Making Techniques for Land Resource Planning. Master’s Thesis, International Institute for Geo-Information Science and Earth Observation, Enschede, The Netherlands, 2003. [Google Scholar]
  26. Turner, B.L.; Lambin, E.F.; Reenberg, A. The emergence of land change science for global environmental change and sustainability. Proc. Natl. Acad. Sci. USA 2007, 104, 20666–20671. [Google Scholar] [CrossRef] [PubMed] [Green Version]
  27. Yuan, F.; Sawaya, K.E.; Loeffelholz, B.C.; Bauer, M.E. Land cover classification and change analysis of the Twin Cities (Minnesota) Metropolitan Area by multitemporal Landsat remote sensing. Remote Sens. Environ. 2005, 98, 317–328. [Google Scholar] [CrossRef]
  28. World meter, Bangladesh Population (Live). 2019. Available online: www.worldometers.info/world-population/bangladesh-population (accessed on 6 September 2020).
  29. Peeters, L.J.; Pagendam, D.E.; Crosbie, R.S.; Rachakonda, P.K.; Dawes, W.R.; Gao, L.; Marvanek, S.P.; Zhang, Y.; McVicar, T.R. Determining the initial spatial extent of an environmental impact assessment with a probabilistic screening methodology. Environ. Model. Softw. 2018, 109, 353–367. [Google Scholar] [CrossRef]
  30. Anderson, J.R. A Land Use and Land Cover Classification System for Use with Remote Sensor Data; US Government Printing Office: Washington, DC, USA, 1976; Volume 964. [Google Scholar] [CrossRef] [Green Version]
  31. Paul, S.S. Analysis of Land Use and Land Cover Change in Kiskatinaw River Watershed: A Remote Sensing, GIS & Modeling Approach. Master’s Thesis, University of Northern British Columbia, Prince George, MD, Canada, 2013. [Google Scholar]
  32. Paiboonvorachat, C. Using Remote Sensing and GIS Techniques to Assess Land Use/Land Cover Changes in the Nan Watershed, Thailand; Masters’ Thesis, Southern Illinois University at Carbondale: Carbondale, IL, USA, 2008. [Google Scholar]
  33. Campbell, B.J. Introduction to Remote Sensing, 3rd ed.; Guilford Press: New York, NY, USA, 2002. [Google Scholar]
  34. Lillesand, T.; Kiefer, R.W.; Chipman, J. Remote Sensing and Image Interpretation; John Wiley & Sons: Hoboken, NJ, USA, 2015. [Google Scholar]
  35. Hong, Z.; Hailin, L.; Zhen, C. Analysis of Land Use Dynamic Change and Its Impact on the Water Environment in Yunnan Plateau Lake Area––A Case Study of the Dianchi Lake Drainage Area. Procedia Environ. Sci. 2011, 10, 2709–2717. [Google Scholar] [CrossRef] [Green Version]
  36. Mishra, P.K.; Rai, A.; Rai, S.C. Land use and land cover change detection using geospatial techniques in the Sikkim Himalaya, India. Egypt. J. Remote Sens. Space Sci. 2020, 23, 133–143. [Google Scholar] [CrossRef]
  37. Hasan, M.M.; Southworth, J. Analyzing Land Cover Change and Urban Growth Trajectories of the Mega-Urban Region of Dhaka Using Remotely Sensed Data and an Ensemble Classifier. Sustainability 2018, 10, 10. [Google Scholar] [CrossRef] [Green Version]
  38. Yin, J.; Yin, Z.; Zhong, H.; Xu, S.; Hu, X.; Wang, J.; Wu, J. Monitoring urban expansion and land use/land cover changes of Shanghai metropolitan area during the transitional economy (1979–2009) in China. Environ. Monit. Assess. 2011, 177, 609–621. [Google Scholar] [CrossRef]
  39. Shi, G.; Jiang, N.; Yao, L. Land Use and Cover Change during the Rapid Economic Growth Period from 1990 to 2010: A Case Study of Shanghai. Sustainability 2018, 10, 426. [Google Scholar] [CrossRef] [Green Version]
  40. Al-Bilbisi, H. Spatial Monitoring of Urban Expansion Using Satellite Remote Sensing Images: A Case Study of Amman City, Jordan. Sustainability 2019, 11, 2260. [Google Scholar] [CrossRef] [Green Version]
  41. Matlhodi, B.; Kenabatho, P.K.; Parida, B.P.; Maphanyane, J.G. Evaluating Land Use and Land Cover Change in the Gaborone Dam Catchment, Botswana, from 1984–2015 Using GIS and Remote Sensing. Sustainability 2019, 11, 5174. [Google Scholar] [CrossRef] [Green Version]
  42. Msofe, N.K.; Sheng, L.; Lyimo, J. Land Use Change Trends and Their Driving Forces in the Kilombero Valley Floodplain, Southeastern Tanzania. Sustainability 2019, 11, 505. [Google Scholar] [CrossRef] [Green Version]
  43. Staudt, M. Environmental Hydrogeology; CRC Press LLC: Boca Raton, FL, USA, 1998; pp. 81–101. [Google Scholar]
  44. Howladar, M.F. Environmental impacts of subsidence around the Barapukuria Coal Mining area in Bangladesh. Energy Ecol. Environ. 2016, 1, 370–385. [Google Scholar] [CrossRef] [Green Version]
  45. CMC. Daily report of Barapukuria Coal Mine, Bangladesh. Unpublished Report, 2013. Available online: http://bcmcl.org.bd/general-annual-report (accessed on 4 April 2020).
  46. BCMCL. Subsidence-Information-Statement. Available online: https://bcmcl.org.bd/subsidence-information-statement (accessed on 4 April 2020).
Figure 1. Study Area.
Sustainability 13 13602 g001
Figure 2. Creating a Pan-sharpened Raster Dataset of the study area.
Sustainability 13 13602 g002
Figure 3. LULC map, 1999.
Sustainability 13 13602 g003
Figure 4. LULC map, 2009.
Sustainability 13 13602 g004
Figure 5. LULC map, 2019.
Sustainability 13 13602 g005
Figure 6. Year-wise distribution of different land classes.
Sustainability 13 13602 g006
Figure 7. Relative change-hectares.
Sustainability 13 13602 g007
Figure 8. Relative change % of LULC.
Sustainability 13 13602 g008
Figure 9. Relation between LULC and time.
Sustainability 13 13602 g009
Figure 10. Relation between prominent land classes.
Sustainability 13 13602 g010
Figure 11. LULC conversion map (1999–2009).
Sustainability 13 13602 g011
Figure 12. LULC conversion map (2009–2019).
Sustainability 13 13602 g012
Figure 13. LULC conversion map (1999–2019).
Sustainability 13 13602 g013
Figure 14. Cracks due to mining.
Sustainability 13 13602 g014
Figure 15. Previous and present situation of areas near the mining site.
Sustainability 13 13602 g015
Table 1. LULC classification scheme.
LULC TypeDescription
AgriculturePaddy, Crops, Vegetable, after harvested open land, etc.
SettlementHouses, Shops, Industries, Impervious Road, etc.
ForestTrees, Dense bushes, etc.
WaterRiver, Canals, Ponds, Marshy lands, Seasonal channel, Wet land, etc.
Table 2. Image description.
Acquisition DateSatelliteSensorSpectral ResolutionSpatial Resolution
15 November 1999Landsat 7ETM+Band 1–5, 730 m
28 December 2009Landsat 7ETM+Band 1–5, 730 m
19 March 2019Landsat 8OLI/TIRSBand 1–730 m
Table 4. LULC change assessment.
1999 to 2009 2009 to 2019 1999 to 2019
Change (Ha)Change (%)Annual Change (Ha)Change (Ha)Change (%)Annual Change (Ha)Change (Ha)Change (%)Annual Change (Ha)
W−599.56−55.53−59.96308.0764.1630.81−291.49−27.00−29.15
F−55.67−30.99−5.57158.58127.9115.86102.9257.2910.29
S856.9427.2685.69774.4119.3677.441631.3451.89163.13
A−201.71−2.06−20.17−1241.06−12.95−124.11−1442.77−14.74−144.28
W = Water; F = Forest; S = Settlement; A = Agriculture.
Table 5. LULC class changes between 1999 and 2009 (Hectares).
1999–2009AgricultureForestSettlementWater
Agriculture8286.519.571354.89153.22
Forest11.1267.1186.2313.08
Settlement841.6337.562177.9378.51
Water450.477.05383.56222.54
Table 6. LULC class changes between 2009 and 2019 (Hectares).
2009–2019AgricultureForestSettlementWater
Agriculture7622.37116.491448.06401.88
Forest0.8646.9166.407.13
Settlement647.29103.573050.05202.18
Water89.305.70224.22148.15
Table 7. Changes of LULC class between 1999 and 2019 (Hectares).
1999–2019AgricultureForestSettlementWater
Agriculture7379.55130.891855.48437.04
Forest11.7168.8688.648.35
Settlement631.3853.362318.23132.94
Water337.1919.62525.95181.02
Table 8. Error matrix for supervised land use classification, 2019.
WaterForestAgricultureSettlementTotal (User)Producer acc.User acc.
Water120802092.3160
Forest012802085.7160
Agriculture002002052.63100
Settlement122152010075
Total (Producer)1314381580
Table 9. Error matrix for supervised land use classification, 2009.
WaterForestAgricultureSettlementTotal (User)Producer acc.User acc.
Water1305220100.0065
Forest018112085.7190
Agriculture001732056.6785
Settlement037102062.5050
Total (Producer)1321301680
Table 10. Error matrix for supervised land use classification, 1999.
WaterForestAgricultureSettlementTotal (User)Producer acc.User acc.
Water120802063.1660
Forest018202085.7190
Agriculture201802064.2990
Settlement530122010060
Total (Producer)1921281280
Publisher’s Note: MDPI stays neutral with regard to jurisdictional claims in published maps and institutional affiliations.

