Article

Identification and Modelling of Chlorine Decay Mechanisms in Reclaimed Water Containing Ammonia

1
Water Quality and Treatment Laboratory, Urban Water Unit, Hydraulics and Environment Department, LNEC—National Laboratory for Civil Engineering, 1700-066 Lisbon, Portugal
2
CERIS, Instituto Superior Técnico, University of Lisbon, Av. Rovisco Pais 1, 1049-001 Lisbon, Portugal
*
Author to whom correspondence should be addressed.
Sustainability 2021, 13(24), 13548; https://doi.org/10.3390/su132413548
Submission received: 6 October 2021 / Revised: 19 November 2021 / Accepted: 1 December 2021 / Published: 7 December 2021
(This article belongs to the Special Issue Sanitation, Pollution Control and Water Management)

Abstract

:
Keeping an effective disinfectant residual concentration in reclaimed water is still a challenge, due to its high levels of ammonia and organic matter when compared with those in drinking water. This research proposes the integration of the reaction schemes of monochloramine auto-decomposition with an empirical kinetic mechanism accounting for reactive chlorine species decay in the presence of organic matter, for which three mechanisms were hypothesized and tested. A parallel second order mechanism, where monochloramine reacts both with fast and slow organic matter reactive fractions, was identified as the most suitable. The model, comprising two rate constants and two fictive concentrations of organic matter as parameters, was further successfully calibrated with real reclaimed waters with two initial free chlorine doses of 8.01 × 10 5 M (≈5 mg/L) and 2.67 × 10 4 M (≈20 mg/L). The proposed model is believed to support future studies aiming to predict and manage chlorine decay in reclaimed water distribution systems.

1. Introduction

The increase in water needs for multiple applications and the decreasing availability of water, compounded by the effects of climate change, urge the use of alternative water sources to guarantee the preservation of water and ecosystems and to enable the sustainability of economic and social activities [1,2]. Wastewater is a renewable resource from which reclaimed water, nutrients and energy can be recovered, following the circular economy concept, hence promoting the transition of wastewater treatment plants into water resource recovery facilities (WRRFs). The use of treated wastewater—reclaimed water (RW)—has been implemented and regulated around the world, mainly in the USA, Australia, Israel, Spain, China [3] and more recently in Portugal (DL 119/2019) [4] and in the European Union (EU) (EU Reg. 2020) [5]. In Europe, the use of reclaimed water has been encouraged by the European Directive concerning urban wastewater since 1991 [6]. Studies on urban water reuse identifying the water management best practices and the minimum quality requirements were developed in the EU [7,8]. More recently, specific regulations on the application of RW was presented by the EU minimum requirements for reclaimed water use for irrigation in 2020 [5], reinforcing the guidelines for treated wastewater use for irrigation ISO 16075-2:2015 [9], promoting the fit-for-purpose RW use and the application of multiple barriers to minimize risk for public health and the environment. Concerns were raised on the requirements to ensure suitable disinfection of RW from WRRFs to the point of application. Notwithstanding the studies on the topic of drinking water chlorination, more studies are required on RW disinfection for promoting efficient RW quality control and the operation of reclaimed water distribution systems (RWDS) [10]. The free chlorine doses required in RW production should be defined considering the treated wastewater quality (chlorine demand) and the required residual chlorine concentration to assure the microbiological quality needed for the RW application. Keeping an effective disinfectant residual concentration to prevent microbiological regrowth is still a challenge due to the higher levels of ammonia and organic matter (OM) in RW compared with those in drinking water. Thus, further knowledge of chlorine decay mechanisms in RW is required, enabling the optimization of the chlorine dosages necessary to meet RW disinfection requirements while minimizing the formation of disinfection by-products (DBPs) as well as promoting safe water reuse.
Chlorine is widely used for disinfection due to its cost-effectiveness and high efficacy [11]. However, a typical secondary effluent may contain enough ammonia and organic nitrogen to interfere with the disinfection process and, moreover, to generate chloramines [11]. This is a global issue, specifically if the WRRF does not have tertiary treatment or if nitrification is not required. Besides, in the EU, the requirements for treated wastewater quality discharge [6] allows for up to 10 mg-N/L or a minimum of 70–80% of reduction in sensitive zones, concentration levels which interfere with chlorination. Chloramines formation is an integral part of the breakpoint reaction in which chlorine reacts with ammonia resulting in the potential formation of monochloramine, dichloramine and trichloramine, depending on the chlorine and ammonia nitrogen ratio, pH and temperature [11]. Monochloramine, albeit not possessing a disinfection capacity as strong as free chlorine, is more stable, particularly in the absence of nitrifying conditions, and produces smaller amounts of chlorinated-DBPs [11]. It is not desirable to obtain dichloramine and trichloramine as the former can impart a chlorinous odor and the latter is highly volatile. Therefore, a molar Cl2:N ratio between 0.6 and 1 is typically employed [11].
These reactions and the kinetics involved have been studied individually and in different reaction schemes for drinking water. Wei [12] investigated the potential reaction scheme in the breakpoint region ((Cl2:N) > 1.5). Leao and Selleck [13] suggested a reaction scheme in the combined chlorine region (0 < (Cl2:N) ≤ 1). Jafvert and Valentine [14] integrated the reported reaction schemes and formulated the Unified Model, which covered the reactions taking place in the combined, breakpoint, as well as in transition regions (1< (Cl2:N) ≤ 1.5). The Unified Model can predict reasonably well the reactions between aqueous chlorine and ammonia in a phosphorus phosphate buffer system at 25 °C [14]. Vikesland et al. [15] adopted the aforementioned reactions in the combined chlorine region from the Unified Model and showed a satisfactory prediction of monochloramine decay in a carbonate buffer system at different temperatures.
Huang [16] proposed the Unified Plus Model, including trichloramine hydrolysis reaction, and re-evaluated the rate coefficients. However, at pH values typically encountered in water and wastewater treatment, the concentrations of trichloramine are considered negligible [11]. In drinking water, monochloramine auto-decomposition and reactions with water chemical components are considered the major monochloramine dissipation pathways [15].
Duirk et al. [17,18] studied the monochloramine decay in drinking water, under monochloramine and natural organic matter (NOM) effects, and proposed an empirical biphasic scheme reaction to be integrated into the Unified Model. Their first study, using drinking water model solutions, proposed a parallel second order model assuming a mechanism where monochloramine reacts with both fast and slow reactive humic acids [17]. Subsequently, they proposed that monochloramine reacts via (i) a fast reaction, involving a direct reaction between monochloramine and NOM, and (ii) a slow reaction, which is responsible for most of the oxidant loss, and involves free chlorine from chloramine hydrolysis [18]. Regarding RW chlorination, few studies using real RW have been identified. Wang et al. [19] proposed a stoichiometric model of chlorine decay in RW based on chemical chlorine demand empirical formulations. The formation of monochloramine was not identified, possibly due to the ammonia concentrations being very low or inexistent. However, RWs often present significant ammonia concentrations and some WRRFs use sodium hypochlorite reagent as disinfectant. Thus, this research proposes the integration of the reaction schemes for monochloramine auto-decomposition, proposed by Vikesland et al. [15], with an empirical mechanism accounting for chlorine decay in the presence of OM to model the chlorine decay in RW. Experimental data from the chlorination of ammonia containing synthetic waters (OM-free) and of real RWs from a WRRF were used to validate its application.
This research is particularly innovative in building a chlorine decay model for RW comprising a mechanistic component, which incorporates properties related to the inorganic matrix (e.g., pH, conductivity, alkalinity, ammonia concentration), and a semi-empirical component, accounting for chlorine decay due to reactions with OM. Besides validating the auto-decomposition reactions of the monochloramine due to ammonia, this research proposes the identification and validation of the reaction mechanism between reactive chlorine species and OM, which best performs in describing chlorine decay in RW. This study is expected to drive further advances in predicting chlorine concentrations in RW and supports the implementation of chlorine decay model reactions in hydraulic models.

2. Materials and Methods

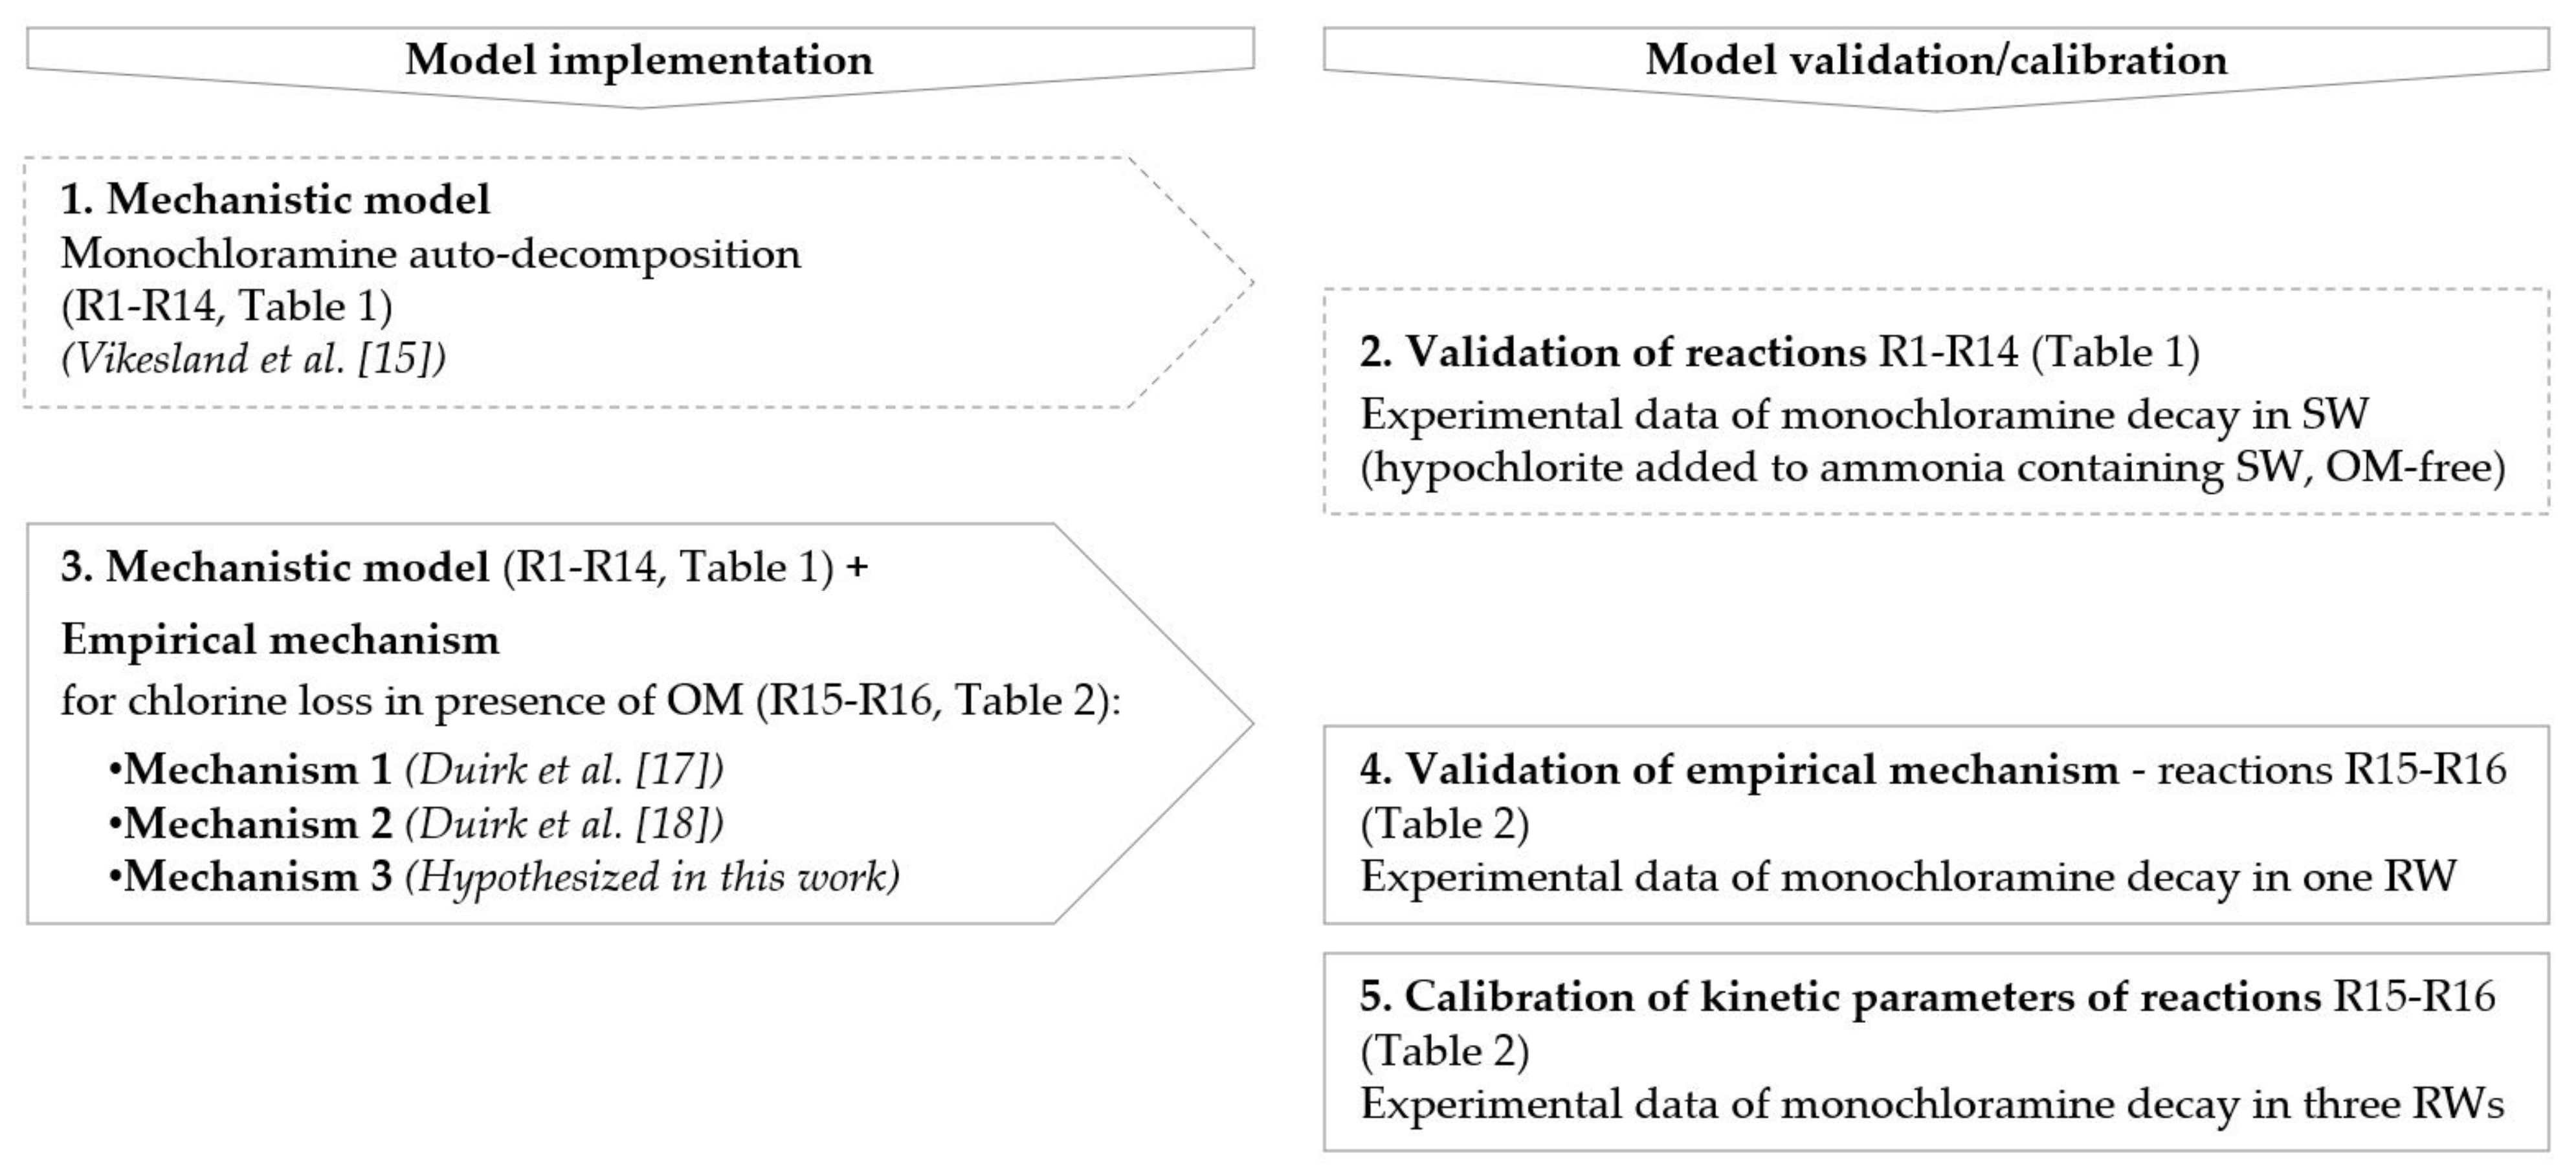
2.1. Model Development and Concept

A semi-mechanistic model for reactive chlorine species decay in RW was tested, adopting the model responsible for monochloramine loss in the presence of ammonia proposed by Vikesland et al. [15] and an empirical mechanism for the reactions involving free chlorine, monochloramine and OM.
Vikesland et al. [15] model reactions schemes and the rate coefficients and equilibrium constants are presented in Table 1.
An analysis of the mechanistic monochloramine auto-decomposition model was conducted for model evaluation without the presence of OM, using synthetic waters.
Next, empirical equations for chlorine loss in the presence of OM were studied under the three mechanisms illustrated in Figure 1.
Mechanism 1 (Figure 1) pertains to a parallel second-order model assuming monochloramine reacts with both fast and slow reacting OM fractions, OMf and OMs, respectively. Mechanism 2 suggests that monochloramine reacts via a fast reaction, involving a direct reaction between monochloramine and OMf, and a slow reaction, which is responsible for most of the oxidant loss and involves free chlorine from chloramine hydrolysis. Mechanism 1 and Mechanism 2 were suggested by the studies of Duirk et al. [17,18], respectively. Mechanism 3, proposed in this work, hypothesizes that free chlorine reacts via a fast reaction and monochloramine reacts via a slow reaction with OM, respectively. This is premised on the fact that hypochlorous acid is more reactive than monochloramine.
Each mechanism is represented stoichiometrically using two empirical second-order reactions (Table 2—R15 and R16) and four parameters: the rate constants kf and ks and the initial fictive concentration of the respective OM fraction, OMf0 and OMs0.
The mechanisms were integrated into the monochloramine auto-decomposition model, and the resulting semi-mechanistic models and their reaction coefficients were calibrated using real RW experimental data.
The analysis of the results seeks to identify the OM reacting mechanism which best performs in terms of chlorine decay in reclaimed water. The models were implemented and calibrated using COMSOL Multiphysics (version 5.5) using the Levenberg–Marquardt optimization algorithm. This proposed methodology is schematically presented in Figure 2.

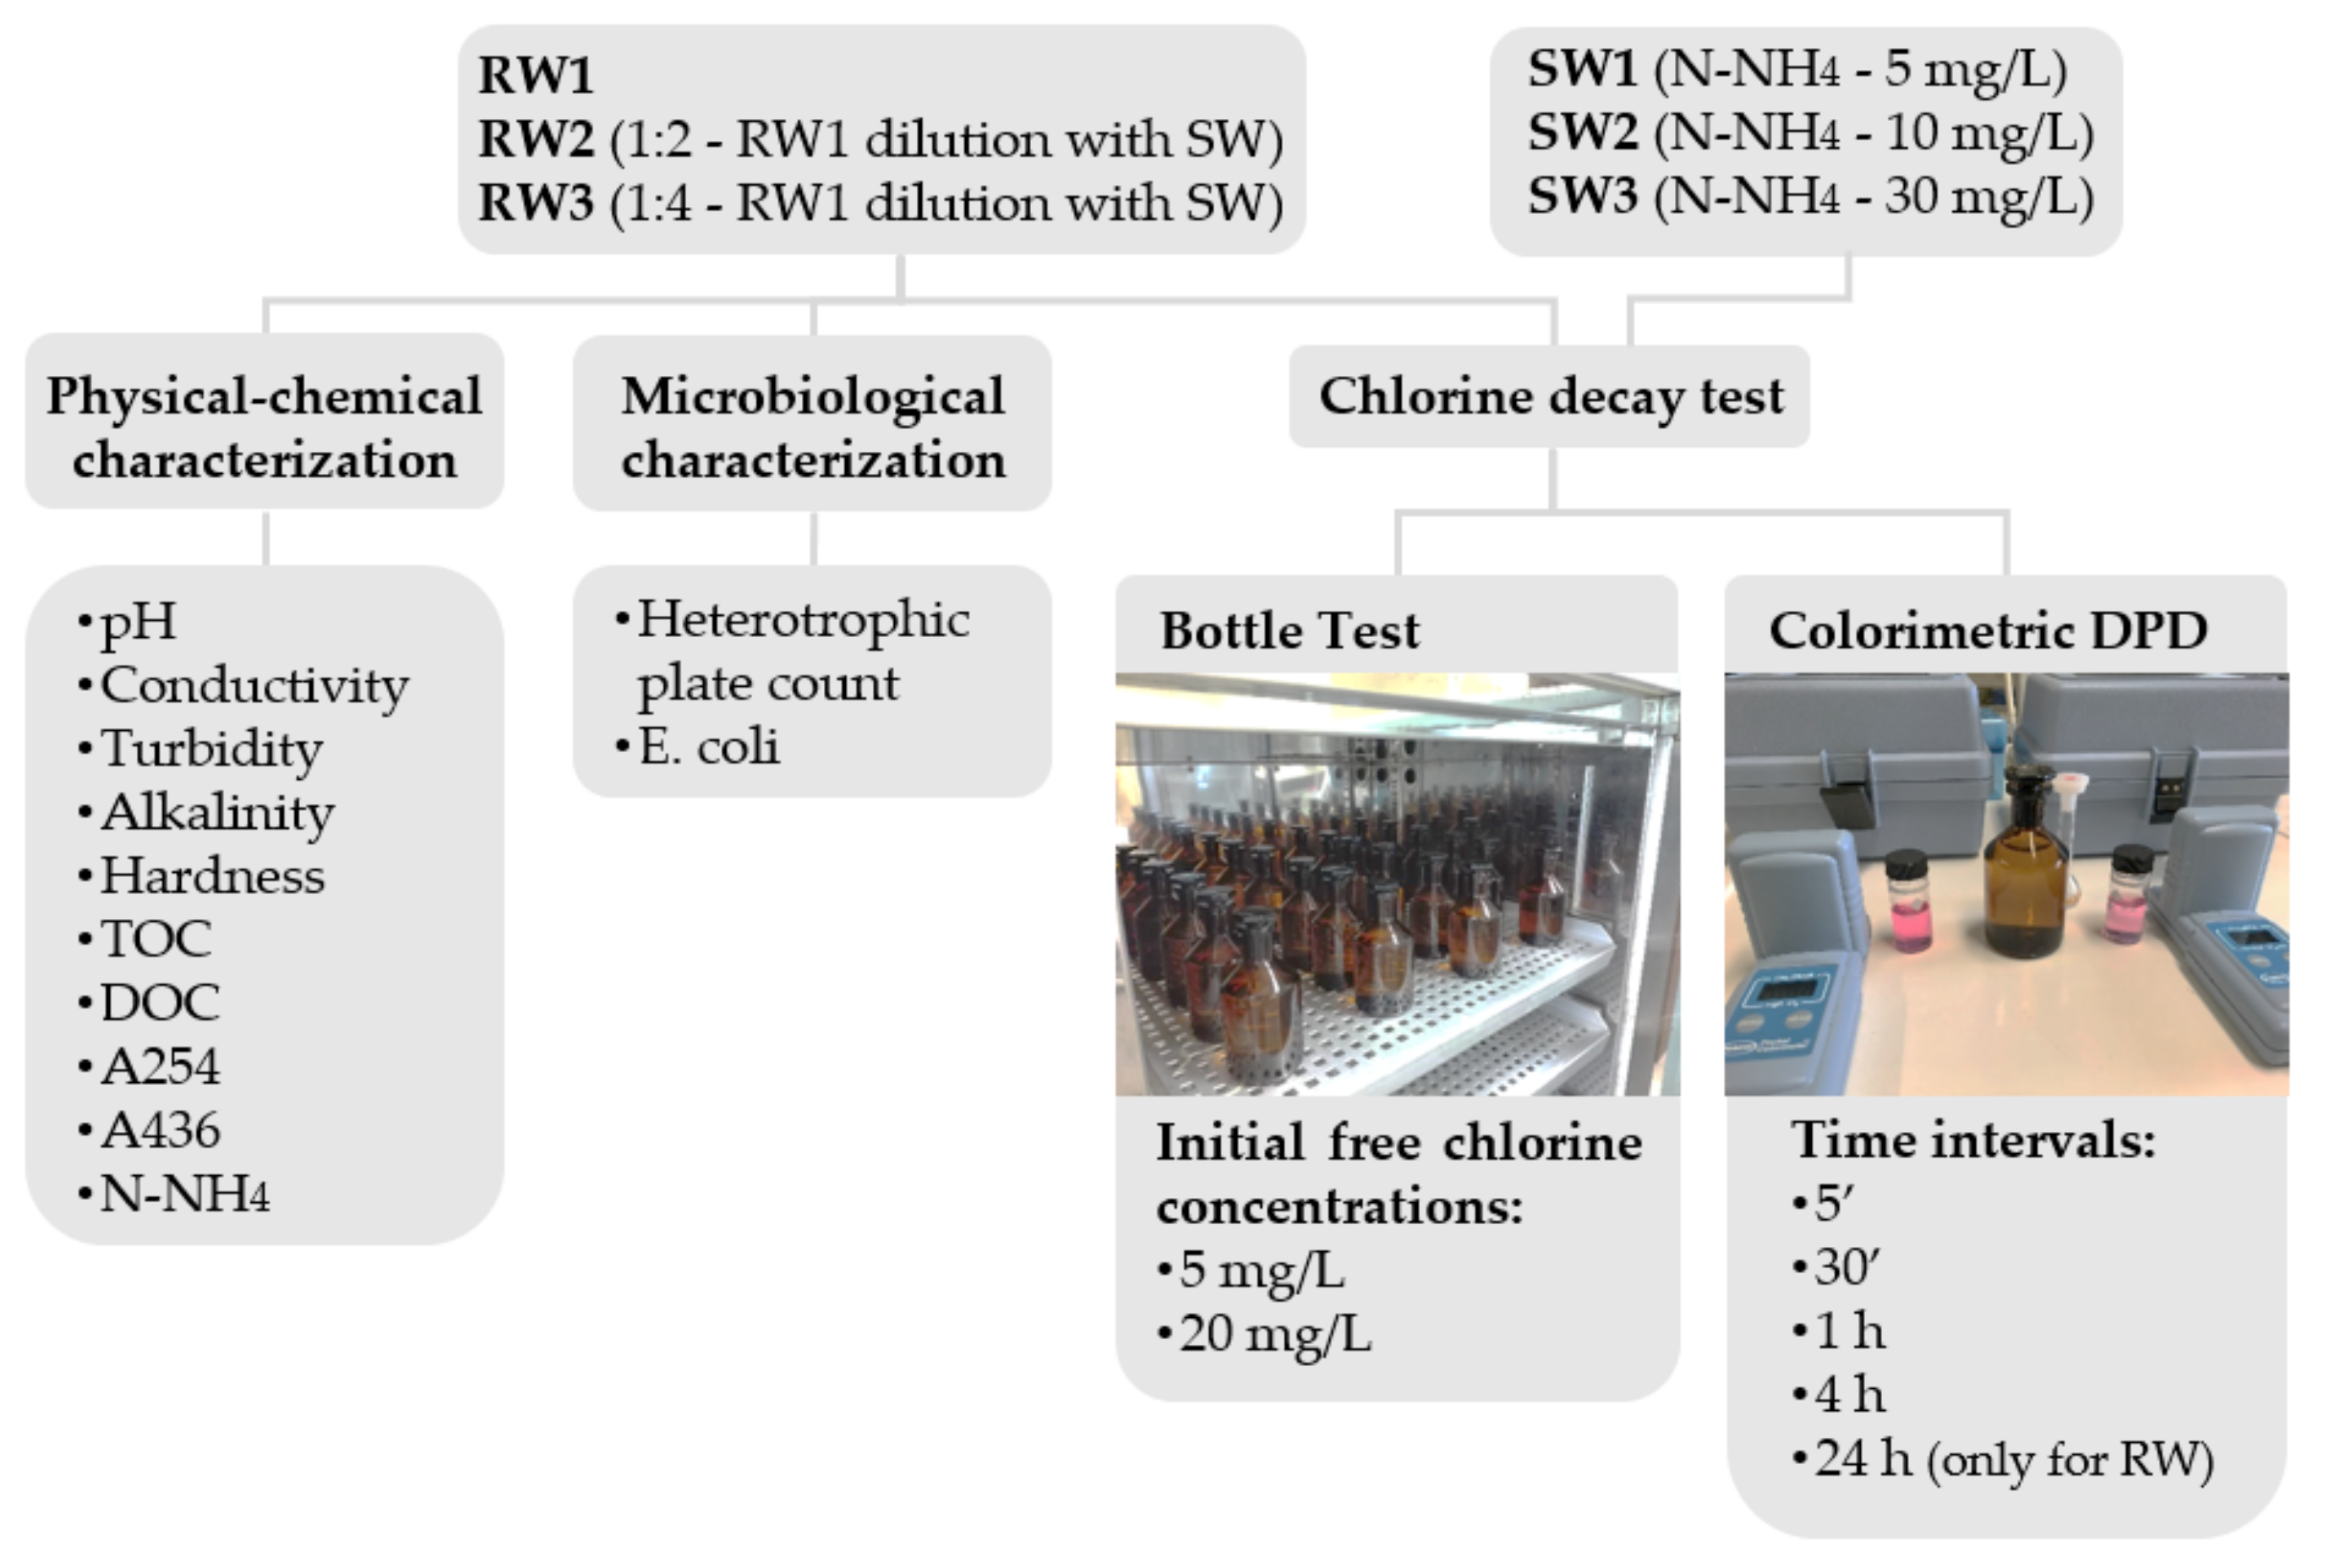
2.2. Experimental Design

Laboratory experiments were designed to evaluate reactive chlorine species decay in synthetic model waters (SW) comprising an inorganic matrix with controlled pH, ionic strength and carbonate concentrations, mimicking real RW, and in real RWs, assessing the influence of chlorine, ammonia and OM fictive concentrations on the rate of monochloramine loss.
A synthetic model water was formulated based on the average characteristics of RW from a WRRF in the Lisbon region: conductivity (3000 μS/cm), alkalinity (171 mg-CaCO3/L), hardness (372 mg-CaCO3/L) and pH (7.2). This synthetic model water was then supplemented with different concentrations of ammonia, 3.57 × 10 4 M (≈5 mg/L) NH4-N/L (SW1), 7.14 × 10 4 M (≈10 mg/L) NH4-N/L (SW2) and 2.14 × 10 3 M (≈30 mg/L) NH4-N/L (SW3), which were then tested for chlorine decay with three initial free chlorine doses, ≈ 3 × 10 5 M (≈2 mg/L), ≈ 8 × 10 5 M (≈5 mg/L) and ≈ 1.5 × 10 4 M (≈10 mg/L), thus getting molar Cl2:N ratios between 0.01 and 0.39.
The chlorine decay experiments in real RW were performed with grab samples of non-chlorinated effluent (RW1) from a WRRF in the Lisbon region with 750 × 10 3 inhabitants equivalent and producing a treated effluent with 23 mg-N-NH4/L, DOC 7.4 mg-C/L and TOC 7.8 mg-C/L (median concentrations obtained during a one-year monitoring period provided by the utility). These experiments were carried out to evaluate the reactive chlorine species decay under the semi-mechanistic model (auto-decomposition reactions and mechanisms of chlorine species decay in OM presence) and to determine the R15-R16 reaction parameters (Table 2).
To access OM effect on the reactive chlorine species decay, RW1 and two-fold dilutions of RW1 with SW, namely 1:2 (RW2) and 1:4 (RW3), were tested with initial chlorine doses of 8.01 × 10 5 M (≈5 mg Cl2/L) and 2.67 × 10 4 M (≈20 mg Cl2/L), the latter only with RW1 and RW2. These testing conditions are identified as RW1_5, RW1_20, RW2_5, RW2_20 and RW3_5.
Chlorine decay experiments of all synthetic and reclaimed waters were developed following the bottle test method according to Powell et al. [20]. Amber glass bottles were previously treated with 10 mg/L free chlorine in Milli-Q water to remove any chlorine demand. For each testing condition, a set of bottles were filled with 100 mL of water sample (SW or RW). Each sample bottle was chlorinated adding adequate volumes of sodium hypochlorite stock solution (2 g/L free chlorine) to achieve the initial concentration to be tested. This stock solution was prepared on the assay day with sodium hypochlorite 10% w/v (Panreac) and distilled water and was kept in the tightly closed amber glass bottle. The bottles with chlorinated samples were kept in an incubator, in the dark, at 20 °C during the required reaction time. One bottle was withdrawn from the incubator at time intervals of 5 min, 30 min, 1 h, 4 h and approximately 24 h and the concentrations of free chlorine, total chlorine, monochloramine and dichloramine were immediately determined, using the colorimetric method DPD (4500 Cl G) [21] with the pocket colorimetric equipment (HACH Company, Loveland, CO, USA). For initial chlorine concentration measurements, the same procedure was carried out with bottles filled with 100 mL of Milli-Q water. The experimental procedure and setup scheme are presented in Figure 3.
Physical–chemical characterization of RW1, RW2 and RW3 are presented in Table 3. The quality parameters were analyzed according to SMEWW [21], unless otherwise stated. Moreover, the reclaimed water quality parameters analyzed were selected based on the ISO 16075-2:2015 [9].
Conductivity, pH, ORP and temperature were measured using a potentiometer (C863, CONSORT, Bruxelles, Belgium) and specific electrodes. Alkalinity and hardness were determined by titrimetric methods [21]. Turbidity was measured by nephelometry using a turbidimeter Turb 550 IR (Xylem, New York, NY, USA). Ammonia nitrogen and total nitrogen were measured with the colorimetric methods using LCK 303 and LCK 238 kits (LATON, HACH, Loveland, CO, USA), respectively, and the spectrophotometer CADAS 50 (Dr. Lange, Homburg, Saarland, Germany). The organic matter content of the RW samples were assessed measuring total organic carbon (TOC) and dissolved organic carbon (DOC) (the latter in filtered samples, through 0.45 µm, polypropylene membrane, GH Polypro Pall Corporation) using the UV/persulphate chemical oxidation method [22] with a TOC analyzer Fusion (Teledyne Tekmar, Mason, OH, USA). OM was also characterized by the UV–Vis absorbance at 254 nm (A254) and 436 nm (A436), respectively, representing organic compounds with aromatic rings and color, measured in 0.45 µm filtered samples using a UV–Vis spectrophotometer (Evolution 201, Thermo Fisher Scientific, Waltham, MA, USA) with 10 mm optical path length quartz cells. Specific UV absorbance (SUVA) was computed as A254/DOC*100 (L/(mg-C.m)).

2.3. Validation and Calibration of the Models

Experimental data were compared to model results by solving the set of differential and algebraic equations (DAE) derived from the stoichiometric equations in Table 1 and the empirical equations in Table 2, using the software COMSOL Multiphysics 5.5 (Stockholm, Sweden).
First, the ammonia effect on chlorine decay (Table 1, R1-R14) was implemented and solved to simulate the experimental data from the synthetic model waters.
Next, to identify the semi-mechanistic model which best describes the chlorine decay, each mechanism (Figure 1) was integrated into the monochloramine auto-decomposition model, and its rate coefficients (ks and kf) and the fictive initial concentrations of OM slow and fast reacting fractions (OM0s and OM0f, respectively) were estimated. For this purpose, the experimental monochloramine decay results in RW1 with two different initial free chlorine concentrations, 8 .01 × 10 5 M (≈5 mg/L) and 2.67 × 10 4 M (≈20 mg/L), were used. After the identification of the best mechanism, decay results in RW1, RW2 and RW3 with the two chlorine doses of 8 .01 × 10 5 M (≈5 mg/L) and 2.67 × 10 4 M (≈20 mg/L) were used for parameter estimation and model calibration. COMSOL was used to estimate all the OM reacting fractions and the respective rate constants using the Levenberg–Marquardt optimization algorithm, which is designed specifically for solving problems of least-squares type [23].
Model performance evaluation was based on the model’s goodness of fit, assessed through visual observation of the ability of the model to capture the decay profiles, and through the coefficient of determination (R2), the adjusted R2 and the normalized root mean square error (NRMSE) of the models.

3. Results and Discussion

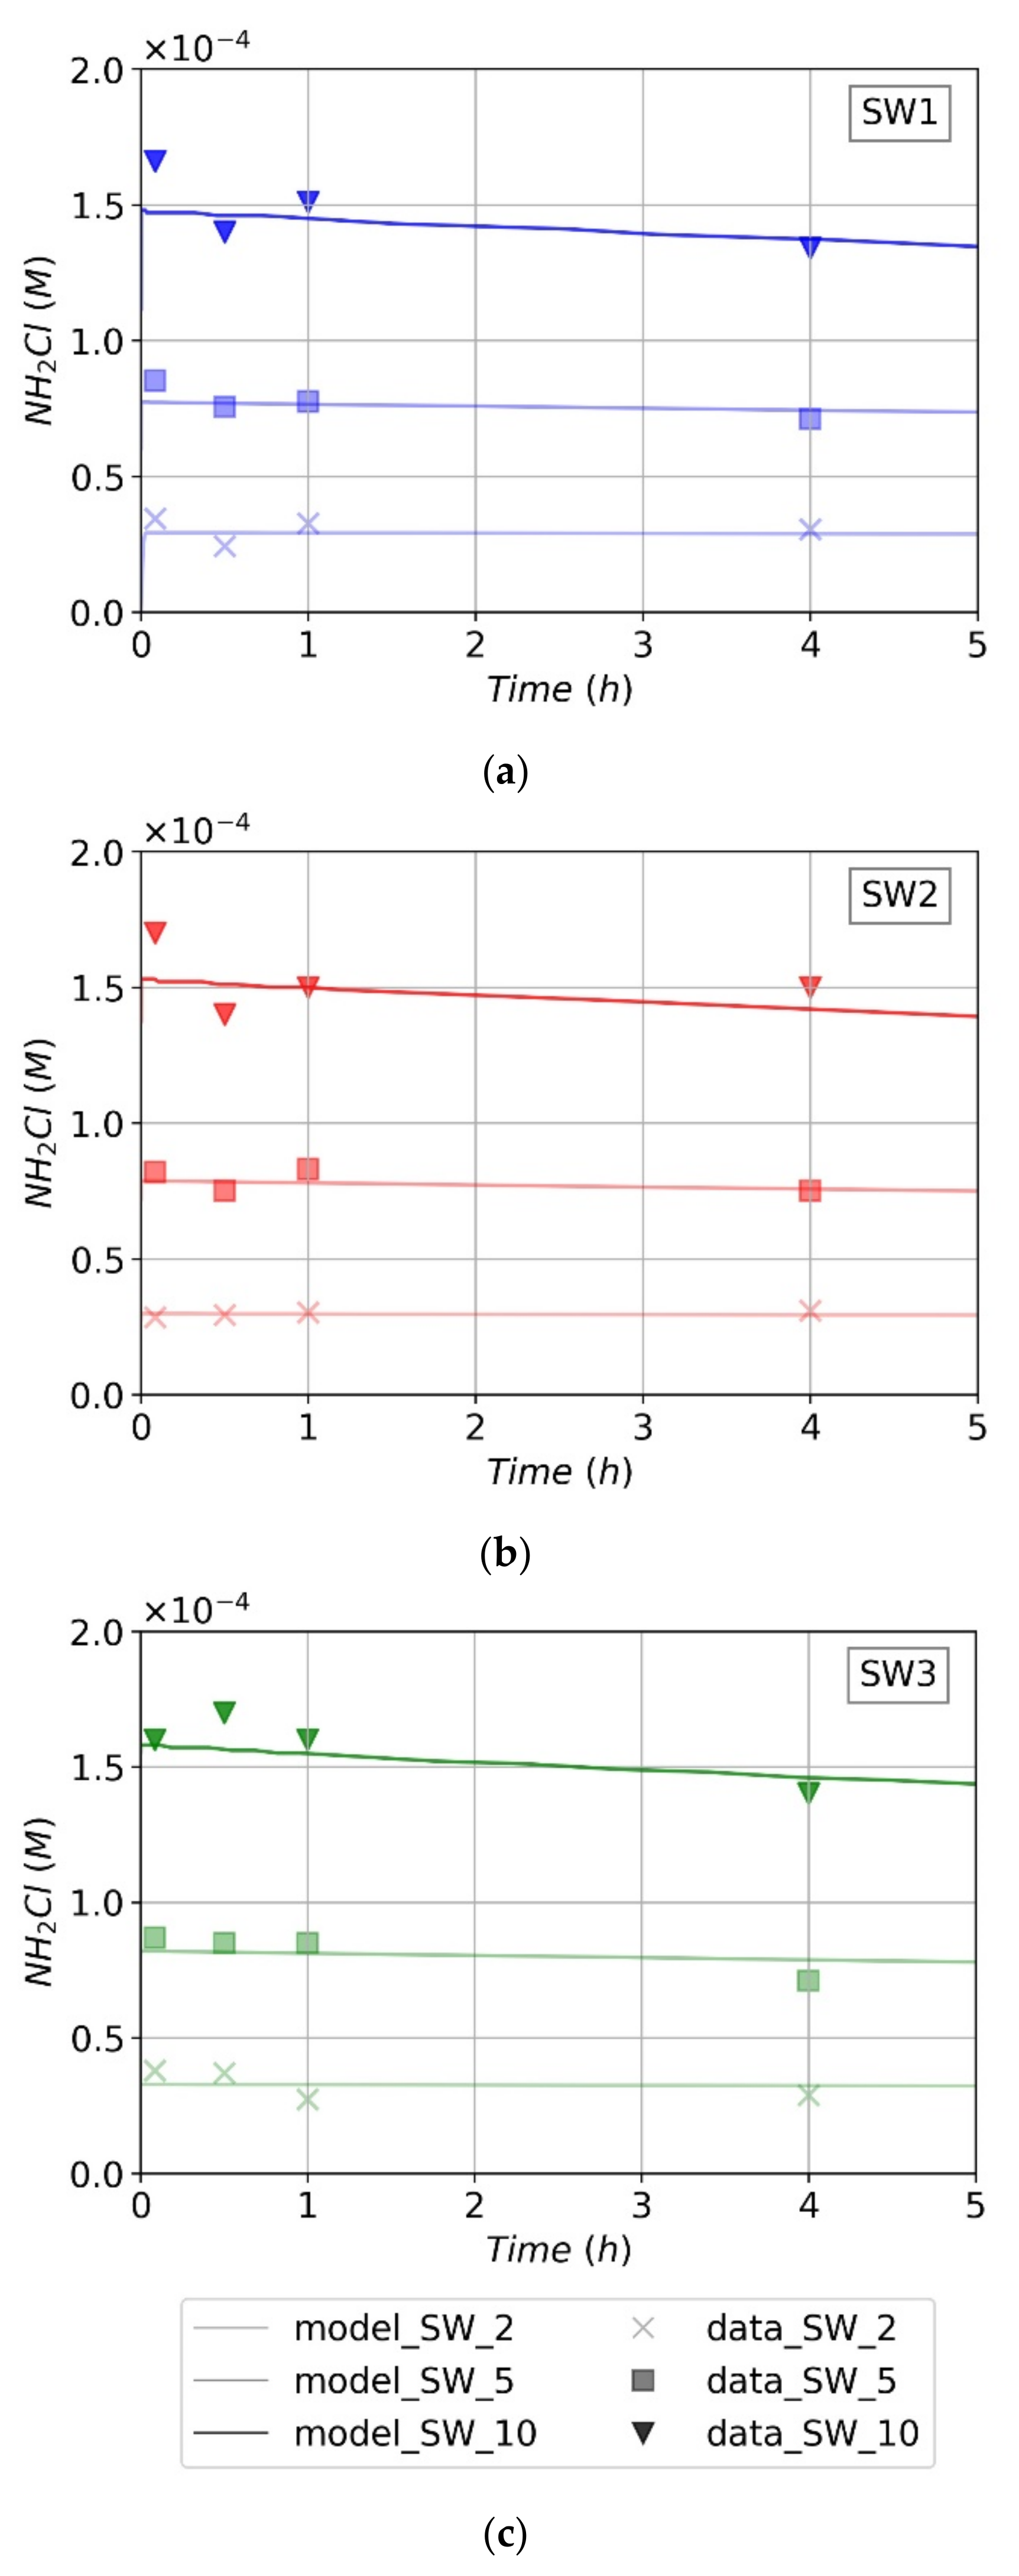
3.1. Monochloramine Auto-Decomposition Model Validation with Synthetic Waters

Modeled and measured monochloramine decay results in SW1, SW2 and SW3, with different ammonia and initial chlorine concentrations, are presented Figure 4, where the points represent the experimental data and the curves the model results. The plots show a good representation of monochloramine decay in synthetic waters. The low NRMSE value of 7.5% and the R2 value of 0.98 (36 data points), very close to one, confirm the model’s goodness of fit. As predicted, the results show monochloramine formation depends on the initial chlorine dose and, as expected, the initial chlorine dosed is entirely transformed into monochloramine. Moreover, as ammonia concentration is not limiting (Cl2:N ratios between 0.01 and 0.39), the influence of the initial chlorine dose is more relevant than the ammonia concentration.

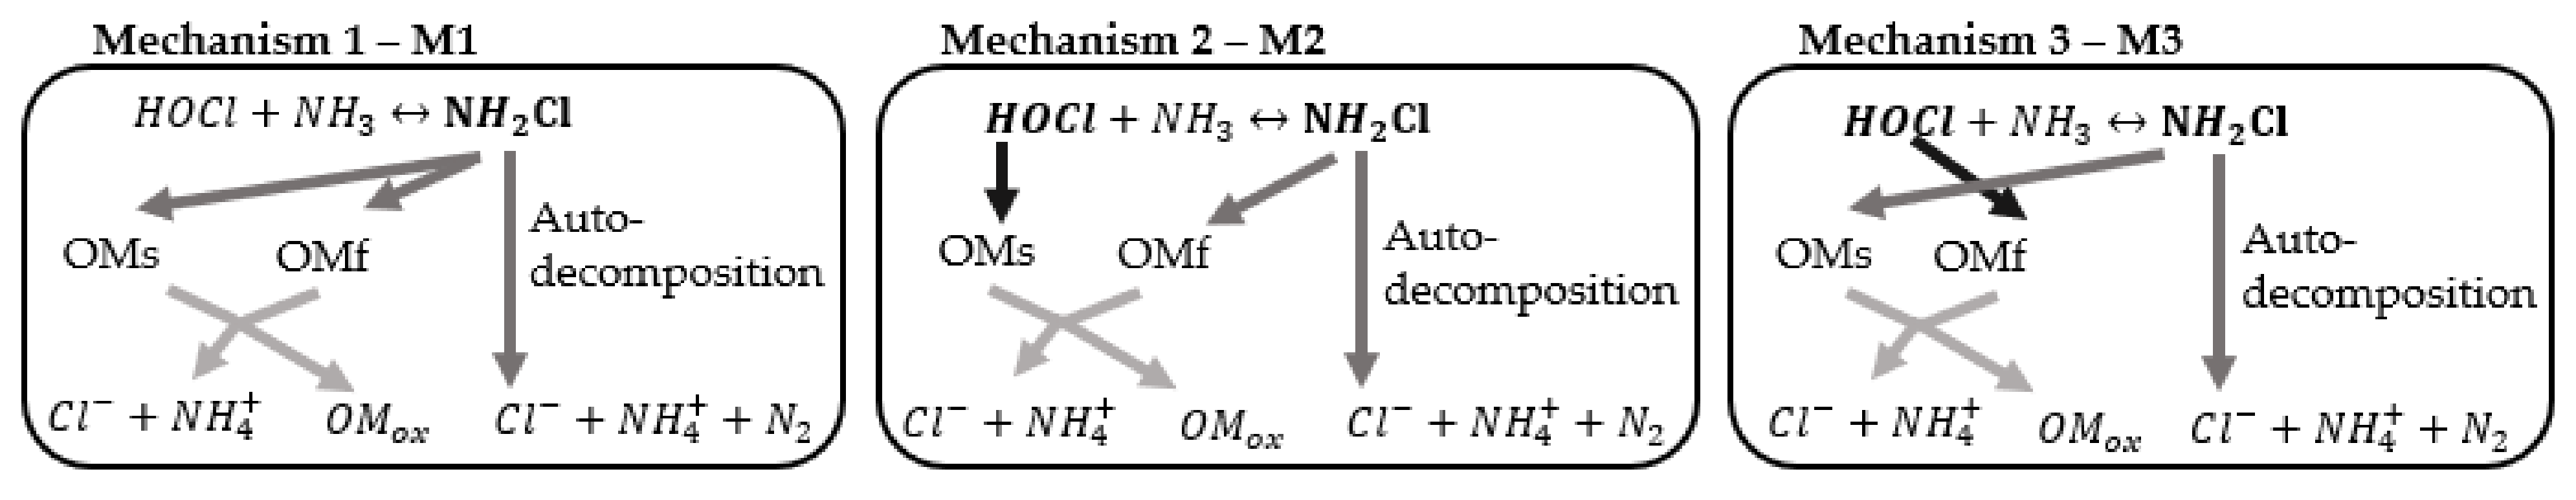
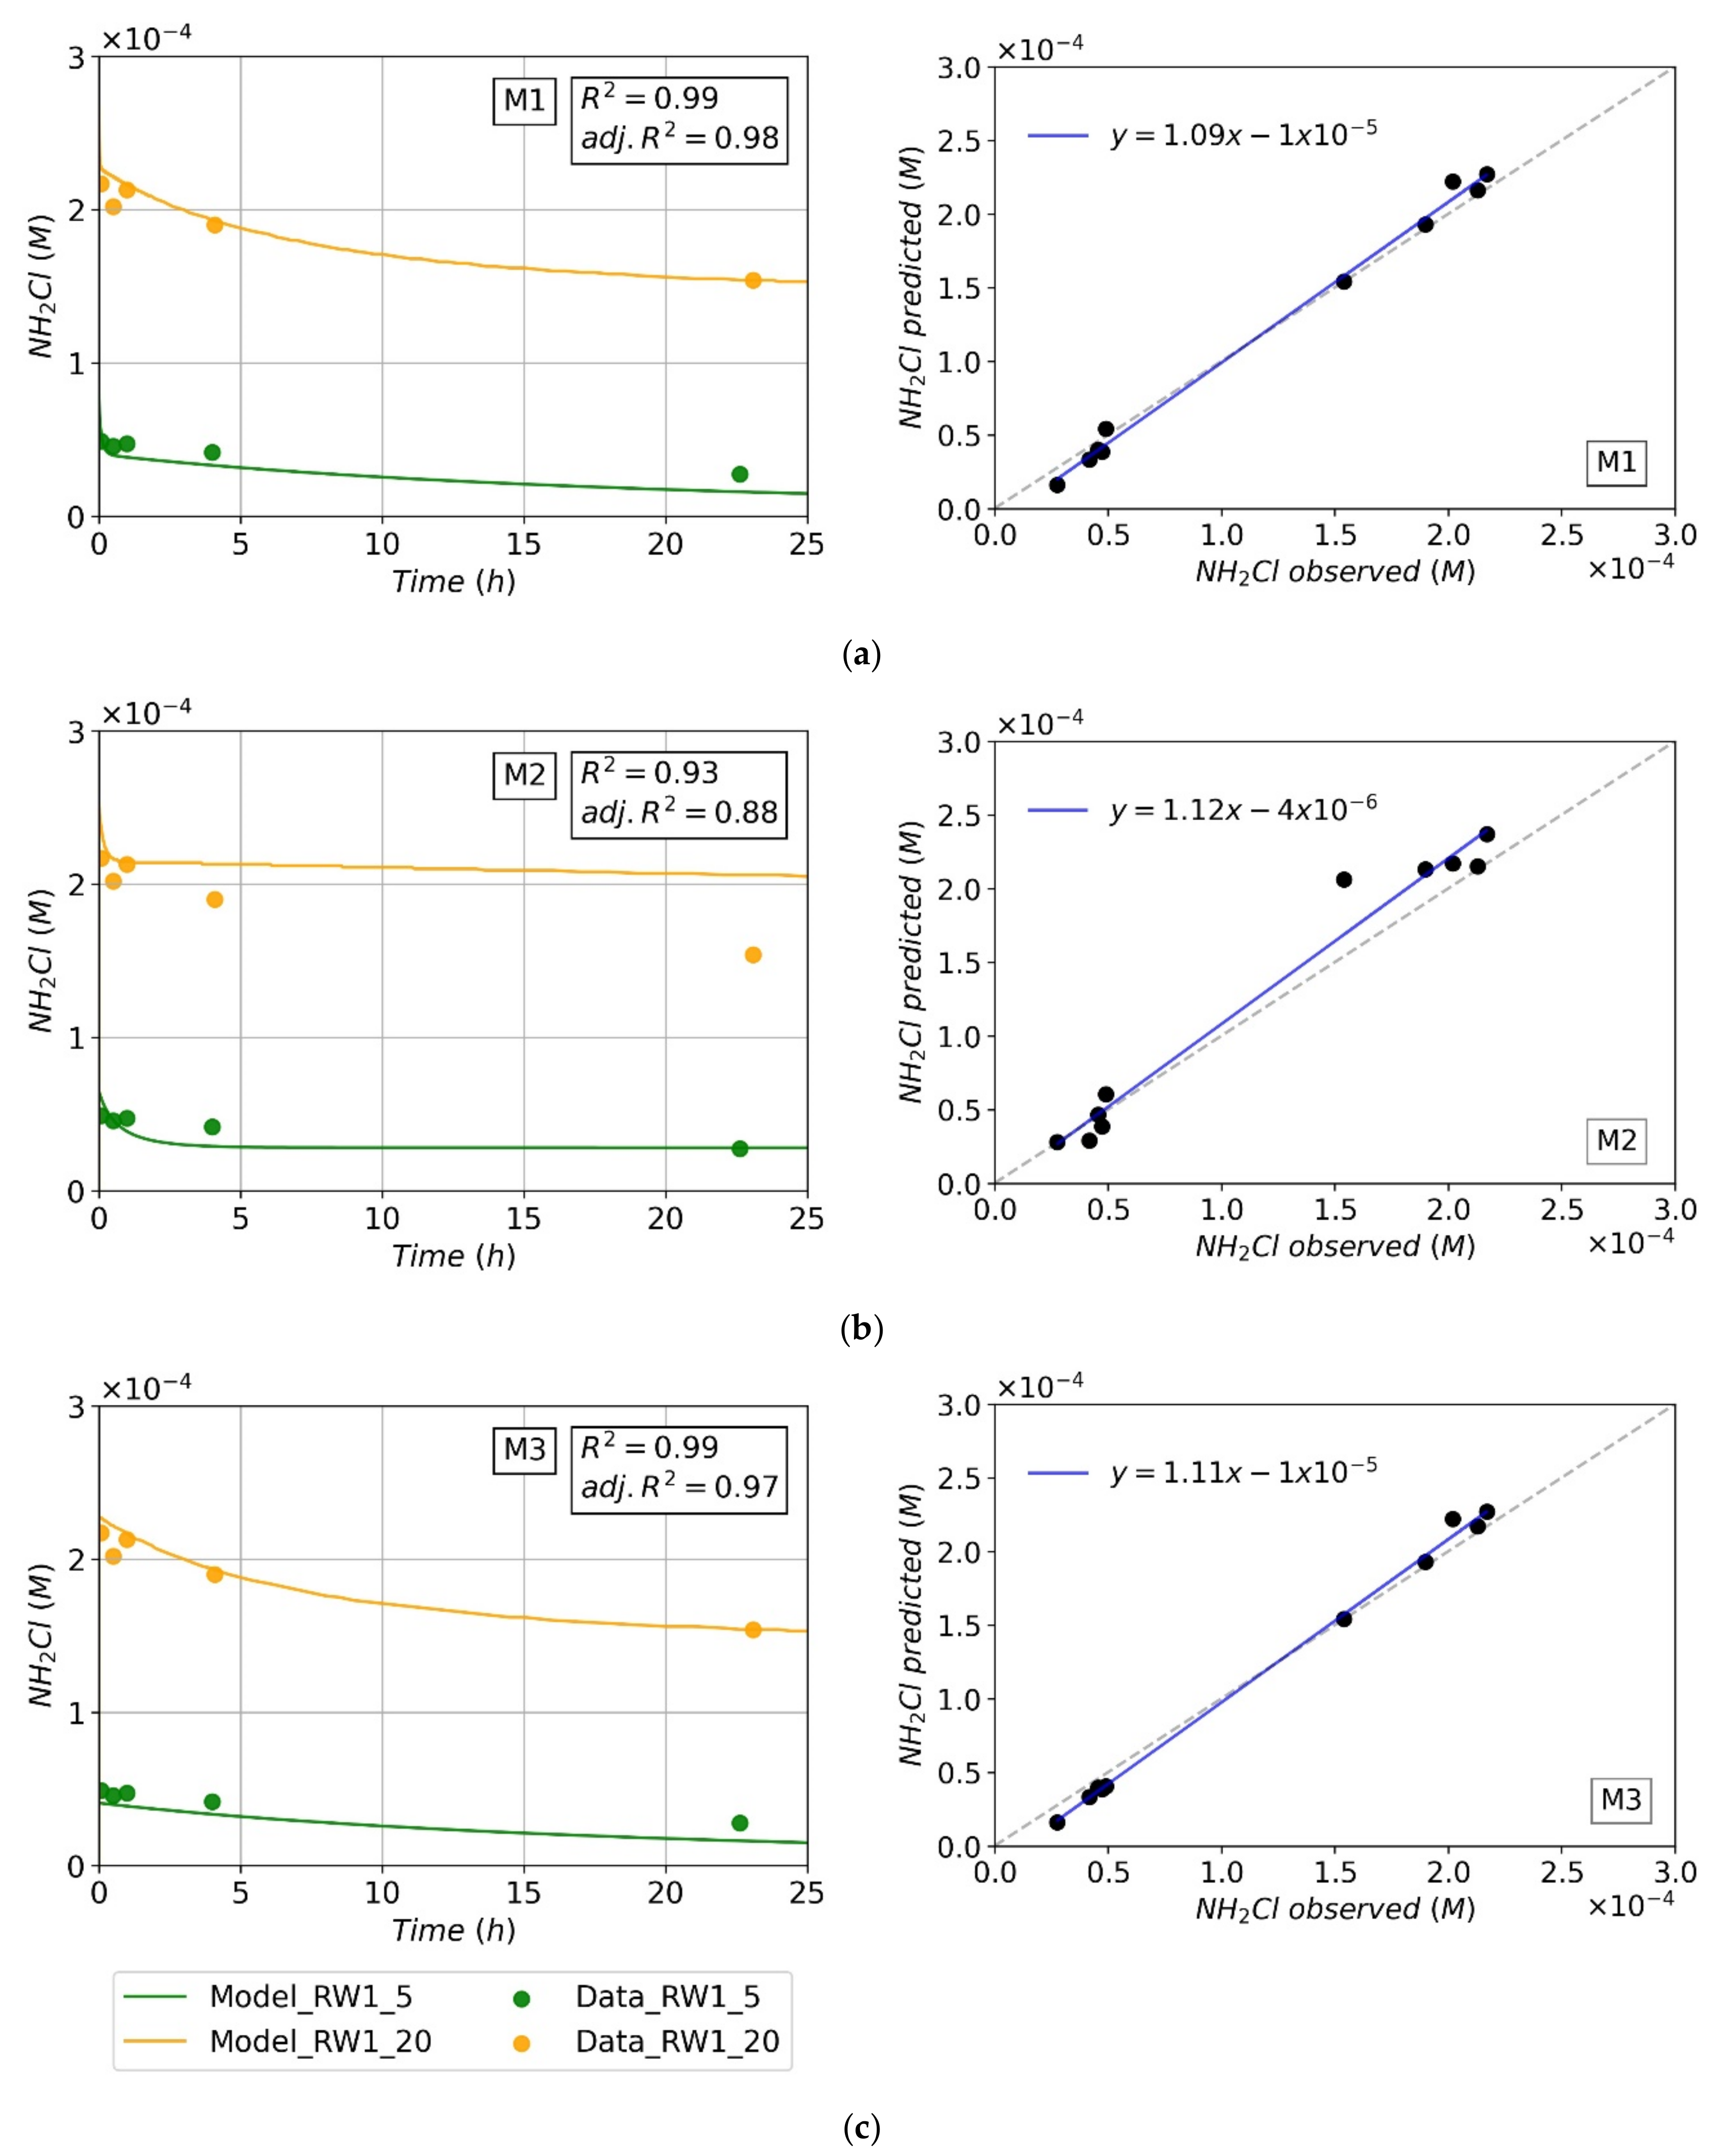
3.2. Analysis of the Mechanisms of Reactive Chlorine Species Decay in Presence of OM

Each of the three mechanisms was combined with the monochloramine auto-decomposition model and analyzed using the experimental monochloramine decay results from RW1 with two different initial chlorine doses of 8 .01 × 10 5 M (≈5 mg/L) and 2 .67 × 10 4 M (≈20 mg/L). Model and measured monochloramine decay results for each model are presented in Figure 5.
The experimental monochloramine decay profiles obtained clearly present two decay phases: a rapid decay during the first minutes and a long-term decrease thereafter. Such results corroborate the existence of two different OM reactive fractions in the RW studied.
The observed inability of the model with mechanism M2 to describe the monochloramine decay was an indicator for excluding this mechanism from this study. Additionally, comparing the observed and predicted values in the graphic of each model, the models with mechanism M1 and M3 present similarly good correlations while the model with mechanism M2 presents an evident deviation. Moreover, despite the NRMSE values being low (7.8%, 17.3%, 8.0%) and the R2 values and the adjusted R2 very close to one (0.99, 0.93 and 0.99 for the former, and 0.98, 0.88 and 0.97 for the latter) for models with mechanism M1, M2 and M3, the model with mechanism M2 clearly presents the lowest goodness of fit, confirming this exclusion.
To further evaluate mechanisms M1 and M2, the fictive concentration profiles of OM fast and slow reacting fractions were analyzed for the two initial free chlorine concentrations. Figure 6 depicts the results for RW1 at 8.01 × 10 5 M (≈5 mg/L) of initial free chlorine. It is observed that the model with mechanism M3 shows a lack of ability to represent a real occurrence of OMf as negative values are computed (Figure 6b). In turn, the model with mechanism M1 presents a coherent representation of OMf (Figure 6a). On the other hand, fictive concentrations of OM fractions present acceptable values for both mechanisms M1 and M3, as is confirmed in Figure 6c,d, respectively. Similar results were obtained for the two initial free chlorine concentrations (≈5 mg/L and ≈20 mg/L). Given this, it was concluded that M1 was the most suitable mechanism for describing chlorine decay by reaction with the organic matter.

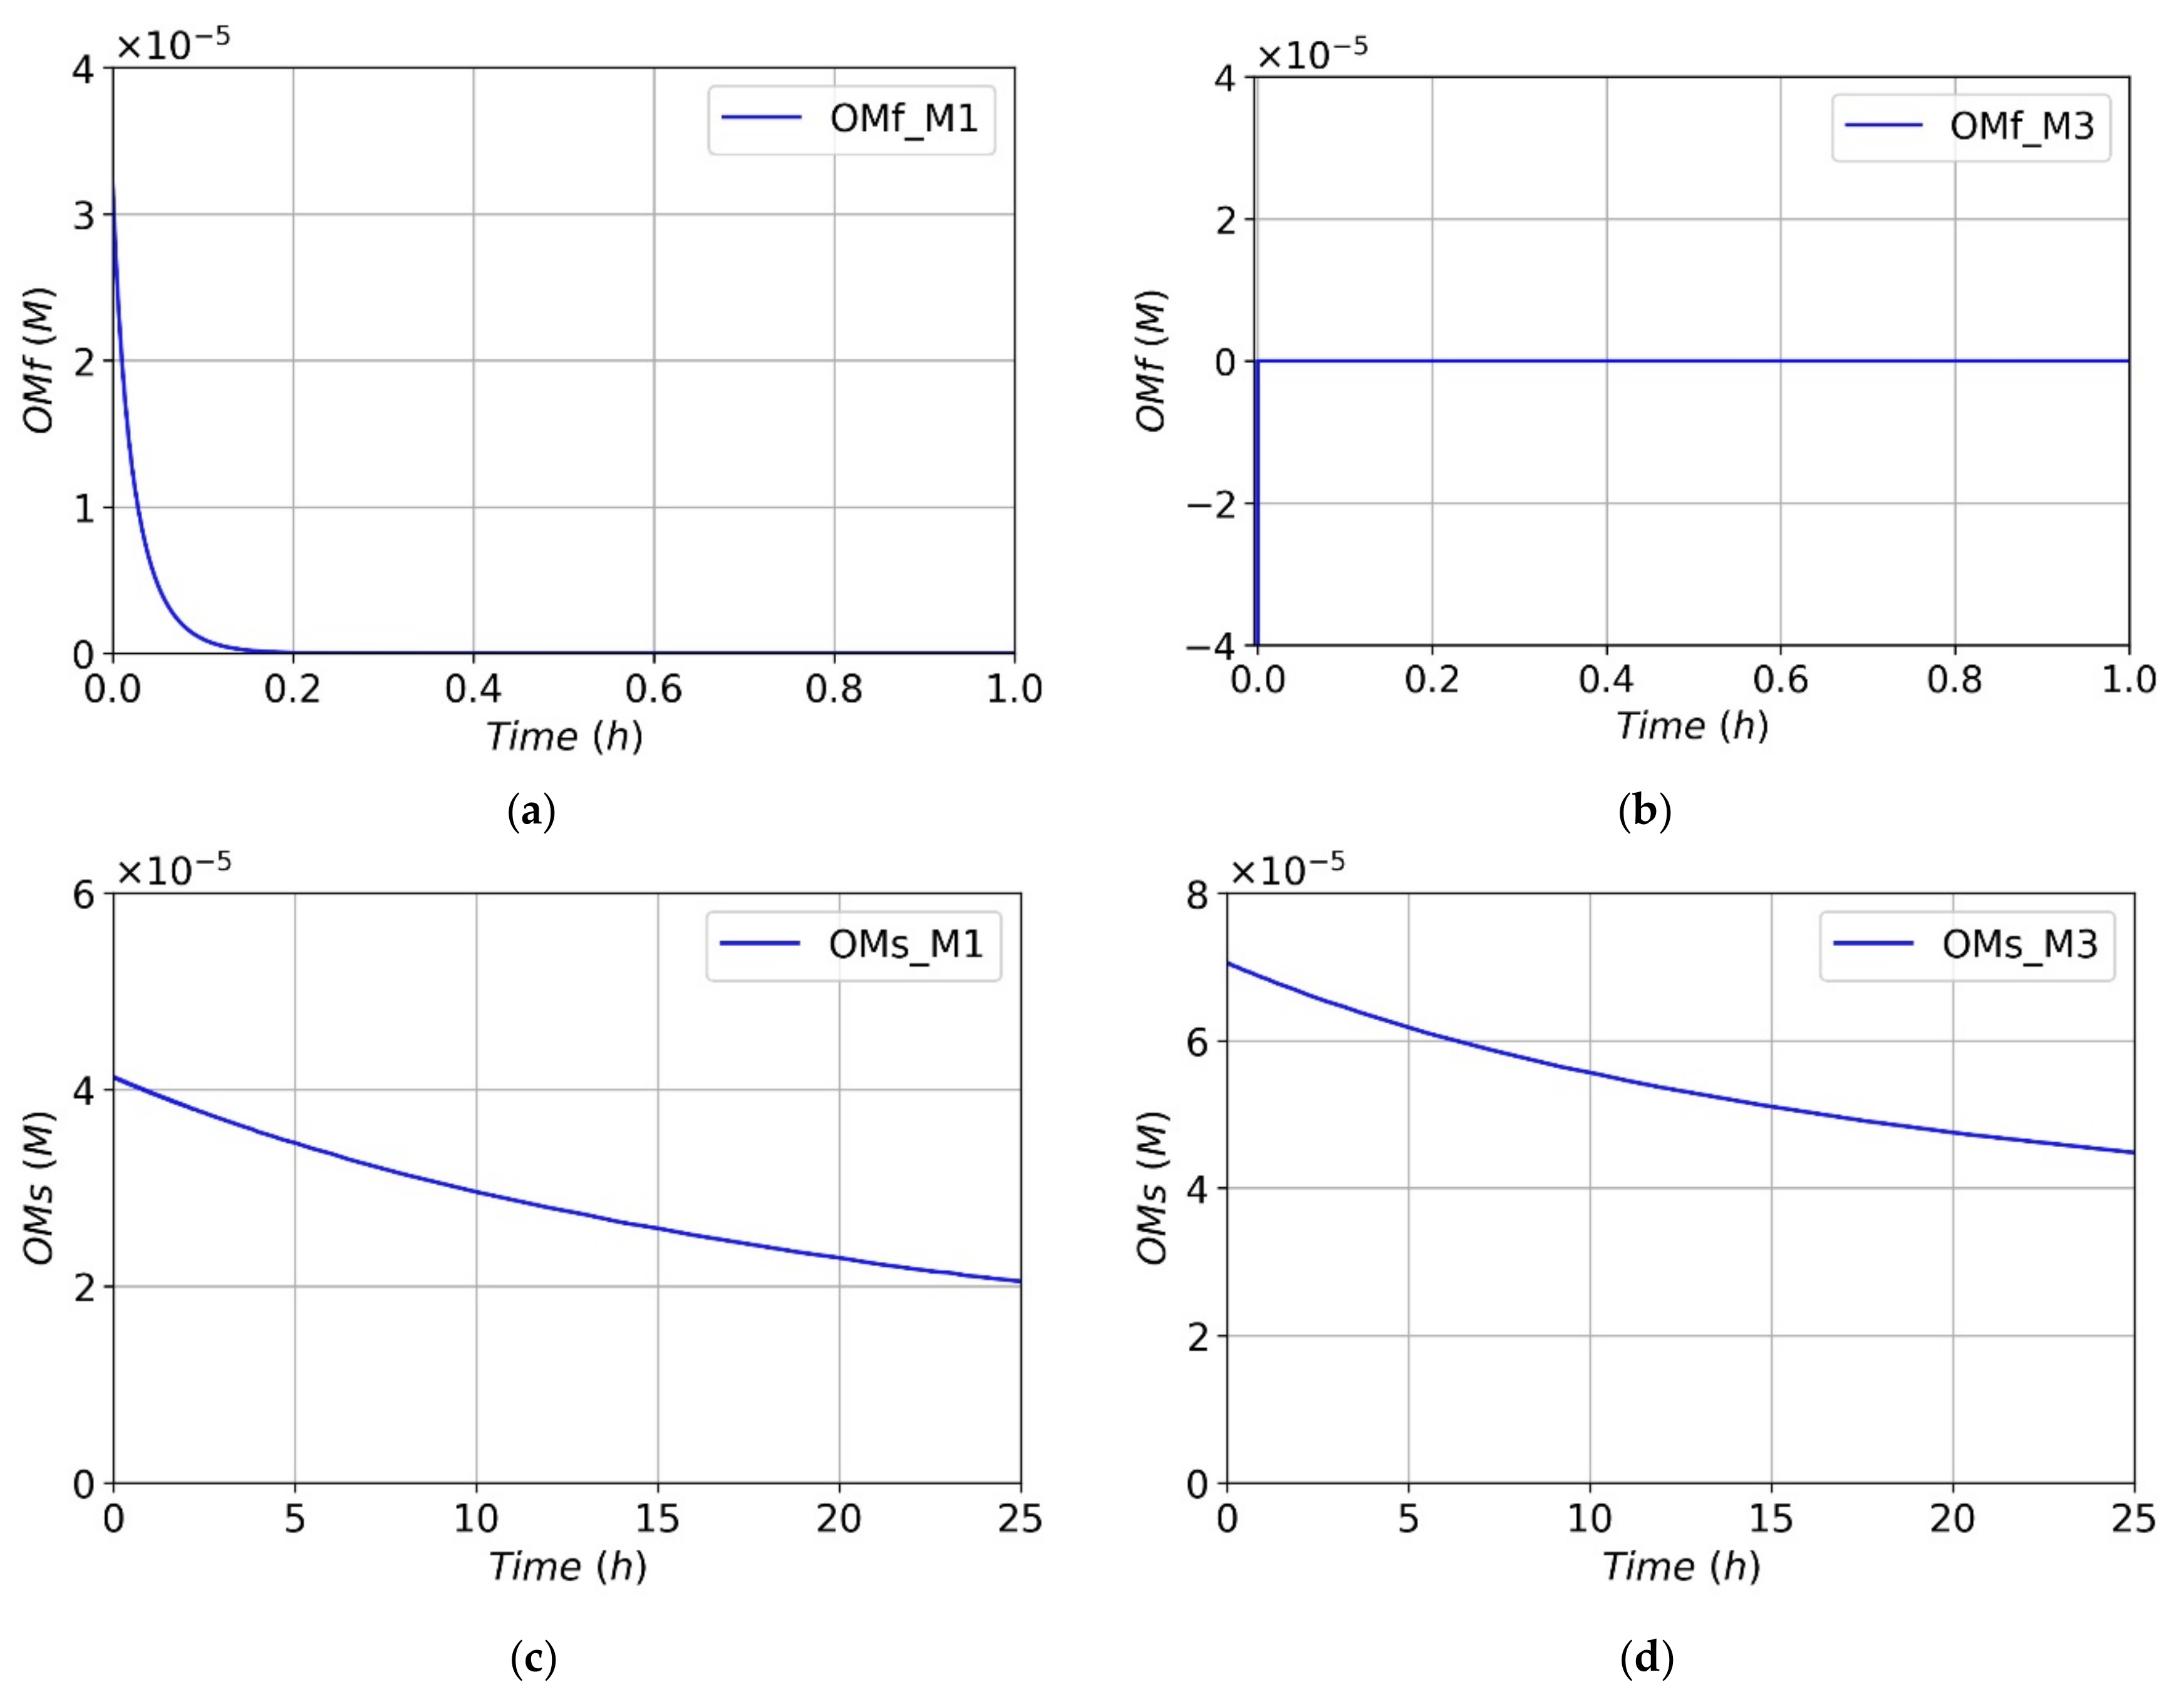
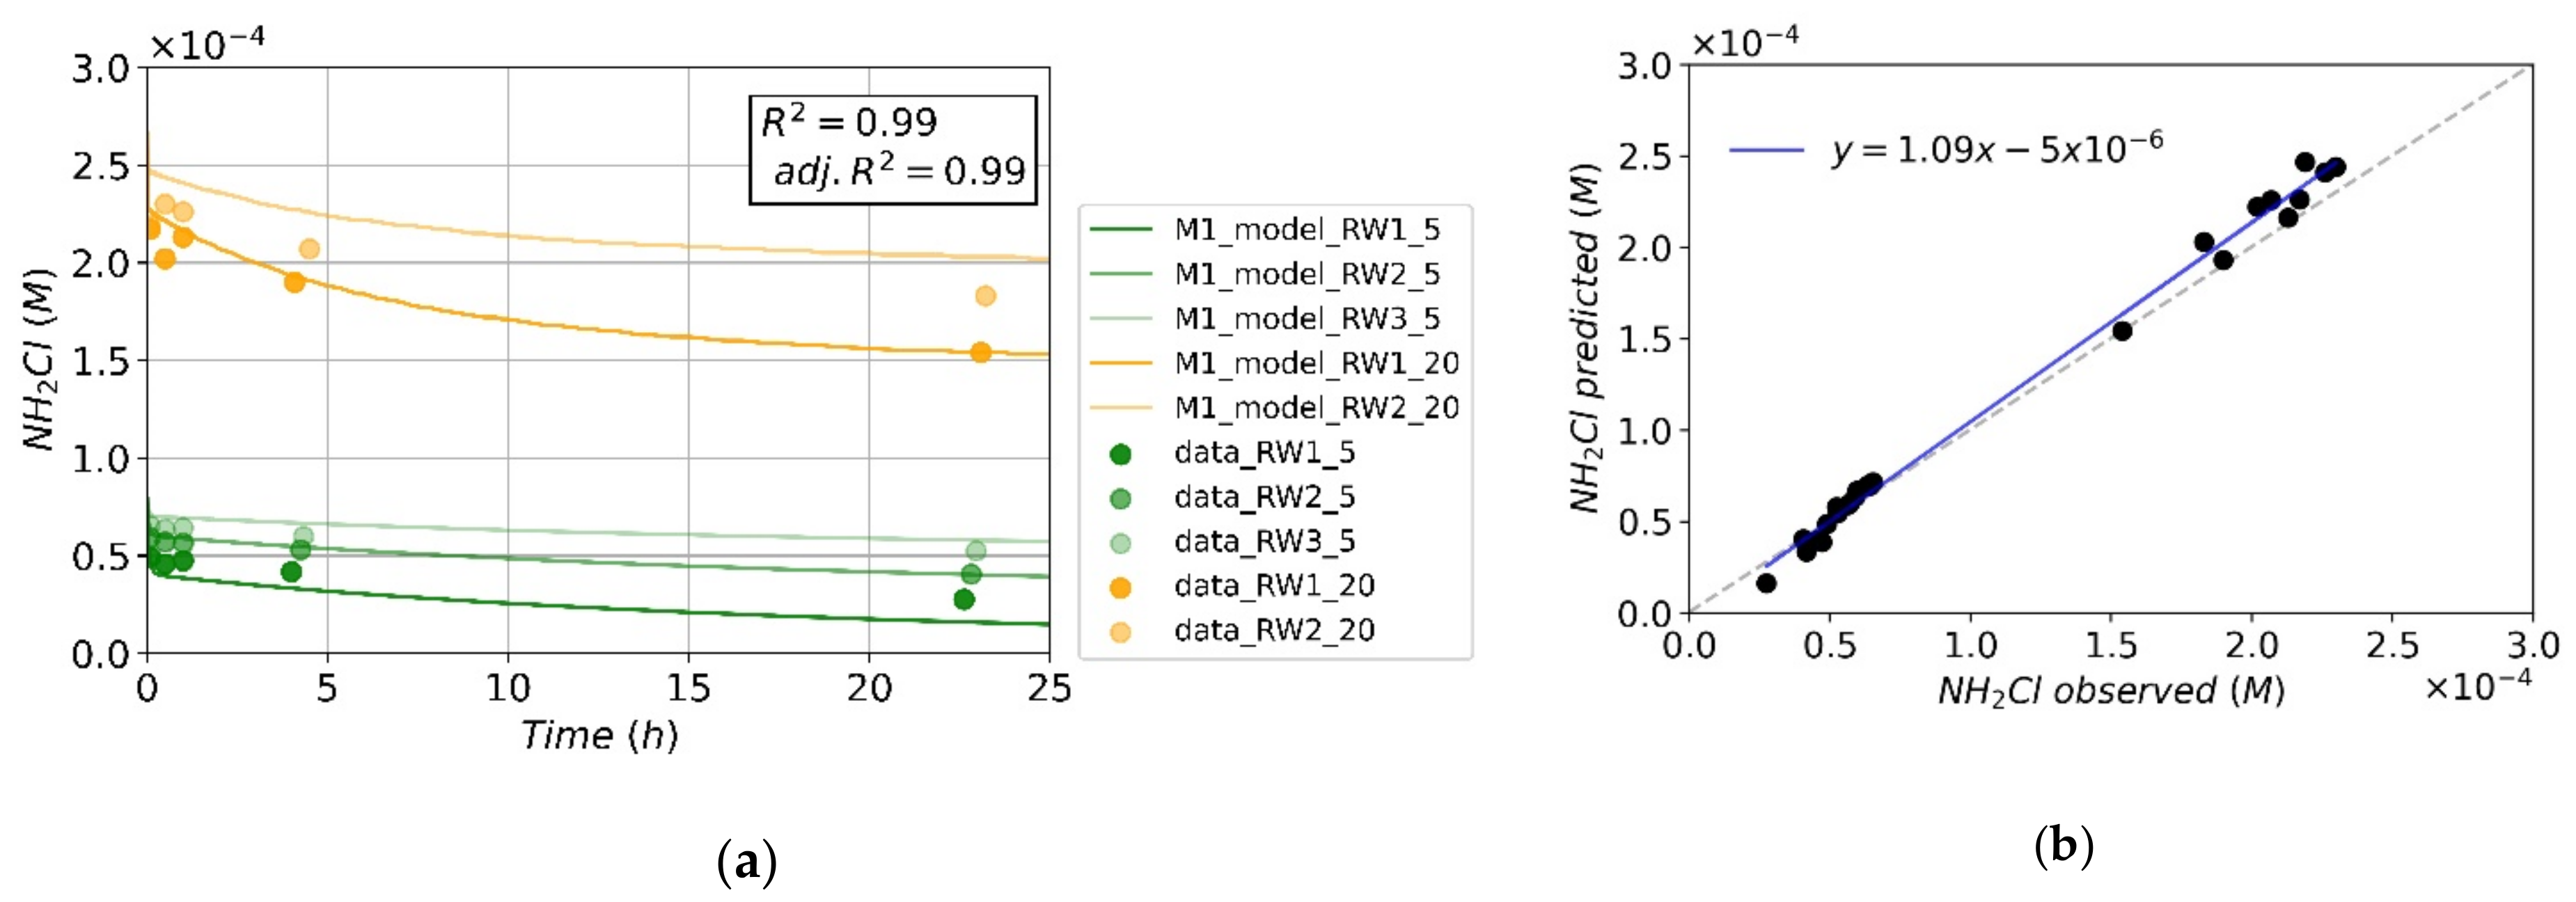
3.3. Determination of Monochloramine—OM Reaction Parameters

The monochloramine auto-decomposition model combined with the mechanism M1 was validated with the laboratory monochloramine decay results from RW1, RW2 and RW3 with two different initial free chlorine doses of 8.01 × 10 5 M (≈5 mg/L) and 2.67 × 10 4 M (≈20 mg/L) (the latter with RW1 and RW2). The model was implemented taking into account that the initial fictive concentrations of OM reactive fractions and ammonia in RW2 and RW3 are proportional to those in RW1 by the dilution factors of 1:2 and 1:4, respectively. The model was tested with 25 experimental points.
The measured and modelled monochloramine decay results are presented in Figure 7. The monochloramine modelled concentrations are fairly close to the experimental results. Although the monochloramine decay curve for RW2 with 20 mg/L of initial free chlorine somehow deviates from the experimental data, the low NRMSE value of 7.0%, the high R2 value of 0.99, and the adjusted R2 value of 0.99 indicate the model’s goodness of fit. As predicted, RWs with higher OM content present higher monochloramine decays with the same free initial chlorine dose (darkest curves in Figure 7). Moreover, monochloramine presents a rapid decay during the first minutes and a slower decay thereafter. Nevertheless, a higher decay is observed due to this slower component. For example, for RW1 with a free chlorine initial dose of 20 mg/L (darkest yellow curve), a decay of 16% (3 mg/L) of the initial free chlorine dose is observed during approximately the first 10 min and 42% (9 mg/L) during the next 25 h. The estimated model parameters and statistical values are presented in Table 4. The results show a higher fraction of slow reacting than fast reacting OM and, as expected, a kf rate constant higher than the ks rate constant.
Following the approach of Duirk et al. [17], these fictive OM concentrations can be converted to reactive site concentrations of TOC, according to Equation (1):
OM x = TOC × S x 12 , 000   ,  
where OMx is the fast or the slow reacting fraction of OM, TOC is the total organic carbon in mg-C/L and Sx is the fast or the slow reactive site TOC fraction, expressed as a percentage. The values herein obtained for the fast (4%) and the slow (7%) reactive site TOC fractions (Table 4) are in a similar range of those obtained by Duirk et al. [17] for purified Aldrich humic acid in drinking water.
Hence, the results show that for modeling chlorine decay in reclaimed waters, the monochloramine auto-decomposition model with the mechanism M1 can be used without significant performance loss.

4. Conclusions

In this paper, a chlorine decay model in reclaimed water was proposed and tested for its ability to describe chlorine decay profiles and to predict chlorine residuals. The model integrates a mechanistic reaction model for chlorine decay in the presence of ammonia, only previously calibrated for drinking water, with empirical reactions accounting for chlorine decay due to the presence of OM.
According to the results, the following conclusions were attained:
  • The monochloramine auto-decomposition mechanistic reaction model was herein shown to be valid for free chlorine dosing in synthetic model waters mimicking RWs.
  • For describing chlorine decay due to OM, three mechanisms were hypothesized and tested using real RWs with the model considering a parallel second-order mechanism, where monochloramine reacting with both fast and slow reacting OM fractions presented the best performance.
  • A calibration of the model with three RWs was successfully carried out, enabling the computing of fictive concentrations of slow and fast reacting OM and the rate constants.
  • Despite the overall model complexity, it was successfully implemented and is expected to contribute to driving further advances in simulations and the predictions of chlorine concentrations in RW, namely the integration of the reaction schemes into hydraulic models for supporting the operational control of RW disinfection in RWDS.
  • Further research on model upgrades will involve including the temperature effect on the kinetic constants of the model and incorporating water quality parameters through correlations with the model parameters.

Author Contributions

J.C.: Investigation, Methodology, Software, Formal Analysis, Laboratory work, Writing—original draft preparation. E.M.: Investigation, Laboratory Work, Writing—Review and Editing. F.F.: Supervision, Writing—Review and Editing, Resources. M.J.R.: Conceptualization, Writing—Review and Editing, Resources. R.M.C.V.: Conceptualization, Methodology, Software, Formal Analysis, Investigation, Writing—Review and Editing, Supervision. All authors have read and agreed to the published version of the manuscript.

Funding

This research was funded by Fundação para a Ciência e a Tecnologia (FCT), through grant number PD/BD/135218/2017, and by the European Union’s Horizon 2020, under grant agreement No. 869171 (B-WaterSmart).

Institutional Review Board Statement

Not applicable.

Informed Consent Statement

Not applicable.

Data Availability Statement

The data presented in this study are available on request from the corresponding author. The data are not publicly available due to privacy reasons.

Acknowledgments

The water utility Águas do Tejo Atlântico is acknowledged for providing the wastewater samples and for collaborating in the physicochemical characterization of the wastewater.

Conflicts of Interest

The authors declare no conflict of interest.

References

  1. UN-Water. Wastewater—The Untapped Resources; The United Nations Educational, Scientific and cultural Organization: Paris, France, 2017. [Google Scholar]
  2. International Water Association. Wastewater Report—The Reuse Opportunity; IWA Head Office: London, UK, 2018. [Google Scholar]
  3. UN Water. Compendium of Water Quality Regulatory Frameworks: Which Water for Which Use? UN-Water; The United Nations Educational, Scientific and cultural Organization: Paris, France, 2015. [Google Scholar]
  4. Decrew Law. Decreto-Lei n.o 119/2019, de 21 de Agosto. D. R., Série I. n.o159 Portugal. 2019, pp. 21–44. Available online: https://files.dre.pt/1s/2019/08/15900/0002100044.pdf (accessed on 17 November 2021).
  5. The European Parliament and the Council of the European Union. Regulation (EU) 2020/741, Minimum requirements for water reuse. Off. J. Eur. Union 2020, 2019, L 177/32–L 177/55. [Google Scholar]
  6. Economic European Communities. Council Directive 91/271/EEC of 21 May 1991 Concerning Urban Waste Water Treatment. Off. J. Eur. Communities. 1991, p. L135/40-52. Available online: https://eur-lex.europa.eu/legal-content/EN/TXT/?uri=celex%3A31991L0271 (accessed on 17 November 2021).
  7. IMPEL. Report on Urban Water Reuse—Integrated Water Approach and Urban Water Reuse Project; IMPEL General: Vienna, Austria, 2018. [Google Scholar]
  8. Deloite. Policy Options to Set Minimum Quality Requirements for Reused Water in the EU; Publications Office of the European Union: Luxembourg, Luxembourg, 2017; pp. 1–65. [Google Scholar]
  9. International Organization for Standardization. ISO 16075-2:2015—Guidelines for Treated Wastewater Use for Irrigation Projects—Part 2: Developement of the Project; ISO: Geneva, Switzerland, 2015. [Google Scholar]
  10. Sathasivan, A.; Krishna, K.C.B.; Kastl, G.; Trinh, Q.T.; Listowski, A. Factors affecting chlorine stability in recycled water distribution systems how much do we know. In Proceedings of the 12th IWA International Conference on water Reclamation and Reuse, Berlin, Germany, 16 June 2019. [Google Scholar]
  11. Black & Veatch Corporation. White’s Handbook of Chlorination and Alternative Disinfectants, 5th ed.; John Wiley & Sons, Inc.: Hoboken, NJ, USA, 2010; Volume 1. [Google Scholar]
  12. Wei, I.W. Chlorine-Ammonia Breakpoint Reactions: Kinetics and Mechanism; Harvard University: Cambridge, MA, USA, 1972. [Google Scholar]
  13. Leao, S.F.; Selleck, R.E. The chemistry of combined residual chlorination. In Conference on Water Chlorination; University of California: Pacific Grove, CA, USA, 1982; Volume 139. [Google Scholar]
  14. Jafvert, C.T.; Valentine, R.L. Reaction Scheme for the Chlorination of Ammoniacal Water. Environ. Sci. Technol. 1992, 26, 577–586. [Google Scholar] [CrossRef]
  15. Vikesland, P.J.; Ozekin, K.; Valentine, R.L. Monochloramine decay in model and distribution systems waters. Water Res. 2001, 35, 1766–1776. [Google Scholar] [CrossRef]
  16. Huang, X.C. Reactions between Aqueous Chlorine and Ammonia: A Predictive Model; Northeastern University: Boston, MA, USA, 2008. [Google Scholar]
  17. Duirk, S.E.; Gombert, B.; Choi, J.; Valentine, R.L. Monochloramine loss in the presence of humic acid. J. Environ. Monit. 2002, 4, 85–89. [Google Scholar] [CrossRef] [PubMed]
  18. Duirk, S.E.; Gombert, B.; Croué, J.P.; Valentine, R.L. Modeling monochloramine loss in the presence of natural organic matter. Water Res. 2005, 39, 3418–3431. [Google Scholar] [CrossRef] [PubMed]
  19. Wang, Y.H.; Wu, Y.H.; Du, Y.; Li, Q.; Cong, Y.; Huo, Z.Y.; Chen, Z.; Yang, H.W.; Liu, S.-M.; Hu, H.Y. Quantifying chlorine-reactive substances to establish a chlorine decay model of reclaimed water using chemical chlorine demands. Chem. Eng. J. 2019, 356, 791–798. [Google Scholar] [CrossRef]
  20. Powell, J.C.; Hallam, N.B.; West, J.R.; Forster, C.F.; Simms, J. Factors which control bulk chlorine decay rates. Water Res. 2000, 34, 117–126. [Google Scholar] [CrossRef]
  21. APHA, AWWA, WEF. Standard Methods for the Examination of Water and Wastewater, 20th ed.; Water Research: Washington, DC, USA, 1998; Volume 16, pp. 1495–1496. [Google Scholar]
  22. CEN (European Commitee for Standardization). EN 1484 Water Analysis—Guidelines for the Determination of Total Organic Carbon (TOC) and Dissolved Organic Carbon (DOC) Analyse; CEN: Brussels, Belgium, 1997; p. 11. [Google Scholar]
  23. COMSOL. Optimization Module—User’s Guide. COMSOL: Burlington, NC, USA; 2015. Available online: https://doc.comsol.com/5.4/doc/com.comsol.help.opt/OptimizationModuleUsersGuide.pdf (accessed on 17 November 2021).
Figure 1. Mechanisms studied to describe the reactive chlorine species decay due to OM (OMf: fast reacting OM fraction, Oms: slow reacting OM fraction).
Sustainability 13 13548 g001
Figure 2. Model development, implementation, and calibration strategy.
Sustainability 13 13548 g002
Figure 3. Experimental procedure and setup schematics.
Sustainability 13 13548 g003
Figure 4. Experimental data (data points) and model results (curves) of monochloramine decay in synthetic waters using monochloramine auto-decomposition model, at three different initial concentrations of ammonia (a) 3.57 × 10⁻⁴ M (≈5 mg/L) (b) 7.14 × 10⁻⁴ M (≈10 mg/L) (c) 2.14 × 10⁻³ M (≈30 mg/L) and free initial chlorine of approximately 2 mg/L, 5 mg/L and 10 mg/L (lighter to darker results).
Sustainability 13 13548 g004
Figure 5. Experimental data (data points) and model results (curves) of monochloramine decay adopting the auto-decomposition model with each mechanism (left) and comparison between experimental and predicted values (right) for: (a) mechanism M1, (b) mechanism M2 and (c) mechanism M3 and using RW1 and two initial free chlorine concentrations 8.01 × 10⁻⁵ M (≈5 mg/L) and 2.67 × 10⁻⁴ M (≈20 mg/L).
Sustainability 13 13548 g005
Figure 6. Model results of OMf concentrations for (a) mechanism M1 and (b) mechanism M3, and OMs for (c) mechanism M1 and (d) mechanism M3, both for RW1 with 8.01 × 10⁻⁵ M (≈5 mg/L) of initial free chlorine concentration.
Sustainability 13 13548 g006
Figure 7. (a) Experimental data (points) and model results (curves) of monochloramine decay in RW1, RW2 and RW3 using monochloramine auto-decomposition model with mechanism M1 and two initial free chlorine concentrations 8.01 × 10⁻⁵ M (≈5 mg/L) and 2.67 × 10⁻⁴ M (≈20 mg/L) (the latter with RW1 and RW2). (b) Comparison between the experimental and predicted values.
Sustainability 13 13548 g007
Table 1. Stoichiometric equations and equilibrium reactions for monochloramine auto-decomposition 1, Reprinted with permission from ref. [15]. 2001 Elsevier.
ReactionReaction Coefficients/Equilibrium Constants at 25 °C
R1 H O C l + N H 3 N H 2 C l + H 2 O k 1 = 1.5 × 10 10   M 1 h 1
R2 N H 2 C l + H 2 O   H O C l + N H 3 k 2 = 7.6 × 10 2   h 1
R3 H O C l + N H 2 C l     N H C l 2 + H 2 O k 3 = 1.0 × 10 6 M 1 h 1
R4 N H C l 2 + H 2 O     H O C l + N H 2 C l k 4 = 2.3 × 10 3 h 1
R5 N H 2 C l + N H 2 C l N H C l 2 + N H 3 k 5 = k 5 H H + + k 5 H C O 3 H C O 3 + k 5 H 2 C O 3 H 2 C O 3
R6 N H C l 2 + N H 3   N H 2 C l + N H 2 C l k 6 = 2.2 × 10 8 M 2 h 1
R7 N H C l 2 + H 2 O   I k 7 = 4 × 10 5   M 1 h 1
R8 I + N H C l 2   H O C l + p r o d u c t s k 8 = 1 × 10 8 M 1 h 1
R9 I + N H 2 C l   p r o d u c t s k 9 = 3 × 10 7 M 1 h 1
R10 N H 2 C l + N H C l 2     p r o d u c t s k 10 = 55   M 1 h 1
R11 H O C l H + + O C l p K a = 7.5
R12 N H 4 + H + + N H 3 p K a = 9.3
R13 H 2 C O 3 H + + H C O 3 p K a = 6.3
R14 H C O 3 H + + C O 3 2 p K a = 10.3
1 The reaction coefficients and equilibrium constants were taken from Vikesland et al. [15]; I is an unidentified intermediate; Products may include: H 2 ,     H 2 O ,   C l , H + , N O 3 ; k 5 H = 2.5 × 10 7 M 2 h 1 ;   k 5 H C O 3 = 800   M 2 h 1 ; k 5 H 2 C O 3 = 4 × 10 4 M 2 h 1 .
Table 2. Stoichiometric empirical equations for each mechanism.
ReactionParameters Reference
R15_M1 N H 2 C l + O M f p r o d u c t s kf; OMf0
ks; OMs0
Duirk et al. [17]
R16_M1 N H 2 C l + O M s p r o d u c t s
R15_M2 N H 2 C l + O M f p r o d u c t s Duirk et al. [18]
R16_M2 H O C l + O M s p r o d u c t s
R15_M3 H O C l + O M f p r o d u c t s Hypothesized in this work
R16_M3 N H 2 C l + O M s p r o d u c t s
Table 3. Reclaimed water quality parameters.
ParameterRW1RW2RW3
 pH7.27.77.9
 Temperature (°C)181717
 Conductivity (µS/cm at 25 °C)107811501182
 ORP (mV)228263278
 Alkalinity (mg-CaCO3/L)188180175
 Hardness (mg-CaCO3/L)190162136
 Turbidity (NTU)7.41.20.5
 DOC (mg-C/L)9.64.82.4
 TOC (mg-C/L)11.95.93.0
 A254 (cm−1)0.1730.0780.034
 A436 (cm−1)0.0160.0080.003
 Transmittance (%)437989
 SUVA (L/mg-C/m)1.801.621.41
 Total Nitrogen (mg/L)37.324.619.1
 Ammonia Nitrogen (mg-N-NH4/L)19.19.64.8
E. coli (NMP/100 mL) 7.0 × 10 5 4.5 × 10 6 2.3 × 10 6
 Heterotrophic plate count (cfu/mL) 4.8 × 10 4 2.4 × 10 4 1.2 × 10 4
Table 4. Estimated parameters and statistical values for the semi-mechanistic model (auto decomposition model + mechanism M1).
ParameterAuto-Decomposition Model + Mechanism M1
kf (M/h) 2.81 × 10 5
ks (M/h) 6.34 × 10 2
OMf0 (M) (RW1) 4.15 × 10 5
Sf (%)4
OMs0 (M) (RW1) 7.03 × 10 5
Ss (%)7
RMSE (M) 7.91 × 10 6
R20.99
Adjusted R20.99
Publisher’s Note: MDPI stays neutral with regard to jurisdictional claims in published maps and institutional affiliations.

