Article

Urban Land-Use Efficiency Analysis by Integrating LCRPGR and Additional Indicators

1
School of Geomatics and Urban Spatial Informatics, Beijing University of Civil Engineering and Architecture, Beijing 100044, China
2
Beijing Advanced Innovation Center for Future Urban Design, Beijing University of Civil Engineering and Architecture, Beijing 100044, China
3
Aerospace Information Research Institute, Chinese Academy of Sciences, Beijing 100094, China
*
Author to whom correspondence should be addressed.
Sustainability 2021, 13(24), 13518; https://doi.org/10.3390/su132413518
Submission received: 13 October 2021 / Revised: 25 November 2021 / Accepted: 5 December 2021 / Published: 7 December 2021

Abstract

:
Sustainable Development Goal (SDG) target 11.3 is to enhance inclusive and sustainable urbanisation and capacity for participatory, integrated, and sustainable human settlement planning and management in all countries by 2030. Within that goal, the indicator SDG 11.3.1 is defined as the ratio of land consumption rate to population growth rate (LCRPGR). This ratio is primarily used to measure urban land-use efficiency and reveal the relationship between urban land consumption and population growth. The LCRPGR indicator is aimed at representing overall urban land-use efficiency. This study added compactness, urban expansion speed, and urban expansion intensity to better reflect the impact of built-up area changes on the overall urban land-use efficiency. In addition, this study combined LCRPGR and the land consumption per capita rate (LCPC) to comprehensively analyse the relationship between land consumption and population growth in existing built urban areas, expanded built urban areas, and total built areas. This study employed three years of urban built-up and population data for 2010, 2015, and 2020 for 338 cities along the Belt and Road region to analyse land-use efficiency. The results show that the average LCRPGR for the period 2010–2015 was 1.01, which is close to the recommended ideal LCRPGR value of 1.0 in the United Nations Human Settlements Programme. For 2015–2020, the LCRPGR was 0.71, indicating that the overall urban land consumption in the study area decreased. This is also supported by the fact that the urban expansion intensity in 2020 was weaker than that in 2015. In addition, according to research on the tendency of changes in the entire urban built-up area, the smaller the urban population, the slower the urban expansion speed, the smaller the compactness, and the increasingly complex the urban borders. In cities where the overall LCRPGR is far from the ideal value of 1, the entire built-up area is divided into existing and expanded urban regions. It was found that the average LCPC value in expanded built-up areas was higher than that of existing built-up areas, showing that as cities developed, the LCPC of the newly developed urban areas was greater than that of existing built-up areas. Meanwhile, the LCPC in the expanded built-up areas showed a decreasing trend over time from 2010 to 2015 to 2020, indicating that land use in the expanded built-up regions tended to be efficient. These findings provide helpful information in decision making for balancing urban land consumption with population growth.

1. Introduction

More than half of the world’s population lives in cities, and by 2050, two out of three people (6.5 billion people) will live in cities [1]. The process of global urbanisation continues but also has some problems. For example, rapid urban expansion occupies arable land and other valuable land resources, resulting in the continuous reduction of farmland, green space, and water surfaces, which has become a critical urban issue [2]. Therefore, without a significant change in the way urban space is built and managed, sustainable development will be difficult to achieve. In the process of rapid urbanisation, it is expected that land finance, urban housing prices, urban heat islands, urban negative environments, urban density, infrastructure, and service supply will all have an impact on urban sustainability [3,4,5,6,7,8]. The imbalance between population growth and the urban land consumption rate has reduced urban land effectiveness, thereby negatively affecting urban sustainability.
The Sustainable Development Goals (SDGs) were issued by the United Nations (UN) in 2015 as a universal call to action to end poverty, protect the planet, and ensure that all people enjoy peace and prosperity by 2030 [9]. A total of 17 SDGs were presented, comprising 169 associated targets with 231 measurable indicators. One of these, SDG 11, known as the ‘urban goal’, is composed of 10 targets and 15 indicators [10]. It states that cities and human settlements must be inclusive, safe, resilient, and sustainable and incorporates an important SDG indicator known as 11.3.1, which is the ratio of land consumption rate (LCR) to population growth rate (PGR), collectively known as LCRPGR. The value of LCRPGR can be used to understand the relationship between urban population changes and the urban land consumption rate [11,12,13,14]. In a recent United Kingdom report [15], Wales’ LCR was 1.4% and PGR was 1.9%, while England’s LCR was 4.4% and PGR was 2.3%, for the period 2013–2016. In China, the LCRPGR value has been determined to be 1.96, which is twice as high as that suggested by the China Urban Planning and Design Institute [16]. Throughout the world, the mean LCRPGR value of 194 global sample cities, which was stratified according to world regions, city population ranges, and the number of cities in the country groups, was 1.68 for 1990–2000 and 1.74 for 2000–2015, which was slightly increased from the previous decade [17]. According to the UN SDGs report in 2020, the built-up area per capita in most urban areas worldwide has generally increased, and the physical expansion of cities has grown faster than the rate of population growth before 2015 [18].
Several case studies have assessed the utility of the indicator SDG 11.3.1 in the identification of urban land-use efficiency in a variety of cities around the world. Those studies have been required to use similar methods with a variety of data structures to reflect the heterogeneity of cities or regions, indicating the challenge of implementing this metric. Naledzani et al. [19] calculated the SDG 11.3.1 values of four cities in South Africa to understand the urbanisation trends of cities with different sizes by combining Landsat 5 Thematic Mapper (TM) and SPOT 2 and 5 and census data; the results show that smaller and secondary cities in Africa are growing at a faster rate than the larger cities, not only in terms of PGR but also in terms of spatial expansion. Koroso et al. [20] used high-resolution Google Earth images to investigate urban land-use efficiency in 16 cities in Ethiopia and concluded that in almost all expansion frontiers (Bole and Akaki-Kaliti sub-cities), urban land-use efficiency was generally low. Ghazaryan et al. [21] employed SDG 11.3.1 to assess the trend of urban expansion in Germany and found that the urban expansion rates were considerably higher than population growth rates in some regions within North Rhine–Westphalia. Li et al. [22] used a 30 m high-resolution urban impervious surface dataset and UN global population data to calculate SDG 11.3.1 in Eurasia to reveal the land utilisation rate in different geographic regions. Laituri et al. [23] compared and calculated the SDG 11.3.1 indicator of the secondary city and demonstrated that this indicator can be applied to diverse secondary cities with limited data.
In addition to calculating the SDG 11.3.1 indicator, other studies have focused on discussing other potential applications of this indicator. Michele Melchiorri et al. [24] discussed the feasibility of the SDG 11.3.1 index of Global Human Settlement Layer (GHSL) data on a global scale and demonstrated that there is potential to raise SDG 11.3.1 from a Tier II classification to Tier I. Wang et al. [25] used earth observation data to monitor SDGs on both large and fine scales and provided an example of the localisation of SDG 11.3.1 in China. Marcello Schiavina et al. [26] calculated global SDG 11.3.1 values based on GHSL open data [27] and added additional indicators including ‘abstract achieved population density in expansion areas’ and the ‘marginal land consumption per new inhabitant’ to analyse global land utilisation. Jiang et al. [28] calculated China’s land-use efficiency by combining LCRPGR and the ratio of ‘economic growth to land consumption rate’, which can reflect the relationship between the economy, land, and population. These studies show that LCRPGR is suitable for analysing the overall urban land-use efficiency both on its own or by combining it with other indicators.
According to Wilson and Chakraborty [29], studying the physical characteristics of urban growth as a pattern of urban development is one of the most common approaches in defining urban sprawl. In addition to LCRPGR, this study employed urban sprawl speed, urban sprawl intensity, and compactness to better estimate the impact of the urban built-up area change on urban land-use efficiency.
In current research, the use of LCRPGR has been successful to reflect the relationship between overall urban land consumption and population change, yet changes in the relationship between the two in urban detail are not obvious, and the explanation of urban land-use efficiency remains insufficient. Therefore, this study intended to divide the overall urban built-up area into existing built-up areas and expanded built-up areas to better analyse the urban land-use efficiency of the city from these two different perspectives. Within these two area types, the secondary index mentioned in the UN SDG 11.3.1 metadata [30] known as the land consumption per capita rate (LCPC) was used to analyse the efficiency of urban detailed land use. The data source of the LCPC indicator is the same as that of the LCRPGR, which is the built-up area and population data. This study calculated LCPC for expanded built-up areas and existing built-up areas, as well as the LCPC rate, to reflect the efficiency of urban land use. Based on the LCRPGR analysis of overall urban land-use efficiency, LCPC was used to provide a more detailed explanation of the link between population change and land consumption in the expanded built-up areas versus the existing built-up areas.
This study used spatial and statistical data to calculate the SDG 11.3.1 indicator for cities along the Belt and Road and calculated the LCPC for expanded built-up areas and existing built-up areas based on the changes in LCRPGR during the 2010–2015 and 2015–2020 phases, aiming to reflect urban land-use efficiency in more detail. Section 2 describes the study area, data sources, processing procedures, and research methods; Section 3 introduces the results and analysis in detail; Section 4 provides the discussion; and finally, Section 5 summarises the full text.

2. Materials and Methods

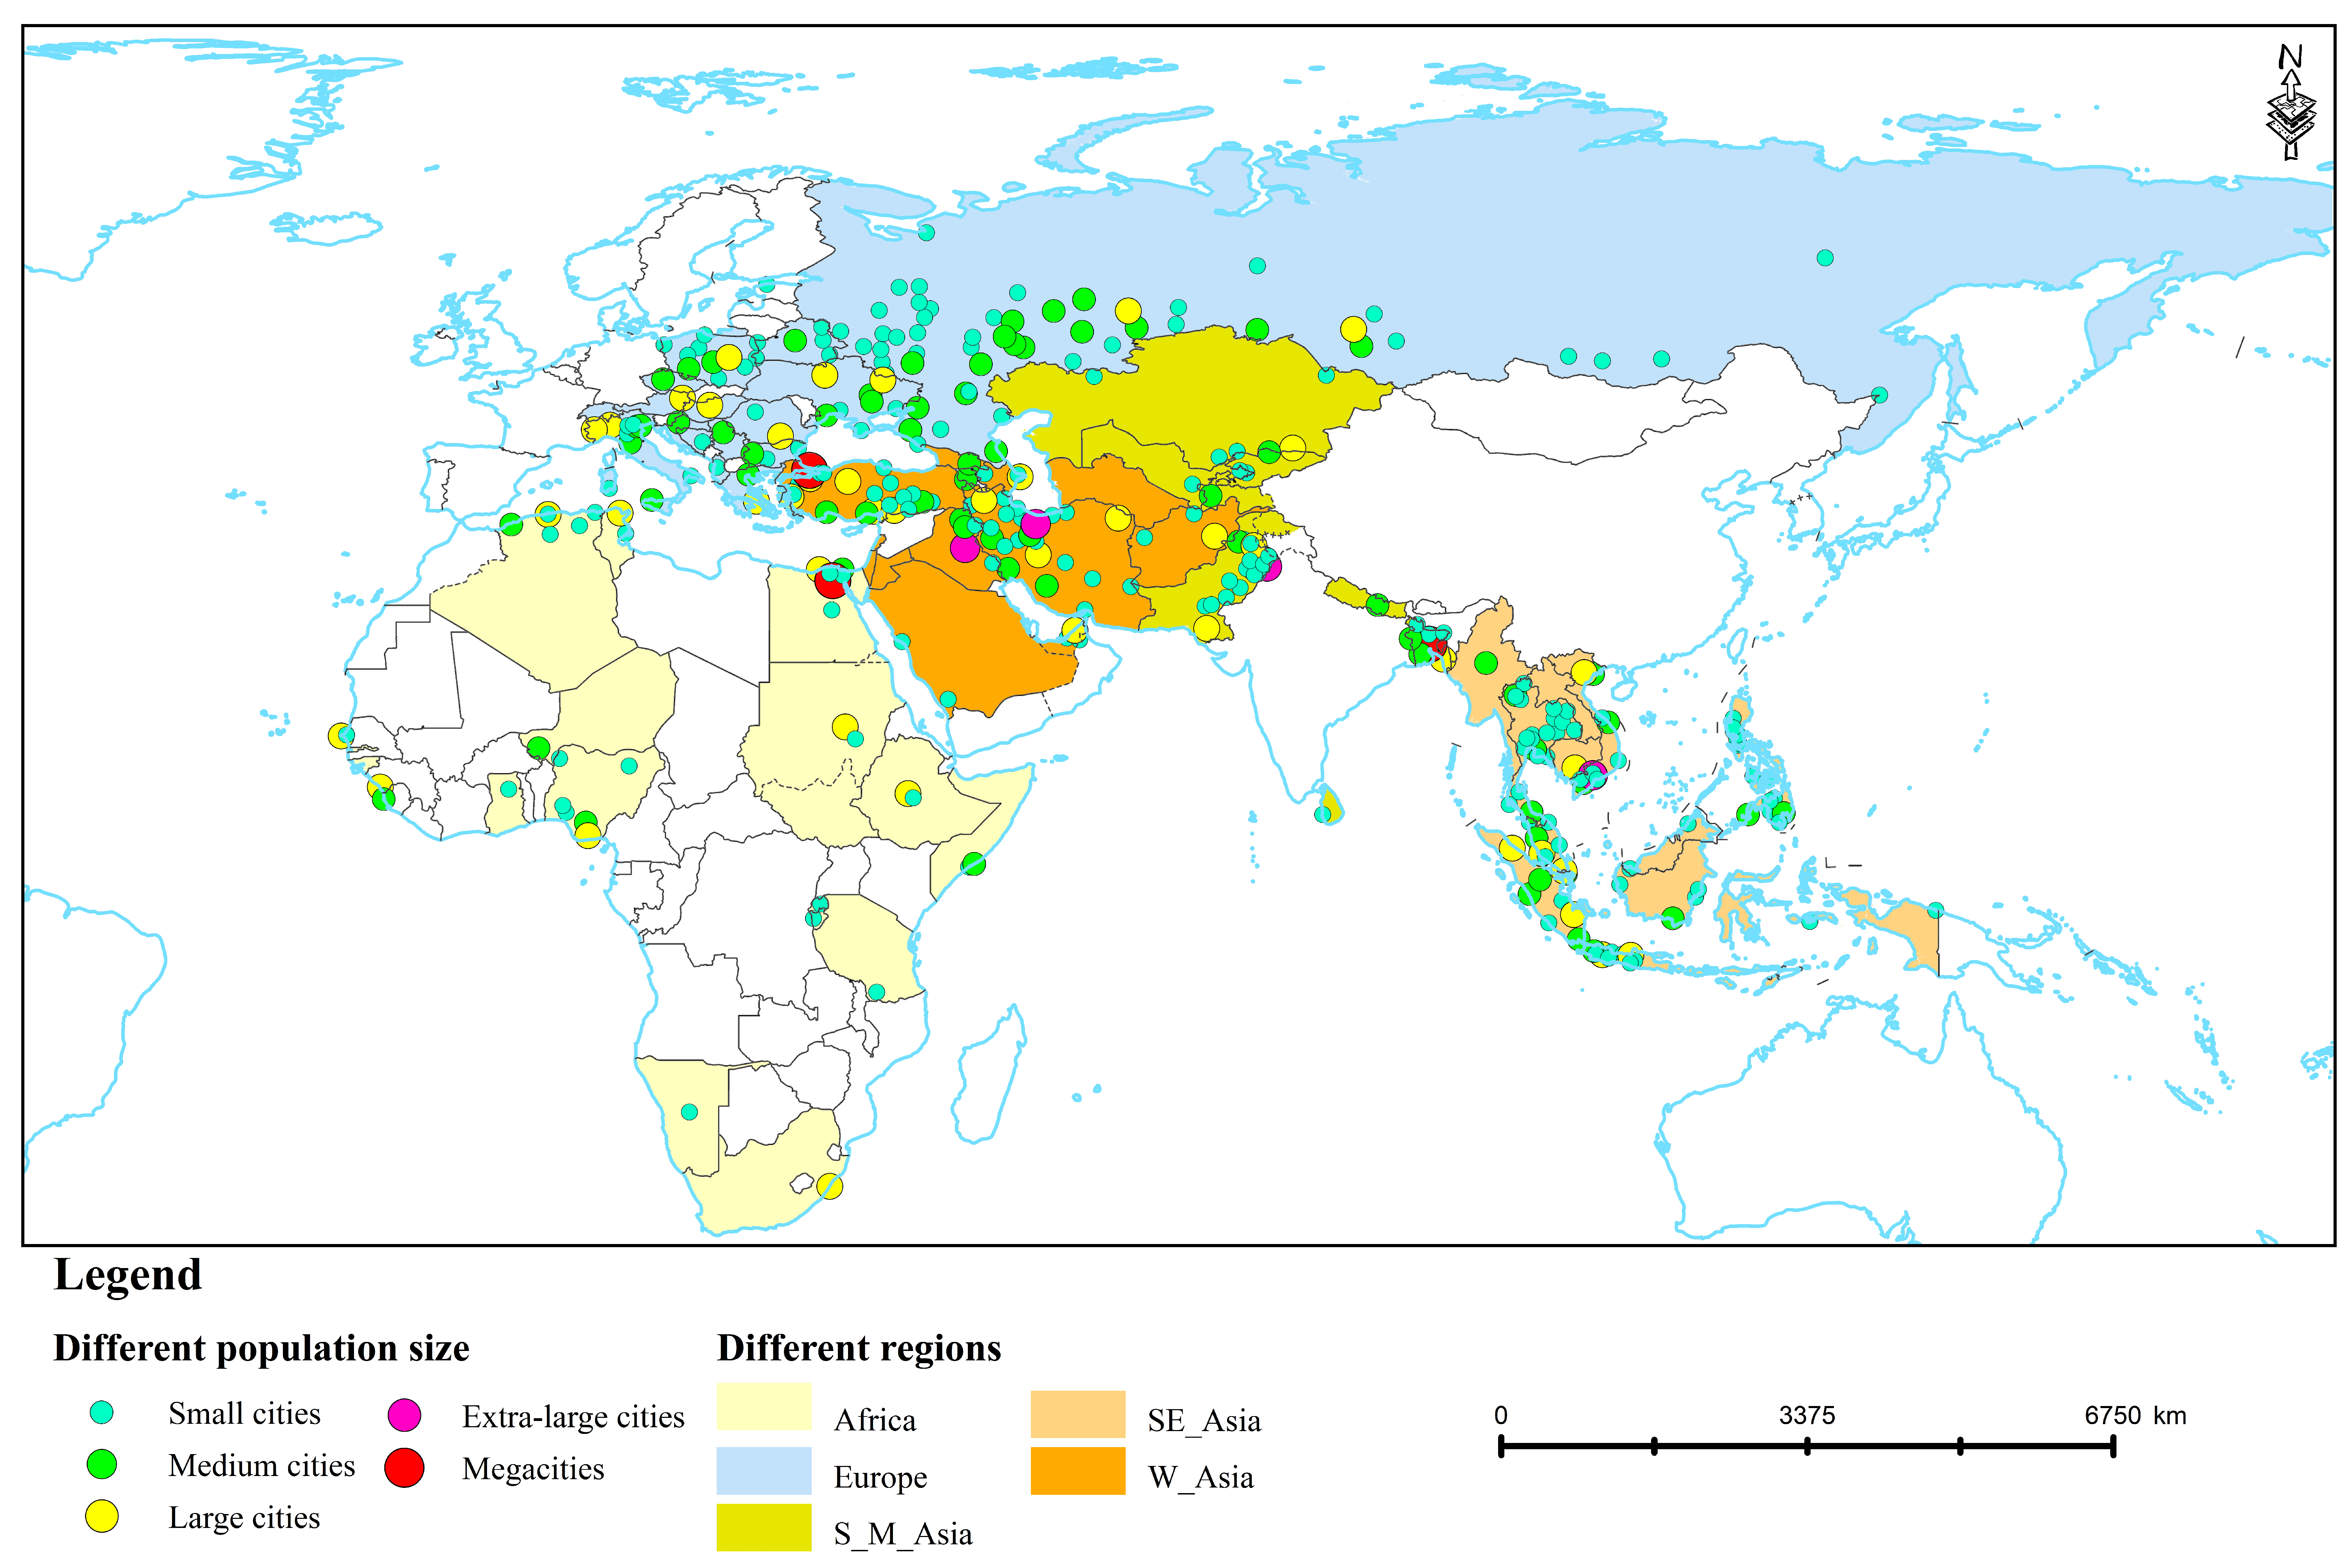
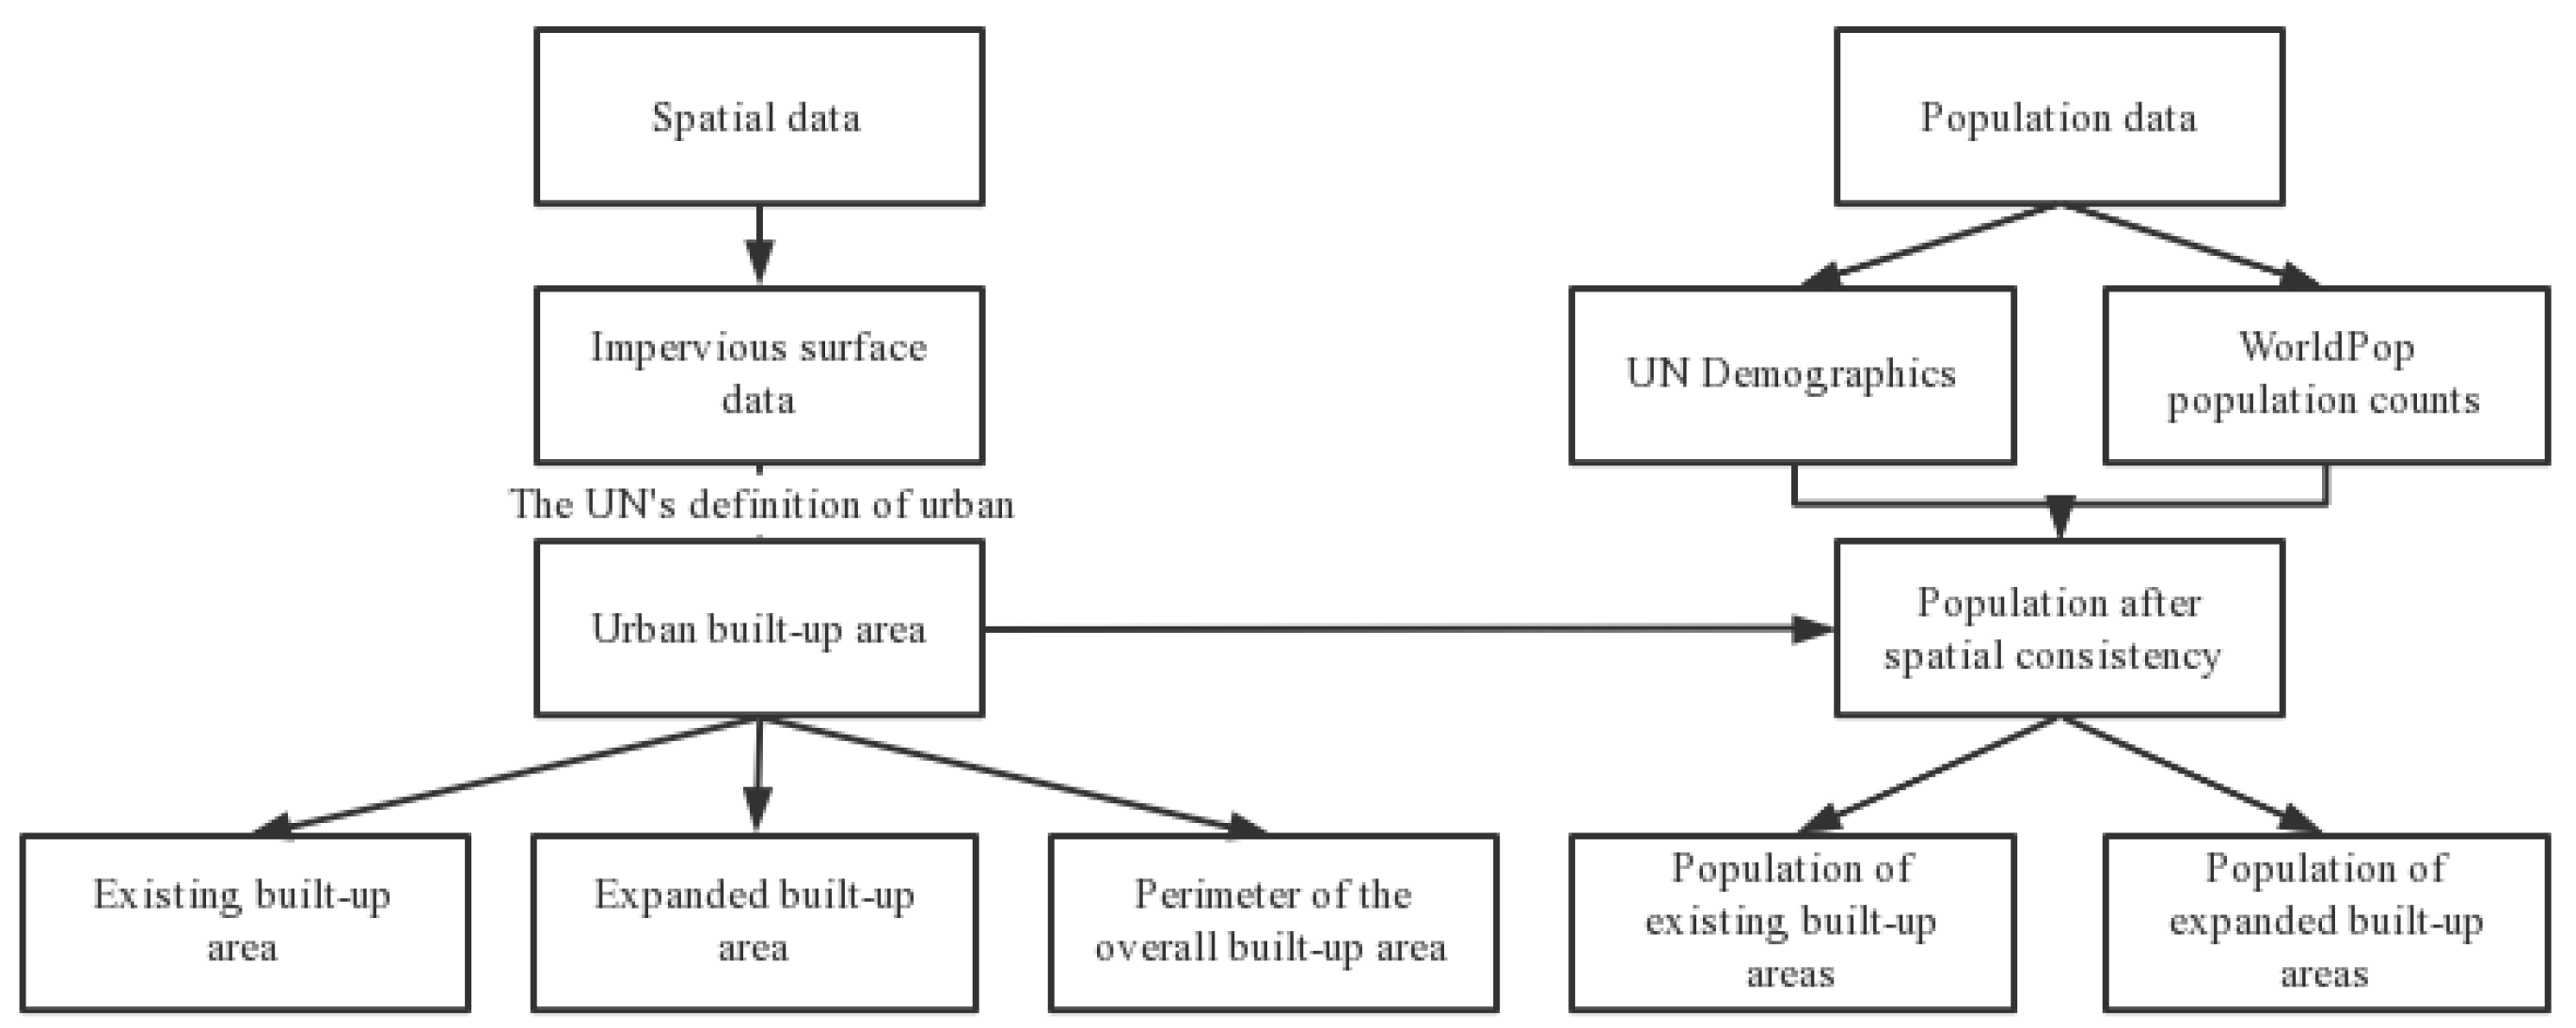
2.1. Study Area, Data, and Data Processing

This work focused on cities along the Belt and Road region connecting Asia, Europe, and Africa (Figure 1). The latitude and longitude of the study area are within 6° S–56° N, 4° E–121° E. The study area includes 338 cities within 58 countries and regions of Asia, Europe, and Africa.
The data used in this study mainly included basic geographic data, urban impervious surface data, and urban population data. The data for these cities were evaluated for the periods 2010–2015 and 2015–2020. The dataset of impervious surface data of cities was derived from the high-precision global urban impervious surface products of the Chinese Academy of Sciences big data platforms 2010 and 2015. This dataset uses Sentinel-1 synthetic aperture radar and Sentinel-2A optical image fusion to generate products, perform logical operations on the synthetic aperture radar data to determine the potential urban impervious surface, and calculate the maximum normalised vegetation difference index and the corrected normalised water index; then, the dataset passes the threshold to obtain the preliminary extraction result of the impervious surface and obtain the final impervious surface extraction result after mode filtering (3 × 3) [31]. The results of impervious surface data for cities in 2020 were acquired according to the method of dataset production [31]. The urban population data used in this study were obtained from the document called ‘World Urbanisation Prospects: The 2018 Revision’, distributed by the UN Department for Economic and Social Affairs, which issues periodical updates of the World Urbanisation Prospects based on a national report [32].
The transformation of urban built-up areas is based on a document issued by the UN Human Settlements Programme [33]. The document defines urban built-up areas into three categories: (1) Delimitation of built-up density. For this, the areas are divided into urban centres, suburbs, and rural areas. Mudau et al. [19] used walking distance as a filter to extract urban centres (greater than 50%), suburbs (25–50%), and rural areas (less than 25%) to obtain the built-up areas based on this definition. (2) Definition of urban areas, taking into account size and distance. For this, areas of urban land of 20 or more hectares that are less than 200 m apart are linked to form a continuous urban area. (3) Minimum functional relationships between urban land and the city. For this, some independent settlements are considered because they are located outside the urban area together with the surrounding rural land and omit the conversion of built-up areas. Therefore, according to the UN recommendations, this study used the second definition criterion to convert the impervious surface of cities into a dataset of built-up areas.
Due to the spatial inconsistency between UN demographic data and WorldPop 100 m grid data, this study employed the heterogeneity of the 100 m grid population data to rasterise the UN demographic data in the city, thereby generating consistency between the WorldPop data and the statistical data at the city scale. Figure 2 presents a flowchart of the major procedure for processing spatial and attribute data.

2.2. Methods

According to the metadata repository (https://unstats.un.org/sdgs/metadata (accessed on 15 August 2021)), the formula to calculate the SDG 11.3.1 indicator is expressed as follows:
LCRPGR = L C R P G R = Ln ( U r b t + n / U r b t ) Ln ( P o p t + n / P o p t )
where Urbt and Urbt+n indicate the initial and final stages of urban built-up areas in km2, and Popt and Popt+n represent the initial and final phases of urban population statistics, respectively.
Compactness is an index that describes the change in the degree of compactness of the spatial form in the process of urban expansion [34,35]. This can be expressed as follows:
  C = 2 π A P
where C is the compactness of the city, A is the built-up area of the city, and P is the perimeter of the built-up area of the city. The greater the value of compactness, the more complex the city boundary and the more compact the city.
The urban sprawl speed refers to the annual expansion rate of the built-up area at different measurement periods. Its formula is as follows:
S = ( A t 2 A t 1 ) t 2 t 1
where t1 and t2 are the years of the first and last phases of the built-up area, respectively, and At1 and At2 are the urban built-up areas corresponding to t1 and t2, respectively.
Urban sprawl intensity refers to the extent of expansion of the built-up area at different times during the entire study period [35,36,37,38,39,40]. Its formula is as follows:
I = A t 2 A t 1 A t 1 × T × 100 %
where At1 and At2 are the urban built-up areas corresponding to t1 and t2, respectively, and T represents the time interval between t1 and t2.
The LCPC indicates how much space each person in the built-up area is using at a given time. It aids in understanding changes inside the city and is a UN-recommended subsidiary decomposition indicator [35]. This indicator is closely related to the concept of residential land, which includes housing, infrastructure, and services supported by it (such as education, health, culture, welfare, entertainment, and catering). The LCPC can be expressed as follows:
LCPC = U r b t P o p t
where Urbt indicates the initial and final stages of urban built-up areas in km2, and Popt represents the initial phases of urban population statistics.

3. Results

In this study, LCRPGR values were calculated for 338 cities along the Belt and Road. To make a regional comparison, the cities along the Belt and Road were grouped into West Asia (W Asia), Europe (EUR), South Asia and Middle Asia (SM Asia), Southeast Asia (SE Asia), and Africa (Africa) based on the UN worldwide geographic division. To clarify the status of urban land use in different urban sizes, all cities were divided into five categories as follows: (1) megacities: >10,000,000 population; (2) extra-large cities: 5,000,000–10,000,000 population; (3) large cities: 1,000,000–5,000,000 population; (4) medium cities: 500,000–1,000,000 population; and (5) small cities: <500,000 population, based on the urban population division criteria [41]. The city numbers at each level of urban size and each geographical division are presented in Table 1 and Table 2.

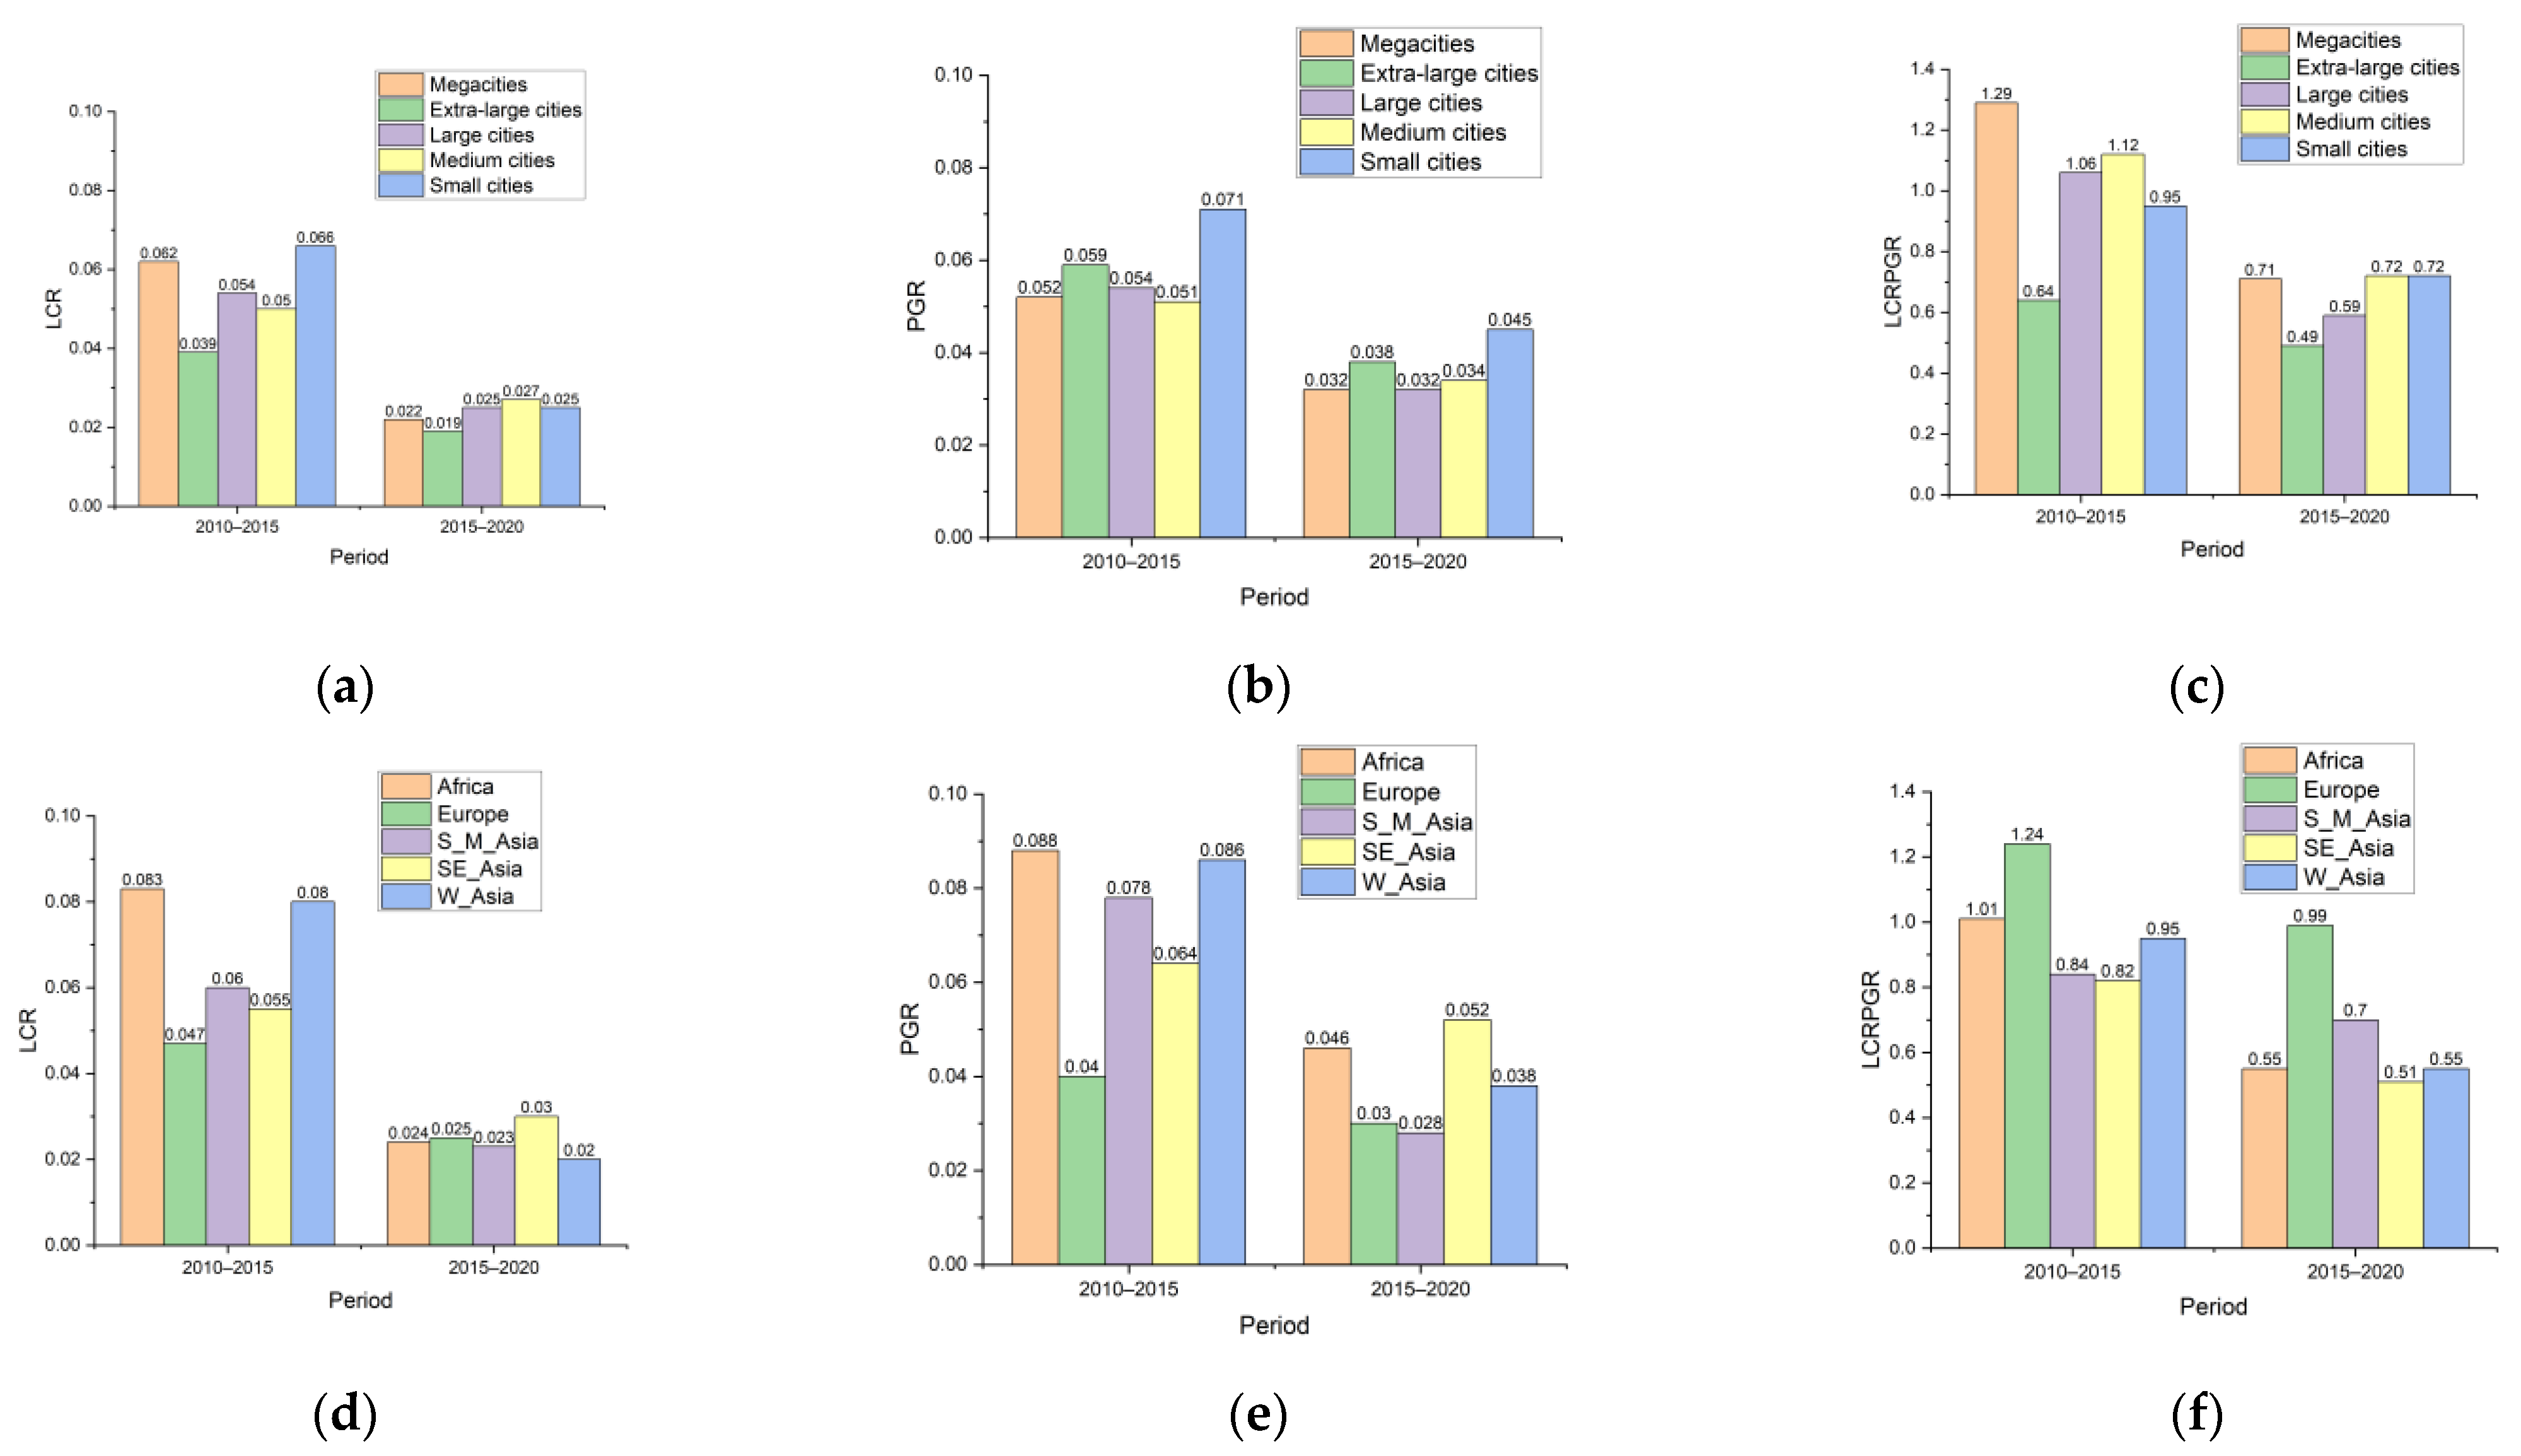
3.1. Results from the LCRPGR along the Study Area

To understand the results, it should be noted that due to the differences in space and uneven distribution of cities, there are certain differences in the number of cities in each region. For example, Africa has the lowest number of cities in the region, 37. Moreover, there are large differences in the number of cities with different urban population sizes. Among them, the number of megacities and extra-large cities is relatively small, with only three and four, respectively. This is mainly caused by the fact that there are rare megacities or extra-large cities in the study area. The number of cities of other size categories was large enough to allow for statistical analysis. The mean values of LCR, PGR, and LCRPGR in the two measurement periods were obtained for different sizes and urban geographical regions (Figure 3).
It can be seen from Figure 3 that the LCRPGR values were lower in 2020 than in 2015, both for different regions and urban sizes. In the entire study area, the average LCRPGR value for the period 2010–2015 was 1.01, while it changed to 0.71 for 2015–2020, indicating a declining trend in the overall urban land consumption in the study area. Theoretically, a reasonable LCRPGR value should be equal to or close to 1 [42], indicating a balance between urban land-use consumption and population growth. This study shows that there are two types of change trends from the measurement periods 2010–2015 to 2015–2020: One is that the 2015–2020 LCRPGR value is closer to the ideal value of 1 than the 2010–2015 value, meaning that the urban land-use efficiency was improved. The second is that the 2010–2015 LCRPGR value is closer to the ideal value of 1 than the 2015–2020 value, which means that the urban land-use efficiency has declined. A detailed explanation is provided in Table 3.
Based on this definition, there are 109 and 229 cities with an improved and declining trend, respectively, in the overall urban land-use efficiency. Geographically, 81.8% of cities have a declining trend in West Asia, while there are relatively few cities in Europe whose overall land-use efficiency has declined, accounting for only 47.2% of the total European cities. Because the number of megacities and extra-large cities is small, they were not included in this work. Most small cities showed reduced urban land-use efficiency, accounting for 70.4% of the total number of small cities. The detailed LCRPGR change trend information is presented in Table 1 and Table 2.

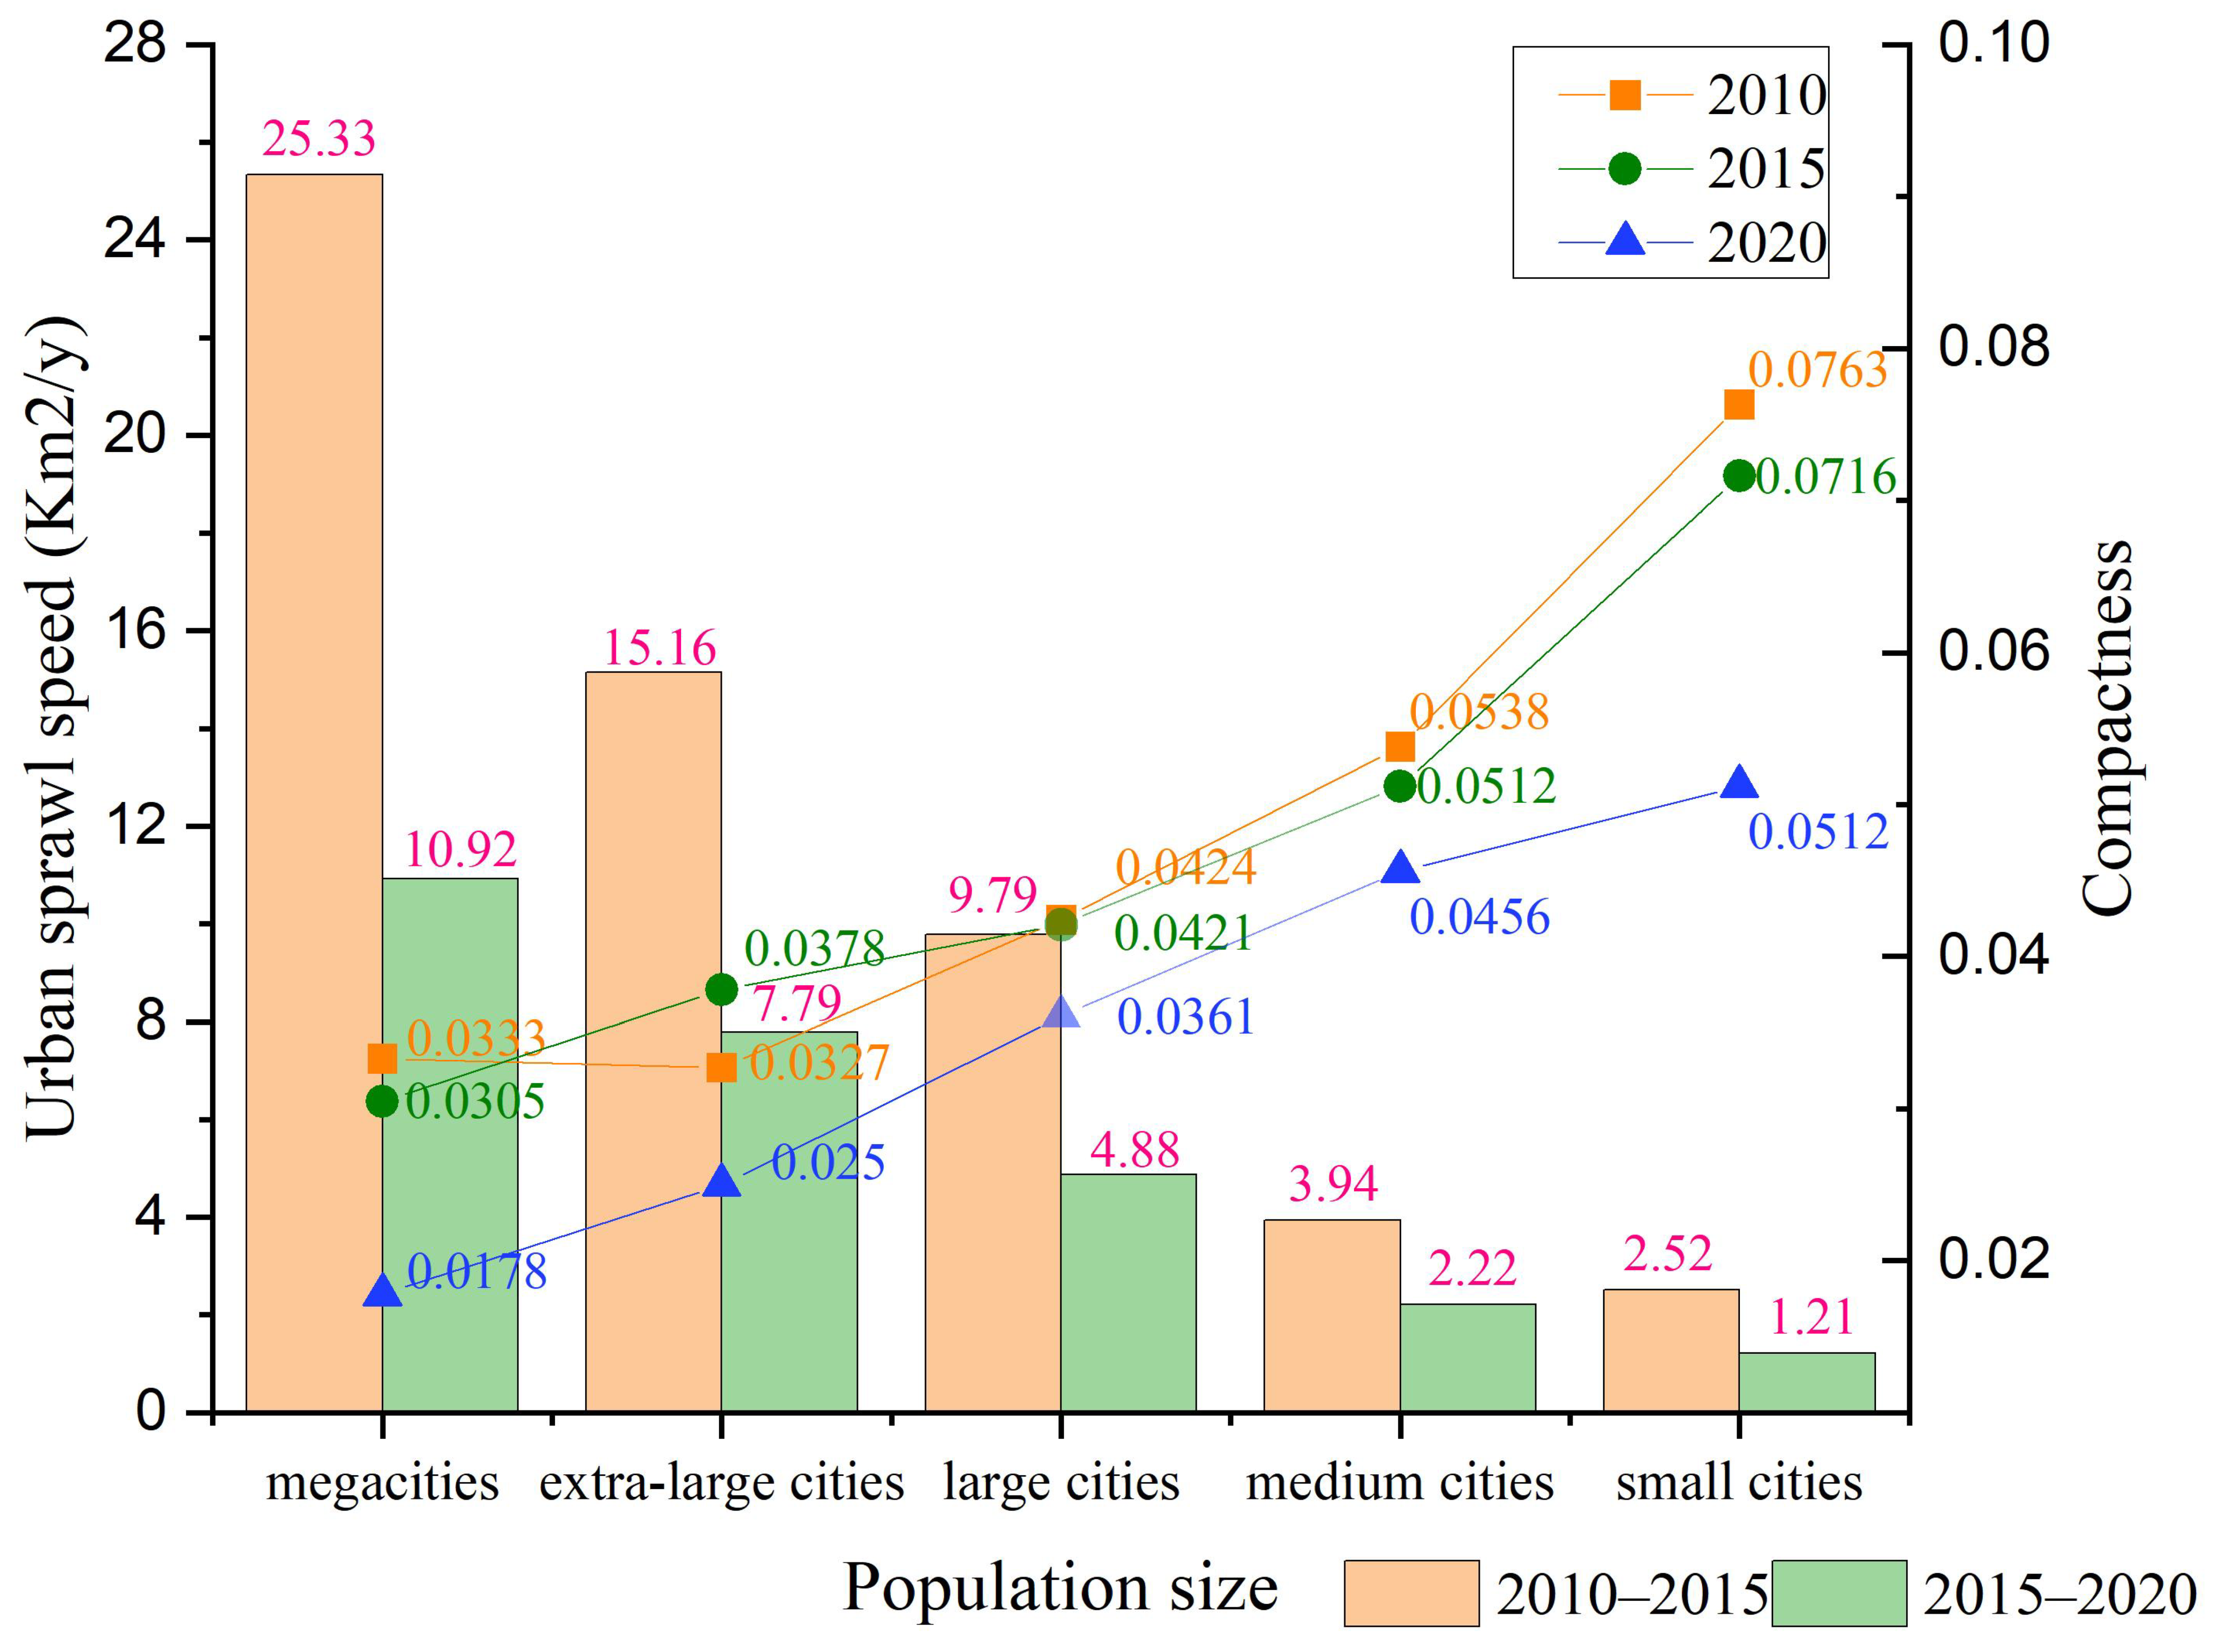
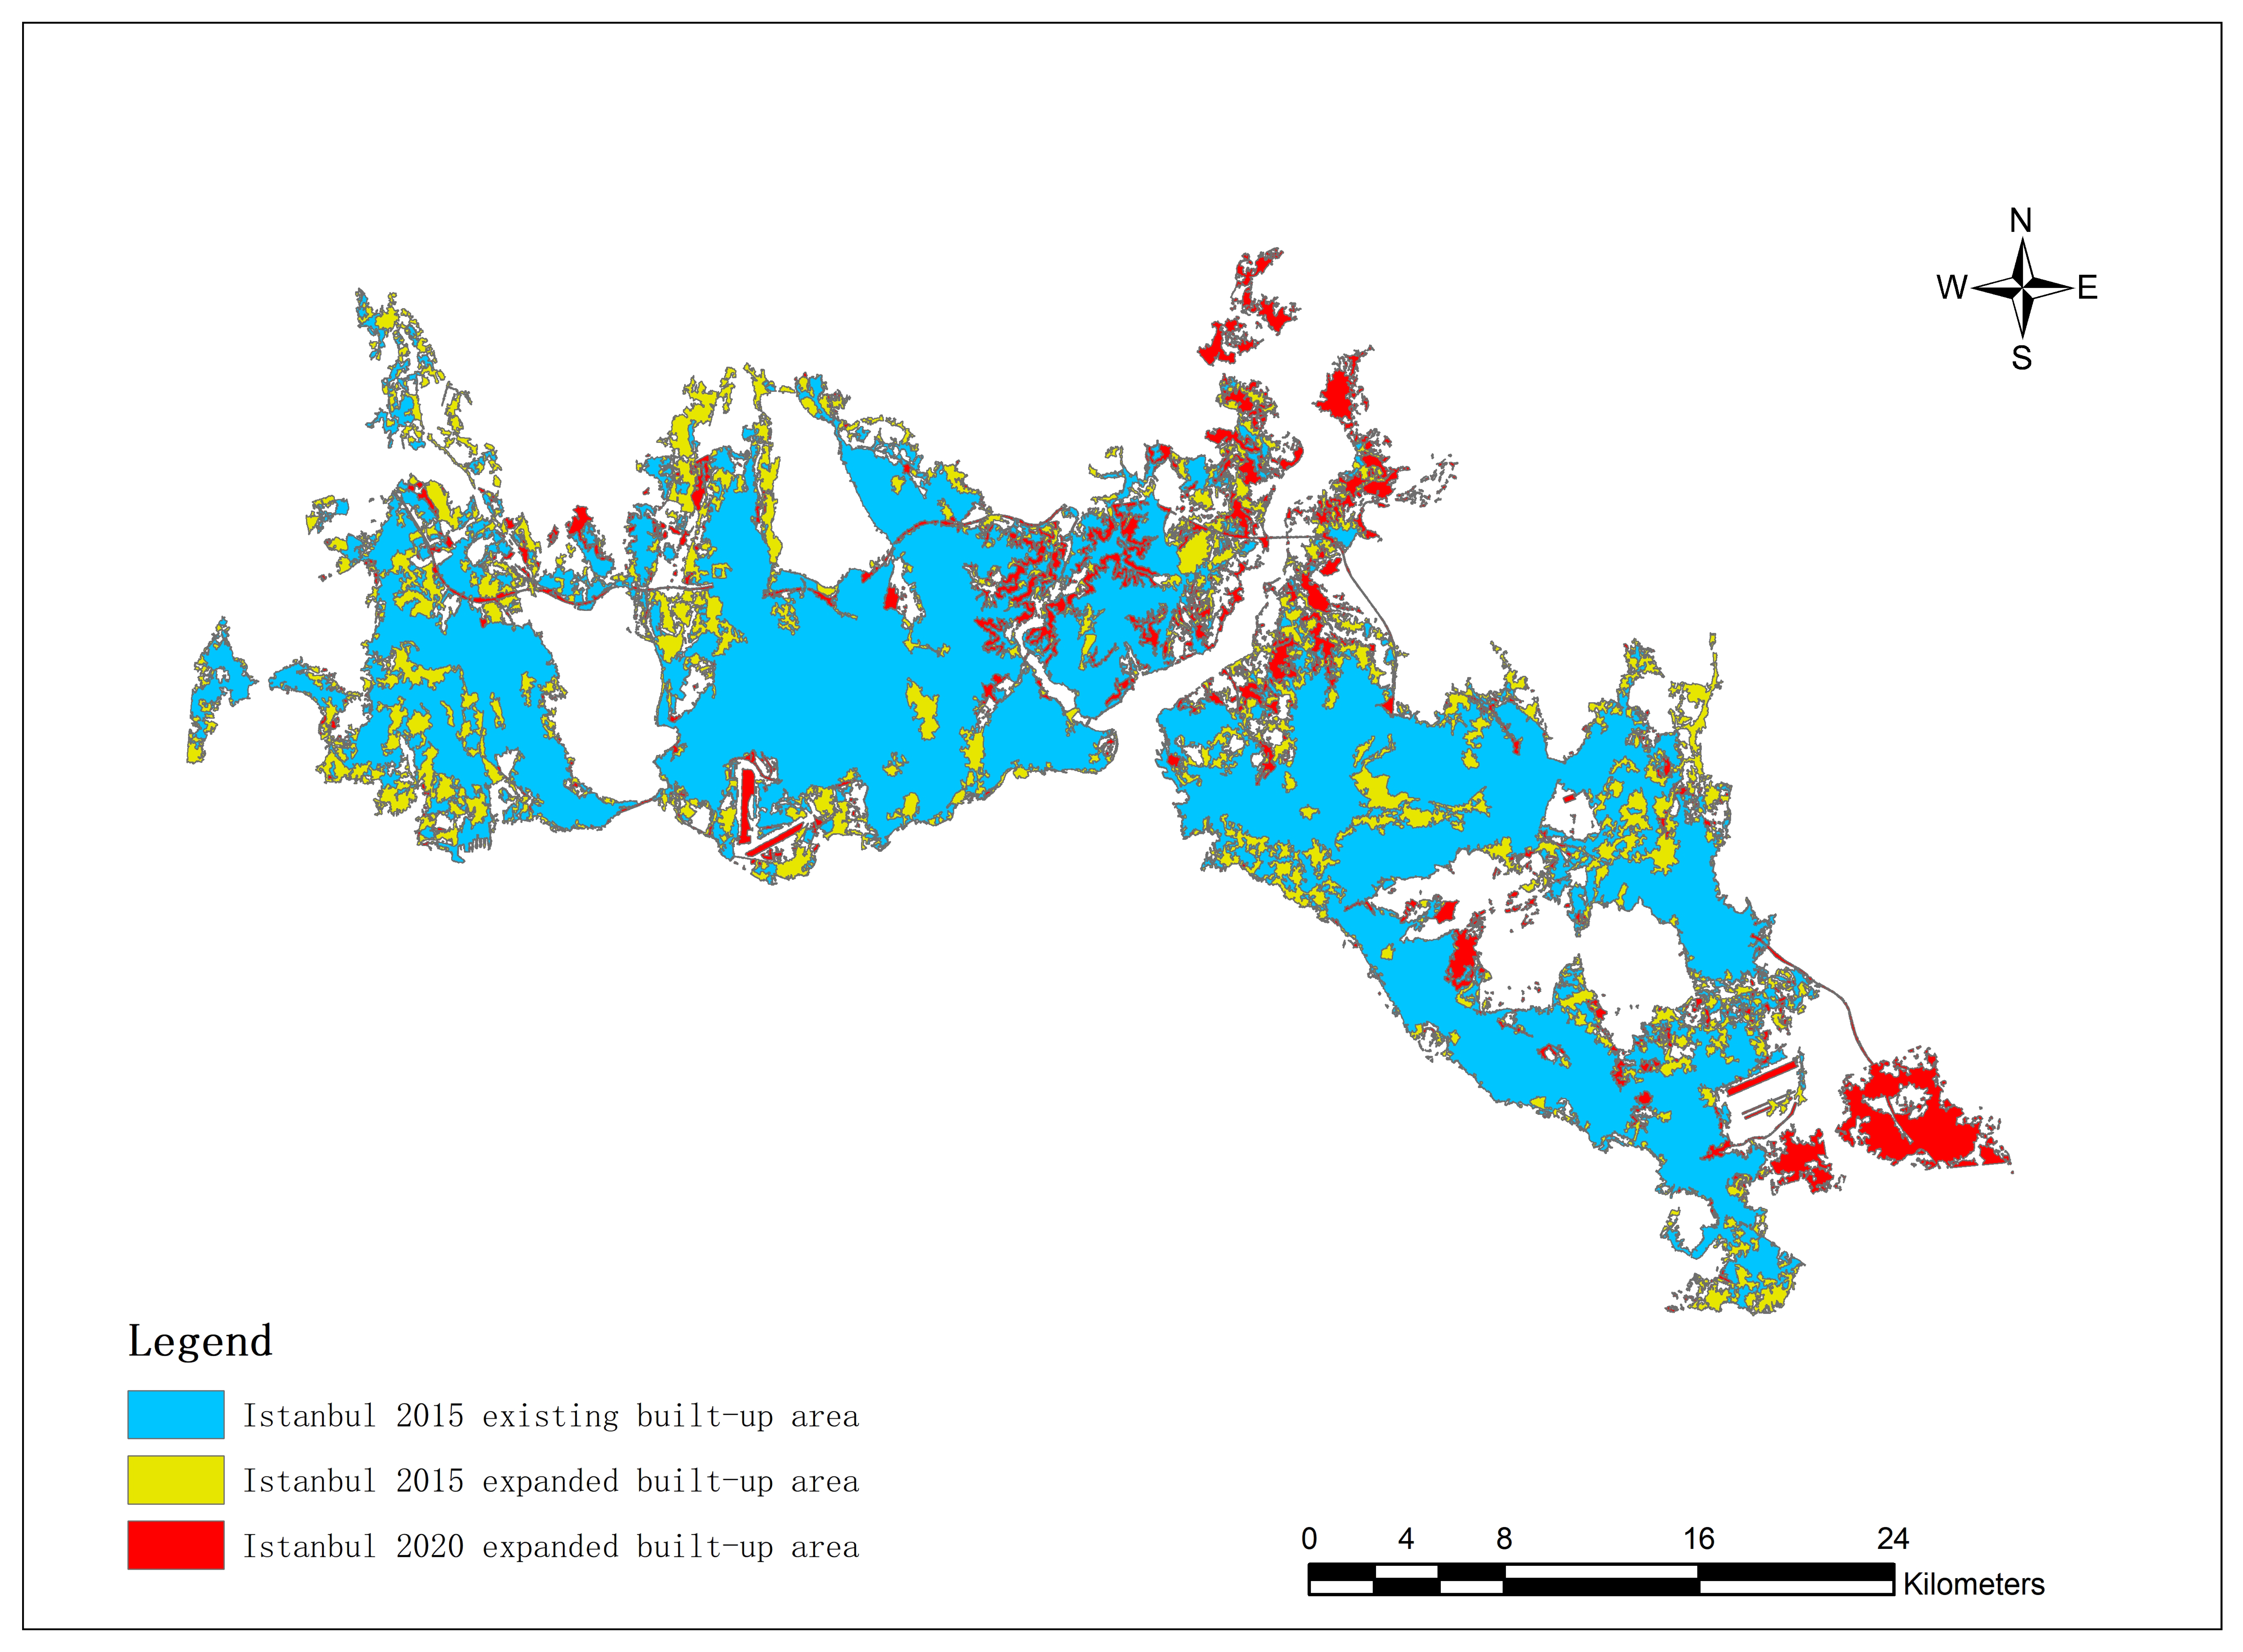
3.2. Changes in the Overall Urban Built-Up Area in Different Urban Scales

The efficiency of urban land use is closely related to urban built-up areas and population changes. Research on changes in urban built-up areas can better analyse the model of urban development. It can be helpful in making more rational use of land resources and improving the effectiveness of urban management [43]. The results of the urban sprawl speed and compactness of cities with different populations in the study area are shown in Figure 4.
Figure 4 shows that the urban sprawl speed of megacities reached 25.33 and 10.92 km2/y for the periods 2010–2015 and 2015–2020, respectively, while the expansion speeds of small cities were 2.52 and 1.21 km2/y for the same periods, respectively. As the urban size decreased, the urban sprawl speed also decreased, indicating that the rate of urban area expansion has slowed down. At the same time, the urban compactness increased, indicating that the city perimeter has decreased and the urban boundaries have become relatively smoother. This demonstrates that with the decline in urban size, the expanded urban built-up area has become less compact. Among the cities with different urban sizes, megacities had the highest urban sprawl speed and the smallest compactness, which indicates that the megacities have relatively high land-use efficiency.
In addition, we can see from Figure 4 that the urban sprawl speed for each urban size city showed a declining trend between the periods 2010–2015 and 2015–2020. This indicates that the expansion speed and intensity of urban built-up areas have slowed down. Similar to the urban sprawl speed, compactness also presented a downward trend. These results indicate that the overall urban land consumption has declined between 2010–2015 and 2015–2020, which is consistent with the results from the LCRPGR analysis.

3.3. LCPC Added Analysis for Cities with a Declined Trend in Urban Land Use

3.3.1. Overall Analysis of LCPC

The UN’s LCRPGR model is a simple ratio reflecting the relationship between urban land consumption and population growth from the perspective of a whole city; however, it cannot explain how a city becomes too crowded or sparse in urban land use, nor can it explain why some of the LCRPGR values are negative [19]. Therefore, this study divided urban built-up areas into two parts: existing built-up areas and expanded built-up areas. The secondary indicator, LCPC, was used to illustrate the efficiency of urban land use in different measurement periods. Figure 5 shows the division of existing built areas and expanded built areas.
The blue area shown in Figure 5 represents the total built-up area in 2010, regarded as the existing built-up region in 2015, while the yellow area represents the newly developed built-up area from 2010 to 2015, regarded as the expanded built-up area in 2015. Similarly, the red area represents the newly developed built-up area in 2020. This refinement of the overall built-up areas can provide a better perspective and a more detailed explanation in the analysis of urban land-use efficiency.
According to the results of the change trend of LCRPGR, cities with declining urban land-use efficiency were retained for further analysis. This analysis calculated the LCPC values of these cities and analysed LCPC from the viewpoint of the different geographic regions and urban sizes. The analysis is shown in Figure 6 and Figure 7.
Generally, from the viewpoints of both geographical regions and urban sizes, the LCPC values in the total built-up areas presented a downward trend from 2010 to 2015 to 2020, indicating that the LCPC rate of the cities has declined. This is consistent with the trend of the average LCRPGR. The LCPC values in the newly developed built-up areas were greater than those of the existing built-up regions, indicating that the urban land use in the expansion built-up region is less efficient than that in the existing built-up region. Further, the LCPC in the expansion built-up region presented a decreasing trend for 2015–2020, which indicates that the urban land use in the newly developed regions changed to better land-use efficiency. Additionally, as urban size increased, the LCPC values in the entire built-up region showed an increasing trend. This means that megacities have the best urban land-use efficiency, while small cities have the worst land-use efficiency.

3.3.2. Analysis of LCPC in the Expanded Built-Up Area

In Figure 6, we can see that the LCPC in the expanded built-up area in the European region in 2020 had a relatively large gap compared with that in 2015. This is because the European region contains cities with negative LCPC values in 2020 caused by population shrinkage. Some examples of this are listed in Table 4.
The table shows that the built-up area of these cities in 2025 subtracted from the built-up area in 2010 is negative, showing that the area of these cities is shrinking, and the negative value of individual cities has a negative effect on the average LCPC of the European region. This explains why the LCPC value of the expanded built-up area in 2020 was less than that of both the existing built-up area and total built-up area.
Figure 7 shows that there was a sharp decrease in LCPC values in the expanded built-up areas of small cities for 2015–2020. It was determined statistically that 80% of cities experienced a phenomenon in which the population growth rate was greater than the land expansion rate; therefore, the average LCPC of the expanded build-up area in 2020 was less than that of the expanded build-up area in 2015.

3.3.3. Analysis of LCPC in the Existing Built-Up Area

Figure 6 and Figure 7 show that the LCPC in the existing built-up regions from 2015 to 2020 is close to the value of LCPC in the total built-up area. This is because the population density of the built-up area has stabilised after five years of accumulation, and the change in the LCPC of the expanded built-up area is close to that of the total built-up area. The LCPC of the existing built-up area is lower than that of the total built-up area, but the LCPC of the existing built-up area in Europe in 2020 is greater than the overall LCPC. This is caused by the inconsistency between built-up area growth and population growth. Most European cities had larger urban land-use consumption compared with the PGR.
It can be seen in Figure 7 that the LCPC in the existing built-up area increased as the population size decreased. Since the size of the urban population has become smaller, this indicates that there are fewer residents in the city, yet the built-up region is still in a state of expansion, which led to the higher LCPC values in the smaller urban cities.

4. Discussion

Continuous global urbanisation has a significant impact on the efficiency of urban land use. As previously explained, the indicator SDG 11.3.1 reflects the efficiency of urban land use. Big Earth data provide powerful data support for evaluating the efficiency of urban land use on a regional scale. The LCRPGR results for 2015–2020 were generally lower than those from 2010–2015, meaning that the overall land-use efficiency has improved over time. This is supported by the results from compactness, urban sprawl speed, and urban sprawl intensity, which were consistent with the conclusions obtained from the LCRPGR statistics. In addition to the information on urban land, population is another key indicator in the evaluation of urban land-use efficiency. The dynamic population change will be detected and analysed for the selected sample cities in our next study.
The statistical results of the LCRPGR in the study area show that, for the periods 2010–2015 to 2015–2020, nearly two-thirds of the cities had values approaching the supposed ideal LCRPGR of 1 given by the UN report, while others had values that were not close to 1. This means that many cities are facing the problem of inefficient use of urban land, which can be expected to have a negative effect on urban sustainability. The LCRPGR value is meaningful in statistics because of the relatively large numbers of cities considered in this work, while the reason for some cities having a high level of land-use efficiency, while others did not, remains unclear. Therefore, future research should focus on a more detailed analysis of certain sample cities to discover the main reasons for this phenomenon.
The LCRPGR was designed to represent the urban land-use efficiency for the entire built-up region of a city and employs LCPC to examine the urban land-use efficiency in the existing and expanded built-up areas. This new method provides a novel approach for analysing the relationship between urban land-use consumption and population growth during the process of urbanisation. Although the indicator SDG 11.3.1 is mainly used to test the relationship between population growth and urban land consumption, there are many other factors affecting the efficiency of urban land use, such as urban building density, urban greening space, and urban population density. Therefore, these factors will be explored in our further research by employing high-resolution satellite images and a more detailed analysis.

5. Conclusions

Big Earth data enable a new method of detecting and analysing regional and worldwide developments from social, economic, and environmental standpoints. This study collected impervious surface data and population data to calculate the SDG 11.3.1 indicator, values of LCRPGR, for the two periods 2010–2015 and 2015–2020 and calculated the overall compactness, urban sprawl speed, and urban sprawl intensity of the city. In addition to LCRPGR, a secondary indicator, LCPC, was added to assist in the analysis of the land-use efficiency of cities in the study area. The following results were obtained:
  • The LCRPGR values for 2015–2020 were generally lower than those from 2010–2015, indicating that overall land-use consumption had a downward trend. In addition, the urban sprawl speed and the urban sprawl intensity in 2020 were lower than those in 2015, while the growth of urban built-up areas slowed down, and the degree of compactness decreased over the years. These findings support the improvement of urban land-use efficiency in the study area for the measurement periods 2010–2015 to 2015–2020.
  • With the reasonable LCRPGR value being 1, only one-third of the cities improved land-use efficiency for the periods 2010–2015 and 2015–2020. This means that many cities are facing the problem of inefficient use of urban land, either with relatively larger or smaller urban land consumption compared with the PGR.
  • The mean LCPC values were calculated for cities with improved land-use efficiency. Regardless of geographical region or urban size, the LCPC values in the expanded built-up areas were higher than those of the existing built-up areas, demonstrating that the efficiency of urban land use in expanded built-up areas is lower than that of existing built-up areas. From 2010 to 2015 to 2020, the LCPC values in the expansion built-up regions showed a decreasing trend, which indicates that urban land use has become more efficient. This can be expected to have a positive impact on urban sustainability development. In addition, as the urban size decreased, the LCPC increased. This means that we need to pay more attention to the sustainable development of small-sized urban cities.

Author Contributions

Conceptualization, C.L. and G.C.; methodology, C.L.; validation, C.L., G.C. and Z.S.; formal analysis, C.L.; resources, Z.S.; data curation, C.L.; writing—original draft preparation, C.L.; writing—review and editing, G.C. and Z.S.; supervision, G.C.; project administration, Z.S.; funding acquisition, Z.S. All authors have read and agreed to the published version of the manuscript.

Funding

This research was funded by the Key R&D Program Projects in Hainan Province (grant number ZDYF2020192).

Conflicts of Interest

The authors declare no conflict of interest.

References

  1. United Nations. Sustainable Development Goals. Available online: https://www.undp.org/sustainable-development-goals (accessed on 15 August 2021).
  2. Global Platform for Sustainable Cities. Urban sustainability framework. In Urban Sustainability Framework; International Bank for Reconstruction and Development/The World Bank: Washington DC, USA, 2018. [Google Scholar] [CrossRef] [Green Version]
  3. Wang, P.; Shao, Z.; Wang, J.; Wu, Q. The impact of land finance on urban land use efficiency: A panel threshold model for Chinese provinces. Growth Chang. 2020, 52, 310–331. [Google Scholar] [CrossRef]
  4. Wang, S.; Cebula, R.J.; Liu, X.; Foley, M. Housing prices and urban land use efficiency. Appl. Econ. Lett. 2021, 28, 1121–1124. [Google Scholar] [CrossRef]
  5. Cui, F.; Hamdi, R.; Yuan, X.; He, H.; Yang, T.; Kuang, W.; Termonia, P.; De Maeyer, P. Quantifying the response of surface urban heat island to urban greening in global north megacities. Sci. Total Environ. 2021, 801, 149553. [Google Scholar] [CrossRef] [PubMed]
  6. Liu, C.; Han, W.; Cai, Y.; Wen, Q.; Kong, K.; Guan, W. Spatial distribution and influencing factors of CO2 concentration near the ground in Korla. Environ. Sci. Technol. 2020, 4, 79–86. [Google Scholar]
  7. Dadi, D.; Azadi, H.; Senbeta, F.; Abebe, K.; Taheri, F.; Stellmacher, T. Urban sprawl and its impacts on land use change in Central Ethiopia. Urban For. Urban Green. 2016, 16, 132–141. [Google Scholar] [CrossRef]
  8. World Bank. Vietnam’s urbanization at a Crossroads: Embarking on an efficient, inclusive, and resilient pathway. In Vietnam’s Urbanization at a Crossroads; 2020; Available online: https://openknowledge.worldbank.org/handle/10986/34761 (accessed on 4 December 2021).
  9. United Nations Development Programme. What Are the Sustainable Development Goals. Available online: https://www.undp.org/content/undp/en/home/sustainable-development-goals.html (accessed on 15 August 2019).
  10. United Nations. Human Settlements Programme (UN-HABITAT). Urbanization and Development: Emerging Futures; (No. HS/038/16E); UN-Habitat: Nairobi, Kenya, 2016. [Google Scholar]
  11. UN-Habitat. SDG Indicator 11.3.1 Training Module: Land Use Efficiency; UN-Habitat: Nairobi, Kenya, 2018. [Google Scholar]
  12. Parnell, S. Defining a global urban development agenda. World Dev. 2016, 78, 529–540. [Google Scholar] [CrossRef]
  13. Akuraju, V.; Pradhan, P.; Haase, D.; Kropp, J.P.; Rybski, D. Relating SDG11 indicators and urban scaling—An exploratory study. Sustain. Cities Soc. 2020, 52, 101853. [Google Scholar] [CrossRef]
  14. UN-Habitat. Metadata on SDGs indicator 11.3.1 Indicator category: Tier II. Metadata on SDG Indicator 11.3.1. 2019. Available online: https://unhabitat.org/wp-content/uploads/2019/04/Metadata-on-SDG-Indicator-11.3.1.pdf (accessed on 10 May 2019).
  15. UK Office for National Statistics. Using Innovative Methods to Report against the Sustainable Development Goals 2018. Available online: https://www.ons.gov.uk/economy/environmentalaccounts/articles/usinginnovativemethodstoreportagainstthesustainabledevelopmentgoals/2018-10-22 (accessed on 1 December 2018).
  16. Zhang, L.; Zhang, L.; Xu, Y.; Zhou, P.; Yeh, C.-H. Evaluating urban land use efficiency with interacting criteria: An empirical study of cities in Jiangsu China. Land Use Policy 2020, 90, 104292. Available online: https://linkinghub.elsevier.com/retrieve/pii/S0264837719303886 (accessed on 15 August 2021). [CrossRef]
  17. United Nations. The Sustainable Development Goals Report; United Nations: New York, NY, USA, 2016; Available online: https://www.un.org/development/desa/publications/sustainable-development-goals-.report-2016.html (accessed on 2 March 2019).
  18. The Sustainable Development Goals Report 2020; United Nations: New York, NY, USA, 2020.
  19. Mudau, N.; Mwaniki, D.; Tsoeleng, L.; Mashalane, M.; Beguy, D.; Ndugwa, R. Assessment of SDG Indicator 11.3. 1 and Urban Growth Trends of Major and Small Cities in South Africa. Sustainability 2020, 12, 7063. [Google Scholar] [CrossRef]
  20. Koroso, N.H.; Zevenbergen, J.A.; Lengoiboni, M. Urban land use efficiency in Ethiopia: An assessment of urban land use sustainability in Addis Ababa. Land Use Policy 2020, 99, 105081. [Google Scholar] [CrossRef]
  21. Ghazaryan, G.; Rienow, A.; Oldenburg, C.; Thonfeld, F.; Trampnau, B.; Sticksel, S.; Jürgens, C. Monitoring of Urban Sprawl and Densification Processes in Western Germany in the Light of SDG Indicator 11.3.1 Based on an Automated Retrospective Classification Approach. Remote Sens. 2021, 13, 1694. [Google Scholar] [CrossRef]
  22. Li, C.; Cai, G.; Du, M. Big Data Supported the Identification of Urban Land Efficiency in Eurasia by Indicator SDG 11.3.1. ISPRS Int. J. Geo-Inf. 2021, 10, 64. [Google Scholar] [CrossRef]
  23. Laituri, M.; Davis, D.; Sternlieb, F.; Galvin, K. SDG Indicator 11.3.1 and Secondary Cities: An Analysis and Assessment. ISPRS Int. J. Geo-Inf. 2021, 10, 713. [Google Scholar] [CrossRef]
  24. Melchiorri, M.; Pesaresi, M.; Florczyk, J.A.; Corbane, C.; Kemper, T. Principles and Applications of the Global Human Settlement Layer as Baseline for the Land Use Efficiency Indicator—SDG 11.3.1. ISPRS Int. J. Geo Inf. 2019, 8, 96. [Google Scholar] [CrossRef] [Green Version]
  25. Wang, Y.; Huang, C.; Feng, Y.; Zhao, M.; Gu, J. Using Earth Observation for Monitoring SDG 11.3.1-Ratio of Land Consumption Rate to Population Growth Rate in Mainland China. Remote Sens. 2020, 12, 357. [Google Scholar] [CrossRef] [Green Version]
  26. Schiavina, M.; Melchiorri, M.; Corbane, C.; Florczyk, A.J.; Freire, S.; Pesaresi, M.; Kemper, T. Multi-Scale Estimation of Land Use Efficiency (SDG 11.3.1) across 25 Years Using Global Open and Free Data. Sustainability 2019, 11, 5674. [Google Scholar] [CrossRef] [Green Version]
  27. GHSL. Available online: https://ghslsys.jrc.ec.europa.eu/download.php?ds=smod (accessed on 15 August 2019).
  28. Jiang, H.; Sun, Z.; Guo, H.; Weng, Q.; Du, W.; Xing, Q.; Cai, G. An assessment of urbanization sustainability in China between 1990 and 2015 using land use efficiency indicators. NPJ Urban Sustain. 2021, 1, 34. [Google Scholar] [CrossRef]
  29. Wilson, B.; Chakraborty, A. The Environmental Impacts of Sprawl: Emergent Themes from the Past Decade of Planning Research. Sustainability 2013, 5, 3302–3327. [Google Scholar] [CrossRef] [Green Version]
  30. UN-Habitat. Metadata on SDG Indicator 11.3.1. 2021. Available online: https://unstats.un.org/sdgs/metadata/files/Metadata-11-03-01.pdf (accessed on 10 September 2021).
  31. Sun, Z.; Xu, R.; Du, W.; Wang, L.; Lu, D. High-Resolution Urban Land Mapping in China from Sentinel 1A/2 Imagery Based on Google Earth Engine. Remote Sens. 2019, 11, 752. [Google Scholar] [CrossRef] [Green Version]
  32. United Nations. Department of Economic and Social Affairs, Population. Division. World Urbanization Prospects: The 2018 Revision; United Nations: New York, NY, USA, 2018. [Google Scholar]
  33. UN-Habitat. SDG Goal 11 Monitoring Framework: A Guide to Assist National and Local Governments to Monitor and Report on SDG Goal 11+ Indicators; United Nations: New York, NY, USA, 2019. [Google Scholar]
  34. Shi, L.; Liu, F.; Zhang, Z.; Zhao, X.; Liu, B.; Xu, J.; Wen, Q.; Yi, L.; Hu, S. Spatial differences of coastal urban expansion in China from 1970s to 2013. Chin. Geogr. Sci. 2015, 25, 389–403. [Google Scholar] [CrossRef]
  35. Zhang, Y.; Yang, D.; Zhang, X.; Dong, W.; Zhang, X. Regional structure and spatial morphology characteristics of oasis urban agglomeration in arid area—A case of urban agglomeration in northern slope of Tianshan Mountains, Northwest China. Chin. Geogr. Sci. 2009, 19, 341. [Google Scholar] [CrossRef]
  36. Yan, M.; Huang, J. A Review of Research on Urban Spatial Expansion at Home and Abroad. Prog. Geogr. Sci. 2018, 16, 68–70. [Google Scholar]
  37. Meng, F.; Yin, C.; Meng, X.; Xiao, Q. Extraction of urban built-up areas by impervious surface concentration method. Remote Sens. Inf. 2020, 35, 8–15. [Google Scholar]
  38. Yu, X.; Li, Q.; Yang, C. Research on Remote Sensing Monitoring of Urban Spatial Expansion in the Main City of Chongqing. Geogr. Spat. Inf. 2013, 32, 1039–1050. [Google Scholar]
  39. Tian, L.; Li, Y.; Yan, Y.; Wang, B. Measuring urban sprawl and exploring the role planning plays: A shanghai case study. Land Use Policy 2017, 67, 426–435. [Google Scholar] [CrossRef]
  40. Knaap, G.-J.; Song, Y.; Ewing, R.; Clifton, K. Seeing the Elephant: Multi-Disciplinary Measures of Urban Sprawl; National Centre for Smart Growth Research and Education: Washington, DC, USA, 2005; pp. 10–11. [Google Scholar]
  41. Haldorson, M. Sweden Examples on 11.2.1, 11.3.1 and 11.7.1. In Proceedings of the International Seminar on United Nations Global Geospatial Information Management, Nairobi, Kenya, 7 December 2018. [Google Scholar]
  42. United Nations Human Settlements Program. Module 3: Land Consumption Rate. 2018. Available online: https://www.unescwa.org/sites/www.unescwa.org/files/u593/Module_3_land_consumption_edite586d_23-03-2018.pdf (accessed on 20 November 2018).
  43. Herold, M.; Scepan, J.; Clarke, K.C. The Use of Remote Sensing and Landscape Metrics to Describe Structures and Changes in Urban Land Uses. Environ. Plan. A Econ. Space 2002, 34, 1443–1458. [Google Scholar] [CrossRef] [Green Version]
Figure 1. Distribution of cities along the Belt and Road.
Sustainability 13 13518 g001
Figure 2. Data processing flowchart for urban built-up areas and population data.
Sustainability 13 13518 g002
Figure 3. The statistical mean values of LCR, PGR, and LCRPGR. (ac) are the average values of LCR, PGR, and LCRPGR of different city sizes in the study area from 2010–2015 to 2015–2020, respectively. (df) are the average values of LCR, PGR, and LCRPGR of different geographic regions in the study area from 2010–2015 to 2015–2020, respectively.
Sustainability 13 13518 g003
Figure 4. The urban sprawl speed and compactness of cities with different urban sizes.
Sustainability 13 13518 g004
Figure 5. Schematic diagram of urban expanded built-up areas and existing built-up areas.
Sustainability 13 13518 g005
Figure 6. Results of the land consumption per capita rate for each built-up area type in different geographic regions. LCPC_N, LCPC_R, and LCPC represent the LCPC rate in the newly developed built-up area, existing built-up area, and entire built-up area, respectively. Note: (ae) respectively represent Africa, Europe, South and Middle Asia, Southeast Asia, and West Asia.
Sustainability 13 13518 g006
Figure 7. Results of the LCPC rate for each built-up area type in different city sizes. LCPC_N, LCPC_R, and LCPC have the same meaning as in Figure 6. Note: (ae) respectively represent megacities, extra-large cities, large cities, medium cities, and small cities.
Sustainability 13 13518 g007
Table 1. The number of cities with different sizes in the study area and the percentage of the LCRPGR change trend.
City NumberLCRPGR↓LCRPGR↑
Megacities3
Extra-large cities4
Large cities4568.9%31.1%
Medium cities7358.9%41.1%
Small cities21270.4%29.6%
The Belt and Road338
In the table, LCRPGR↑ means that the value of LCRPGR is approaching 1, and LCRPGR↓ means that the value of LCRPGR is not close to 1.
Table 2. The number of cities of different regions in the study area and the proportion of the LCRPGR change trend.
City NumberLCRPGR↓LCRPGR↑
Africa3775.7%24.3%
EUR10647.2%52.8%
W_Asia6678.6%21.4%
S_M_Asia4281.8%18.2%
SE_Asia8773.6%26.4%
The Belt and Road338
In the table, LCRPGR means that the value of LCRPGR is approaching 1, and LCRPGR means that the value of LCRPGR is not close to 1. EUR = Europe, W_Asia = West Asia, S_M Asia = South and Middle Asia, SE_Asia = Southeast Asia.
Table 3. Types of changes in LCRPGR values from 2010–2015 to 2015–2020.
LCRPGR Change TrendInterpretationExampleMeaning
Close to 1The absolute value of the difference between the LCRPGR value and 1 for 2015–2020 is smaller than that for 2010–2015LCRPGR value for 2010–2015 is 2.19 then decreases to 1.22 for 2015–2020Improved land-use efficiency
Not close to 1The absolute value of the difference between the LCRPGR value and 1 for 2015–2020 is larger than that for 2010–2015LCRPGR value for 2010–2015 is 1.28 then increases to 1.92 for 2015–2020Declined land-use efficiency
Table 4. Negative LCPC values in the expanded built-up areas of European cities.
Country NameCity NameLCPC15_NLCPC20_NArea20-15Pop20-15LCPC_15LCPC_20
Russian FederationOrenburg229.04−3097.48−38.1320246.80 196.48122.45
Saudi ArabiaYanbu al Bahr286.29−58.07−2.0781168.20 259.69190.60
Russian FederationPenza170.28−2204.55−68.7331211.35 201.9458.45
Russian FederationTver81.34−366.02−23.7173367.06 107.8633.41
Note: LCPC15_N and LCPC20_N refer to the LCPC values in the newly built-up areas in 2015 and 2020; Area20-15 refers to the expansion area of the built-up area in 2020 relative to 2015, with unit of km2; Pop20-15 refers to the population changes from 2015 to 2020, unit/person; LCPC_15 and LCPC_20 refer to LCPC values in the total built-up area in 2015 and 2020, respectively.
Publisher’s Note: MDPI stays neutral with regard to jurisdictional claims in published maps and institutional affiliations.

