Article

Analysis and Prediction of Land Resources’ Carrying Capacity in 31 Provinces of China from 2008 to 2016

1
College of Resource and Environment Sciences, Institute of Arid Ecology Environment, Xinjiang University, Xinjiang 830046, China
2
School of Remote Sensing and Information Engineering, Wuhan University, Wuhan 430072, China
*
Author to whom correspondence should be addressed.
Sustainability 2021, 13(23), 13383; https://doi.org/10.3390/su132313383
Submission received: 13 September 2021 / Revised: 17 November 2021 / Accepted: 22 November 2021 / Published: 3 December 2021

Abstract

:
The rapid development of urbanization, population growth, and unreasonable use of land resources have made the contradiction between human beings and land increasingly prominent, and the carrying capacity of land resources has become an important factor affecting the sustainable development of a city or even a country. Based on the carrying capacity of agricultural land, construction land, and ecological land in 31 provinces of China, this paper analyzed the spatiotemporal characteristics of the carrying capacity of land resources in 31 provinces of China from 2008 to 2016 by using single-factor carrying capacity evaluation and comprehensive carrying capacity evaluation methods. The evaluation results were divided into six levels (No pressure, Lower pressure, Low pressure, Medium pressure, High pressure, Higher pressure), and the ArcGIS10.2 software was used for visualization, and the carrying capacity prediction model was constructed to predict the development trend of the comprehensive carrying capacity of land resources in 2020 and 2025. The results showed that China’s land carrying capacity is extremely unbalanced. Whether from the evaluation results of single-factor carrying capacity or comprehensive carrying capacity, we showed the characteristics of high pressure in the east and low pressure in the west, and that the regional land resources have a deteriorating trend. Through the prediction of the future land resource carrying capacity index, it was found that the comprehensive carrying capacity index of land resources in 31 provinces of China will still show an upward trend in the future.

1. Introduction

Land resources are the material basis and prerequisite for human survival and development, and play an irreplaceable role in human life [1]. They carry human production and the development of all kinds of constructive activities [2], and to make sustainable use of land resources is an inevitable choice for sustainable development [3,4,5]. In recent years, with the rapid advancement of urbanization, the contradiction among population, resources, and environment is increasingly intensified [6]. For example, in the process of urbanization, the rapid development of industries and the explosive growth of population have caused excessive consumption of land resources, resulting in serious resource constraints and environmental pollution problems, such as the sharp reduction of arable land, environmental degradation, and so on. These problems limit the economic development of a city and hinder the process of sustainable development of a city. Additionally, global land resources have entered a state of early warning or overload [7,8], which has aroused extensive attention of domestic and foreign scholars on the carrying capacity of land resources. Therefore, based on the current situation of land resources overload, it is of great theoretical and practical significance to carry out the evaluation of land resources carrying capacity and explore the improvement of dynamic monitoring and early warning mechanism of land resources carrying capacity [9].
The evaluation of land resources’ carrying capacity is the foundation for the suitability of territorial space development [10]. With the acceleration of urbanization, the limited land space will carry a larger scale and higher intensity of economic and social activities, and the contradiction between urban development and the scarcity of land resources will become increasingly fierce. To further rationally distribute land space and promote the sustainable use of regional land resources, the government proposed that “based on the carrying capacity of resources and environment and the suitability evaluation of land development, the functional space of ecology, agriculture and towns should be scientifically coordinated, and delimit the regulatory boundaries of production, life and ecological space development, and reserves space for sustainable development [11]”. This clarifies the basic role of carrying capacity and land development suitability in land spatial planning.
Land is an essential resource for humans and our means of production for existence and development [12]. Although China has a vast land area, its population is large and the available land resources are relatively scarce [9,13,14,15]. In addition, the excessive exploitation of land resources in the process of social and economic development leads to the resource and environmental problems in China, which seriously impact the sustainable use of land resources [16,17]; the Chinese government also pays more attention to the sustainable development of land resources. In order to achieve sustainable development goals and solve the disparity between resource, environment, and socio-economic development [18], China has resolved that “human and nature are life communities, and human beings must respect nature, conform to nature and protect nature” [19]. Therefore, whether the sustainable development and utilization of land resources can be realized is the key to the coordinated development of social economy and human land.
The carrying capacity was first proposed in the mechanics of physics, which refers to the maximum load that an object can carry without damage [8]. At present, it has been widely applied in ecology, biology, resource and environmental management, and natural resources-related fields, and its meaning has also been extended [13]. The study of carrying capacity has become an important basis for measuring the coordinated development of the man-land relationship and regional sustainable development [20]. It aims at realizing the common prosperity of human society within the Physical Boundary (PB) of the earth, setting the safe boundary for the key biophysical processes affecting the stability of the earth ecosystem from a global perspective, and determining the safe operating space of human activities [21,22]. The concept of land carrying capacity was first proposed by the American scholar William Vogot, that is, the ability of the land to provide food, clothing and housing for humans depends on the production potential of the land [23]. With the deepening of global land development, the relationship between human and land is becoming more and more tense, which makes the carrying capacity of land resources deeply studied in the world [24].
In previous studies on the carrying capacity of land resources, foreign studies started early and laid the foundation for the development of land carrying capacity, including single-factor carrying capacity evaluation and comprehensive carrying capacity evaluation. The former divides the land carrying capacity into agricultural land, construction land, ecological land, and other factors to evaluate the carrying capacity [25]. This method is well applied to the relationship between human and food [26], urbanization [27], ecosystem evolution [28], and other issues. At this stage, with the deepening of the research on the carrying capacity of land resources, scholars have transformed the single-factor carrying capacity evaluation into the latter, that is, the comprehensive land carrying capacity evaluation, which considers the comprehensive function of land resources [29]. According to the latest research, land comprehensive carrying capacity will become a key indicator of land spatial planning and urban or regional sustainable development [6]. At present, many scholars use this method to evaluate the carrying capacity of land resources to ensure the sustainable use of land resources. For example, Johnson [30] used Geographic Information System (GIS) technology to analyze the problem of land carrying capacity in the United States to solve the problems of environmental protection and unreasonable use of land resources, and some scholars also discussed the spatiotemporal variation characteristics of the carrying capacity of land resources. For example, Cui [6] used a multi-criterion comprehensive evaluation approach, the comprehensive land carrying capacities of seven cities in the Shandong Peninsula Blue Economic Zone between 2007–2014 were assessed, and cluster analysis was conducted to identify the spatial-temporal variations of the cities’ comprehensive land carrying capacities; some scholars have made relevant researches on the prediction of land resource carrying capacity. For example, Li [31] predicted the land carrying capacity of the Pearl River Delta urban agglomeration, and used a scenario simulation method to simulate the land use situation under different scenarios. However, previous studies have primarily focused on single large cities, and few studies have conducted a nationwide analysis of land carrying capacity in China. This study attempted to fill this gap.
At present, the research methods of land resources’ carrying capacity have changed from simple to complex, but a mature theory has not been formed [32]. The carrying capacity of cultivated land resources is to study the ability of cultivated land to feed the population [33]. The ecological footprint method is widely used in the study of ecological land carrying capacity [34,35]. Some scholars use the index system method to calculate the construction land carrying capacity and the land comprehensive carrying capacity [36,37,38]. In recent years, the system dynamics (SD) method and the driving force-pressure-state-impact-responses (DPSIR) model have been gradually developed to evaluate the carrying capacity of land resources [39,40]. Although these studies have obtained some meaningful information, the existing studies have some limitations. Firstly, the indicators and parameters of land resource’ carrying capacity are uncertain [8]; secondly, too many social and economic indicators are introduced into the study of the comprehensive carrying capacity of land resources, which makes the studies more complex and deviates from the original intention of the study of land carrying capacity; finally, some of the current land resources’ carrying capacity evaluation methods, such as ecological footprint and system dynamics, are more complex, and the scientificity and accuracy of their parameter settings need to be discussed.
To solve the limitations of the above studies, this paper firstly evaluated the carrying capacity of agricultural land, construction land, and ecological land by single-factor evaluation method, and calculated the corresponding carrying capacity index; then, it used the coefficient of variation weighting method to calculate the weight of each indicator, integrate the results of each indicator, and calculate the comprehensive carrying capacity of land; at the same time, the comprehensive land resource carrying capacity of China (except Hong Kong, Macao, and Taiwan) from 2009 to 2016 was analyzed by spatial differentiation, predicting the land comprehensive carrying capacity of 31 provinces in 2020 and 2025. The purpose is to understand and grasp the current situation and future development trend of land resources’ carrying capacity in China so as to facilitate relevant departments to accurately grasp the dynamic changes of land use and timely supervision and management, and to provide theoretical support for sustainable development and related land-use planning decision-making in China.

2. Materials and Methods

2.1. Data Sources

The data are from the China Statistical Yearbook [41] (http://www.stats.gov.cn/ (accessed on 22 October 2021)) and the Ministry of Natural Resources of the People’s Republic of China [42] (http://tddc.mnr.gov.cn/ (accessed on 12 November 2021)), including population data and land resources data of 31 provinces in China from 2009 to 2016. The land classification standard adopts the national standard of the People’s Republic of China Land Use Status Classification (GB/T21010-2007). Cultivated land includes paddy fields, irrigated land, and dry land; construction land includes urban, rural land, hydraulic construction land, and transportation land; ecological land includes forest land, grassland, waters, beaches, and swamps, and 7 index factors were selected from three levels of cultivated land, construction land, and ecological land to evaluate the carrying capacity of land resources, among which the cultivated land index factors included population scale, Per capita grain output, and Per capita cultivated area; construction land index factors included area of existing construction land and Per capita construction land area; ecological land index factors included existing ecological land area, and Per capita ecological land area.

2.2. Methods

2.2.1. Data Standardization

The source of the land resources’ carrying capacity index system is different, so we needed to conduct dimensionless processing to the original data. This paper selected three indicators of land resource carrying capacity (cultivated land, construction land, and ecological land), which represent the carrying status of each index factor. We adopted the normalization method to deal with the indicators so as to eliminate the influence of different units on carrying capacity results [43].
r ij = R ij min ( R ij ) max ( R ij ) min ( R ij )
where r ij represents the value of index j in the i -th year after standardization; R ij represents the original data of index j in the i -th year, max ( R ij ) ,   min ( R ij ) represent the maximum and minimum values of index j , and the standardized values are between [0,1].

2.2.2. Single Factor Evaluation

The carrying capacity of cultivated land resources is a further refinement of the carrying capacity of land resources, which refers to the population scale that cultivated land resources can accommodate within a certain range. The cultivated land carrying capacity index is used to characterize the relationship between the actual population and cultivated land carrying capacity [44,45] (Equation (2)). In this paper, it was extended to construction land and ecological land, and the carrying capacity index of construction land and ecological land was calculated according to Formula (2).
The carrying capacity index can directly reflect the pressure of population on land resources. If the carrying capacity index is less than 1, it indicates that there is no pressure in the area; if the carrying capacity index is greater than 1, it indicates that there is pressure [32,46].
CI xj = P x L xj L total P total
where CI xj represents the carrying capacity index, x represents the provinces in China and j is the land type;   P x is the population size of x province,   L x j is the total amount of j land types in x province.

2.2.3. Coefficient of Variation Weight Method

The weight calculation of the carrying capacity index of land resources is generally divided into subjective and objective measures in order to ensure carrying capacity evaluation is scientific; this paper adopted the objective assignment method, that is, the coefficient of variation weight method was used for weight determination [47]. The larger the weight is, the larger the information content of the index is and the greater the role it plays in the evaluation. The specific calculation steps of this method are shown in Equations (3) and (4) [47].
V j = 1 n ( r ij r ¯ ij ) 2 n 1 r ¯ ij
W j = V j i = 1 j V j
where r ij represents the value of j land type in the i -th year after standardization, r ¯ ij is the mean of j land type, V j is the coefficient of variation of j land type, W j is the weight of j land type, and n is the number of years.

2.2.4. Comprehensive Carrying Capacity Evaluation

Evaluation of the comprehensive carrying capacity of land resources is necessary and basic work for the overall planning of land use and territorial spatial planning. We adopted the method of comprehensive evaluation to calculate the comprehensive carrying capacity of land resources (Equation (5)) [48]. This paper constructed an evaluation index system for the comprehensive carrying capacity of land resources in China’s 31 provinces from three aspects: the carrying capacity of cultivated land, the carrying capacity of construction land, and the carrying capacity of ecological land (Table 1).
S i x = i = 1 m r i j W j
where S i x is the comprehensive carrying capacity of land in the i -th year for province x , r i j represents the value of j index in the i -th year, m is the number of indicators, and W j (Equation (4)) is the weight of index j .

2.2.5. Carrying Capacity Prediction Model Construction

The prediction of the comprehensive carrying capacity of land resources is based on the evaluation, which is an important part of the research on the comprehensive carrying capacity of regional land resources. At present, the commonly used methods are regression analysis method, time series analysis, and grey system method [49]. Based on the ARIMA time series model, this paper predicted the comprehensive carrying capacity of land resources in 31 provinces of China in 2020 and 2025.
The ARIMA model is a frequently used time-series forecasting model that combines autoregressive (AR model (P)), moving-average models (MA model (q)), and differencing in order I (d) to achieve stationary time series [50,51]. The general notation for ARIAM is A R I M A ( p , d , q ) , where p is used to calculate A R using p preceding periods from the time series, d represents the degree of differencing that is used to transform the data into a stationary series, and q is the order of the moving average. Forecasting using ARIMA is calculated as follows [50,52]:
Y t = C + φ 1 Y t 1 + + φ p Y t p + θ 1 e t 1 + + θ q e t q + e t
where Y t is the difference at degree d of the original series of time series, φ 1 φ p are autoregressive model parameters, θ 1 θ q represent moving-average model parameters, and e t is white noise. It should be noted that in Equation (6), when d = 0 , the ARIMA model becomes an ARMA model [53].
Firstly, we needed to ensure the stability of the time series when performing time series forecasting [54]. Stationary detection methods include autocorrelation, partial correlation, and the Augmented Dickey Fuller test (ADF); the latter test is more objective because it judges the existence of the unit root [55]. The ADF test was first invented by David Dickey and Wayne Fuller in 1979 and tests the time series for the null hypothesis of the presence of unit root test [56]. The null hypothesis can inform whether a given time series is stationary or not. It checks if the time series can be represented by a unit root with a time-dependent structure [57]. If this hypothesis is rejected, we can assume that the time series is stationary. The mathematical expression for ADF is given by:
Δ y = α + β t + γ y t 1 + δ 1 Δ y t 1 + + δ p 1 Δ y t p + 1 + ϵ t
where α is constant, β is coefficient of time trend, p is the lag order, and ϵ t is the error term. After selecting the appropriate lags of order p , the test is executed for the null hypothesis γ = 0 . If the time series has non-stationarity, then the stationarity can be achieved using differencing until the time series become stationary.
Since the autocorrelation coefficients and partial autocorrelation coefficients of the stationary series obtained after difference do not have truncation, the order cannot be determined by autocorrelation function or partial correlation function. The usual order determination criteria are Akaike information criteria (AIC) [58]. AIC calculates the prediction error, which measures the quality of a statistical model with other relative models, and it can be expressed mathematically as [59]:
AIC = 2 k 2 ln ( )
where k stands for estimated parameters in the model and is the maximum value of the likelihood function.
We measured goodness of fitting by R2, and the formula is as follows [60]:
R 2 = 1 i = 1 n ( P r e d i c t i P ¯ r e d i c t ) 2 i = 1 n ( A c t u a l i A ¯ c t u a l ) 2
Where   Predict i represents the predicted value in the i -th year, P ¯ redict is the mean of the predictions, Actual i represents the actual value in the i -th year, and A ¯ ctual is the mean of the actual.
The mean relative error (MRE) is better to reflect the actual situation of the prediction error because it has no dimensional influence; it is a percentage allowing easy comparison [61].
MRE = i = 1 n | P r e d i c t i A c t u a l i | A c t u a l i n 100 %

3. Results and Analysis

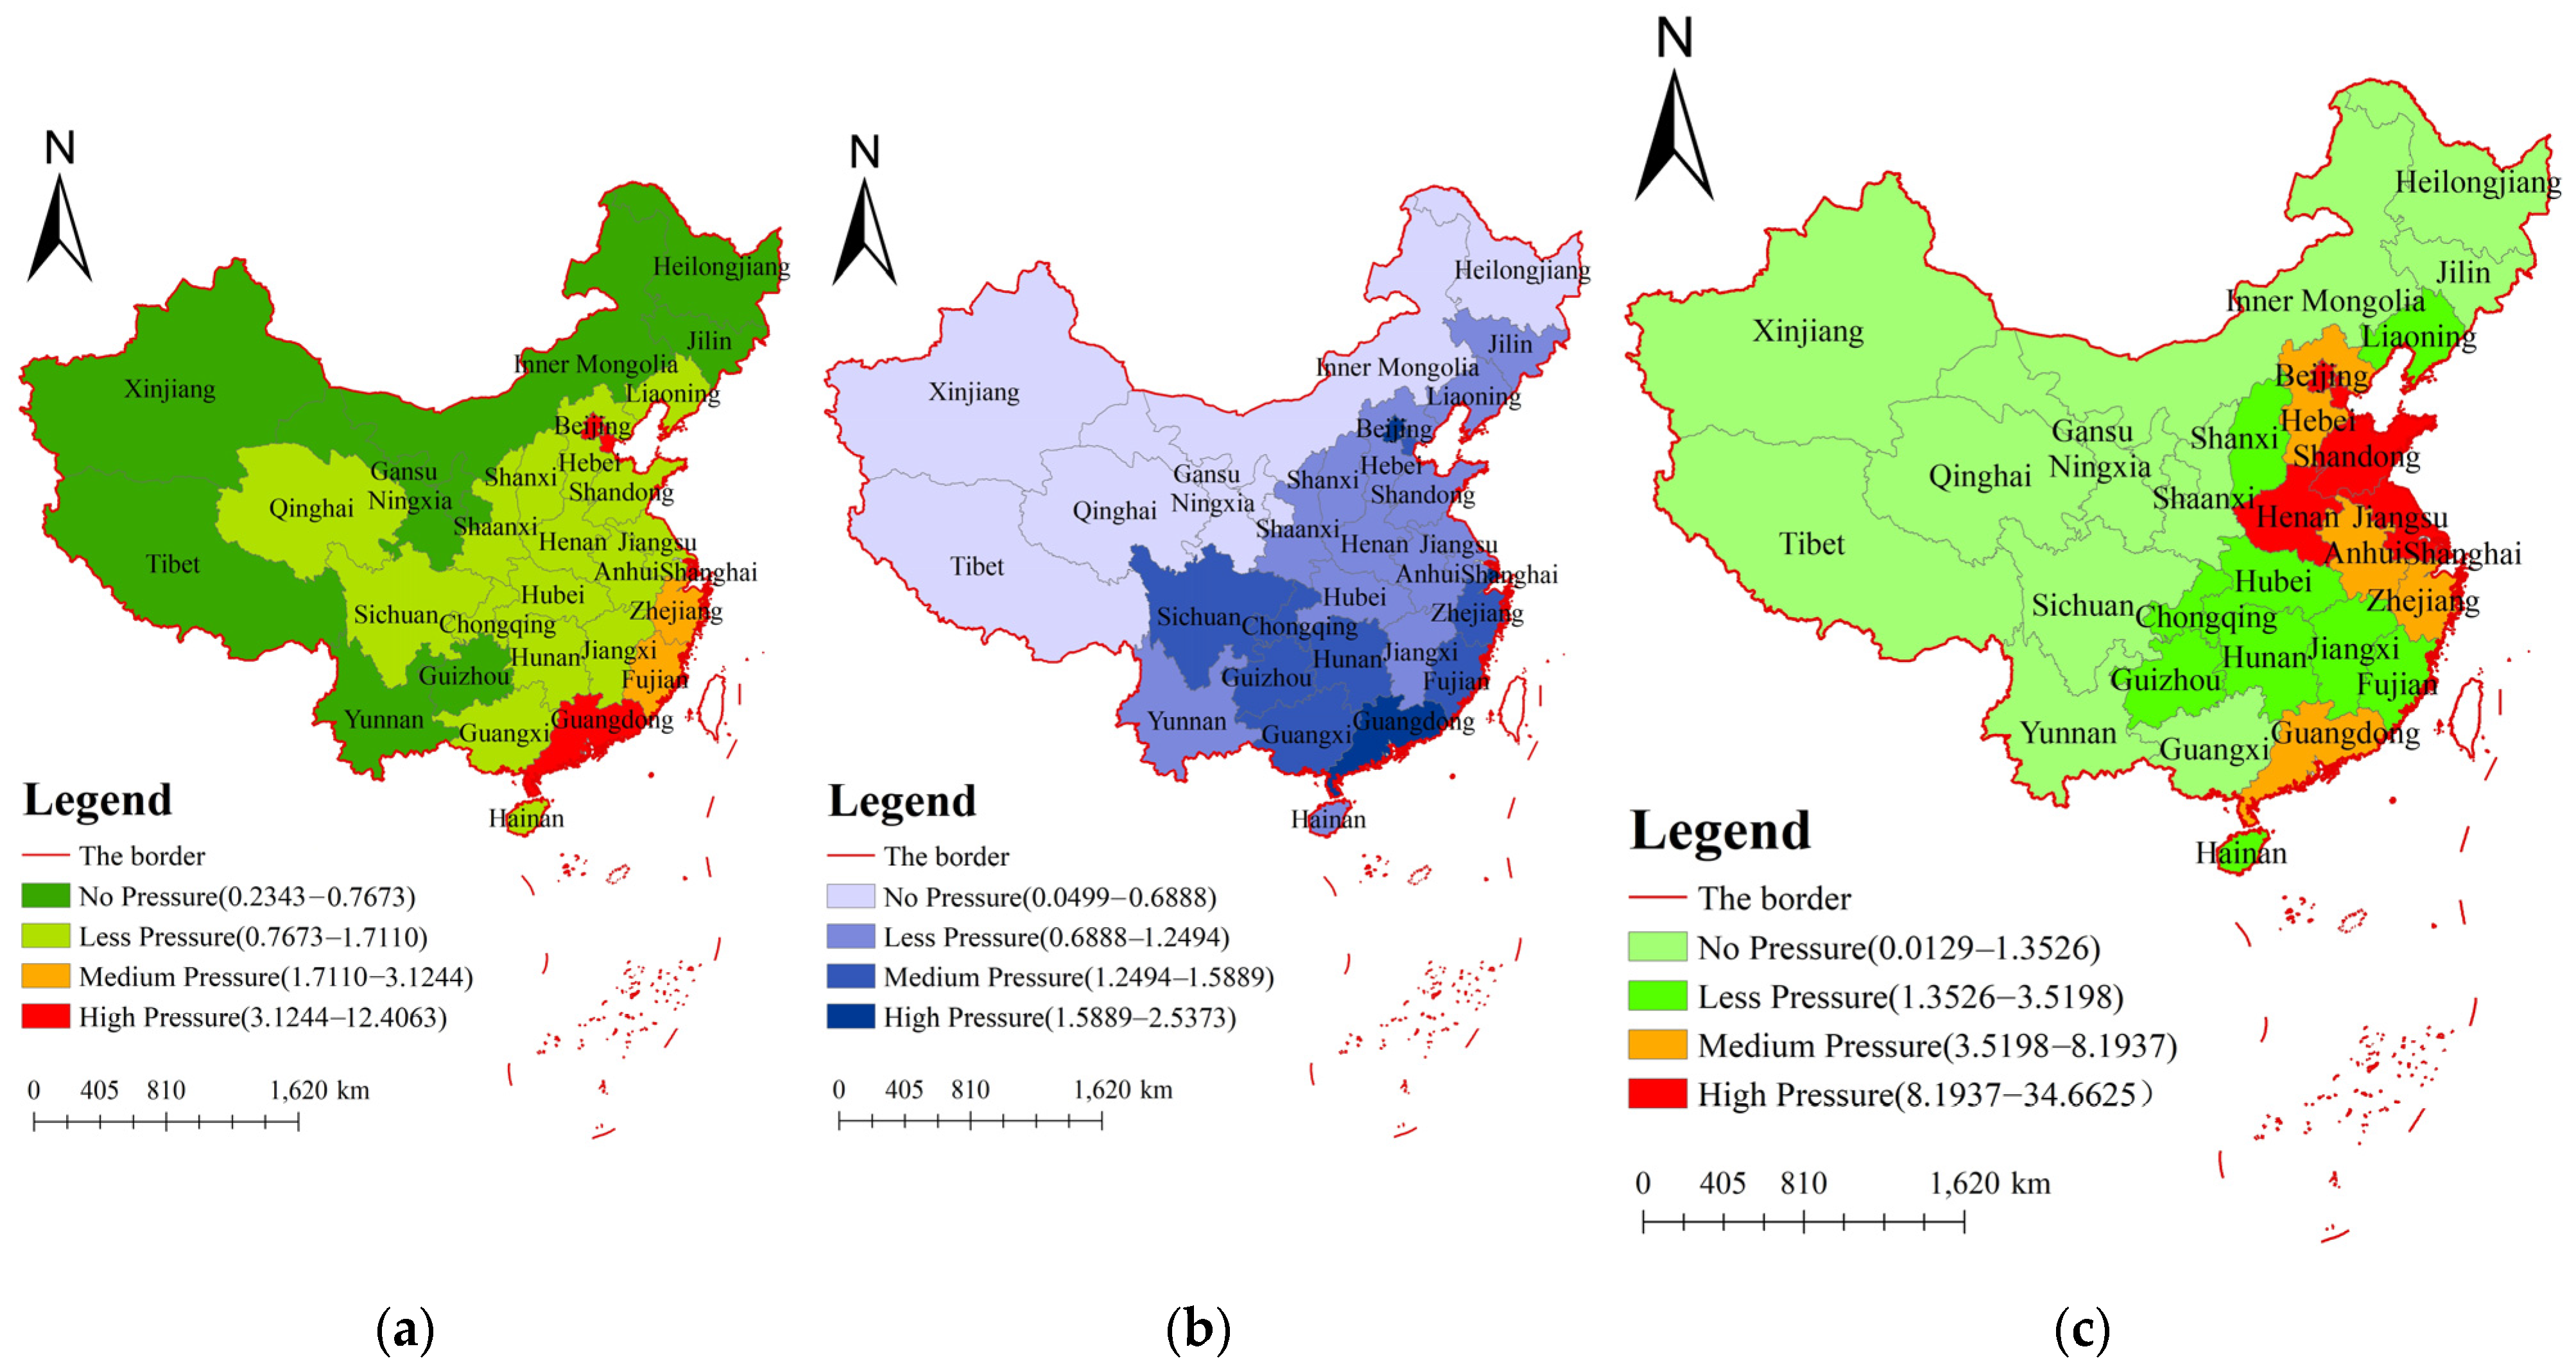
3.1. Single-Factor Carrying Capacity Analysis

3.1.1. Carrying Capacity of Cultivated Land

The cultivated land carrying capacity index reflects the pressure of population on cultivated land resources. At the present stage, the index of arable land carrying capacity in China is 0.79, indicating that 79% of the grain produced by cultivated land can meet the food demand of the Chinese population, but there are still significant differences in the status quo of arable land carrying capacity among provinces. We divided the results of cultivated land resource carrying capacity index in 2016 into four categories according to the natural breakpoint method (construction land carrying capacity and ecological land carrying capacity are classified according to this method, which will not be repeated below). The results showed that only 13 of the 31 provinces had cultivated land carrying capacity indices less than one, and the cultivated land resources met the population demand. The population of the remaining 18 provinces produced different pressure on the cultivated land resources. This is mainly due to the high value of cultivated land carrying capacity areas (such as Beijing, Shanghai, Guangzhou), in which, often, more population, land supply, and demand are seriously unbalanced, cultivated land production potential is low, and the cultivated land carrying index value is much higher than other administrative regions, in the state of overload. The interesting thing is that these areas have a large population and less arable land, so how can we feed more people? This is because the area with larger cultivated land carrying capacity index is the city with more developed economic development; although the food in these areas cannot be self-sufficient, it can be obtained by consumption from other areas. However, in Western China (such as Xinjiang, Tibet, Inner Mongolia, etc.), the population is small and the per capita cultivated land area is large, which leads to a small cultivated land carrying capacity. The cultivated land carrying capacity index of each provincial administrative region shows obvious differences in space, and the cultivated land carrying capacity indices of southeast provinces are significantly larger than those of northwest provinces.

3.1.2. Carrying Capacity of Construction Land

The carrying capacity of construction land index reflects the maximum scale and intensity of human activities carried by land resources [62,63,64]. Figure 1b shows the construction land carrying capacity index of 31 provinces in China in 2016. At present, China’s the carrying capacity of construction land index is 0.57, which can meet the needs of people’s daily production and life. Although the overall situation is satisfactory, there are large differences between provinces and cities, and the spatial differentiation is obvious. From Figure 1b, we can find that the population of most provinces in China has little pressure on the construction land resources, but Beijing, Shanghai, Guangdong, Guizhou, and other places pose greater pressure on the construction land resources. This is mainly due to the relatively developed economies and large populations in Beijing, Shanghai, Guangdong, and other places, and the development intensity of construction land being relatively high.

3.1.3. Carrying Capacity of Ecological Land

The carrying capacity of ecological land index is the scale of social economy and the population that can be supported by ecological resource land, which is also the most important basic content in the study of resource and environmental carrying capacity [65]. Figure 1c shows the carrying capacity of ecological land index in 31 provinces of China in 2016. The carrying capacity of ecological land index in China is 4.9, and the situation is not optimistic. As can be seen from the Figure 1c, China’s ecological carrying capacity index presents a general feature of being high in the east and low in the west. Xinjiang, Inner Mongolia, Tibet, Qinghai, and nine other regions have great ecological carrying capacity, which can meet the needs of the people; however, Beijing, Shanghai, Tianjin, Jiangsu, Shandong, and other areas have small ecological land area, and are seriously affected by human activities.

3.2. Comprehensive Carrying Capacity Evaluation

The comprehensive carrying capacity of land resources can reflect the comprehensive pressure of land carrying population. Firstly, we used the data standardization formula to standardize the original data (Formula (1)). Then, based on the standardized data, we brought them into the relevant formula of coefficient of variation weight method to obtain the relevant weights of each index (Table 1.). Finally, the weighted data were brought into Formula (5) for relevant calculations to obtain the comprehensive carrying capacity index of land resources in China’s 31 provinces from 2009 to 2016 (Table 2).
From Table 2, we can find that the comprehensive carrying capacity index of land resources in China’s provinces is between 0.0064–0.6084 (except Shanghai), and the carrying capacity index of Shanghai has always been overloaded. This is mainly due to the greater land pressure of agricultural land, construction land, and ecological land in Shanghai, which makes the comprehensive carrying capacity index of Shanghai larger.
From the evaluation level, the comprehensive carrying capacity of land resources in Xinjiang, Inner Mongolia, Heilongjiang, Tibet, Ningxia, Qinghai, Jilin, and Gansu is at a relatively high level, which can basically meet the sustainable development of society, economy, and ecology; the land resources of Liaoning, Shanxi, Hainan, Hubei, Anhui, Hebei, Shaanxi, Yunnan, Jiangxi, Hunan, and Guangxi are better, but the pressure is less; Sichuan, Chongqing, Henan, and Guizhou are at the medium level of carrying capacity, and show a trend of decreasing first and then increasing; the carrying capacity of land resources in Fujian, Jiangsu, Shandong, and Zhejiang is poor, and Guangdong, Tianjin, Beijing, and Shanghai are overloaded with carrying capacity, mainly due to the rapid development of these areas and the gradual increase of the migrant population, which leads to environmental degradation and the carrying capacity index being too large.

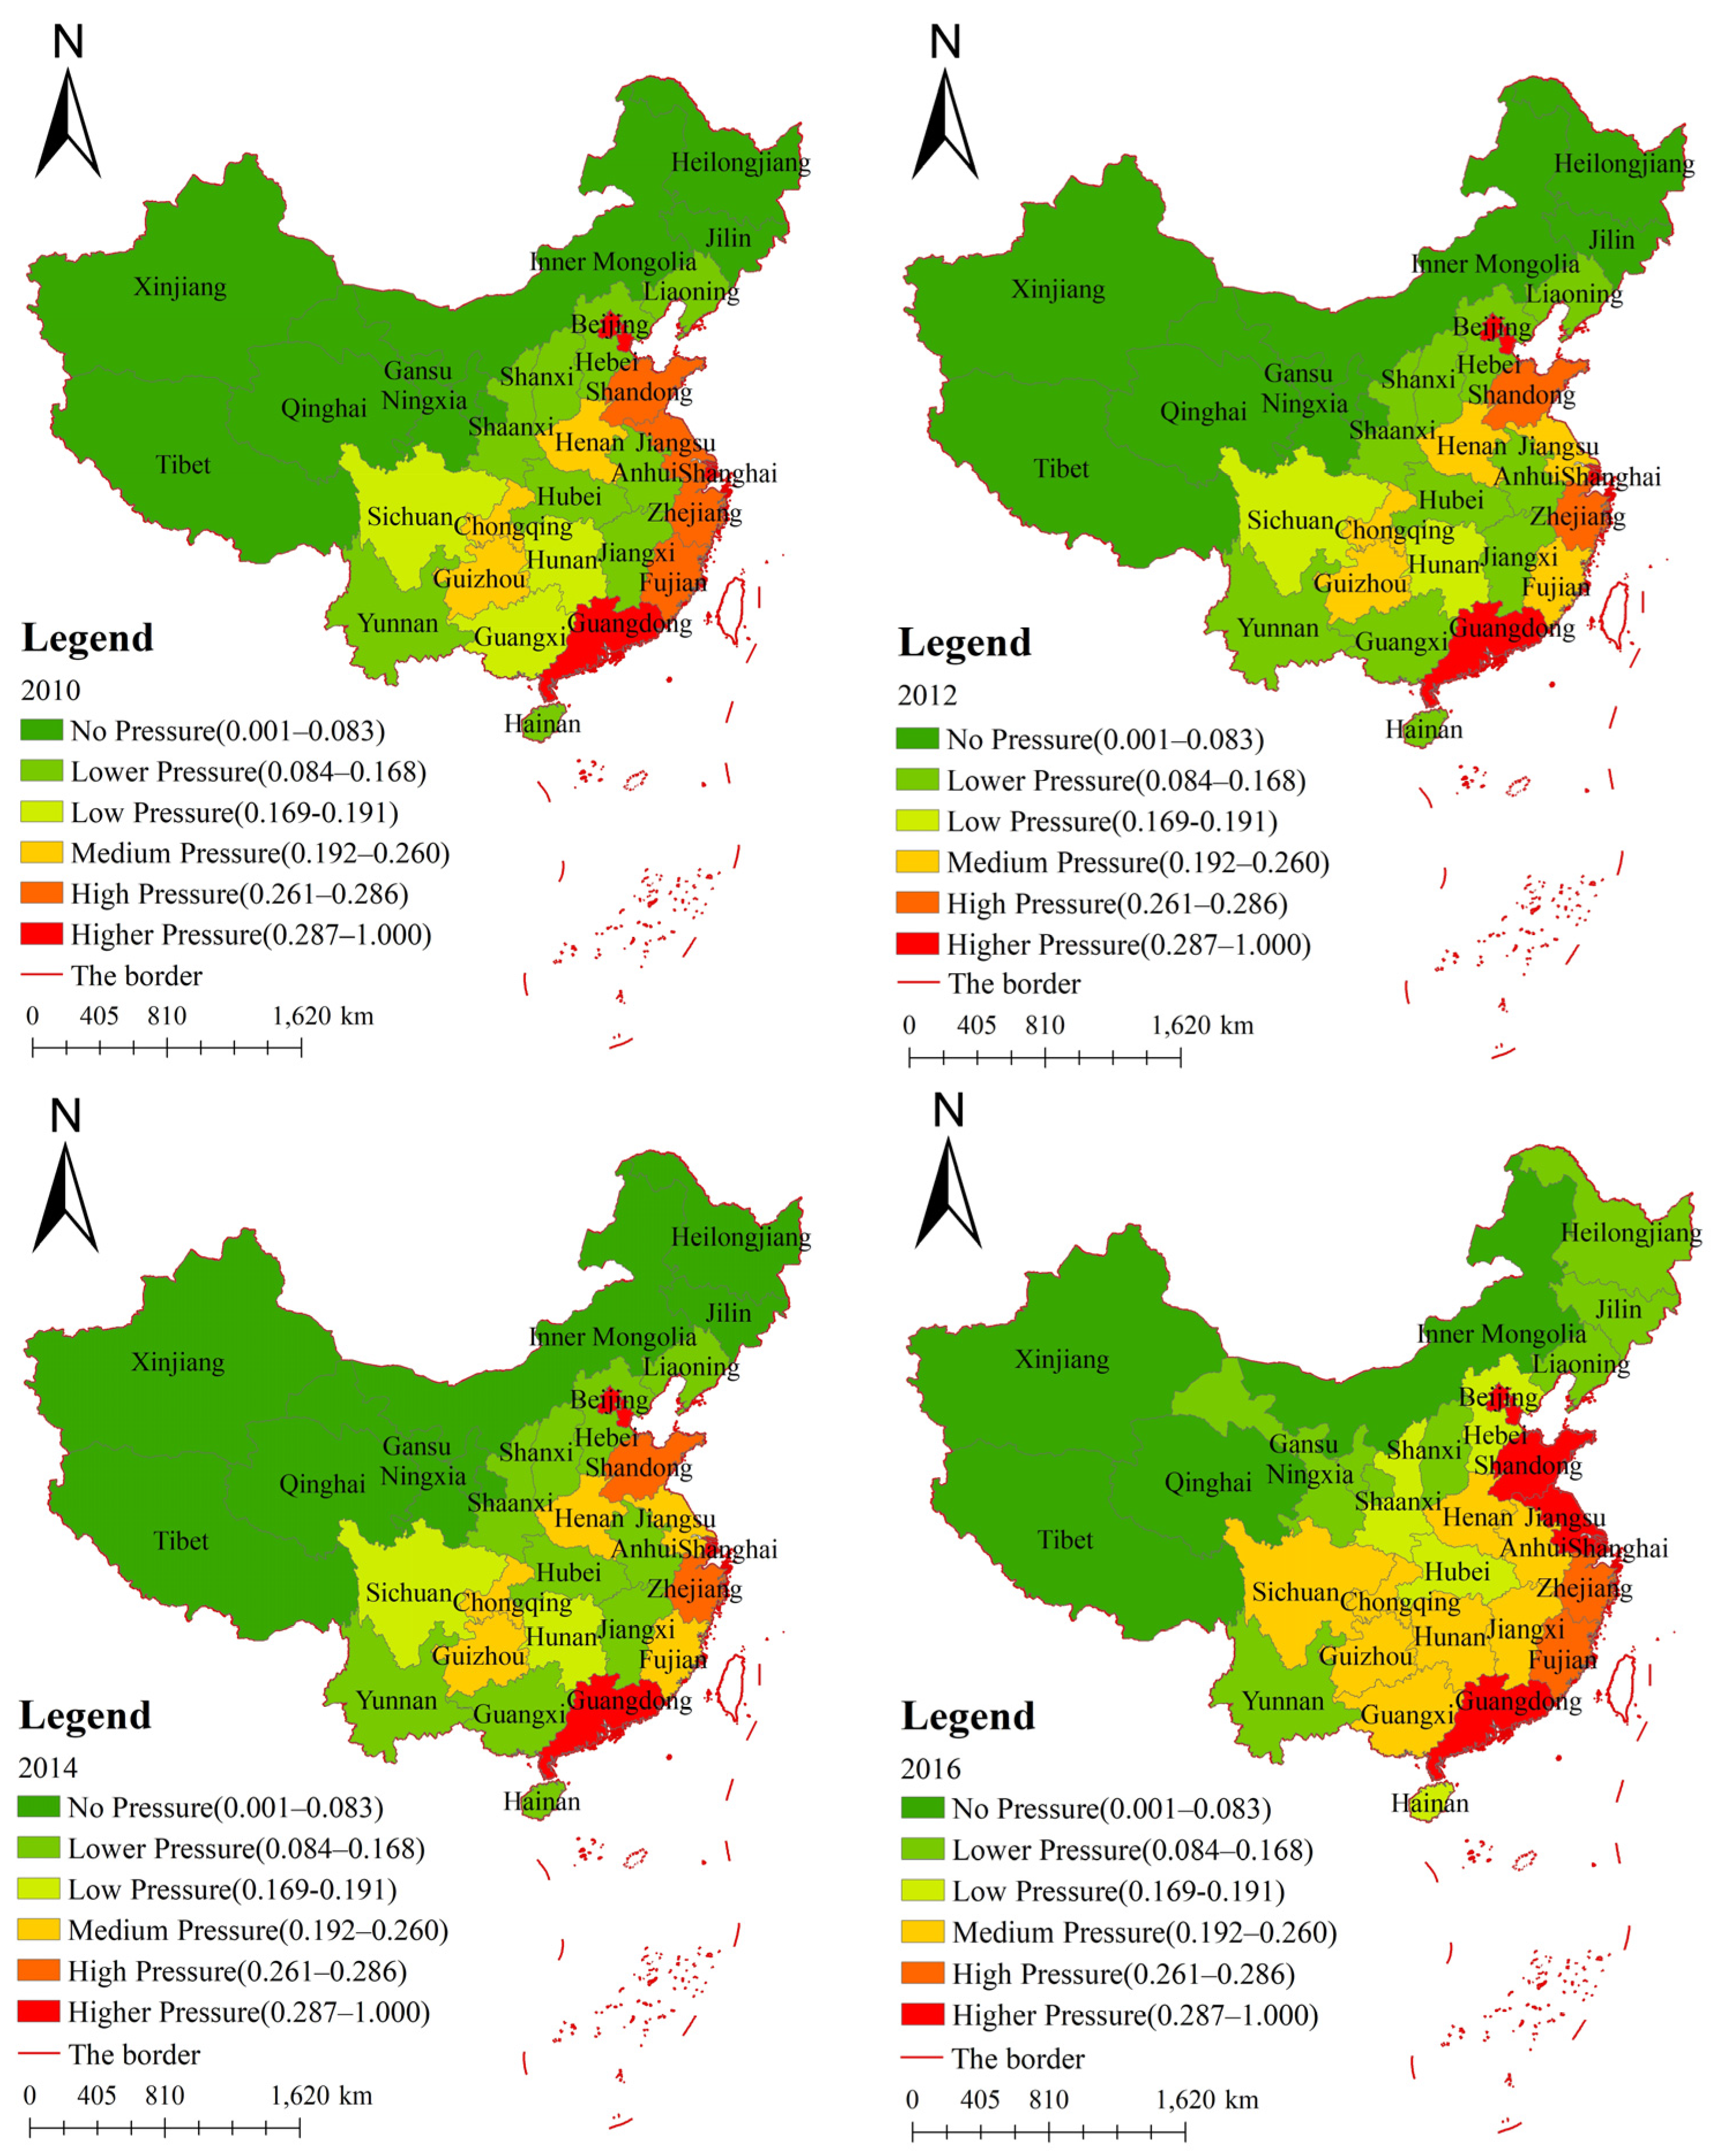
3.3. Spatiotemporal Analysis of the Comprehensive Carrying Capacity

Since the changing trend of land comprehensive carrying capacity in 31 provinces of China in one year is not significant, the change cannot be clearly displayed. To more directly reflect the spatial differentiation of the evaluation results of the land comprehensive carrying capacity, this study used ArcGIS10.2 to realize the spatial analysis of the evaluation results of the comprehensive carrying capacity of land resources in 2010, 2012, 2014, and 2016. The evaluation results were divided into six grades using the standard difference grading method (No pressure, Lower pressure, Low pressure, Medium pressure, High pressure, Higher pressure), and different colors were used to indicate different levels so as to more clearly reflect the actual situation of land resource carrying capacity in various provinces in China (except Hong Kong, Macao, and Taiwan) (Figure 2).
The evaluation results of land resource carrying capacity (Figure 2) presented a spatial pattern of greater pressure in the east and less pressure in the west. In eastern Beijing, Shanghai, Tianjin, Jiangsu, and other places, due to superior geographical conditions, population activities and economic development are relatively active, resulting in a large degree of land development and greater pressure on land resources. Along with the rapid development of social economy in Sichuan, Chongqing, Henan, Anhui, and other places in the central part of China, the problem of lack of land resources has appeared in all provinces. Meanwhile, the shortage of land resources can hardly meet the needs of the rapid development of regional economy and society. In the west, Xinjiang, Tibet, Qinghai, and Inner Mongolia are rich in land resources, which are conducive to carrying out land development on an appropriate scale.
In addition, the number of areas with no pressure, lower pressure, low pressure, medium pressure, high pressure, and higher pressure in the comprehensive carrying capacity of land resources evolved from 8, 8, 3, 4, 4, and 4 in 2009 to 4, 7, 4, 8, 8, 2, and 6 in 2016. On the whole, the number of areas with no pressure and high pressure on the carrying capacity of land resources in the 31 provinces of China obviously decreased, while the number of areas with medium pressure and higher pressure increased slightly. The regional land resources showed a worsening trend, and the spatial distribution of land resources’ carrying capacity showed a gradual increase from west to east.

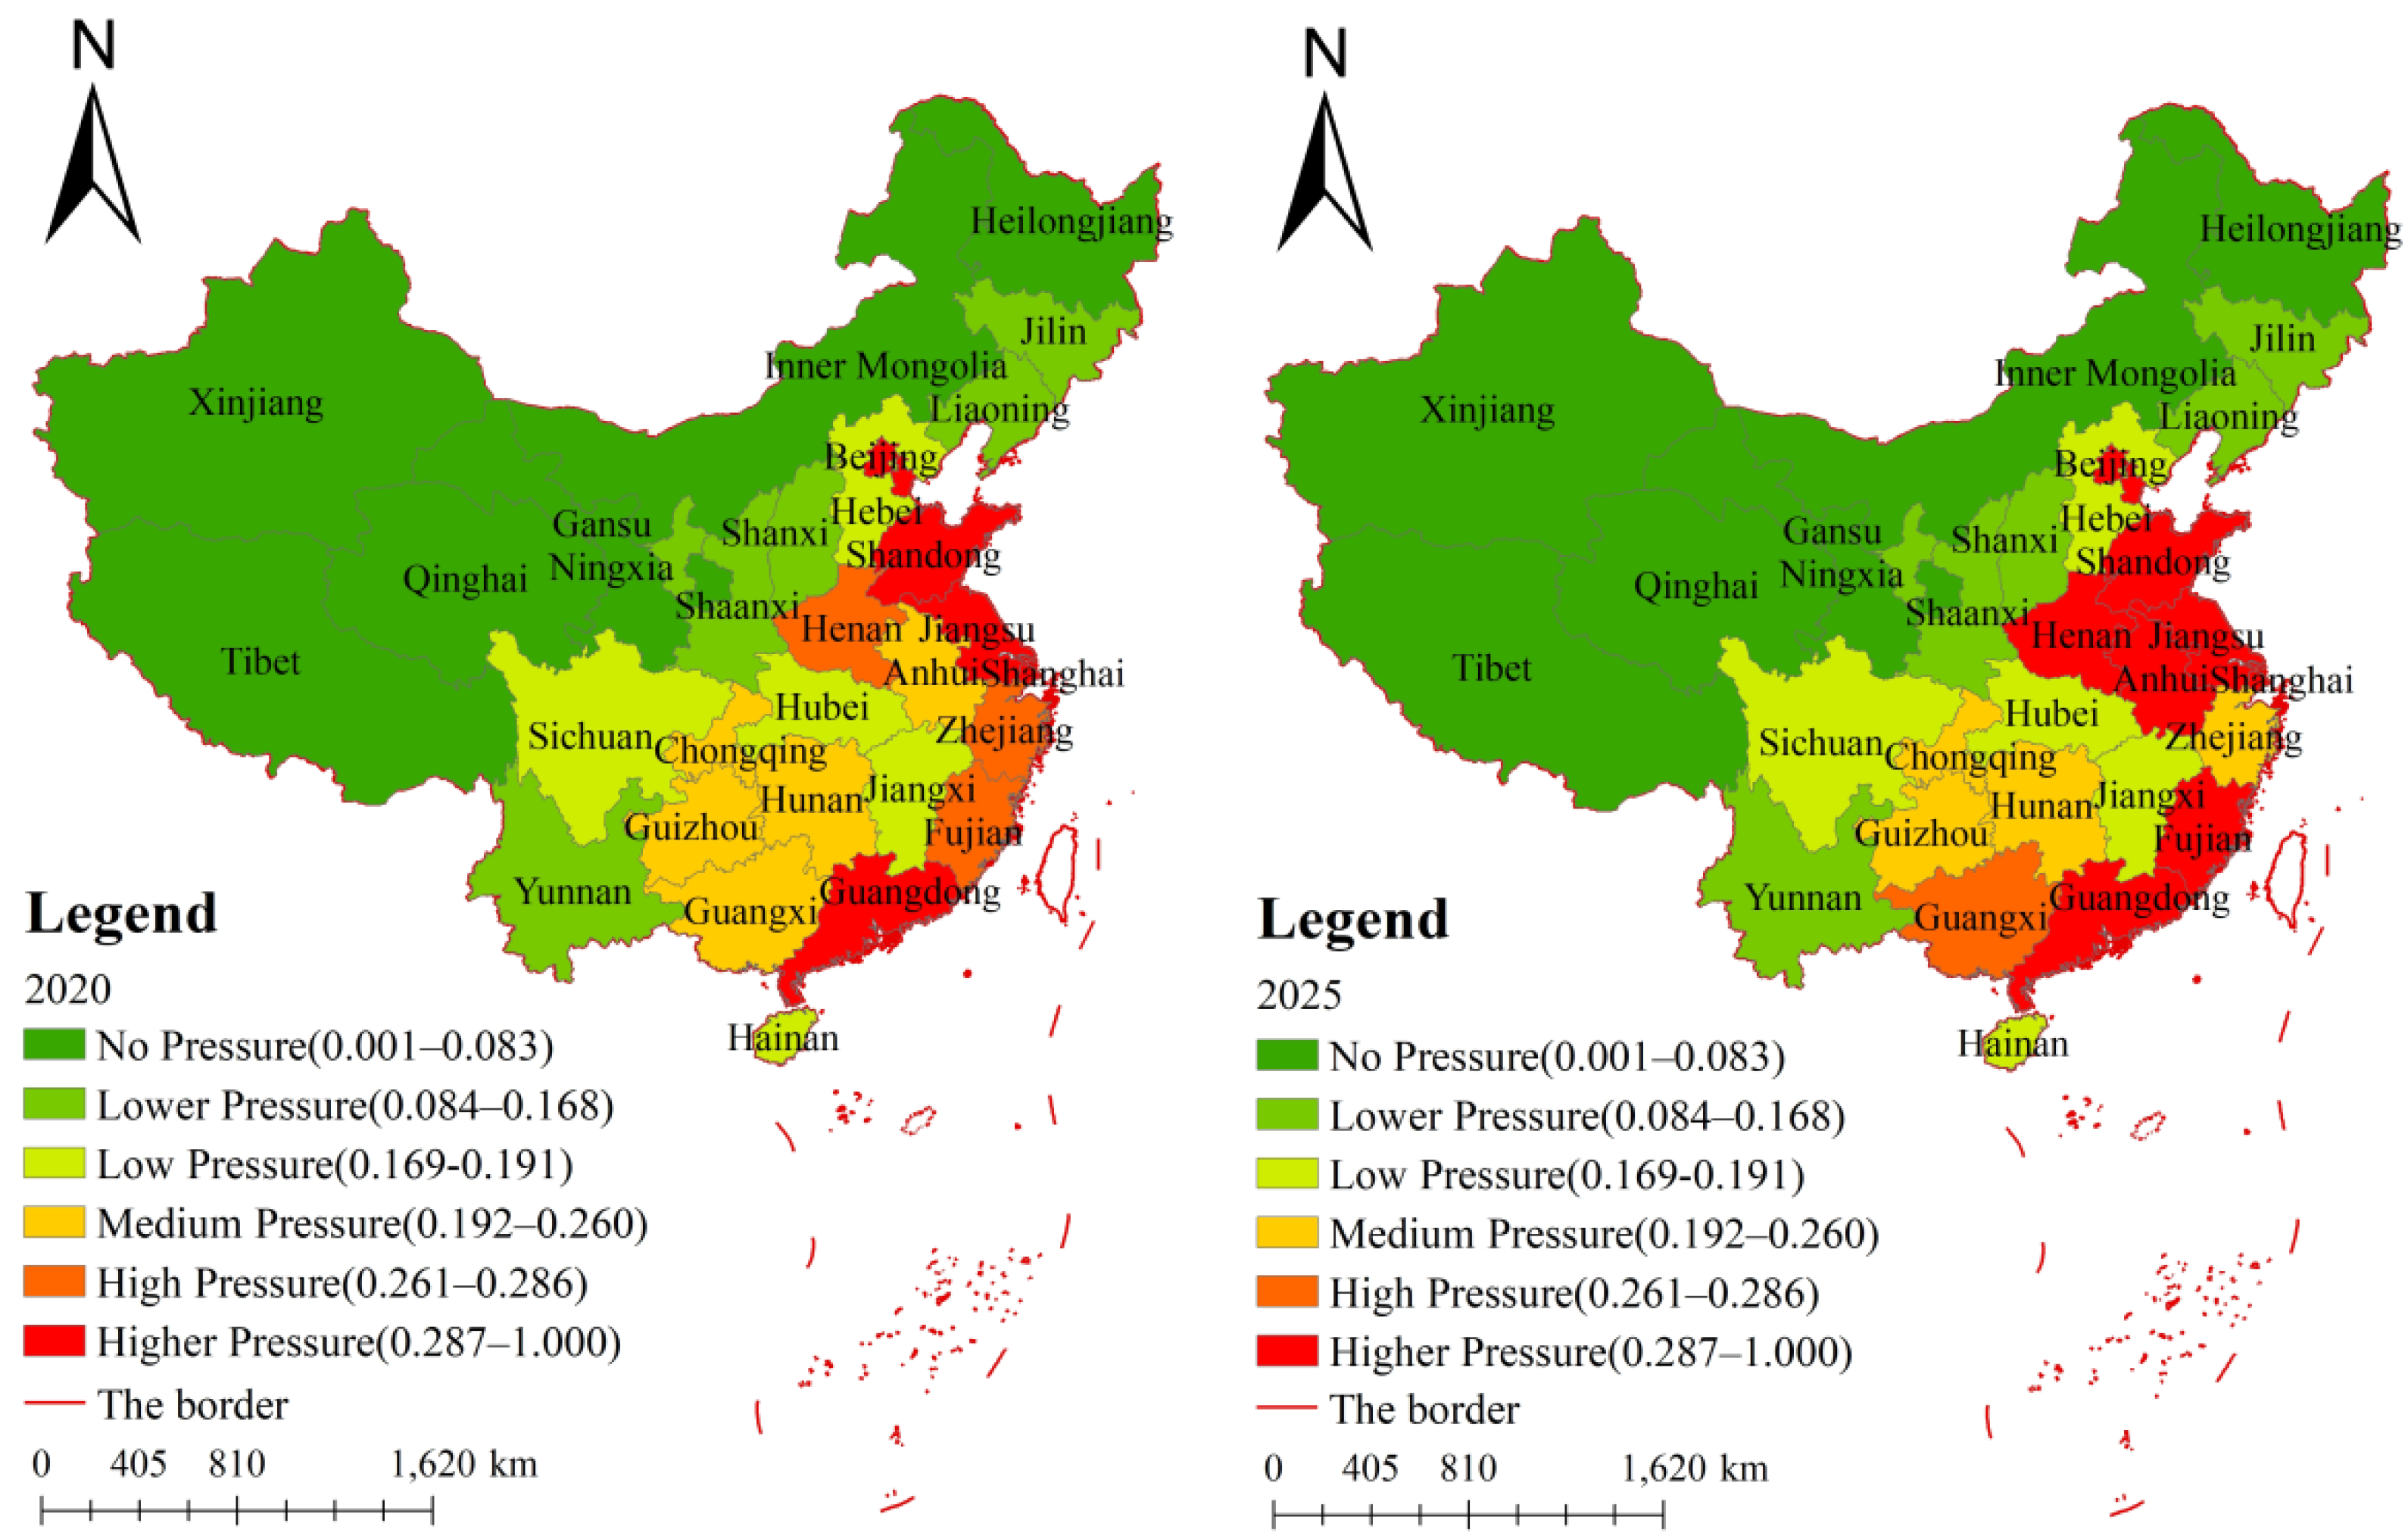
3.4. Prediction and Analysis of Land Carrying Capacity Based on ARIMA Model

There are two methods to predict the comprehensive carrying capacity of land. One is to directly make predictions on the comprehensive land carrying capacity index sequence [66,67]; the other is to predict each index in the comprehensive land resource carrying capacity evaluation index system [68] and then calculate the comprehensive carrying capacity of land in the future. Since 2020 and 2025 are the deadlines of the 13th Five-Year Plan and the 14th Five-Year Plan, predicting the carrying capacity of land resources in 2020 and 2025 can provide theoretical support for the decision-making of the new round of General Land Use Planning. Based on the original data of each index from 2009 to 2016, this study used the ARIMA model to predict the index data of 31 provinces in China in 2020 and 2025 and calculated the comprehensive land carrying capacity index of mainland China in 2020 and 2025.

3.4.1. Tests the Stationarity of ADF

For ARIMA modeling, stationarity is a prerequisite. Taking the cultivated land carrying capacity in Beijing as an example (See Supplementary Materials for details), the stability of the original data was tested by using Eviews software. The test results showed that under the original hypothesis, the values of unit root T-test statistic were greater than the corresponding critical values at the three significant levels of 1%, 5%, and 10%, so it accepts the original hypothesis, indicating that the original data set of Beijing cultivated land carrying capacity is non-stationary and has unit root, and the data need to be stabilized. After the second-order difference, under the significance level of 5%, the critical value of unit root test of cultivated land carrying capacity in Beijing was less than the corresponding critical value, which rejects the original hypothesis, indicating that the original data set is stable after the second-order difference, and the stationarity test is completed (Table 3.).

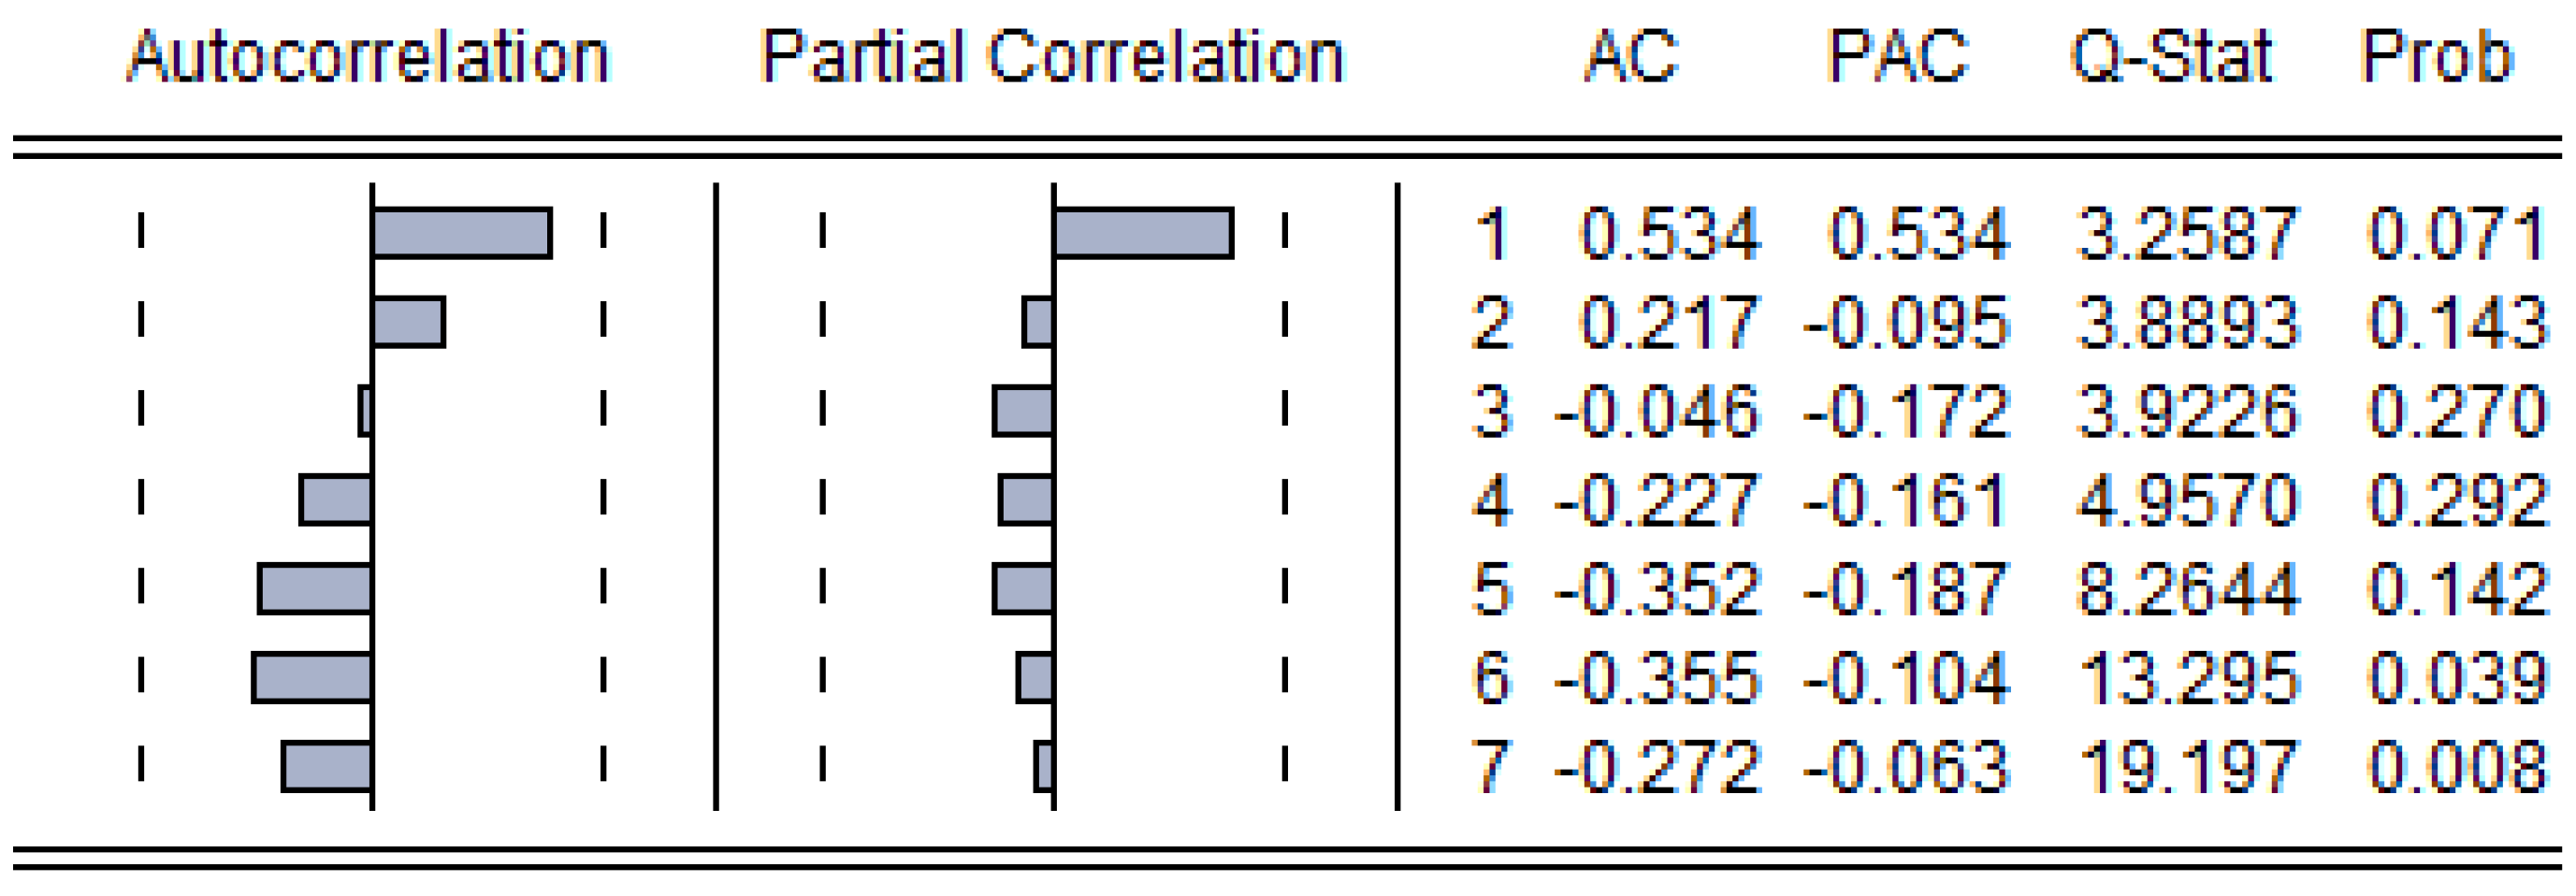
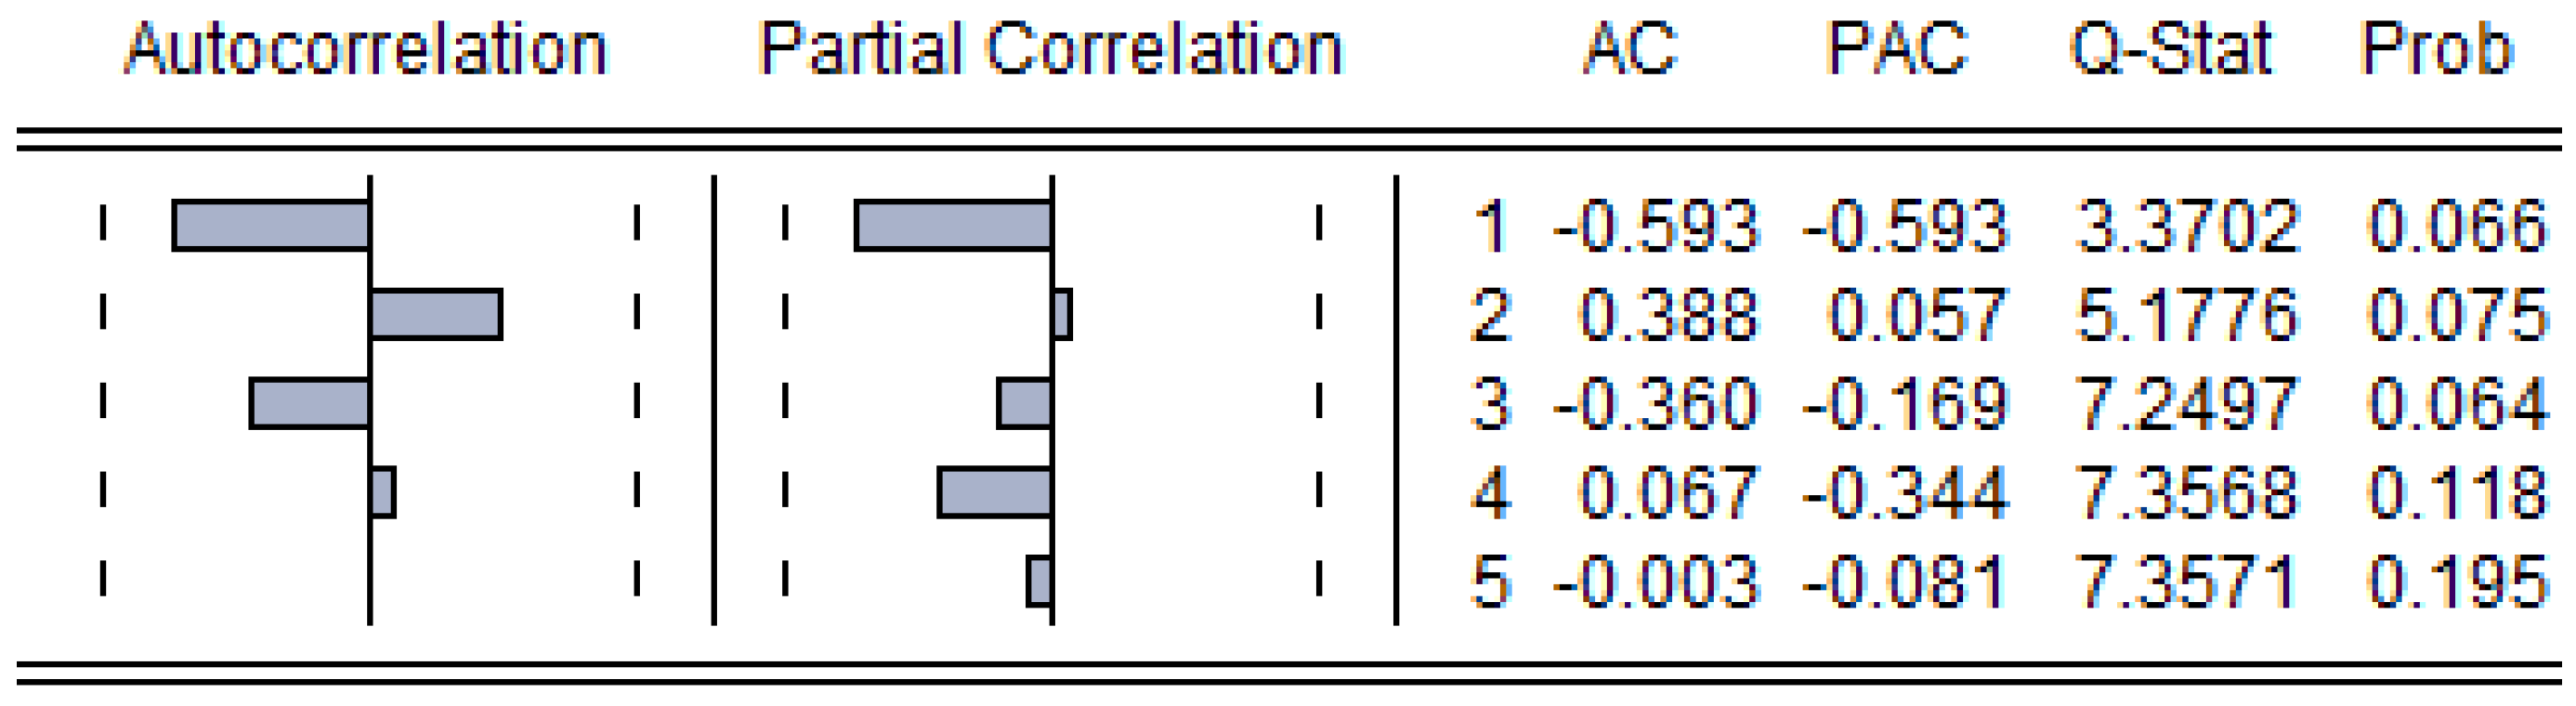
3.4.2. Parameter Estimation
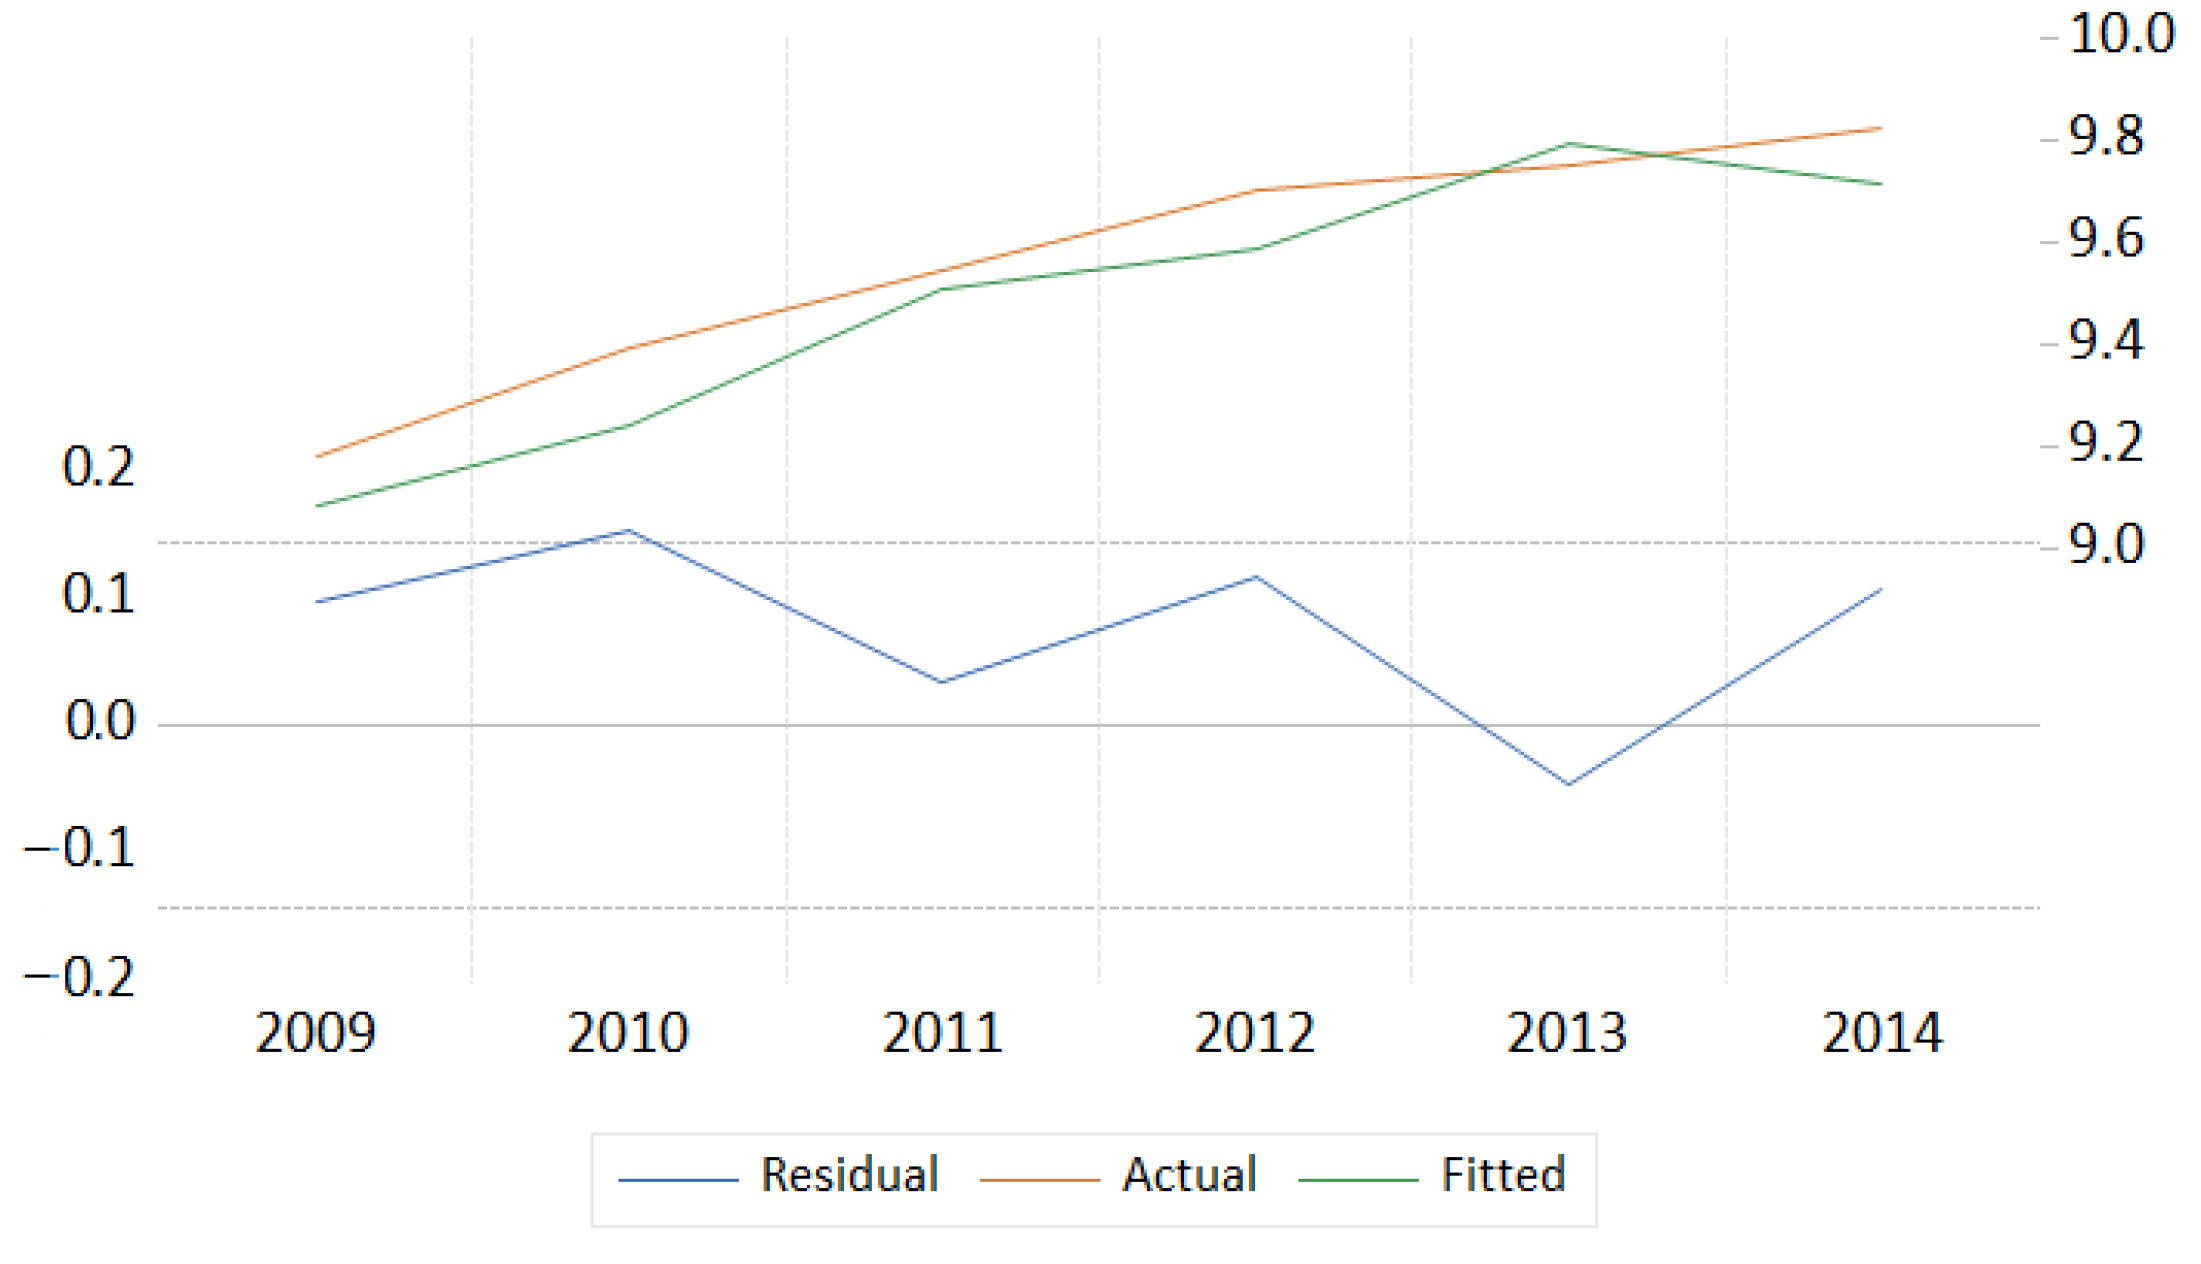
After data stabilization, we should estimate its best fit AR parameters and MA parameters according to its partial autocorrelation (PAC) function and autocorrelation (AC) function, respectively. Similarly, if the AC function of a stationary series died off smoothly at a geometric rate after one lag and the PAC declined geometrically, a first-order MA process would seem appropriate [69]. However, in the practical fitting process, we could choose any other AR/MA parameters. Figure 3 shows the AC and PAC of Cultivated land carrying capacity in Beijing. Possible suitable models are ARIAM(1,2,1), ARIAM(1,2,2), and ARIAM(2,2,1); the AIC of the three models are calculated by Eviews software according to the Akaike Information Criterion (AIC), and the model with the smallest AIC value should be chosen as the model we need. Therefore, we chose the ARIAM(2,2,1) model (Table 4).

3.4.3. Model Fit

After determining the parameters, the residual series white noise test of the model should be carried out. If it is not a white noise sequence, it means that the residual sequence still has some useful information that has not been extracted, which requires further improvement of the model. We can test whether the residual is a white noise sequence by making an autocorrelation-partial autocorrelation analysis figure of the residual sequence. Figure 4 shows the AC and PAC of ARIAM(2,2,1); the AC and PAC are in the confidence interval, and there is no autocorrelation in the residual series, which is a white noise process. Therefore, the model fitting was successful. The model fitting graph is shown in Figure 5. We used the same method to determine the model of cultivated land carrying capacity, construction land carrying capacity, and ecological land carrying capacity in 31 provinces of China.

3.4.4. Accuracy Verification of Model Prediction Result

To verify the accuracy of the prediction results, the feasibility of the ARIMA model applied to the prediction and simulation of land resources’ carrying capacity was discussed. We divided the data into the experimental group (2009–2015) and the test group (2016). First, we put the data of the experimental group into the ARIMA model of 31 provinces in China and calculated the mean relative error between the actual value and the fitted value. The results are shown in Table 5.
As can be seen from Table 5, the mean relative errors of cultivated land carrying capacity, construction land carrying capacity, and ecological land carrying capacity in 31 provinces of China were 0.00–0.12%, 0.00–3.26%, and 0.00–0.34%. The errors were small, the fitting was satisfactory, and the model was applicable. We further analyzed the relative error between the actual value and the predicted value in the test group, and the results are shown in Table 6.
It can be seen from Table 6 that the mean relative error ranges of the actual and predicted values of the 31 provinces in China were 0.00–1.21%, 0.02–6.74%, and 0.00–0.52%. Combining the experimental group and the test group, the results showed that the error between fitting and prediction was small, the fitting effect was better, and the model was suitable and supported the prediction of carrying capacity indicators.
We calculate the predicted values of various indicators in 2020 and 2025 based on the models of each province, standardized the predicted values, and used Formula (5) to calculate the predicted value of the comprehensive land carrying capacity index. In order to more clearly reflect the temporal and spatial changes of China’s 31 provinces, we used the same classification method to divide them into six levels (Figure 6).
It can be seen from Figure 6 that in the future, the comprehensive carrying capacity index of land resources in 31 provinces of China will be on the rise, and the carrying capacity index will still be higher in the east and lower in the west. By comparing the comprehensive carrying capacity indexes of 2016, 2020, and 2025, it was found that most regions maintain the current carrying capacity status, the carrying pressure of Sichuan and Jiangxi decreased, and the carrying pressure of Henan, Anhui, Jiangxi, and Guangxi increased.

4. Discussion

In recent years, more and more attention has been paid to the question of whether land resources can carry the future population. As an answer to this question, research on the carrying capacity of land resources has also taken place [70]. Land resource carrying capacity is an important factor for sustainable development. It provides essential insights into land resource allocation and management [71]. The carrying capacity of land resources has changed from the simple man-grain relationship to the more complex relationship between social-economic activities and land resources. The corresponding research methods have also evolved, from static research to dynamic research, and the evaluation factors have also evolved from a single factor to a comprehensive index system [25]. This paper did not use too many socio-economic indicators to calculate the carrying capacity of land resources, but used the most basic concept of how many people can be supported by land resources. Most of the previous studies are based on the man-grain relationship carrying capacity of land resources [25,72]. In this paper, this method was extended to construction land and ecological land, that is, according to the individual needs of construction land and ecological land, the population that can be carried by construction land or ecological land was calculated. The results are representative and can reflect the carrying capacity of land resources. In calculating the comprehensive carrying capacity of land resources through the coefficient of variation weight method to determine the index weight, there is a certain objectivity; in the future, the subjective and objective combination weight method can be used.
The results of land resources’ carrying capacity in this paper are basically consistent with the results of Xiaoxuan Wei et al.’s [28] research on China’s carrying capacity. Overall, it showed a spatial pattern of high pressure in the east and low pressure in the west. However, the index of land carrying capacity in the western region has increased rapidly, which is different from this paper. This is mainly due to the different emphasis of the two articles. Xiaoxuan Wei’s article added socio-economic indicators, i.e., the rapid growth of land carrying capacity in the western region is due to the improvement of land use efficiency during this period, and this article is essentially the calculation of population carrying capacity. Population is the primary limiting factor of land resources, which plays an important role in the evaluation of land carrying capacity. Especially in countries with a large population, we should pay more attention to the population carrying capacity of the land so as to improve the scientific basis for the evaluation of land resources’ carrying capacity [25].
Based on the analysis of land resources’ carrying capacity, it was found that the land resources’ carrying capacity of 31 provinces in China have significant spatial differences. Based on the analysis of land resources’ carrying capacity, it was found that the land resources’ carrying capacity of 31 provinces in China have significant spatial differences. Therefore, it is necessary to make rational use and optimal allocation of land resources according to the relevant requirements of national spatial planning. Firstly, the government can encourage the development and utilization of underground space to further improve the carrying capacity of urban land [63]. At present, land resources are mainly used for urban construction and development; how to make full use of land resources becomes very critical, and through the transfer of industrial land in the central urban area, we can reduce the pressure in the central urban area and improve the utilization of land resources. Secondly, we should strengthen the protection of the ecological environment. The comprehensive carrying capacity of land resources includes both population factors and ecological environment factors. Environmental problems can not only affect economic development, but also affect human survival. Therefore, while developing the economy, we need to strengthen the protection of the ecological environment, change the mode of the economic development, and pay attention to the management and protection of ecological environment. Thirdly, we should adjust measures to local conditions and promote coordinated regional development. Due to the differences of land resources’ carrying capacity among 31 provinces in China, green industries such as eco-tourism should be vigorously developed in high-pressure areas to give full play to the ecological conservation function of land. For low-pressure areas, we need to strengthen the constraints of the resources and environment, and vigorously develop strategic emerging industries. At the same time, we should strengthen the exchange and cooperation of technology and funds among regions to improve the comprehensive carrying capacity of land resources. In addition, this paper constructed the ARIMA model to predict the carrying capacity of land resources in 31 provinces of China; the errors were small, and the fitting was satisfactory, which also verified that the ARIMA model is feasible for the prediction of land resources’ carrying capacity. However, the ARIMA model also has certain limitations. It is a mathematical model built on past historical data. Therefore, ARIMA model is only suitable for short-term forecasting. If the forecasting time is too long, it will increase the forecasting error and affect the forecasting accuracy [73,74]. With rapid economic development and urbanization, the intensity of land development is increasing, leading to the deterioration of the ecological environment. It is of great significance to analyze the carrying capacity and spatiotemporal differentiation of land resources to solve the problems such as unreasonable use of land resources and ecological damage. Based on the land resource data and population data from 2009 to 2016, we analyzed the spatial and temporal changes and regional differences of the land resource carrying capacity in 31 provinces of China and made predictions in order to provide a reference for the sustainable use of land resources and the construction of ecological civilization in China and other countries. There are many internal influencing factors of land resource carrying capacity, and the internal relationship of the system is complicated, so the analysis process of this study was not accurate enough: First of all, due to the impact of data availability, the selection of indicators and the construction of evaluation system were not fully carried out, so there are certain limitations in the study of the comprehensive carrying capacity of land resources. Moreover, evaluation techniques still need to be improved. In future research, it will be necessary to improve the evaluation index system to make the results more accurate. A variety of methods should be used to evaluate, perform comparative analysis of the evaluation results, and to make the evaluation results more comprehensive.

5. Conclusions

This paper took 31 provinces of China as the research object, intervened in the perspective of time and space, combined with the spatial analysis method, visualized the characteristics of the time and space pattern of the land resource carrying capacity of 31 provinces in China, and drew the following conclusions:
(1) According to the results of single-factor carrying capacity evaluation, although China’s cultivated land carrying capacity and construction land carrying capacity show that they can meet the needs of people’s daily production and life, their spatial differences are significant; however, China’s ecological land carrying capacity index is large, can no longer meet the needs of the people, and most areas have poor ecological carrying capacity, which is seriously affected by human activities. According to the calculation results of the coefficient of variation weight method, we found that ecological land accounts for the largest proportion of the three types of land. Therefore, it is necessary to strengthen the optimal allocation of land resources and construct a regional ecological security pattern.
(2) According to the evaluation results of the comprehensive carrying capacity of land resources, the comprehensive carrying capacity index of land resources in China’s provinces is between 0.0064–0.6084 (except Shanghai), and the carrying capacity index of Shanghai has always been seriously overloaded. As China’s economic capital and the world’s financial center, Shanghai is an area with a concentration of population and resources. It attracts a large number of people to move to Shanghai every year. As a result, Shanghai’s overpopulation has exceeded the scope of land carrying capacity and restricts the rational use of land resources.
(3) The comprehensive carrying pressure of land resources in China’s 31 provinces has obvious spatial differentiation, and the overall pressure is rising from west to east. The pressure in economically developed areas is higher than that in underdeveloped areas. This is mainly due to the faster economic development speed. The demand for land resources is increasing, and the contradiction between the two is becoming more and more obvious; at the same time, the neglect of long-term scientific planning and the lack of necessary environmental protection elements input eventually cause the pressure on land resources to exceed the limit. We should rationally use and optimize the allocation of land resources according to the relevant requirements of territorial spatial planning. In areas where land is under great pressure, we should control the development of construction land and strengthen the protection of the ecological environment on the basis of protecting cultivated land and ensuring the safety of food production. For areas with medium pressure on land, the regional advantages can be fully utilized to develop appropriate construction areas without damaging agricultural land and ecological land. For areas with less pressure on land, the development of construction land should be prioritized in the process of promoting social and economic development according to the actual situation of the region.
(4) This paper established a prediction model for the land resource carrying capacity of 31 provinces in China, verified the rationality and reliability of the model, made a reasonable prediction of the comprehensive carrying capacity of land resources of 31 provinces in 2020 and 2025, and found that the index of the comprehensive carrying capacity of land resources of 31 provinces in China is still on the rise.

Supplementary Materials

The following are available online at https://www.mdpi.com/article/10.3390/su132313383/s1.

Author Contributions

Methodology, C.H., B.L. and J.Z.; software, C.H.; writing, C.H. All authors have read and agreed to the published version of the manuscript.

Funding

This research was funded by The National Natural Science Foundation of China (NO. 41461035; 42071368) and The Third Comprehensive Scientific Investigation in Xinjiang (NO.SQ2021XJKK02400-1).

Institutional Review Board Statement

Not applicable.

Informed Consent Statement

Not applicable.

Data Availability Statement

The land resource data comes from the Ministry of Natural Resources of the People’s Republic of China, the population data of 31 provinces are derived from China Statistical Yearbook.

Conflicts of Interest

The authors declare no conflict of interest.

References

  1. Liang, L.; Yong, Y.; Yuan, C. Measurement of Urban Land Green Use Efficiency and Its Spatial Differentiation Characteristics: An Empirical Study Based on 284 Cities. China Land Sci. 2019, 33, 80–87. [Google Scholar]
  2. Wu, C.; Wei, Y.D.; Huang, X.; Chen, B. Economic Transition, Spatial Development and Urban Land Use Efficiency in the Yangtze River Delta, China—Science Direct. Habitat Int. 2017, 63, 67–78. [Google Scholar] [CrossRef]
  3. Hobbs, R. Future Landscapes and the Future of Landscape Ecology. Landsc. Urban Plan. 1997, 37, 1–9. [Google Scholar] [CrossRef]
  4. Guastella, G.; Pareglio, S.; Sckokai, P. A Spatial Econometric Analysis of Land Use Efficiency in Large and Small Municipalities. Land Use Policy 2017, 63, 288–297. [Google Scholar] [CrossRef] [Green Version]
  5. Yuan, Y.; Chen, D.; Wu, S.; Mo, L.; Tong, G.; Yan, D. Urban Sprawl Decreases the Value of Ecosystem Services and Intensifies the Supply Scarcity of Ecosystem Services in China. Sci. Total. Environ. 2019, 697, 134170. [Google Scholar] [CrossRef]
  6. Cui, G.; Zhang, X.; Zhang, Z.; Cao, Y.; Liu, X. Comprehensive Land Carrying Capacities of the Cities in the Shandong Peninsula Blue Economic Zone and Their Spatio-Temporal Variations. Sustainability 2019, 11, 439. [Google Scholar] [CrossRef] [Green Version]
  7. Xue, Q.; Yang, X.; Wu, F. A Three-Stage Hybrid Model for the Regional Assessment, Spatial Pattern Analysis and Source Apportionment of the Land Resources Comprehensive Supporting Capacity in the Yangtze River Delta Urban Agglomeration. Sci. Total. Environ. 2020, 711, 134428. [Google Scholar] [CrossRef]
  8. Feng, Z.; Sun, T.; Yang, Y.; Yan, H. The Progress of Resources and Environment Carrying Capacity: From Single-Factor Carrying Capacity Research to Comprehensive Research. J. Resour. Ecol. 2018, 9, 125–134. [Google Scholar] [CrossRef]
  9. Lane, M. The Carrying Capacity Imperative: Assessing Regional Carrying Capacity Methodologies for Sustainable Land-Use Planning. Land Use Policy 2010, 27, 1038–1045. [Google Scholar] [CrossRef] [Green Version]
  10. Hua, J.; Xiaohua, T.; Liya, Y.; Zhixiong, L.I.U.; Ningtao, W.; Lei, L.I.U. Suitability evaluation of land space development based on land resources: A case study of Yichang City in Hubei Province. Geol. China 2020, 47, 1776–1792. [Google Scholar] [CrossRef]
  11. Liu, Y.; Zhou, Y. Territory Spatial Planning and National Governance System in China. Land Use Policy 2021, 102, 105288. [Google Scholar] [CrossRef]
  12. Zhang, C.; Liu, W.; Luo, Y. Current Situation, Problems and Reflections on Sustainable Development and Utilization of Land Resources in China. In Proceedings of the Advances in Education and Management, Dalian, China, 6–7 August 2011; Zhou, M., Ed.; Springer: Berlin/Heidelberg, Germany, 2011; pp. 99–107. [Google Scholar]
  13. Peng, J.; Du, Y.; Liu, Y.; Hu, X. How to Assess Urban Development Potential in Mountain Areas? An Approach of Ecological Carrying Capacity in the View of Coupled Human and Natural Systems. Ecol. Indic. 2016, 60, 1017–1030. [Google Scholar] [CrossRef]
  14. Yang, J.; Ding, H.A. Quantitative Assessment of Sustainable Development Based on Relative Resource Carrying Capacity in Jiangsu Province of China. Int. J. Environ. Res. Public Health 2018, 15, 2786. [Google Scholar] [CrossRef] [PubMed] [Green Version]
  15. Wang, T.; Xu, S. Dynamic Successive Assessment Method of Water Environment Carrying Capacity and Its Application. Ecol. Indic. 2015, 52, 134–146. [Google Scholar] [CrossRef]
  16. Zhang, M.; Liu, Y.; Wu, J.; Wang, T. Index System of Urban Resource and Environment Carrying Capacity Based on Ecological Civilization. Environ. Impact Assess. Rev. 2018, 68, 90–97. [Google Scholar] [CrossRef]
  17. Dan-Lin, Y.U.; Mao, H.Y. Regional Carrying Capacity: Case Studies of Bohai Rim Area. J. Geogr. Sci. 2002, 12, 54–62. [Google Scholar] [CrossRef]
  18. Hong, W.; Li, F.; Li, M.; Zhang, F.; Tong, L.; Huang, Q. Toward a Sustainable Utilization of Land Resources in China: Problems, Policies, and Practices. Ambio 2014, 43, 825–835. [Google Scholar] [CrossRef] [PubMed] [Green Version]
  19. Harmonious Coexistence Between Humans and Nature Must Be Promoted SpringerLink. Available online: https://link.springer.com/chapter/10.1007/978-981-16-4534-1_4 (accessed on 27 October 2021).
  20. Rees, W.E. Revisiting Carrying Capacity: Area-Based Indicators of Sustainability. Popul. Environ. 1996, 17, 195–215. [Google Scholar] [CrossRef]
  21. Alberti, M. Urban Patterns and Environmental Performance: What Do We Know? 1999. Available online: https://journals.sagepub.com/doi/abs/10.1177/0739456X9901900205 (accessed on 26 October 2021).
  22. Anderies, J.M.; Mathias, J.-D.; Janssen, M.A. Knowledge Infrastructure and Safe Operating Spaces in Social–Ecological Systems. Proc. Natl. Acad. Sci. USA 2019, 116, 5277–5284. [Google Scholar] [CrossRef] [Green Version]
  23. Sayre, N.F. The Genesis, History, and Limits of Carrying Capacity. Ann. Assoc. Am. Geogr. 2008, 98, 120–134. [Google Scholar] [CrossRef]
  24. Barrett, G.W.; Odum, E.R. The Twenty-First Century: The World at Carrying Capacity. BioScience 2000, 50, 363–368. [Google Scholar] [CrossRef] [Green Version]
  25. Tong, S.; Feng, Z.; Yang, Y.; Lin, Y.; Wu, Y. Research on Land Resource Carrying Capacity: Progress and Prospects. J. Resour. Ecol. 2018, 9, 331–340. [Google Scholar] [CrossRef]
  26. Zhu, N.; Cao, B.; Qin, F. Analysis of Land Carrying Capacity of Livestock and Poultry Breeding in China from the Perspective of Combination of Planting and Raising. IOP Conf. Ser. Earth Environ. Sci. 2020, 585, 012085. [Google Scholar] [CrossRef]
  27. Sun, M.; Wang, J.; He, K. Analysis on the Urban Land Resources Carrying Capacity during Urbanization—A Case Study of Chinese YRD. Appl. Geogr. 2020, 116, 102170. [Google Scholar] [CrossRef]
  28. Wei, X.; Shen, L.; Liu, Z.; Luo, L.; Chen, Y. Comparative Analysis on the Evolution of Ecological Carrying Capacity between Provinces during Urbanization Process in China. Ecol. Indic. 2020, 112, 106179. [Google Scholar] [CrossRef]
  29. Chen, J.; Zhang, H.; Zhou, P. Evaluation of Land Carrying Capacity of Island Cities: Based on the Modified Ecological Footprint Model. In Proceedings of the 20th International Symposium on Advancement of Construction Management and Real Estate, Singapore, 28 May 2016; Wu, Y., Zheng, S., Luo, J., Wang, W., Mo, Z., Shan, L., Eds.; Springer: Singapore, 2017; pp. 181–190. [Google Scholar]
  30. Johnson, S.; Wang, G.; Howard, H.; Anderson, A.B. Identification of Superfluous Roads in Terms of Sustainable Military Land Carrying Capacity and Environment. J. Terramechanics 2011, 48, 97–104. [Google Scholar] [CrossRef]
  31. Li, Z.-T.; Li, M.; Xia, B.-C. Spatio-Temporal Dynamics of Ecological Security Pattern of the Pearl River Delta Urban Agglomeration Based on LUCC Simulation. Ecol. Indic. 2020, 114, 106319. [Google Scholar] [CrossRef]
  32. Zhou, W.; Elshkaki, A.; Zhong, S.; Shen, L. Study on Relative Carrying Capacity of Land Resources and Its Zoning in 31 Provinces of China. Sustainability 2021, 13, 1459. [Google Scholar] [CrossRef]
  33. Sugiyarto, S.; Hariono, B.; Wijaya, R.; Destarianto, P.; Novawan, A. The Impact of Land Use Changes on Carrying Capacity of Sampean Watershed in Bondowoso Regency. IOP Conf. Series Earth Environ. Sci. 2018, 207, 012005. [Google Scholar] [CrossRef]
  34. Nakajima, E.S.; Ortega, E. Carrying Capacity Using Emergy and a New Calculation of the Ecological Footprint. Ecol. Indic. 2016, 60, 1200–1207. [Google Scholar] [CrossRef]
  35. Peng, W.; Wang, X.; Li, X.; He, C. Sustainability Evaluation Based on the Emergy Ecological Footprint Method: A Case Study of Qingdao, China, from 2004 to 2014. Ecol. Indic. 2018, 85, 1249–1261. [Google Scholar] [CrossRef]
  36. Tsou, J.; Gao, Y.; Zhang, Y.; Genyun, S.; Ren, J.; Li, Y. Evaluating Urban Land Carrying Capacity Based on the Ecological Sensitivity Analysis: A Case Study in Hangzhou, China. Remote Sens. 2017, 9, 529. [Google Scholar] [CrossRef] [Green Version]
  37. Thapa, G.B.; Paudel, G.S. Evaluation of the Livestock Carrying Capacity of Land Resources in the Hills of Nepal Based on Total Digestive Nutrient Analysis. Agric. Ecosyst. Environ. 2000, 78, 223–235. [Google Scholar] [CrossRef]
  38. Liao, J.; Shao, G.; Wang, C.; Tang, L.; Qiu, Q. Urban Sprawl Scenario Simulations Based on Cellular Automata and Ordered Weighted Averaging Ecological Constraints. Ecol. Indic. 2019, 107, 105572. [Google Scholar] [CrossRef]
  39. Fu, Q.; Jiang, Q.; Wang, Z. Comprehensive Evaluation of Regional Agricultural Water and Land Resources Carrying Capacity Based on DPSIR Concept Framework and PP Model. In Proceedings of the Computer and Computing Technologies in Agriculture, Beijing, China, 18–20 October 2008; Li, D., Chen, Y., Eds.; Springer: Berlin/Heidelberg, Germany, 2012; pp. 391–398. [Google Scholar]
  40. Meyar-Naimi, H.; Vaez-Zadeh, S. Sustainable Development Based Energy Policy Making Frameworks, a Critical Review. Energy Policy 2012, 43, 351–361. [Google Scholar] [CrossRef]
  41. China Statistical Yearbook. Annual Data. 2018. Available online: http://www.stats.gov.cn/ (accessed on 22 October 2021).
  42. Ministry of Natural Resources of the People’s Republic of China. 2019. Available online: http://tddc.mnr.gov.cn/ (accessed on 12 November 2021).
  43. Xie, X.; Li, X.; He, W. A Land Space Development Zoning Method Based on Resource–Environmental Carrying Capacity: A Case Study of Henan, China. Int. J. Environ. Res. Public Health 2020, 17, 900. [Google Scholar] [CrossRef] [Green Version]
  44. Zhao, C.; Zhou, Y.; Li, X.; Xiao, P.; Jiang, J. Assessment of Cultivated Land Productivity and Its Spatial Differentiation in Dongting Lake Region: A Case Study of Yuanjiang City, Hunan Province. Sustainability 2018, 10, 3616. [Google Scholar] [CrossRef] [Green Version]
  45. He, R.; Liu, S.; Liu, Y. Application of SD Model in Analyzing the Cultivated Land Carrying Capacity: A Case Study in Bijie Prefecture, Guizho Province, China. Procedia Environ. Sci. 2011, 10, 1985–1991. [Google Scholar] [CrossRef] [Green Version]
  46. Zhang, F.; Wang, Y.; Ma, X.; Wang, Y.; Yang, G.; Zhu, L. Evaluation of Resources and Environmental Carrying Capacity of 36 Large Cities in China Based on a Support-Pressure Coupling Mechanism. Sci. Total Environ. 2019, 688, 838–854. [Google Scholar] [CrossRef] [PubMed]
  47. Shi, Y.; Wang, H.; Yin, C. Evaluation Method of Urban Land Population Carrying Capacity Based on GIS—A Case of Shanghai, China. Comput. Environ. Urban Syst. 2013, 39, 27–38. [Google Scholar] [CrossRef]
  48. Guanghua, Y.U.; Sun, C. Land Carrying Capacity Spatiotemporal Differentiation in the Bohai Sea Coastal Areas. Acta Ecol. Sin. 2015, 35, 60–70. [Google Scholar]
  49. Peng, B.; Wang, Y.; Elahi, E.; Guo, W. Evaluation and Prediction of the Ecological Footprint and Ecological Carrying Capacity for Yangtze River Urban Agglomeration Based on the Grey Model. Int. J. Environ. Res. Public Health 2018, 15, 2543. [Google Scholar] [CrossRef] [Green Version]
  50. Wanishsakpong, W.; Owusu, B.E. Optimal Time Series Model for Forecasting Monthly Temperature in the Southwestern Region of Thailand. Model. Earth Syst. Environ. 2020, 6, 525–532. [Google Scholar] [CrossRef]
  51. Kleiner, B. Time Series Analysis: Forecasting and Control. Technometrics 1977, 19, 343–344. [Google Scholar] [CrossRef]
  52. Natsagdorj, E.; Renchin, T.; Maeyer, P.D.; Darkhijav, B. Spatial Distribution of Soil Moisture in Mongolia Using SMAP and MODIS Satellite Data: A Time Series Model (2010–2025). Remote Sens. 2021, 13, 347. [Google Scholar] [CrossRef]
  53. Valipour, M.; Banihabib, M.E.; Behbahani, S.M.R. Comparison of the ARMA, ARIMA, and the Autoregressive Artificial Neural Network Models in Forecasting the Monthly Inflow of Dez Dam Reservoir. J. Hydrol. 2013, 476, 433–441. [Google Scholar] [CrossRef]
  54. Khashei, M.; Bijari, M. A Novel Hybridization of Artificial Neural Networks and ARIMA Models for Time Series Forecasting. Appl. Soft. Comput. 2011, 11, 2664–2675. [Google Scholar] [CrossRef]
  55. Liu, L.; Zhang, Y.; Chen, C.; Hu, Y.; Liu, C.; Chen, J. Is the Spatial-Temporal Dependence Model Reliable for the Short-Term Freight Volume Forecast of Inland Ports? A Case Study of the Yangtze River, China. J. Mar. Sci. Eng. 2021, 9, 985. [Google Scholar] [CrossRef]
  56. Dickey, D.A.; Fuller, W.A. Distribution of the Estimators for Autoregressive Time Series with a Unit Root. J. Am. Stat. Assoc. 1979, 74, 427–431. [Google Scholar] [CrossRef]
  57. MacKinnon, J.G. Approximate Asymptotic Distribution Functions for Unit-Root and Cointegration Tests. J. Bus. Econ. Stat. 1994, 12, 167–176. [Google Scholar] [CrossRef]
  58. Chen, P.; Pedersen, T.; Bak-Jensen, B.; Chen, Z. ARIMA-Based Time Series Model of Stochastic Wind Power Generation. IEEE Trans. Power Syst. 2010, 25, 667–676. [Google Scholar] [CrossRef] [Green Version]
  59. Akaike, H. A New Look at the Statistical Model Identification. IEEE Trans. Autom. Control. 1974, 19, 716–723. [Google Scholar] [CrossRef]
  60. Zou, Z.; Wu, X.; Zhao, Z.; Wang, Q.; Bie, Y.; Zhou, M. Prediction of Short Term Electric Load Based on BP Neural Networks Amp; ARIMA Combination. In Proceedings of the 2018 IEEE 4th Information Technology and Mechatronics Engineering Conference (ITOEC), Chongqing, China, 14–16 December 2018; pp. 1671–1674. [Google Scholar]
  61. Assous, H.F.; Al-Rousan, N.; Al-Najjar, D.; Al-Najjar, H. Can International Market Indices Estimate TASI’s Movements? The ARIMA Model. J. Open Innov. Technol. Market. Complex. 2020, 6, 27. [Google Scholar] [CrossRef] [Green Version]
  62. Nanfang, L.I.; Chen, H.; Feifei, H.U.; Yang, B. An Analysis on the Impact of Expressway Construction Supported by 3S Technology on Landscape Patterns: A Case Study of Changsha-Yiyang Highway in Hunan Province. J. Hunan Univ. Technol. 2018, 32, 91–96. [Google Scholar]
  63. Luo, W.; Ren, Y.; Shen, L.; Zhu, M.; Zhang, P. An Evolution Perspective on the Urban Land Carrying Capacity in the Urbanization Era of China. Sci. Total Environ. 2020, 744, 140827. [Google Scholar] [CrossRef] [PubMed]
  64. Niu, F.; Yang, X.; Zhang, X. Application of an Evaluation Method of Resource and Environment Carrying Capacity in the Adjustment of Industrial Structure in Tibet. J. Geogr. Sci. 2020, 30, 319–332. [Google Scholar] [CrossRef]
  65. Li, Y.; Zhan, J.; Liu, Y.; Zhang, F.; Zhang, M. Response of Ecosystem Services to Land Use and Cover Change: A Case Study in Chengdu City. Resour. Conserv. Recycl. 2017, 132, 291–300. [Google Scholar] [CrossRef]
  66. Li, K.; Jin, X.; Ma, D.; Jiang, P. Evaluation of Resource and Environmental Carrying Capacity of China’s Rapid-Urbanization Areas—A Case Study of Xinbei District, Changzhou. Land 2019, 8, 69. [Google Scholar] [CrossRef] [Green Version]
  67. Meng, M.; Xiu-Xia, L.I.; Meng, X.J. Evaluation and Forecast of Comprehensive Carrying Capacity of Natural Resources in Siping City. Shanghai Land Resour. 2017, 38, 74–78. [Google Scholar]
  68. Zhang, X.J.; Zhou, Q.G. Evaluation and Prediction on Land Carrying Capacity Based on Entropy-Weight TOPSIS and Grey Model—Taking Three Gorges Reservoir Area as an Example. Resour. Dev. Market 2017, 33, 666–671. [Google Scholar]
  69. Ediger, V.S.; Akar, S.; Ugurlu, B. Forecasting Production of Fossil Fuel Sources in Turkey Using a Comparative Regression and ARIMA Model. Energy Policy 2006, 34, 3836–3846. [Google Scholar] [CrossRef]
  70. Shi, Y.; Shi, S.; Wang, H. Reconsideration of the Methodology for Estimation of Land Population Carrying Capacity in Shanghai Metropolis. Sci. Total Environ. 2018, 652, 367–381. [Google Scholar] [CrossRef] [PubMed]
  71. Yang, N.; Li, J.; Lu, B.; Luo, M.; Li, L. Exploring the Spatial Pattern and Influencing Factors of Land Carrying Capacity in Wuhan. Sustainability 2020, 11, 2786. [Google Scholar] [CrossRef] [Green Version]
  72. Zhang, P. Estimation of Population Carrying Capacity of Land Resources: A Case Study of Chongqing. In Proceedings of the 24th International Symposium on Advancement of Construction Management and Real Estate, Singapore, 8 June 2021; Springer: Singapore, 2021; pp. 355–364. [Google Scholar]
  73. Nie, H.; Liu, G.; Liu, X.; Wang, Y. Hybrid of ARIMA and SVMs for Short-Term Load Forecasting. Energy Procedia 2012, 16, 1455–1460. [Google Scholar] [CrossRef] [Green Version]
  74. Nyoni, T. ARIMA Modeling and Forecasting of Consumer Price Index (CPI) in Germany. Available online: https://mpra.ub.uni-muenchen.de/92442/ (accessed on 16 November 2021).
Figure 1. (a) The carrying capacity of cultivated land; (b) the carrying capacity of construction land; (c) the carrying capacity of ecological land.
Sustainability 13 13383 g001
Figure 2. The spatial distribution of land resources’ carrying capacity evaluation results in 31 provinces of China.
Sustainability 13 13383 g002
Figure 3. The AC and PAC of cultivated land carrying capacity in Beijing.
Sustainability 13 13383 g003
Figure 4. The AC and PAC of ARIAM(2,2,1).
Sustainability 13 13383 g004
Figure 5. Model fitting graph.
Sustainability 13 13383 g005
Figure 6. Prediction of land comprehensive carrying capacity in 31 provinces of China.
Sustainability 13 13383 g006
Table 1. Index system of the land resources’ carrying capacity and weight.
Index System of the Carrying CapacityIndex Index FactorDescriptionWeight
Comprehensive carrying capacity of land resourcesThe carrying capacity of cultivated landpopulation scaleScale of population gathering0.3122
Per capita grain outputScale of land production
Per capita cultivated areaSupport of regional land for industrial development
The carrying capacity of construction landArea of existing construction landDevelopment of construction land0.3033
Per capita construction land areaThe degree of land construction and the scale of residential space
The carrying capacity of ecological landExisting ecological land areaDirect reflection of ecological environment quality0.3845
Per capita ecological land areaQuality of the living environment
Table 2. Comprehensive carrying capacity index of land resources in 31 provinces of China from 2009 to 2016.
Province20092010201120122013201420152016
Beijing0.54970.55790.56520.57310.57660.58610.59680.6084
Shanghai1.00001.00001.00001.00001.00001.00001.00001.0000
Anhui0.16260.14930.14670.14510.14450.14490.14710.1928
Fujian0.27420.26090.25560.25210.24710.24590.24750.2704
Guangdong0.36360.35630.34930.34690.34120.33970.34390.3668
Gansu0.08400.08060.07870.07760.07530.07410.07370.0880
Guangxi0.19090.16930.16750.16640.16450.16410.16520.1956
Guizhou0.26010.24100.22930.22060.2140.20530.20350.2166
Hainan0.15730.15050.14770.14710.14570.14580.14680.1765
Hebei0.16420.16120.15920.15800.15670.15640.15700.1901
Henan0.24820.23430.22830.22480.22040.21870.21980.2516
Heilongjiang0.04050.03910.03880.03860.03860.03840.03740.0844
Hubei0.15870.15140.14910.14640.14400.14190.14270.1857
Hunan0.18950.18670.18430.18330.18140.18130.18310.2196
Jilin0.07660.07390.07250.07160.07050.07000.06990.1039
Jiangsu0.27810.26770.26320.25960.25640.25540.25660.3024
Jiangxi0.17340.16610.16310.16030.15780.15600.15590.1959
Liaoning0.12330.11820.11540.11350.11180.11100.11060.1437
Inner Mongolia0.01000.00920.00920.00910.00910.00870.00800.0487
Ningxia0.04720.0450.04440.04400.04380.04360.04330.0918
Qinghai0.06090.05830.05720.05590.05230.05350.05320.0440
Shandong0.28000.27160.26730.26390.26120.26100.26290.3033
Shanxi0.13490.13740.13650.13500.13300.13210.13310.1603
Shaanxi0.16750.15990.15710.15260.14980.14760.14790.1717
Sichuan0.20570.19080.18750.18510.18250.18080.18220.1985
Tianjin0.40370.41200.42350.43770.45180.46520.47770.5302
Tibet0.04680.04630.04670.04830.04880.04940.05010.0127
Yunnan0.16750.16160.15970.15810.15590.15470.15520.1622
Zhejiang0.28540.28100.27460.27000.26420.26080.26240.2813
Chongqing0.23380.22300.22090.21800.21580.21450.21590.2310
Xinjiang0.00660.00640.00640.00640.00640.00660.00700.0246
Table 3. Second-order difference unit root test results of cultivated land carrying capacity in Beijing.
t-StatisticProb.*
Augmented Dickey-Fuller test statistic −4.12440.0265
Test critical values:1% level−5.1198
5% level−3.5195
10% level−2.8984
Note: * is significant at the 0.05 level.
Table 4. Comparison of ARIMA models.
ModelAICR2
ARIAM(1,2,1)1.0600.950
ARIAM(1,2,2)0.4900.951
ARIAM(2,2,1)0.2400.954
Table 5. ARIMA model types and relative error Table of 31 provinces in China.
ProvinceThe Carrying Capacity of Cultivated Land Model TypeMean Relative ErrorThe Carrying Capacity of Construction Land Model TypeMean Relative ErrorThe Carrying Capacity of Ecological Land Model TypeMean Relative Error
BeijingARIAM(2,2,1)0.05%ARIAM(2,1,1)0.05%ARIAM(2,1,2)0.03%
ShanghaiARIAM(1,2,1)0.02%ARIAM(1,1,1)0.19%ARIAM(1,2,2)0.02%
AnhuiARIAM(1,1,2)0.00%ARIAM(2,1,2)0.11%ARIAM(2,1,1)0.04%
FujianARIAM(1,2,1)0.03%ARIAM(1,1,1)0.07%ARIAM(1,1,3)0.00%
GuangdongARIAM(1,1,2)0.02%ARIAM(1,2,1)0.00%ARIAM(2,1,1)0.26%
GansuARIAM(3,1,1)0.05%ARIAM(1,1,2)0.08%ARIAM(1,2,1)0.02%
GuangxiARIAM(1,2,1)0.01%ARIAM(1,1,2)0.19%ARIAM(1,1,2)0.02%
GuizhouARIAM(3,1,1)0.12%ARIAM(2,1,2)0.16%ARIAM(1,1,1)0.34%
HainanARIAM(1,2,1)0.06%ARIAM(1,1,3)0.20%ARIAM(1,2,1)0.04%
HebeiARIAM(2,1,2)0.00%ARIAM(1,2,1)0.11%ARIAM(1,1,1)0.24%
HenanARIAM(1,1,1)0.03%ARIAM(1,1,2)0.11%ARIAM(2,1,1)0.02%
HeilongjiangARIAM(3,1,1)0.02%ARIAM(1,1,2)0.04%ARIAM(1,1,1)0.00%
HubeiARIAM(1,1,2)0.02%ARIAM(1,1,2)0.62%ARIAM(1,1,1)0.00%
HunanARIAM(2,1,1)0.01%ARIAM(1,2,2)0.24%ARIAM(1,1,2)0.00%
JilinARIAM(1,1,1)0.01%ARIAM(2,1,1)0.10%ARIAM(1,1,2)0.00%
JiangsuARIAM(1,1,2)0.00%ARIAM(1,1,2)0.41%ARIAM(1,2,2)0.00%
JiangxiARIAM(1,1,1)0.01%ARIAM(1,1,2)0.35%ARIAM(1,1,1)0.00%
LiaoningARIAM(1,2,1)0.02%ARIAM(2,1,2)0.35%ARIAM(1,1,2)0.01%
Inner MongoliaARIAM(1,1,1)0.01%ARIAM(1,1,3)0.28%ARIAM(1,1,1)0.00%
NingxiaARIAM(2,1,1)0.00%ARIAM(1,1,2)0.51%ARIAM(1,1,1)0.01%
QinghaiARIAM(1,1,2)0.04%ARIAM(1,1,3)3.26%ARIAM(1,1,3)0.00%
ShandongARIAM(1,1,2)0.00%ARIAM(1,1,3)0.45%ARIAM(1,1,2)0.00%
ShanxiARIAM(1,1,1)0.00%ARIAM(2,1,1)0.32%ARIAM(1,1,3)0.00%
ShaanxiARIAM(1,1,2)0.00%ARIAM(1,3,1)0.14%ARIAM(2,2,1)0.04%
SichuanARIAM(1,1,1)0.00%ARIAM(2,1,1)0.03%ARIAM(1,1,2)0.01%
TianjinARIAM(1,1,3)0.01%ARIAM(1,1,2)0.33%ARIAM(1,2,1)0.00%
TibetARIAM(1,1,1)0.02%ARIAM(1,1,1)1.24%ARIAM(2,1,2)0.00%
YunnanARIAM(1,1,2)0.00%ARIAM(1,2,2)0.02%ARIAM(1,1,3)0.00%
ZhejiangARIAM(1,1,2)0.03%ARIAM(2,1,2)0.03%ARIAM(1,2,1)0.28%
ChongqingARIAM(1,2,1)0.00%ARIAM(3,1,1)0.15%ARIAM(2,2,1)0.00%
XinjiangARIAM(1,1,1)0.01%ARIAM(2,1,2)2.68%ARIAM(1,1,2)0.25%
Table 6. Mean relative error between actual value and fitting value in test group.
ProvinceThe Carrying Capacity of Cultivated Land Relative ErrorThe Carrying Capacity of Construction Land Relative ErrorThe Carrying Capacity of Ecological Land Relative Error
Beijing0.02%0.02%0.05%
Shanghai0.13%0.06%0.25%
Anhui0.69%1.23%0.06%
Fujian0.00%2.37%0.03%
Guangdong0.50%0.89%0.05%
Gansu0.02%0.38%0.06%
Guangxi1.21%0.21%0.12%
Guizhou0.15%0.68%0.05%
Hainan0.08%1.57%0.04%
Hebei0.18%0.21%0.52%
Henan0.24%0.29%0.09%
Heilongjiang0.04%1.56%0.06%
Hubei0.09%5.49%0.08%
Hunan0.26%2.89%0.28%
Jilin0.26%2.01%0.25%
Jiangsu0.12%5.42%0.04%
Jiangxi0.00%0.69%0.03%
Liaoning0.01%2.76%0.10%
Inner Mongolia0.06%1.87%0.00%
Ningxia0.04%6.01%0.08%
Qinghai0.03%2.21%0.02%
Shandong0.02%2.69%0.24%
Shanxi0.72%2.43%0.39%
Shaanxi0.06%0.55%0.00%
Sichuan0.47%0.47%0.42%
Tianjin0.33%5.01%0.06%
Tibet0.04%6.74%0.07%
Yunnan0.09%0.88%0.02%
Zhejiang0.68%1.36%0.48%
Chongqing0.23%0.60%0.10%
Xinjiang0.08%1.32%0.06%
Publisher’s Note: MDPI stays neutral with regard to jurisdictional claims in published maps and institutional affiliations.

